
Effects of Water Content and Mesh Size on Tea Bag Decomposition

1
Kyushu Research Center, Forestry and Forest Products Research Institute, FFPRI, Kurokami 4-11-16, Kumamoto 860-0862, Japan
2
Department of Forest Vegetation, Forestry and Forest Products Research Institute, FFPRI, Matsunosato 1, Tsukuba, Ibaraki 305-8687, Japan
3
Forest Ecology Lab., Graduate School of Agriculture, Kyoto University, Kitashirakawa Oiwake-cho Sakyo-ku, Kyoto 606-8502, Japan
*
Author to whom correspondence should be addressed.
Ecologies 2021, 2(1), 175-186; https://0-doi-org.brum.beds.ac.uk/10.3390/ecologies2010010
Submission received: 12 January 2021
/
Revised: 10 March 2021
/
Accepted: 16 March 2021
/
Published: 19 March 2021
Abstract
:The tea bag method provides a replicable and standardized method to study the effect of environmental variables on the decomposition of standard litter, which enables comparison of organic matter decomposition rates on a large scale. However, it remains uncertain whether tea bag decomposition in response to wetness is representative of that of local litters. We performed incubation experiments to examine whether the effect of soil water on tea bag decomposition becomes inhibitory at higher water contents, as is the case in local leaf litters. In addition, we performed field studies in a mixed forest and cedar plantation in Japan to compare two litter bag mesh sizes: 0.25-mm mesh, the size previously used by a major manufacturer of tea bags (Lipton), and nonwoven bags with mesh sizes finer than 0.25 mm, which are currently produced by Lipton. Both green tea and rooibos tea exhibited higher decomposition rates at higher water contents, but decomposition was inhibited at the highest water content; this was in contrast to our hypothesis based on a field observation but consistent with conceptual models of local litters. The nonwoven tea bags did not show lower decomposition rates, despite the finer mesh size. Rather, the nonwoven rooibos tea bags exhibited slightly higher decomposition rates than the 0.25-mm mesh bags in the cedar plantation, possibly due to a greater abundance of microorganisms that decompose litters in the nonwoven bags, due to the decrease in predation by mesofauna. Our findings provide essential information for future studies of tea bag decomposition.
1. Introduction
Recent anthropogenic activities have caused global issues such as climate change and nitrogen loading, which may have a considerable negative impact on biodiversity and ecosystem services. To understand the long-term impact of these global issues on ecosystems, it is essential to examine how environmental perturbation at a large scale affects litter decomposition rates, because decomposition is a basic ecosystem process required to sustain nutrient cycling. However, the commonly used litter bag method has difficulty in detecting the effects of environmental factors on decomposition at a large geographical scale because it is difficult to standardize litter quality, which is a primary factor controlling litter decomposition rates [1,2].
The tea bag method, introduced by Keuskamp et al. (2013) [3], provides standardized litter decomposition data due to uniformity of the litters and bags, which is necessary for large-scale analysis of the effects of environmental factors on decomposition rates. The tea bag method uses commercially available tetra-shaped tea bags of green tea (Camellia sinensis (L.) Kuntze) and rooibos tea (Aspalathus linearis (Burm. f.) R. Dahlgren), produced by Lipton, as a substitute for litters and soil organic matter. In the method, the amount of tea leaves decomposed during a 90-day incubation period is used to calculate the decomposition constant k and stabilization factor S (Tea Bag Index) [3]. Temporal variations in chemical composition during the decomposition process exhibited were typical of local leaf litters [4], indicating that tea bags can be representative of local litters. A large number of studies have used the tea bag method to assess decomposition potential [5,6,7,8,9,10].
However, it remains uncertain whether tea bag decomposition in response to wetness is representative of that of local litters. Generally, higher decomposition rates are observed in wetter conditions, but excess water inhibits decomposition: according to Prescott (2010), water contents higher than 80% (wet weight basis) suppresses litter decomposition rates. By contrast, a field experiment reported that tea bag decomposition was not suppressed, even at high water contents, based on comparison of tea bag decomposition data obtained from various study sites [6]. Tea leaves may have large water-leachable fractions, where the inhibitory impact of very high water content on litter decomposition may be negated by large leaching fractions under wetter conditions. If this is the case, tea bags should not be used to determine litter decomposition rates under high soil water contents. In field studies, however, other environmental factors covary with soil water content, so it remains unclear whether the effect of soil water on tea bag decomposition becomes inhibitory at higher water contents. In the present study, we performed laboratory incubation and leaching experiments to clarify the effect of water content on tea bag decomposition, and the potential contribution of leaching loss.
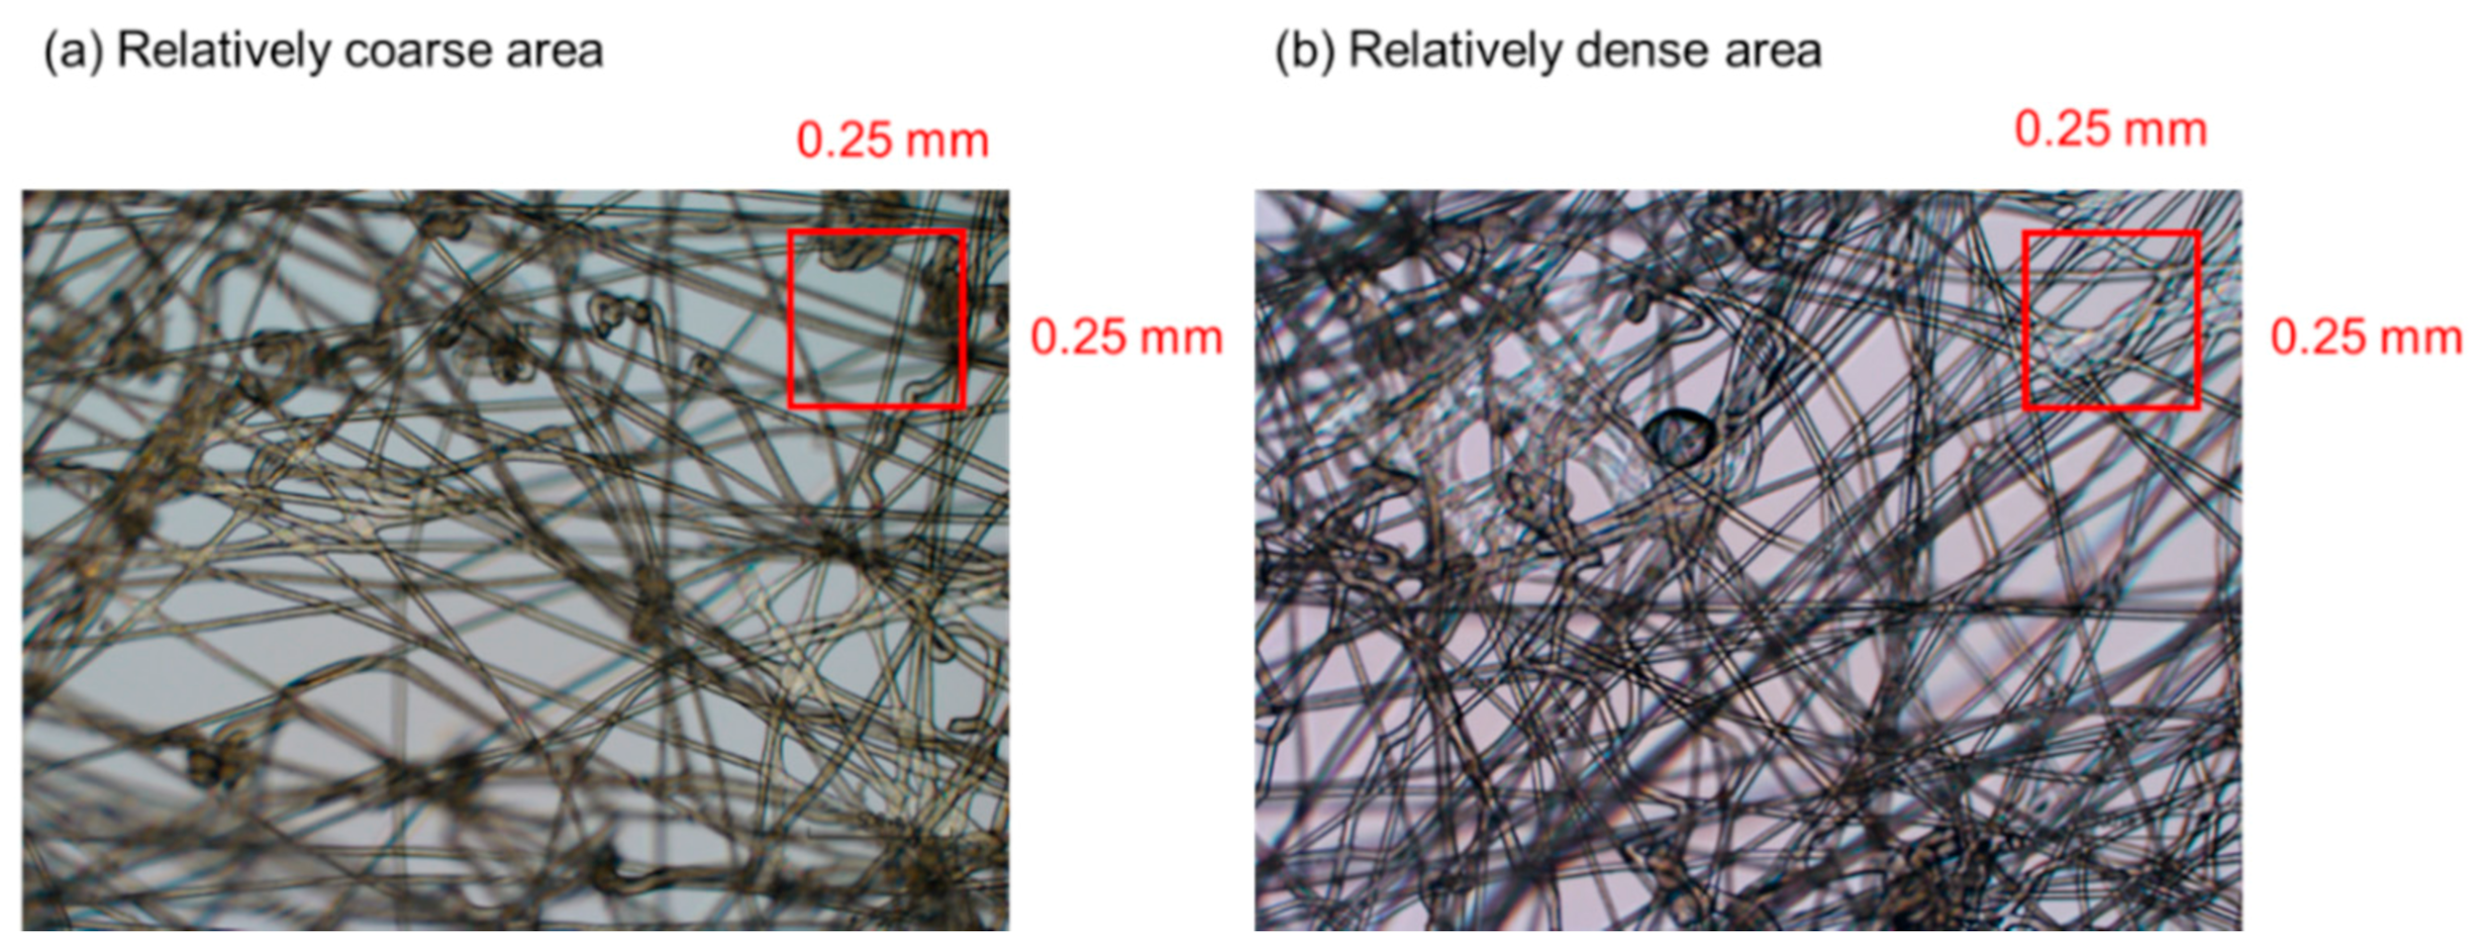
To utilize the tea bag method to test the impact of environmental changes on litter decomposition at a large scale, a practical issue must be resolved first. Lipton changed the mesh materials for its tea bags from woven nylon mesh (0.25 mm) to polypropylene nonwoven mesh (non-uniform size, but finer than 0.25 mm; see Figure A1) in 2017. Since the previously used woven bags are unavailable, future works should use the new nonwoven bags. However, we are uncertain whether the newly obtained data can be combined with previous data obtained using the 0.25-mm mesh bags. As mesh size generally affects the accessibility of decomposers and microclimate in litter bags [11,12], any change in mesh size of tea bags is likely to affect the decomposition rate. To date, no data have shown the impact of mesh size (0.25-mm mesh vs. nonwoven mesh) on tea bag decomposition. In the present study, we compared two types of tea bags with different mesh sizes, namely, 0.25-mm mesh bags and nonwoven bags with mesh sizes finer than 0.25 mm. We hypothesized that (i) the rooibos tea decomposition rate data obtained from the two types of bags would not be amenable to being combined, because the finer mesh size would lead to a lower decomposition rate of rooibos tea, as the finer mesh causes slower decomposition [11,12]. On the other hand, we hypothesized that (ii) the decomposition rate of green tea would not be affected by the difference in mesh size, because easily decomposable fractions of green tea are typically completely decomposed before the end of the 90-day incubation period [3] and recalcitrant fractions are not decomposed by microbes or mesofauna during the 90-day incubation [3], in which case impacts of mesh size are not apparent.
2. Materials and Methods
2.1. Study Sites
The experiments were performed in a mixed forest dominated by Chamaecyparis obtusa (Sieb. et Zucc.) Endl. and Clethra barbinervis Siebold & Zucc., and in a Japanese cedar (Cryptomeria japonica (L. f.) D. Don) plantation. The mixed forest (35.07 N, 135.76 E) is located at the Kamigamo experimental station in Kyoto, Japan. The cedar plantation (32.82 N, 130.73 E) is located at the Tatsudayama research site in Kumamoto, Japan. The mean annual temperature and precipitation amounts at the research sites were 15.6 and 1932 mm, respectively, in the mixed forest, and 17.1 °C and 1951 mm, respectively, in the cedar plantation. The climate data were obtained from The Agro-Meteorological Grid Square Data of the National Agriculture and Food Research Organization (NARO).
2.2. Tea Bags
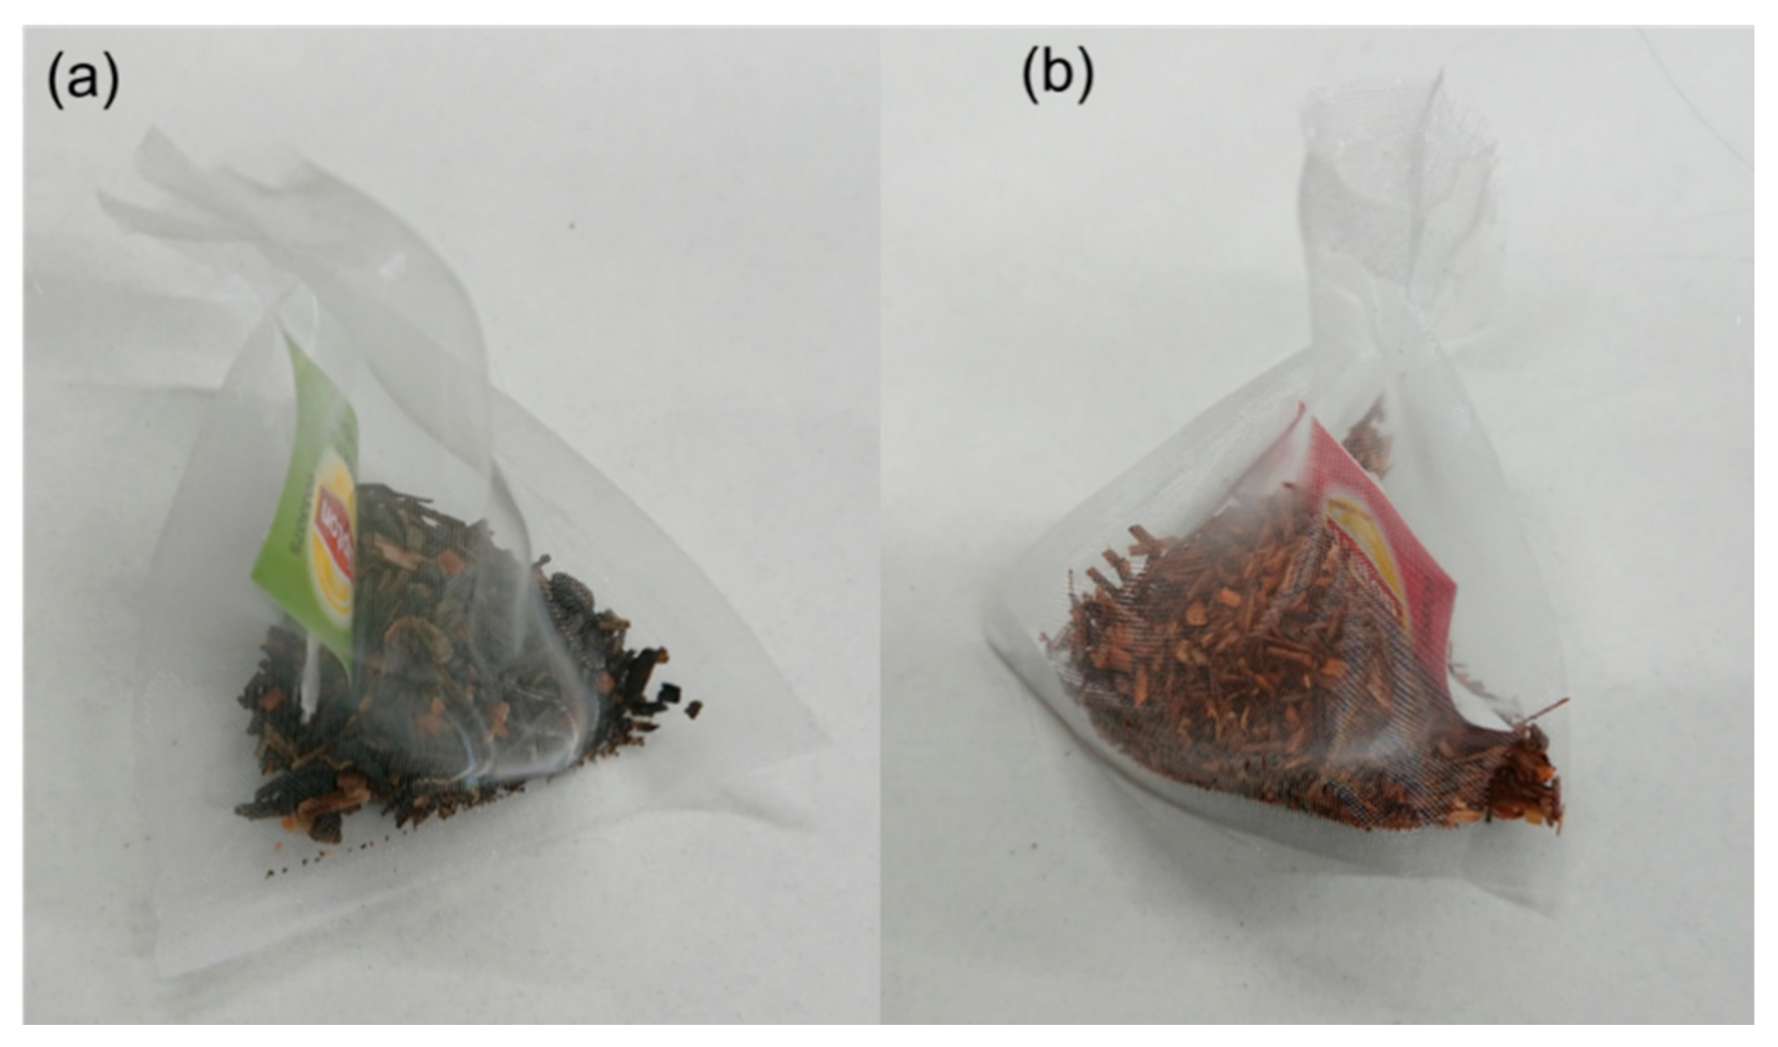
Following the developers of the tea bag method [3] and their webpage (Teatime 4 Science; http://www.teatime4science.org/ (accessed on 18 March 2021)), green tea bags (EAN: 87 10,908 90359 5; Lipton) and rooibos tea bags (EAN: 87 22,700 18843 8; Lipton) were used. The current tea bags (polypropylene nonwoven tea bags) were used for the laboratory studies testing the impact of water content on tea bag decomposition. To examine the effect of mesh size on tea bag decomposition, we produced 0.25-mm mesh woven tea bags from the tea contained within the nonwoven tea bags and a 0.25-mm mesh (Figure A2). Chemical properties of teas reported by previous studies [3,4] are shown in Table 1.
2.3. Laboratory Studies
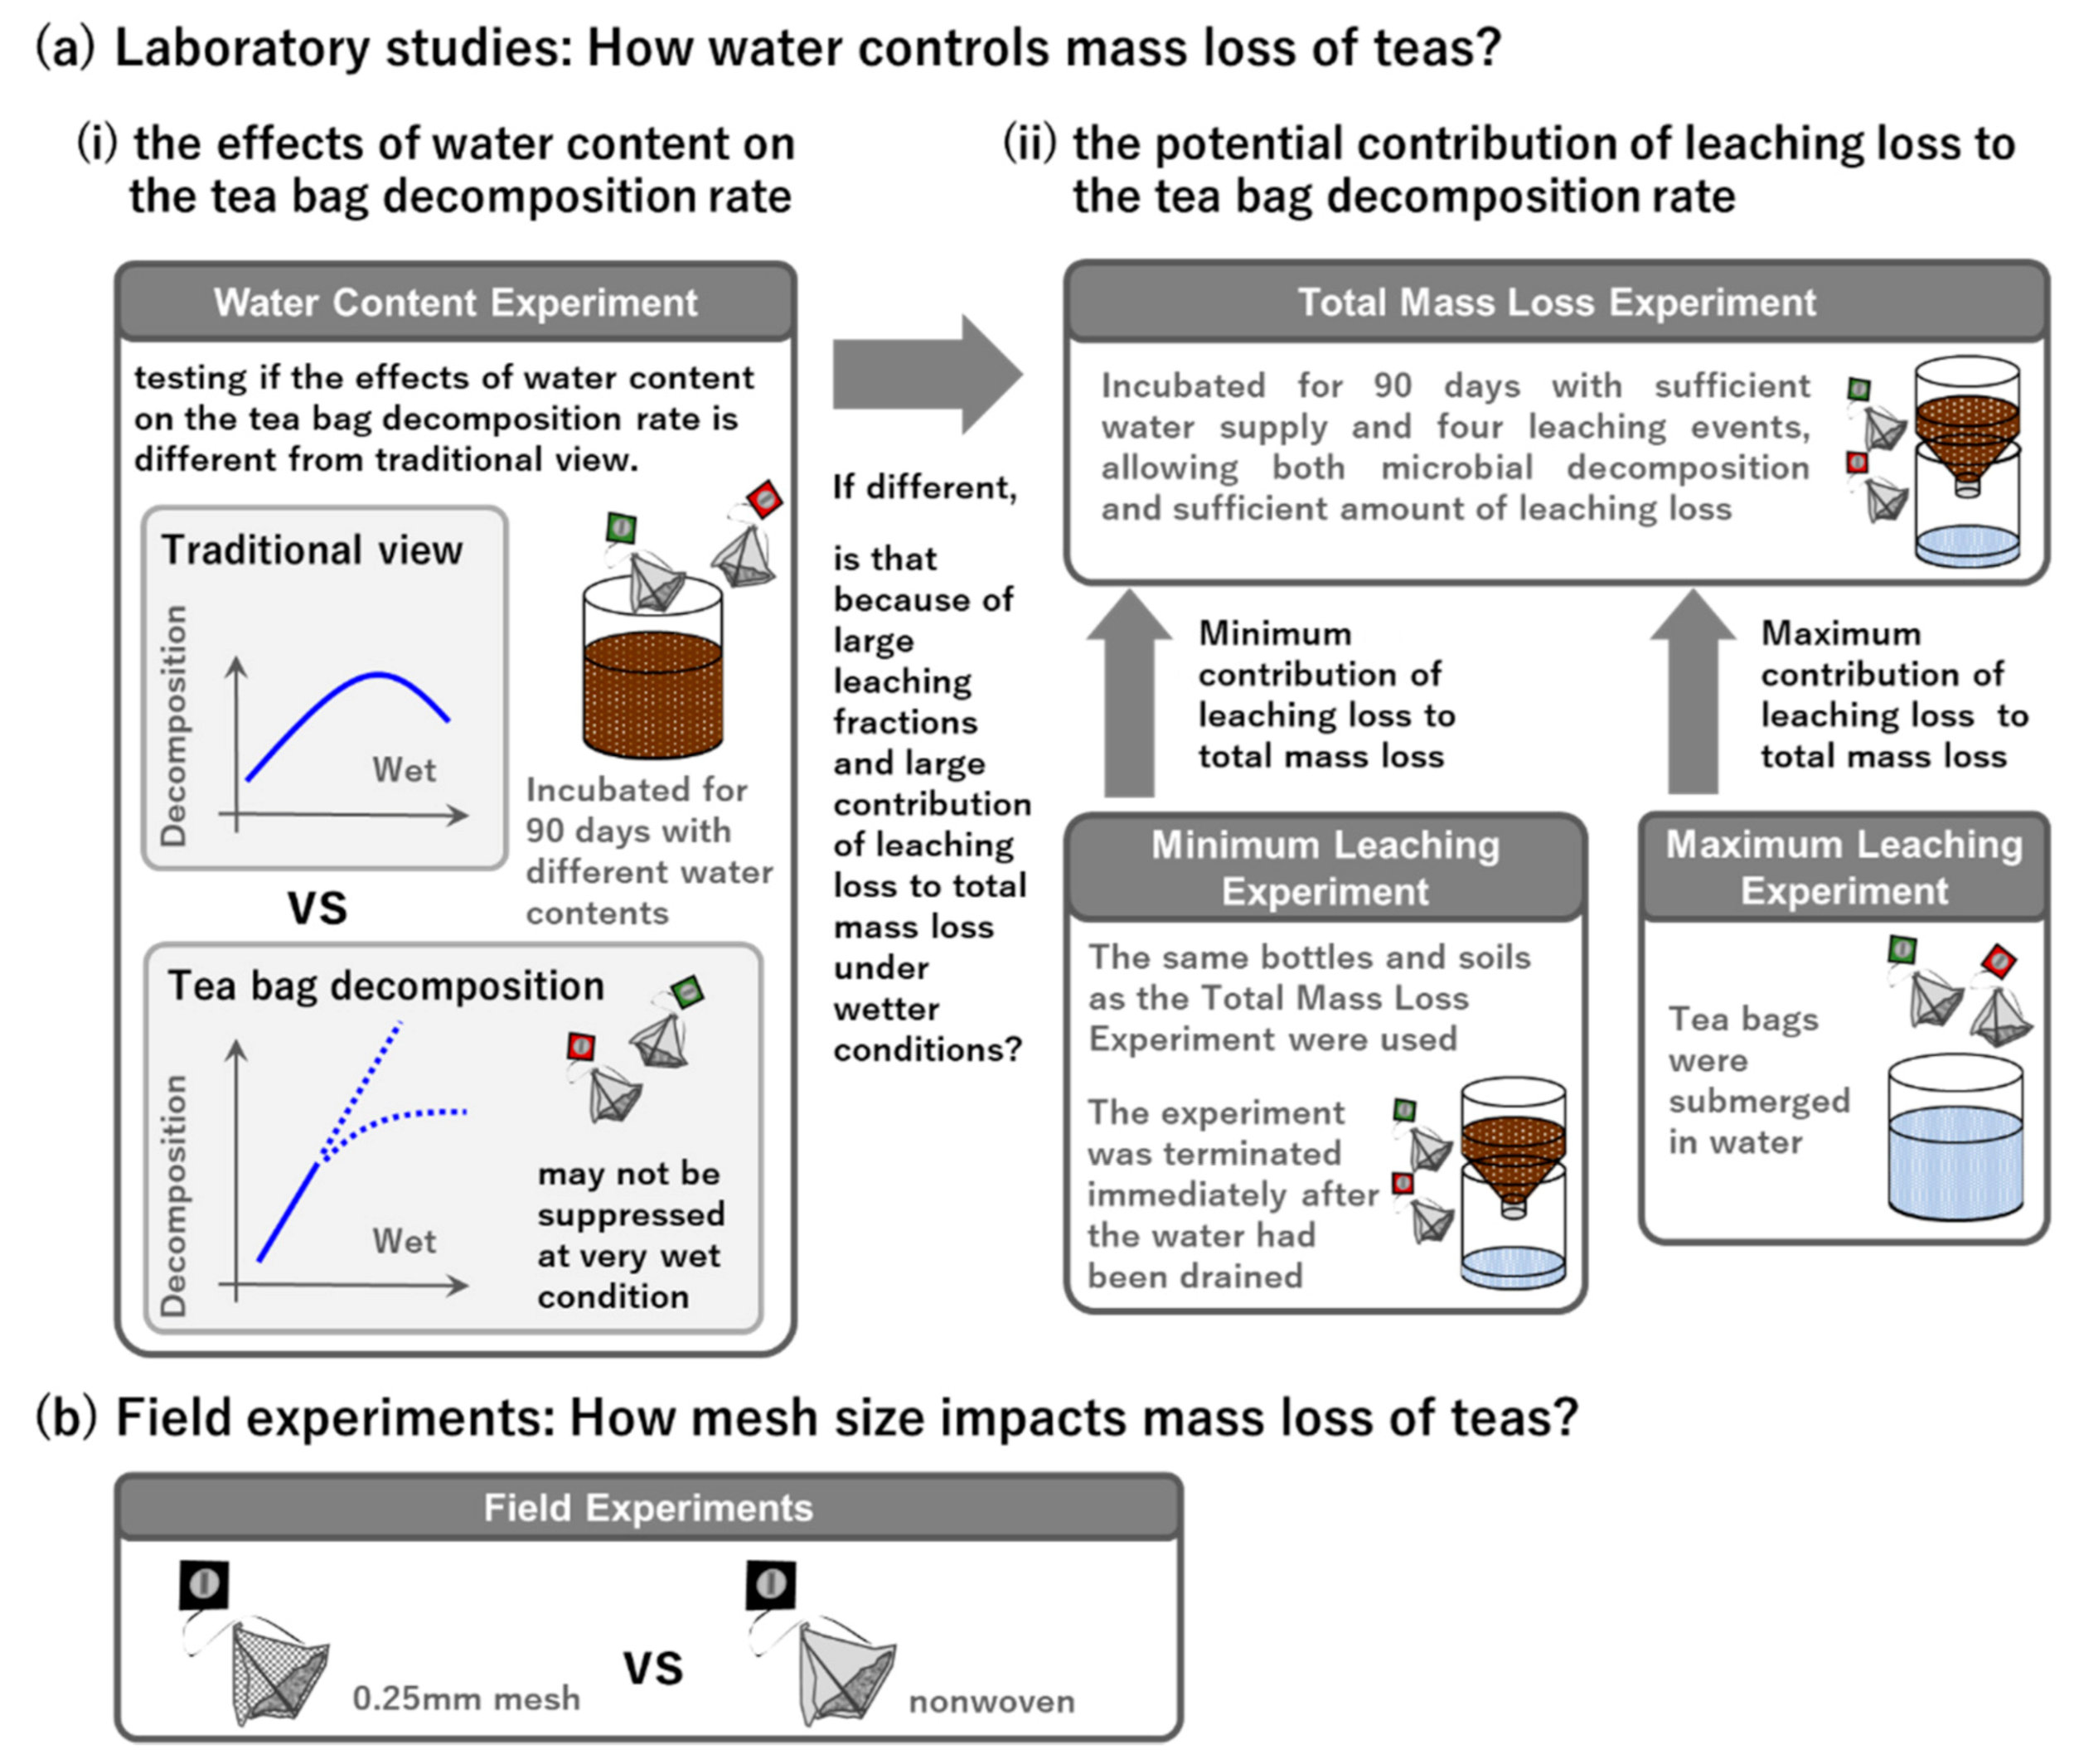
At the Tatsudayama research site, four laboratory experiments were conducted. A laboratory incubation experiment was done to clarify (i) the effects of water content on the tea bag decomposition rate (Water Content Experiment) (Figure 1a). The other three experiments (Total Mass Loss Experiment, Minimum Leaching Experiment, and Maximum Leaching Experiment) were performed to clarify (ii) the potential contribution of leaching loss to the tea bag decomposition rate (Figure 1a). In the present study, we used the relative mass loss amount of teas (i.e., loss weight/initial weight) during a certain interval as an indicator of the leaching or decomposition rate, rather than the decomposition constant k.
2.3.1. Water Content Experiment
In October 2019, soil samples (0–10 cm depth) were taken from the Tatsudayama research site in Kumamoto, Japan. We sieved the soils through a 4-mm sieve after removing large pieces of organic matter. We placed 150 g of fresh soil and two tea bags (green and rooibos teas, nonwoven tea bags, around 2 g) in a polyethylene terephthalate (PET) bottle (without a drainage hole). Water contents were adjusted to 27%, 39%, 48%, and 56% by adding deionized water (wet weight basis). The bottles were incubated for 90 days at 25 °C in the dark. Four replicates were prepared for each treatment. Dry weights of the tea bags were determined immediately after the end of the incubation.
2.3.2. Total Mass Loss Experiment
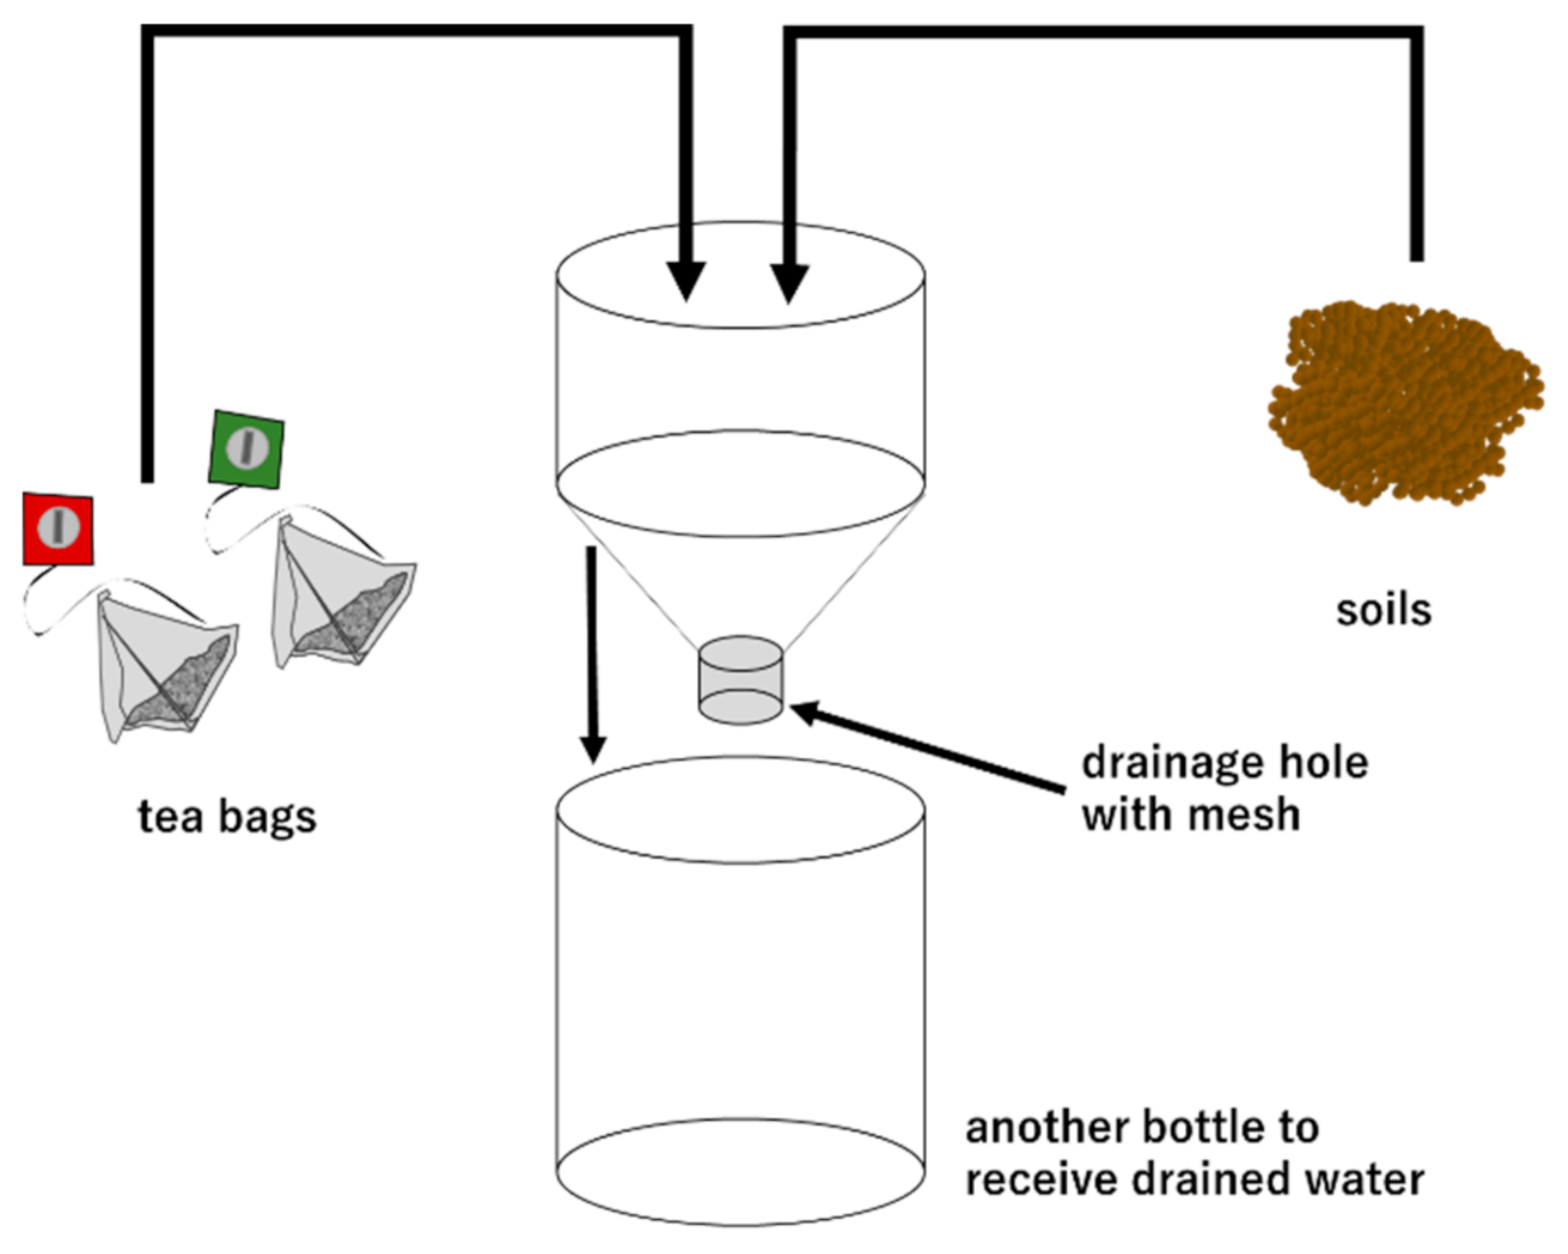
Soil samples taken from the 0–5-cm depth in September 2019 were used for the Total Mass Loss Experiment. Soils were sieved through a 2-mm sieve after large pieces of organic matter had been removed. Fresh soil (70 g) and two nonwoven tea bags (one green tea and one rooibos tea) were placed into a PET bottle with a drainage hole at the bottom (see Figure A3). The bottles were incubated for 90 days at 3 °C (in a cold room) or 25 °C (in an incubator). Four replicates were prepared for each treatment. To prevent water evaporation, all bottles were covered with a polyethylene sheet [13]. At 10, 23, 57, and 90 days after the start of the incubation, 100, 100, 200, and 200 mL of deionized water (in total 600 mL) was added to simulate precipitation, respectively. By adding the water at different times, we simulated multiple leaching events (four times) during the incubation. In several samples, the added deionized water (200 mL) on the last day (day 90) did not drain for several hours, so the incubation ended without complete drainage of the added water. Tea bags were oven-dried immediately after the end of the incubation period to prevent further decomposition. After removing the polypropylene fabric and soils on the surface of the fabric, teas were placed in an oven again (70 °C for 72 h) and dry weights were determined.
2.3.3. Minimum Leaching Experiment
A leaching experiment was conducted to determine the minimum leaching losses, using the same bottles and soils as in the Total Mass Loss Experiment described above. To exclude any impact of microorganisms on mass loss of the tea bags, soils were autoclaved at 120 °C for 1 h. The autoclaved soils (70 g) and two nonwoven tea bags (green and rooibos teas) were placed into the PET bottle with a drainage hole (Figure A3). Distilled water (600 mL) was added at 3 °C (in a cold room) or 25 °C (in an incubator). Three replicates were prepared for each treatment. After the water had been drained, tea bags were oven-dried immediately, and their dry weights were determined as described above.
2.3.4. Maximum Leaching Experiment
The maximum leaching loss of the tea bags was measured based on a modified version of the method of Nykvist (1959) [14]. Tea bags (nonwoven tea bags) were submerged in 300 mL of deionized water in glass or plastic bottles, and leaching loss at different temperatures and submerging durations was determined. Leaching proceeded in a cold room (3 °C) or incubators (15 °C and 25 °C) for 10 min, 140 min, or 24 h (different bottles were used for different submergence duration). Three replicates were prepared for each treatment. Dry weights were determined immediately after the end of the experiment.
2.4. Field Experiments
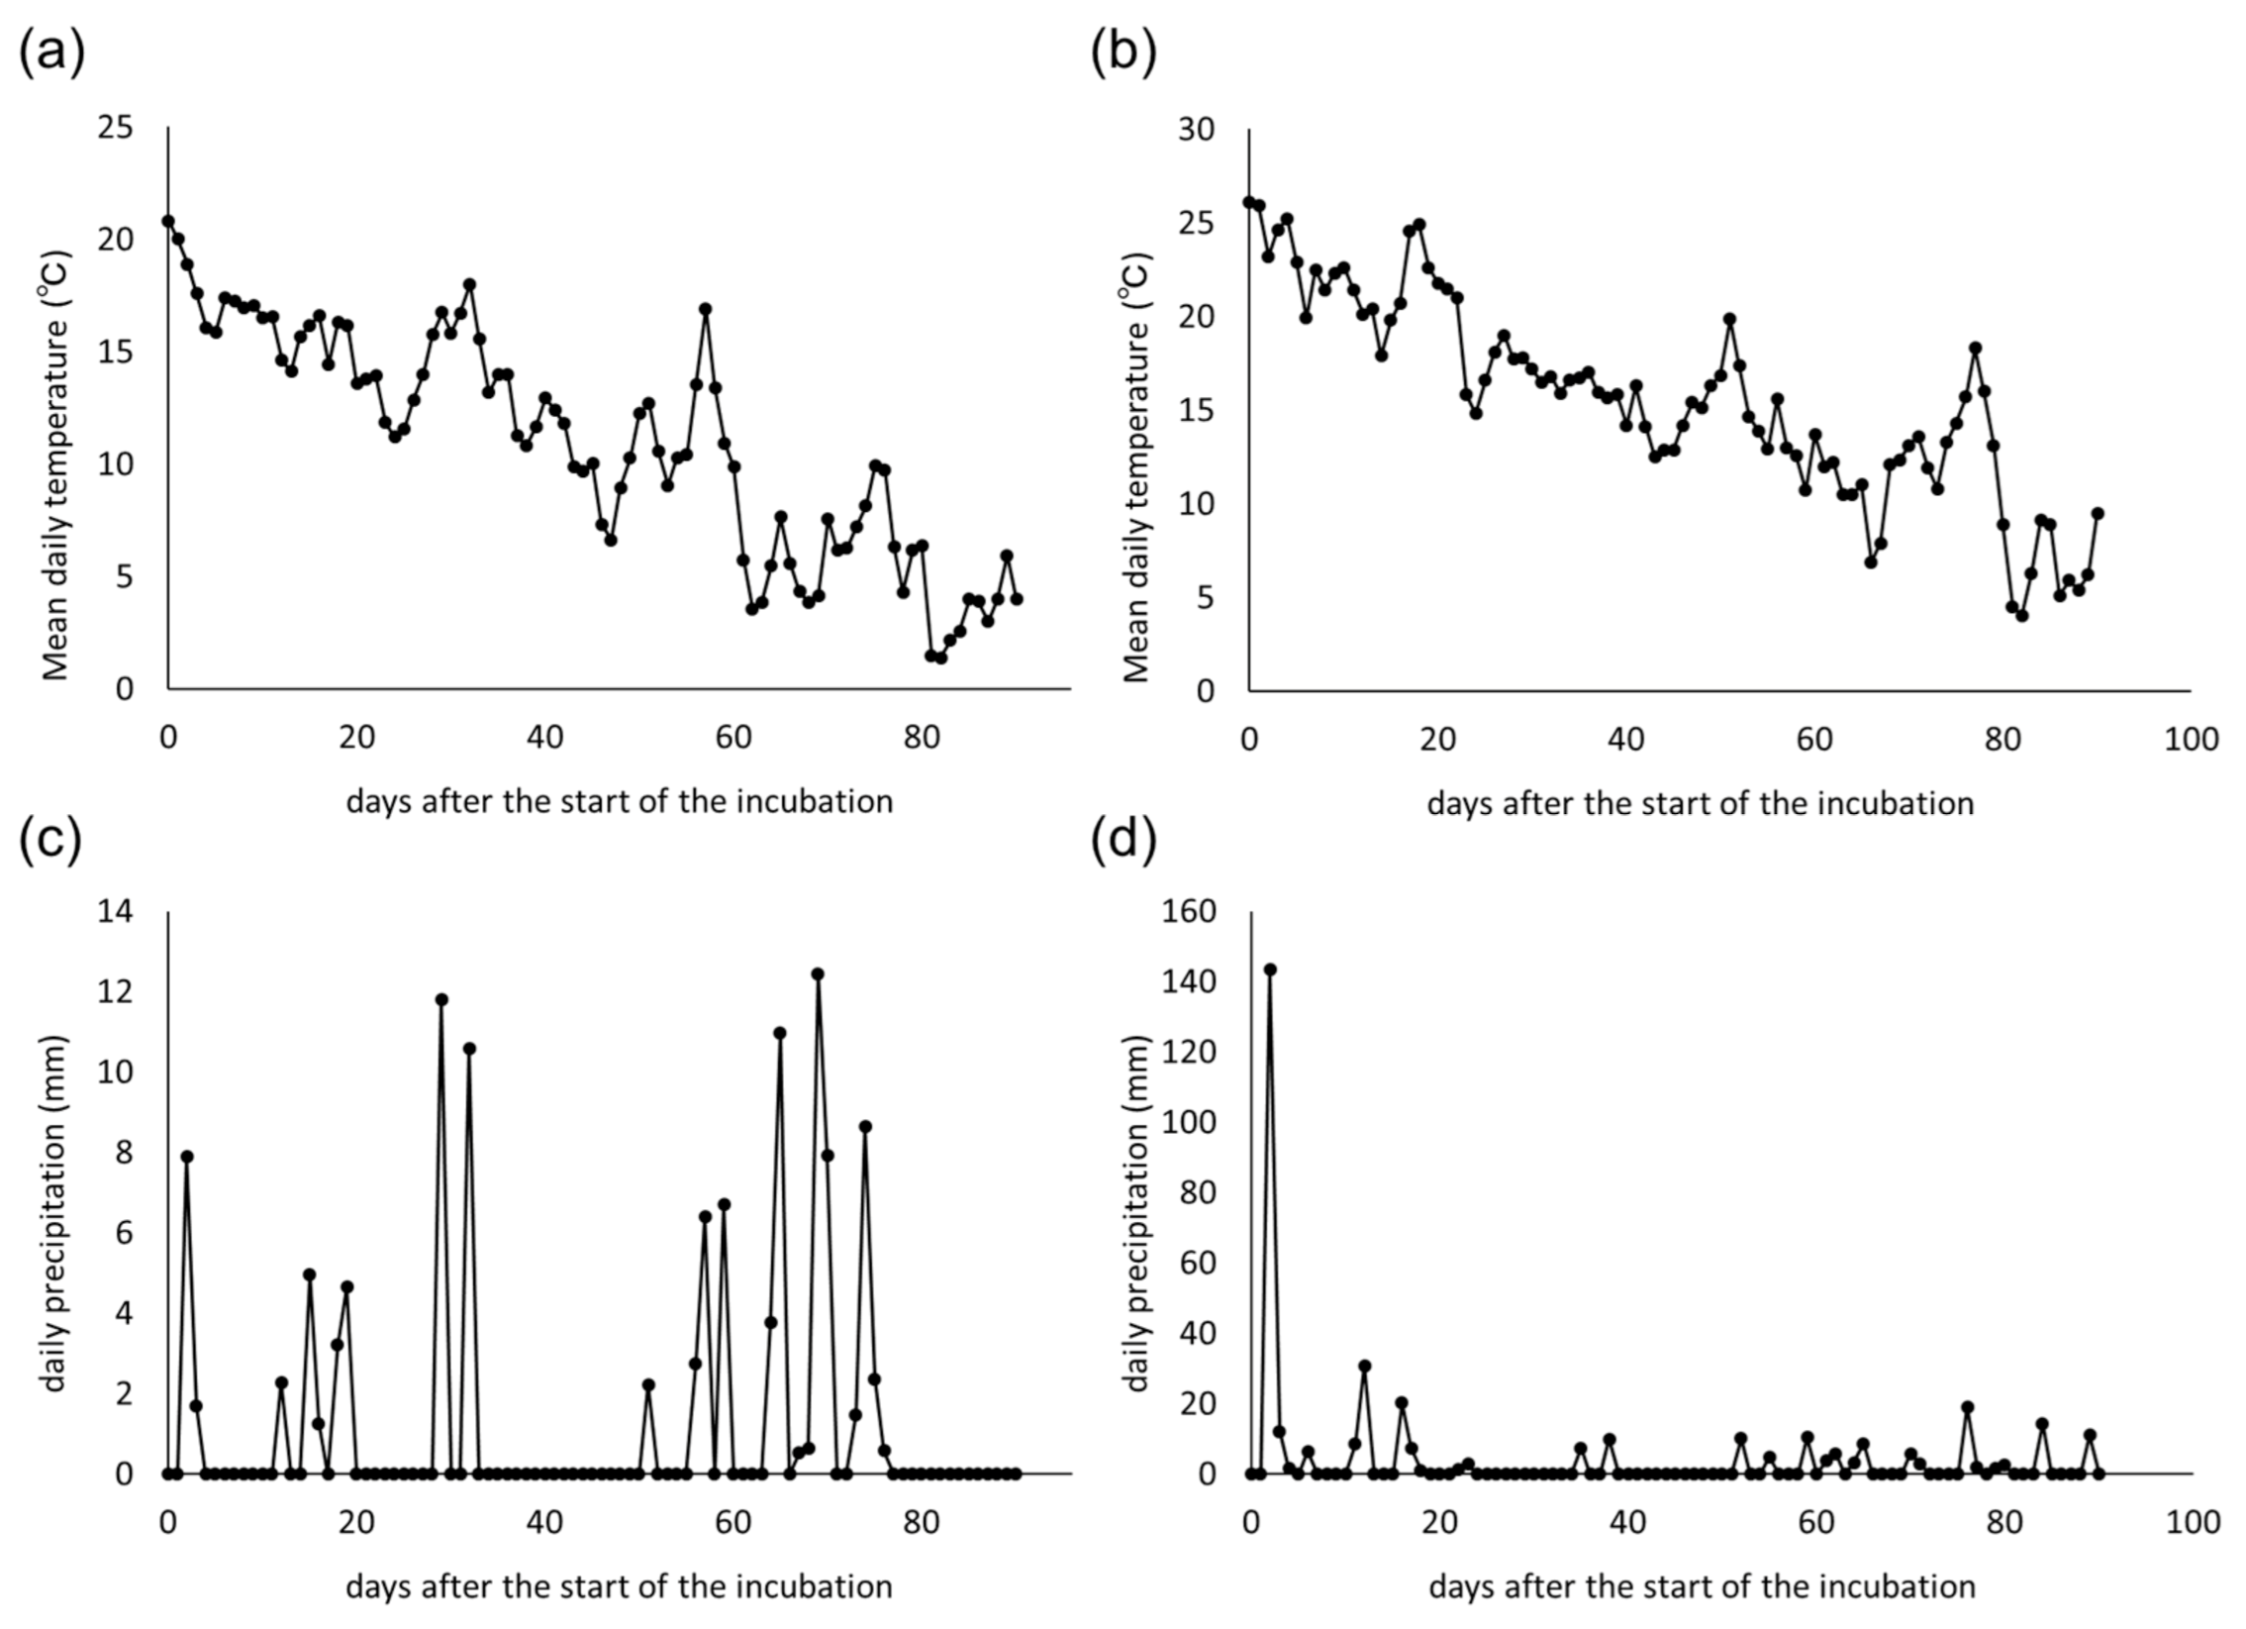
Tea bag decomposition rates were compared between 0.25-mm mesh tea bags and nonwoven tea bags in the mixed forest at Kamigamo research station and the Japanese cedar plantation at the Tatsudayama research site (Figure 1b). At each study site, we used four sub plots. Pairs of 0.25-mm mesh tea bags and nonwoven tea bags (both green and rooibos tea bags) were buried with two replicates at 8-cm depth, following Keuskamp et al. (2013). The bags were re-collected after 90 days. Dry weights (oven-dried at 70 °C for 72 h) were measured after removal of the mesh and soils on the surface thereof. The 90-day field incubation was initiated in October 2019 and September 2019 in the mixed forest and Japanese cedar plantation, respectively. The average temperature and cumulative precipitation during the 90-day field incubation experiments was 10.9 °C and 116 mm, respectively, in the mixed forest, and 15.5 °C and 359 mm, respectively, in the cedar plantation (Figure A4, obtained from The Agro-Meteorological Grid Square Data, NARO).
2.5. Calculation and Statistics
The lower bounds of the potential contribution (minimum contribution) of leaching loss to the tea bag decomposition rate was estimated by calculating the ratio of the minimum leaching loss (determined in the Minimum Leaching Experiment) to the total mass loss (determined in the Total Mass Loss Experiment). The upper bound of the potential contribution (maximum contribution) of leaching loss to the tea bag decomposition rate was estimated by calculating the ratio of the leaching loss during 24-h submergence in water (determined in the Maximum Leaching Experiment) to the total mass loss (determined in the Total Mass Loss Experiment), assuming that the leachable fraction of the teas was mainly lost during the 24-h submergence period.
Statistical differences among treatments were tested using analysis of variance (ANOVA; one-, two-, or three-way) and the paired t-test. Data were log-transformed before analyzing. Tukey’s HSD was used as a post hoc test as necessary. A p-value less than 0.05 was considered statistically significant. All statistical analyses were performed using R software (version 3.5.3 and 4.0.2; R Development Core Team [15,16]).
3. Results
3.1. Effects of Water Content on Tea Bag Decomposition
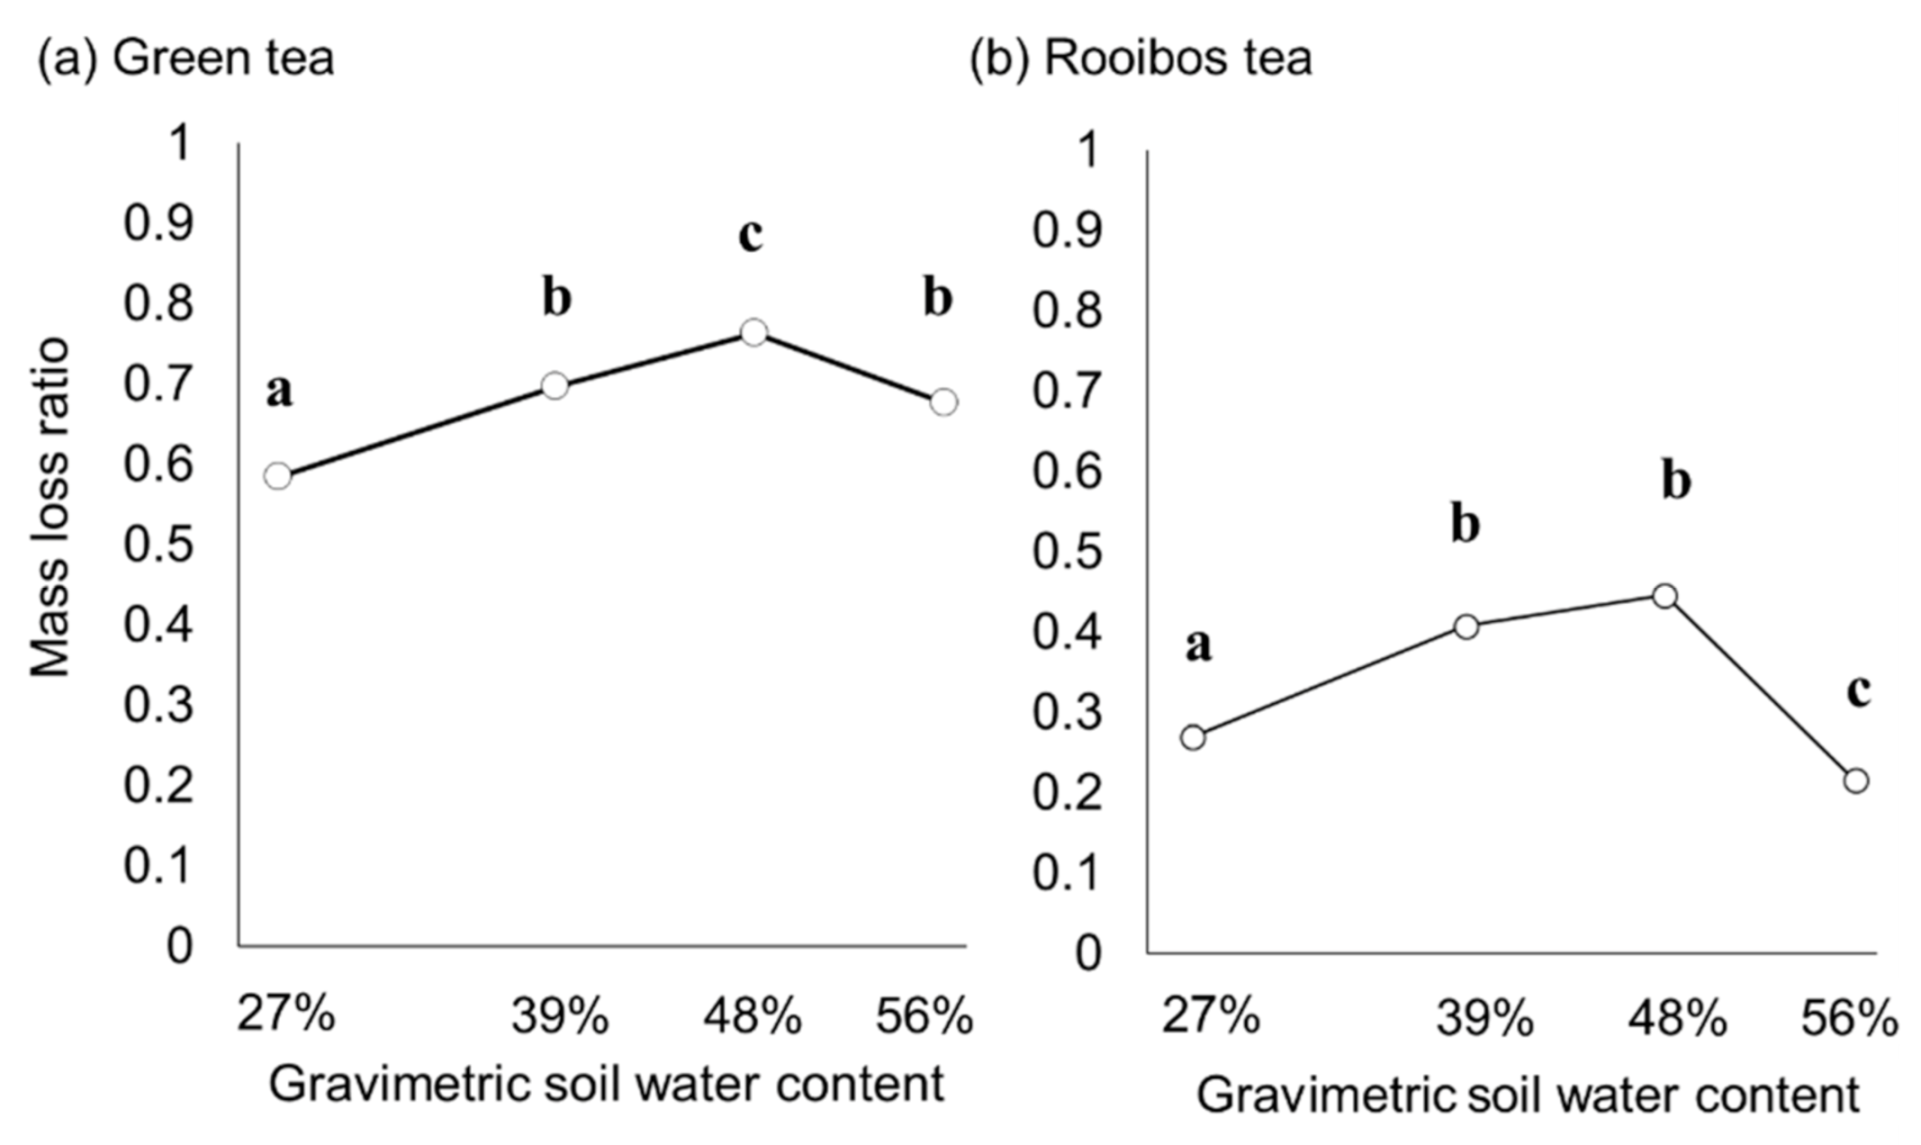
The Water Content Experiment revealed that the water content had significant effects on both green tea (F = 58.9, p < 0.01, one-way ANOVA, Figure 2a) and rooibos tea (F = 122.7, p < 0.01, one-way ANOVA, Figure 2b) decomposition. According to the post hoc analysis, (i) up to a gravimetric soil water content of 48% (wet weight basis), the tea bag decomposition rate increased with increasing soil water content, but (ii) decomposition was suppressed at the highest water content in both green tea and rooibos tea (Figure 2).
3.2. Leaching Loss of Teas
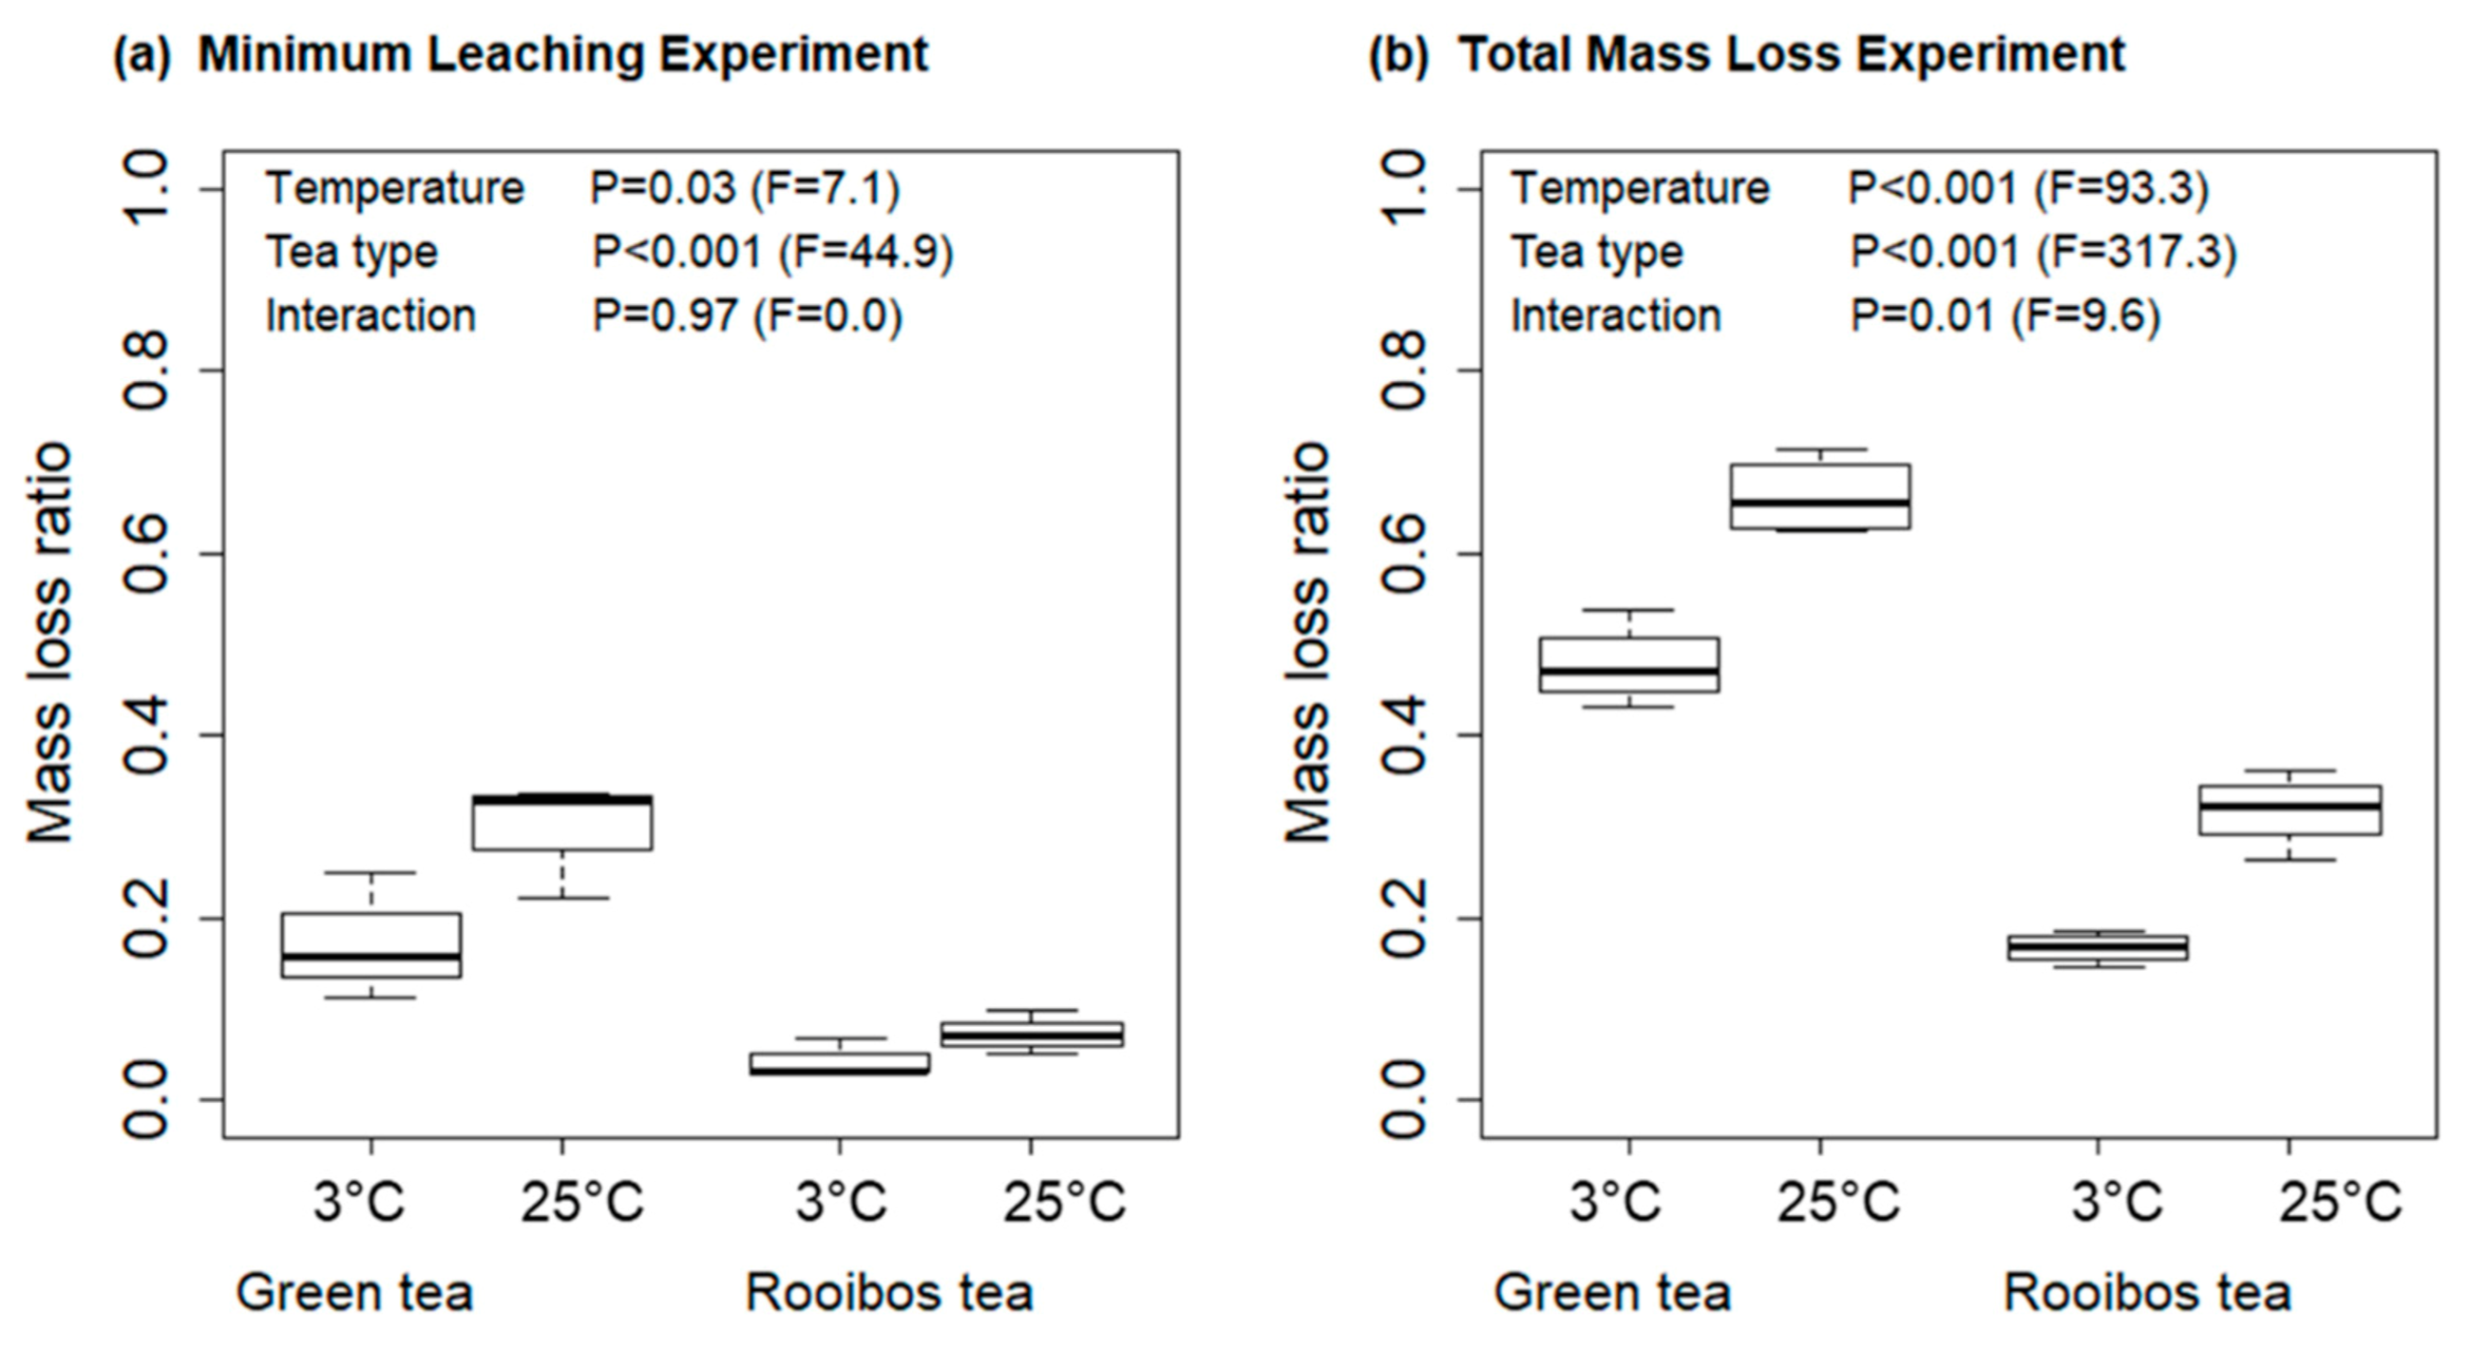
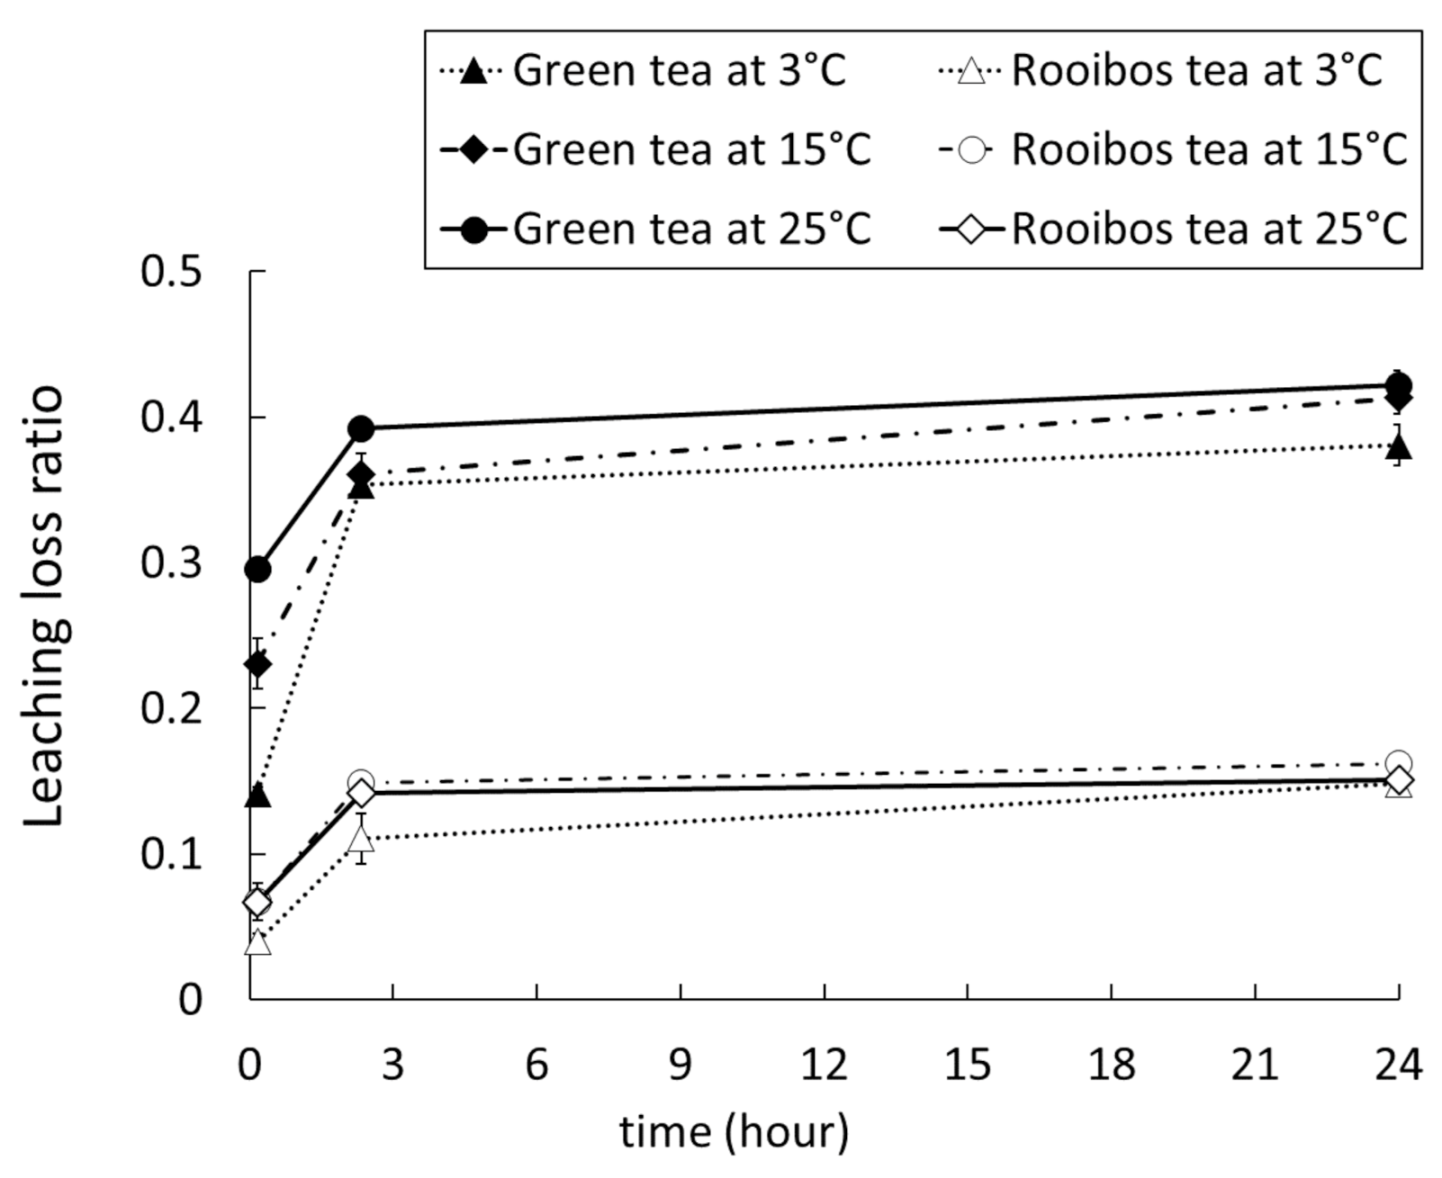
Both tea type and temperature influenced the minimum leaching loss, with greater leaching for green tea and higher temperatures (Figure 3a). Leaching loss when tea bags were submerged in 300 mL of water increased until 140 min (around 0.4 and 0.15 for green and rooibos tea, respectively, Figure 4), but was not further elevated at 24 h (Tukey’s post hoc test, Figure 4, Table 2). The results indicated that the leaching loss at 24 h was the maximum leaching loss. Tukey’s HSD indicated that (i) green tea experienced more leaching loss than rooibos tea and (ii) differences in temperature only affected the leaching loss at 10 min, where smaller amount of leaching loss was observed at 3 °C compared with 15 °C and 25 °C (Figure 4, Table 2).
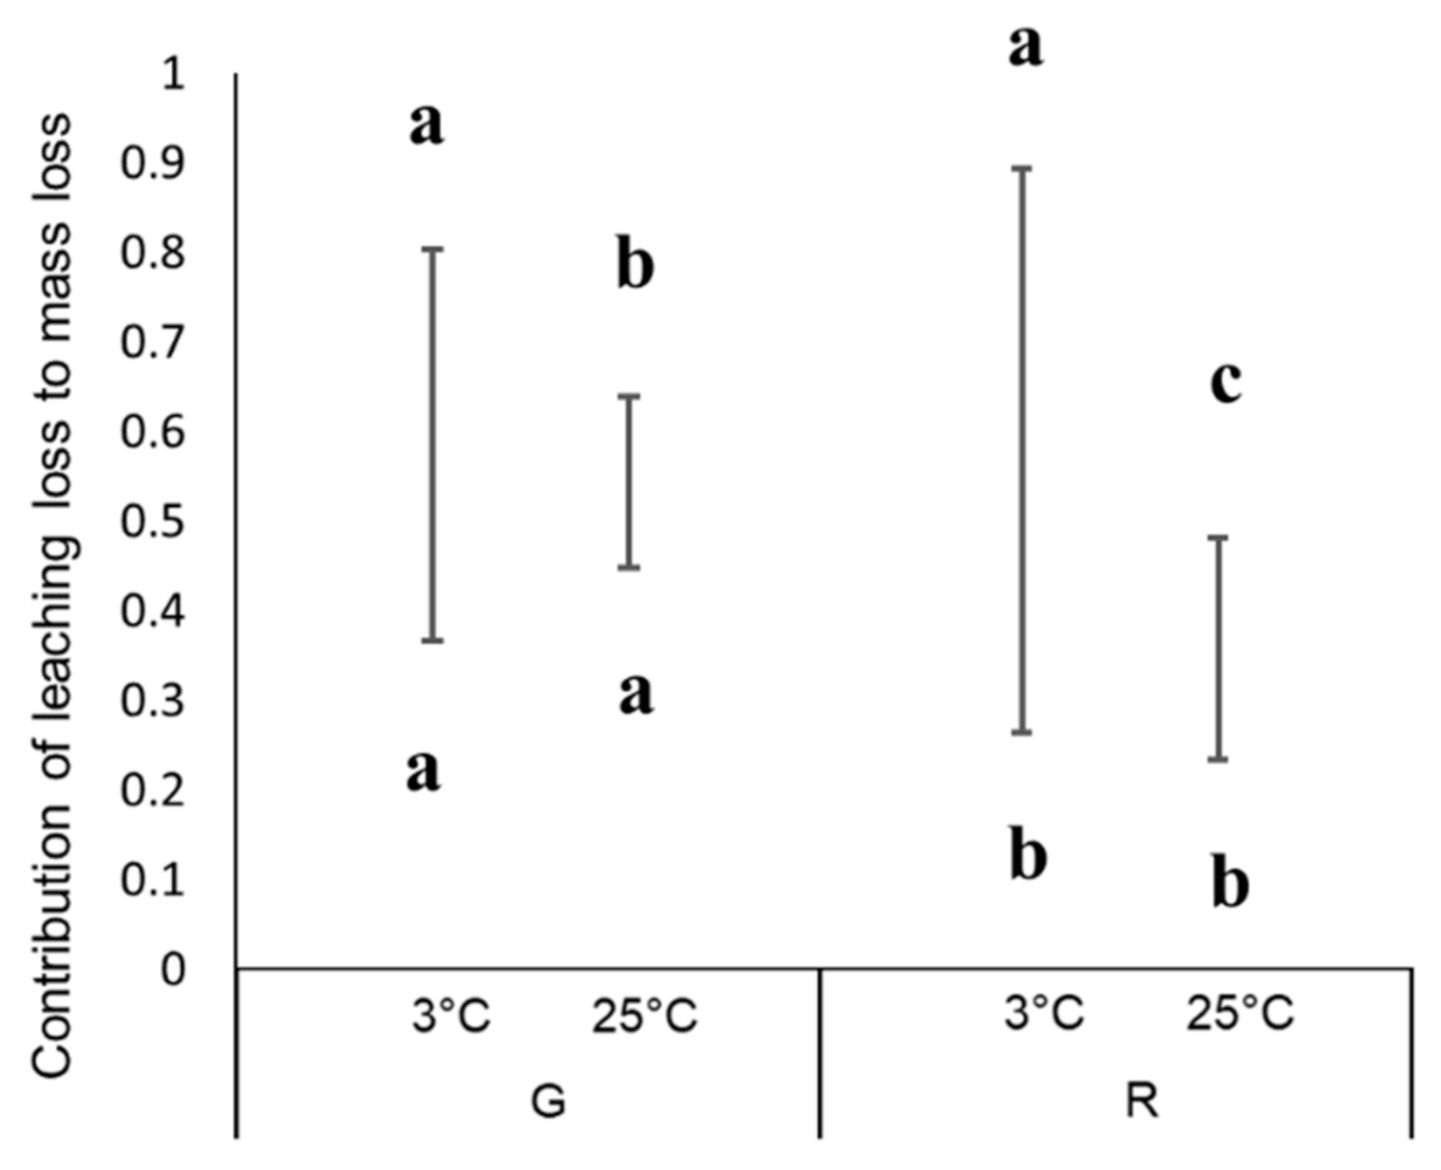
3.3. Contribution of Leaching Loss to Tea Bag Decomposition
The lower bounds of the contribution of leaching loss to the tea bag decomposition rates ranged from 0.23 (rooibos tea at 25 °C) to 0.45 (green tea at 25 °C), while the upper bounds reached as high as 0.89 (rooibos tea at 3 °C) (Figure 5).
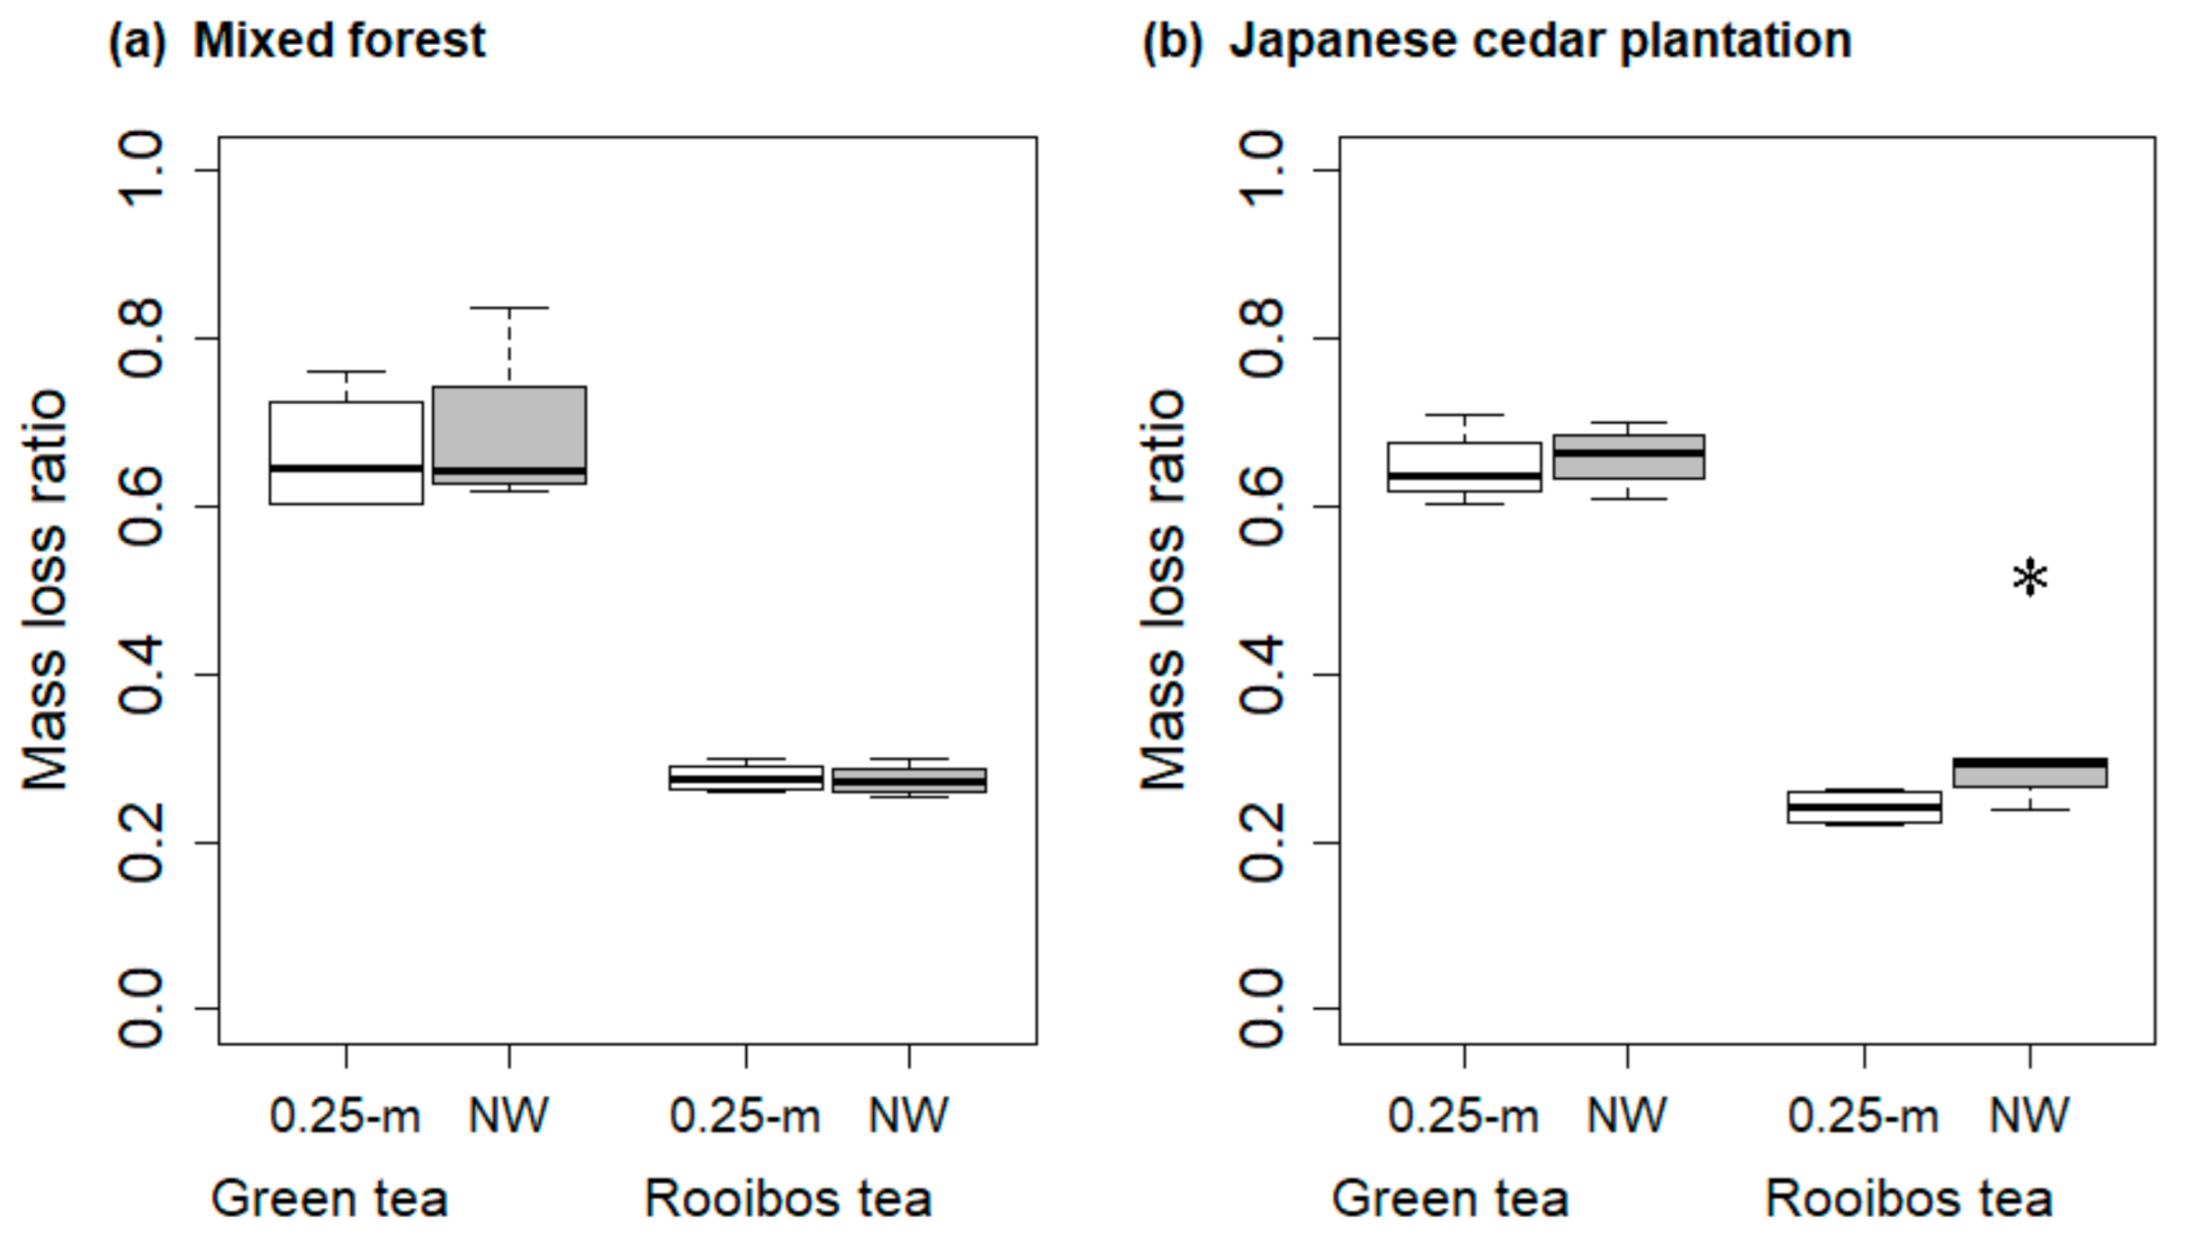
3.4. Effects of Mesh Size on Tea Bag Decomposition
The decomposition rate of green tea was not significantly affected by mesh size in either forest (Figure 6), while the mass loss of rooibos tea (0.28 ± 0.01) in nonwoven bags was slightly but significantly higher than that of 0.25 mm-mesh bags (0.24 ± 0.01) at the Japanese cedar plantation (Figure 6b).
4. Discussion
4.1. Effects of Water Content on Tea Bag Decomposition
Both green tea and rooibos tea exhibited higher decomposition rates with higher water contents, but the highest water content inhibited decomposition (Figure 2); this was in contrast to our hypothesis based on a field observation by Petraglia et al. (2019) [6], but consistent with the conceptual models of Prescott (2010) [17]. This result was most likely due to the reductive condition suppressing decomposition [18]. The fact that the responses of both teas to the wetter condition were consistent with a conceptual model justifies the usage of tea bags as a representative of local litters in studies of organic matter decomposition in wet conditions. Furthermore, the present results could help improve models of tea bag decomposition rates (ex. Didion et al. 2016) [19]). The “concave down shape” relationship between water content and tea bag decomposition rate could be adopted in such models.
4.2. Potential Contribution of Leaching to Tea Bag Decomposition Rate
The leaching losses of rooibos tea after 24 h at 3 °C, 15 °C, and 25 °C (0.15 ± 0.005, 0.16 ± 0.001, and 0.15 ± 0.003, respectively, Figure 3) were in the similar range with those of other litters reported in previous studies [14,20,21]. Ibrahima et al. (2008) reported the mass losses of leaf litters of the following eight agroforestry species after submergence in water: Lophira lanceolata, Vitex doniana, Vitellaria paradoxa, Syzygium guineense var. guineense, Annona senegalensis, Syzygium guineense var. macrocarpum, Vitex madiensis, and Ximenia americana. They demonstrated that all of the litters showed leaching losses below 20% during the 24-h submersion (all less than 10% except for V. madiensis and X. americana).
By contrast, green teas exhibited extremely large leaching losses (Figure 2a). The leaching losses of green teas after 24 h at 3 °C, 15 °C, and 25 °C (0.38 ± 0.01, 0.41 ± 0.01, and 0.42 ± 0.01, respectively) were much larger than in previous reports [14,20,21]. The much larger fractions of nonpolar extractives and water solubles (hot water-extracted) in green tea compared to rooibos tea [3] likely caused the larger leaching loss of green tea. The contrasting leaching losses of the two types of teas caused the larger potential contribution of leaching loss to the decomposition rate of green tea compared to that of rooibos tea, especially at the higher temperature of 25 °C (Figure 5).
4.3. Effects of Mesh Size on Tea Bag Decomposition
Contrary to our hypothesis, the finer mesh size did not suppress the decomposition of rooibos tea. In the mixed forest, no significant difference in decomposition rate was observed between nonwoven and 0.25 mm-mesh tea bags, while in the cedar plantation the decomposition rate of rooibos tea was somewhat quicker for the finer nonwoven tea bags (although the mesh size effect was small; Figure 6b). These results contrasted with earlier works, wherein finer mesh size caused slower decomposition [11,12]. It seems unlikely that the soil contamination caused the slower decomposition of the bags with coarser mesh, because the contamination was negligible in our study sites (personal observation). We cannot fully explain the phenomenon, which differed from the literature. One possible mechanism is as follows: a greater abundance of microorganisms decomposed litters due to the decrease in predation by mesofauna in the finer nonwoven bags. This hypothesis requires further study and quantification of mesofauna. On the other hand, green tea decomposition was not affected by the difference in mesh size, consistent with our initial hypothesis. Keuskamp et al. (2013) [3] suggested that the decomposable fraction of green tea is completely decomposed before the end of the 90-day incubation period. In such a case, changes in mesh size and mesofauna abundance would not stimulate green tea decomposition.
Overall, the present study demonstrated that tea bag decomposition during a 90-day incubation period was not markedly affected by mesh size. Although the decomposition of rooibos tea was slightly stimulated by a change in the mesh size at the cedar plantation (from 0.24 ± 0.01 [nonwoven bags] to 0.28 ± 0.01 [0.25 mm-mesh bags], Figure 6b), the impact was not large. Our unexpected results may justify combining the decomposition data of the two types of tea bags, namely, the previously produced woven nylon mesh tea bags and the currently used polypropylene tea bags. However, the number of observations in the present experiment was not sufficient to draw a definitive conclusion; additional studies with more observations are therefore necessary.
5. Conclusions
The present study provides essential information for future studies on tea bag decomposition. First, we confirmed that both green and rooibos teas exhibited higher decomposition rates with higher water contents, although decomposition was inhibited at the highest water content; this was in contrast to our initial hypothesis based on a field observation but consistent with conceptual models of local litters and justifies the assumption that tea bags are representative of local litters. Second, we unexpectedly found that the impact of tea bag mesh size on decomposition might be insignificant. Thus, it may be possible to combine the decomposition data of the two types of tea bags, namely, the currently used bags and the previous ones, which are currently unavailable. Further studies with more study sites are required to test this.
Author Contributions
Conceptualization, T.M. and Y.S.; methodology, T.M.; software, T.M.; validation, T.M. and R.A.; formal analysis, T.M.; investigation, T.M., R.A. and H.T.; resources, T.M.; data curation, T.M.; writing—original draft preparation, T.M.; writing—review and editing, T.M., R.A., H.T. and Y.S.; visualization, T.M.; project administration, T.M.; funding acquisition, T.M. All authors have read and agreed to the published version of the manuscript.
Funding
This research was funded by JSPS KAKENHI Grant Number JP19K15879.
Data Availability Statement
Data supporting reported results can be sent when requested to the corresponding author.
Acknowledgments
We thank all staff members of the Kamigamo experimental station, Field Science Education and Research Center, Kyoto University. We thank Yoshihiro Takahata for his professional advices on the laboratory work. We thank Yumiko Sakamoto and Akane Sakumori for their assistance on the laboratory work.
Conflicts of Interest
The authors declare no conflict of interest.
Appendix A
Figure A1.
Polypropylene nonwoven new bags with non-uniform mesh sizes. A relatively coarse area (a) and relatively dense area (b) are shown.
Figure A1.
Polypropylene nonwoven new bags with non-uniform mesh sizes. A relatively coarse area (a) and relatively dense area (b) are shown.

Figure A2.
Tea bags for (a) green tea and (b) rooibos tea made from 0.25-mm mesh and tea contained within the nonwoven tea bags.
Figure A2.
Tea bags for (a) green tea and (b) rooibos tea made from 0.25-mm mesh and tea contained within the nonwoven tea bags.

Figure A3.
Bottles used in the Total Mass Loss Experiment and Minimum Leaching Experiment.

Figure A4.
Climate data obtained during the field incubation period. Daily temperatures of the (a) mixed forest and (b) Japanese cedar plantation, and daily precipitation amounts for the (c) mixed forest and (d) Japanese cedar plantation, were determined by The Agro-Meteorological Grid Square Data, NARO.

References
- Cornwell, W.K.; Cornelissen, J.H.C.; Amatangelo, K.; Dorrepaal, E.; Eviner, V.T.; Godoy, O.; Hobbie, S.E.; Hoorens, B.; Kurokawa, H.; Pérez-Harguindeguy, N.; et al. Plant species traits are the predominant control on litter decomposition rates within biomes worldwide. Ecol. Lett. 2008, 11, 1065–1071. [Google Scholar] [CrossRef]
- Zhang, D.; Hui, D.; Luo, Y.; Zhou, G. Rates of litter decomposition in terrestrial ecosystems: Global patterns and controlling factors. J. Plant Ecol. 2008, 1, 85–93. [Google Scholar] [CrossRef] [Green Version]
- Keuskamp, J.A.; Dingemans, B.J.J.; Lehtinen, T.; Sarneel, J.M.; Hefting, M.M. Tea Bag Index: A novel approach to collect uniform decomposition data across ecosystems. Methods Ecol. Evol. 2013, 4, 1070–1075. [Google Scholar] [CrossRef]
- Duddigan, S.; Shaw, L.J.; Alexander, P.D.; Collins, C.D. Chemical Underpinning of the Tea Bag Index: An Examination of the Decomposition of Tea Leaves. Appl. Environ. Soil Sci. 2020, 2020, 1–8. [Google Scholar] [CrossRef]
- Suzuki, S.N.; Ataka, M.; Djukic, I.; Enoki, T.; Fukuzawa, K.; Hirota, M.; Hishi, T.; Hiura, T.; Hoshizaki, K.; Ida, H.; et al. Harmonized data on early stage litter decomposition using tea material across Japan. Ecol. Res. 2019, 34, 575–576. [Google Scholar] [CrossRef]
- Petraglia, A.; Cacciatori, C.; Chelli, S.; Fenu, G.; Calderisi, G.; Gargano, D.; Abeli, T.; Orsenigo, S.; Carbognani, M. Litter decomposition: Effects of temperature driven by soil moisture and vegetation type. Plant Soil 2018, 435, 187–200. [Google Scholar] [CrossRef]
- Djukic, I.; Kepfer-Rojas, S.; Schmidt, I.K.; Larsen, K.S.; Beier, C.; Berg, B.; Verheyen, K.; Caliman, A.; Paquette, A.; Gutiérrez-Girón, A.; et al. Early stage litter decomposition across biomes. Sci. Total. Environ. 2018, 628–629, 1369–1394. [Google Scholar] [CrossRef] [PubMed] [Green Version]
- Mueller, P.; Schile-Beers, L.M.; Mozdzer, T.J.; Chmura, G.L.; Dinter, T.; Kuzyakov, Y.; De Groot, A.V.; Esselink, P.; Smit, C.; D’Alpaos, A.; et al. Global-change effects on early-stage decomposition processes in tidal wetlands—Implications from a global survey using standardized litter. Biogeosciences 2018, 15, 3189–3202. [Google Scholar] [CrossRef] [Green Version]
- Fujii, S.; Mori, A.S.; Koide, D.; Makoto, K.; Matsuoka, S.; Osono, T.; Isbell, F. Disentangling relationships between plant diversity and decomposition processes under forest restoration. J. Appl. Ecol. 2017, 54, 80–90. [Google Scholar] [CrossRef]
- Mori, T.; Hashimoto, T.; Sakai, Y. Evaluating the tea bag method as a potential tool for detecting the effects of added nutri-ents and their interactions with climate on litter decomposition. bioRxiv 2021. [Google Scholar] [CrossRef]
- Powers, J.S.; Montgomery, R.A.; Adair, E.C.; Brearley, F.Q.; DeWalt, S.J.; Castanho, C.T.; Chave, J.; Deinert, E.; Ganzhorn, J.U.; Gilbert, M.E.; et al. Decomposition in tropical forests: A pan-tropical study of the effects of litter type, litter placement and mesofaunal exclusion across a precipitation gradient. J. Ecol. 2009, 97, 801–811. [Google Scholar] [CrossRef] [Green Version]
- Bradford, M.A.; Tordoff, G.M.; Eggers, T.; Jones, T.H.; Newington, J.E. Microbiota, fauna, and mesh size interactions in litter decomposition. Oikos 2002, 99, 317–323. [Google Scholar] [CrossRef]
- Mori, T.; Ohta, S.; Ishizuka, S.; Konda, R.; Wicaksono, A.; Heriyanto, J.; Hardjono, A. Effects of phosphorus addition with and without ammonium, nitrate, or glucose on N2O and NO emissions from soil sampled under Acacia mangium plantation and incubated at 100% of the water-filled pore space. Biol. Fertil. Soils 2012, 49, 13–21. [Google Scholar] [CrossRef]
- Nykvist, N. Leaching and Decomposition of Litter I. Experiments on Leaf Litter of Fraxinus excelsior. Oikos 1959, 10, 190–211. [Google Scholar] [CrossRef]
- R Core Team. Version 3.5.3. In R: A Language and Environment for Statistical Computing; R Foundation for Statistical Computing: Vienna, Austria, 2019; Available online: https://www.R-project.org (accessed on 18 January 2021).
- R Core Team. Version 4.0.2. In R: A Language and Environment for Statistical Computing; R Foundation for Statistical Computing: Vienna, Austria, 2020; Available online: https://www.R-project.org (accessed on 18 January 2021).
- Prescott, C.E. Litter decomposition: What controls it and how can we alter it to sequester more carbon in forest soils? Biogeochemistry 2010, 101, 133–149. [Google Scholar] [CrossRef]
- Neckles, H.A.; Neill, C. Hydrologic control of litter decomposition in seasonally flooded prairie marshes. Hydrobiologia 1994, 286, 155–165. [Google Scholar] [CrossRef]
- Didion, M.; Repo, A.; Liski, J.; Forsius, M.; Bierbaumer, M.; Djukic, I. Towards Harmonizing Leaf Litter Decomposition Studies Using Standard Tea Bags—A Field Study and Model Application. Forests 2016, 7, 167. [Google Scholar] [CrossRef] [Green Version]
- Taylor, B.R.; Parkinson, D. Patterns of water absorption and leaching in pine and aspen leaf litter. Soil Biol. Biochem. 1988, 20, 257–258. [Google Scholar] [CrossRef]
- Ibrahima, A.; Biyanzi, P.; Halima, M. Changes in organic compounds during leaf litter leaching: Laboratory experiment on eight plant species of the Sudano-guinea Savannas of Ngaoundere, Cameroon. iForest-Biogeosci. For. 2008, 1, 27–33. [Google Scholar] [CrossRef]
Figure 1.
The diagram of experimental design. (a) Laboratory studies were done for testing how water controls mass loss of teas, and (b) field experiments were done for testing how mesh size impacts mass loss of teas.
Figure 1.
The diagram of experimental design. (a) Laboratory studies were done for testing how water controls mass loss of teas, and (b) field experiments were done for testing how mesh size impacts mass loss of teas.

Figure 2.
Effects of water content on (a) green tea and (b) rooibos tea decomposition (Water Content Experiment). Different letters on each graph indicate significant differences among the data, determined using Tukey’s HSD followed by one-way ANOVA (p < 0.05). Log-transformed data were used for ANOVA. The error bars indicating the standard error of the four replicates were too small to be displayed.

Figure 3.
Mass loss of green and rooibos teas relative to the initial weights (a) through leaching (Minimum Leaching Experiment) and (b) during a 90-day laboratory incubation period (Total Mass Loss Experiment). Results of two-way ANOVA using log-transformed data were shown on each figure.
Figure 3.
Mass loss of green and rooibos teas relative to the initial weights (a) through leaching (Minimum Leaching Experiment) and (b) during a 90-day laboratory incubation period (Total Mass Loss Experiment). Results of two-way ANOVA using log-transformed data were shown on each figure.

Figure 4.
Mass loss of green and rooibos teas relative to the initial weights during the Maximum Leaching Experiment. The error bars indicate the standard error of the three replicates.
Figure 4.
Mass loss of green and rooibos teas relative to the initial weights during the Maximum Leaching Experiment. The error bars indicate the standard error of the three replicates.

Figure 5.
Potential contribution of leaching loss to the mass loss of green and rooibos teas. Different letters on the graph indicate significant differences among the data for the upper bounds and lower bounds, determined using Tukey’s HSD followed by one-way ANOVA (p < 0.001; F = 30.1 and 35.5 in upper and lower bounds, respectively; log-transformed data were used). G, green tea. R, rooibos tea.

Figure 6.
Effects of mesh size on mass loss relative to the initial weight in (a) a mixed forest and (b) a Japanese cedar plantation. 0.25-m, 0.25-mm mesh woven tea bags filled with tea from nonwoven teabags (Figure A2). NW, polypropylene nonwoven tea bags with a non-uniform mesh size finer than 0.25 mm (see Figure A1). * p < 0.05, old vs. new tea bags, paired t-test using log-transformed data (n = 4).


Table 1.
Chemical properties of tea bags reported by Keuskamp et al. (2013) [3] and Duddigan et al. (2020) [4].
| Chemical Properties | Green Tea | Rooibos Tea |
|---|---|---|
| Mean ± SD | Mean ± SD | |
| Nonpolar extractives 1 | 0.066 ± 0.003 | 0.049 ± 0.013 |
| Water solubles 1 | 0.493 ± 0.021 | 0.215 ± 0.009 |
| Acid solubles 1 | 0.283 ± 0.017 | 0.289 ± 0.040 |
| Acid insoluble 1 | 0.156 ± 0.009 | 0.444 ± 0.040 |
| Total C (%) 1 | 49.055 ± 0.109 | 50.511 ± 0.286 |
| Total N (%) 1 | 4.019 ± 0.049 | 1.185 ± 0.048 |
| Alkyl C 2 | 0.230 ± 0.032 | 0.152 ± 0.044 |
| O-alkyl C 2 | 0.570 ± 0.003 | 0.714 ± 0.018 |
| Aromatic C 2 | 0.146 ± 0.020 | 0.102 ± 0.017 |
| Carbonyl C 2 | 0.054 ± 0.009 | 0.032 ± 0.009 |
Table 2.
Results of three-way ANOVA testing the impacts of temperature, submergence duration (time), and tea type (tea) on mass loss of green and rooibos teas relative to the initial weights during the Maximum Leaching Experiment. Log-transformed data were used for ANOVA.
Table 2.
Results of three-way ANOVA testing the impacts of temperature, submergence duration (time), and tea type (tea) on mass loss of green and rooibos teas relative to the initial weights during the Maximum Leaching Experiment. Log-transformed data were used for ANOVA.
| Source | Degree of Freedom | F Value | p Value |
|---|---|---|---|
| temperature | 2 | 26.3 | p < 0.001 |
| time | 2 | 210.8 | p < 0.001 |
| tea | 1 | 973.2 | p < 0.001 |
| Temperature × time | 4 | 8.3 | p < 0.001 |
| Temperature × tea | 2 | 1.6 | 0.21 |
| time × tea | 2 | 10.6 | p < 0.001 |
| three factors | 4 | 1.0 | 0.40 |
Publisher’s Note: MDPI stays neutral with regard to jurisdictional claims in published maps and institutional affiliations. |
© 2021 by the authors. Licensee MDPI, Basel, Switzerland. This article is an open access article distributed under the terms and conditions of the Creative Commons Attribution (CC BY) license (http://creativecommons.org/licenses/by/4.0/).
Share and Cite
MDPI and ACS Style
Mori, T.; Aoyagi, R.; Taga, H.; Sakai, Y. Effects of Water Content and Mesh Size on Tea Bag Decomposition. Ecologies 2021, 2, 175-186. https://0-doi-org.brum.beds.ac.uk/10.3390/ecologies2010010
AMA Style
Mori T, Aoyagi R, Taga H, Sakai Y. Effects of Water Content and Mesh Size on Tea Bag Decomposition. Ecologies. 2021; 2(1):175-186. https://0-doi-org.brum.beds.ac.uk/10.3390/ecologies2010010
Chicago/Turabian StyleMori, Taiki, Ryota Aoyagi, Hiroki Taga, and Yoshimi Sakai. 2021. "Effects of Water Content and Mesh Size on Tea Bag Decomposition" Ecologies 2, no. 1: 175-186. https://0-doi-org.brum.beds.ac.uk/10.3390/ecologies2010010