Hydrogen and Oxygen Production via Water Splitting in a Solar-Powered Membrane Reactor—A Conceptual Study


1
Department of Fusion and Technology for Nuclear Safety and Security, ENEA, C.R. Frascati, via E. Fermi 45, 00044 Frascati, Italy
2
Department of Energy Technologies, ENEA, C.R. Casaccia, via Anguillarese 301, 00123 Rome, Italy
*
Author to whom correspondence should be addressed.
Hydrogen 2021, 2(1), 18-32; https://0-doi-org.brum.beds.ac.uk/10.3390/hydrogen2010002
Submission received: 6 October 2020
/
Revised: 29 December 2020
/
Accepted: 29 December 2020
/
Published: 7 January 2021
Abstract
:Among the processes for producing hydrogen and oxygen from water via the use of solar energy, water splitting has the advantage of being carried out in onestep. According to thermodynamics, this process exhibits conversions of practical interest at very high temperatures and needs efficient separation systems in order to separate the reaction products, hydrogen and oxygen. In this conceptual work, the behavior of a membrane reactor that uses two membranes perm-selective to hydrogen and oxygen is investigated in the temperature range 2000–2500 °C of interest for coupling this device with solar receivers. The effect of the reaction pressure has been evaluated at 0.5 and 1 bar while the permeate pressure has been fixed at 100 Pa. As a first result, the use of the membrane perm-selective to oxygen in addition to the hydrogen one has improved significantly the reaction conversion that, for instance, at 0.5 bar and 2000 °C, moves from 9.8% up to 18.8%. Based on these critical data, a preliminary design of a membrane reactor consisting of a Ta tubular membrane separating the hydrogen and a hafnia camera separating the oxygen is presented: optimaloperating temperature of the reactor results in being around 2500 °C, a value making impracticable its coupling with solar receivers even in view of an optimistic development of this technology. The study has verified that at 2000 °C with a water feed flow rate of 1000 kg h−1 about 200 and 100 m3 h−1 of hydrogen and oxygen are produced. In this case, a surface of the hafnia membrane of the order of hundreds m2 is required: the design of such a membrane device may be feasible when considering special reactor configurations.
1. Introduction
Future challenges of mankind shall address the continuous growth of energy demand and contain as much as possible its environmental impact in order to guarantee the best quality life and wellness of the population. This objective can be reached through a progressive penetration in the world energy scenario of renewable sources. Currently, these energy sources are represented mainly by hydro while in the near future wind and solar photovoltaics are expected to exhibit a very high growth rate. In 2017 from a total of 6350 TWh of electricity generated by renewables, about 1519 TWh came from wind and solar PV while, under the most conservative scenario called “current policies”, in 2040 the share of electricity coming from wind and solar will increase to 6635 TWh out of a total from renewables of 14,261 TWh [1].
Among the renewable energy sources, both wind and solar are not continuous and their convenient exploitation has to foresee the use of efficient energy storage systems. The production of hydrogen from renewables (power-to-hydrogen) is a promising solution for storing this kind of energy and achieving a 100% renewable and sustainable hydrogen economy [2]. In turn, hydrogen can be used to produce energy and, although hydrogen produces zero-carbonemission at the end-use point, its origin from renewables is essential to consider it as clean all along the energy chain.
The direct production of hydrogen via thermal splitting of water by using solar energy is a process that could comply with the power-to-hydrogen strategies. Positively it is a one-step process, but it faces severe technological hurdles: first, the need to operate at very high temperature. The water splitting reaction and its enthalpy in the gas phase are given by the following expressions:
H2O = H2 + 0.5 O2 ΔH298K = 241.8 kJ mol−1
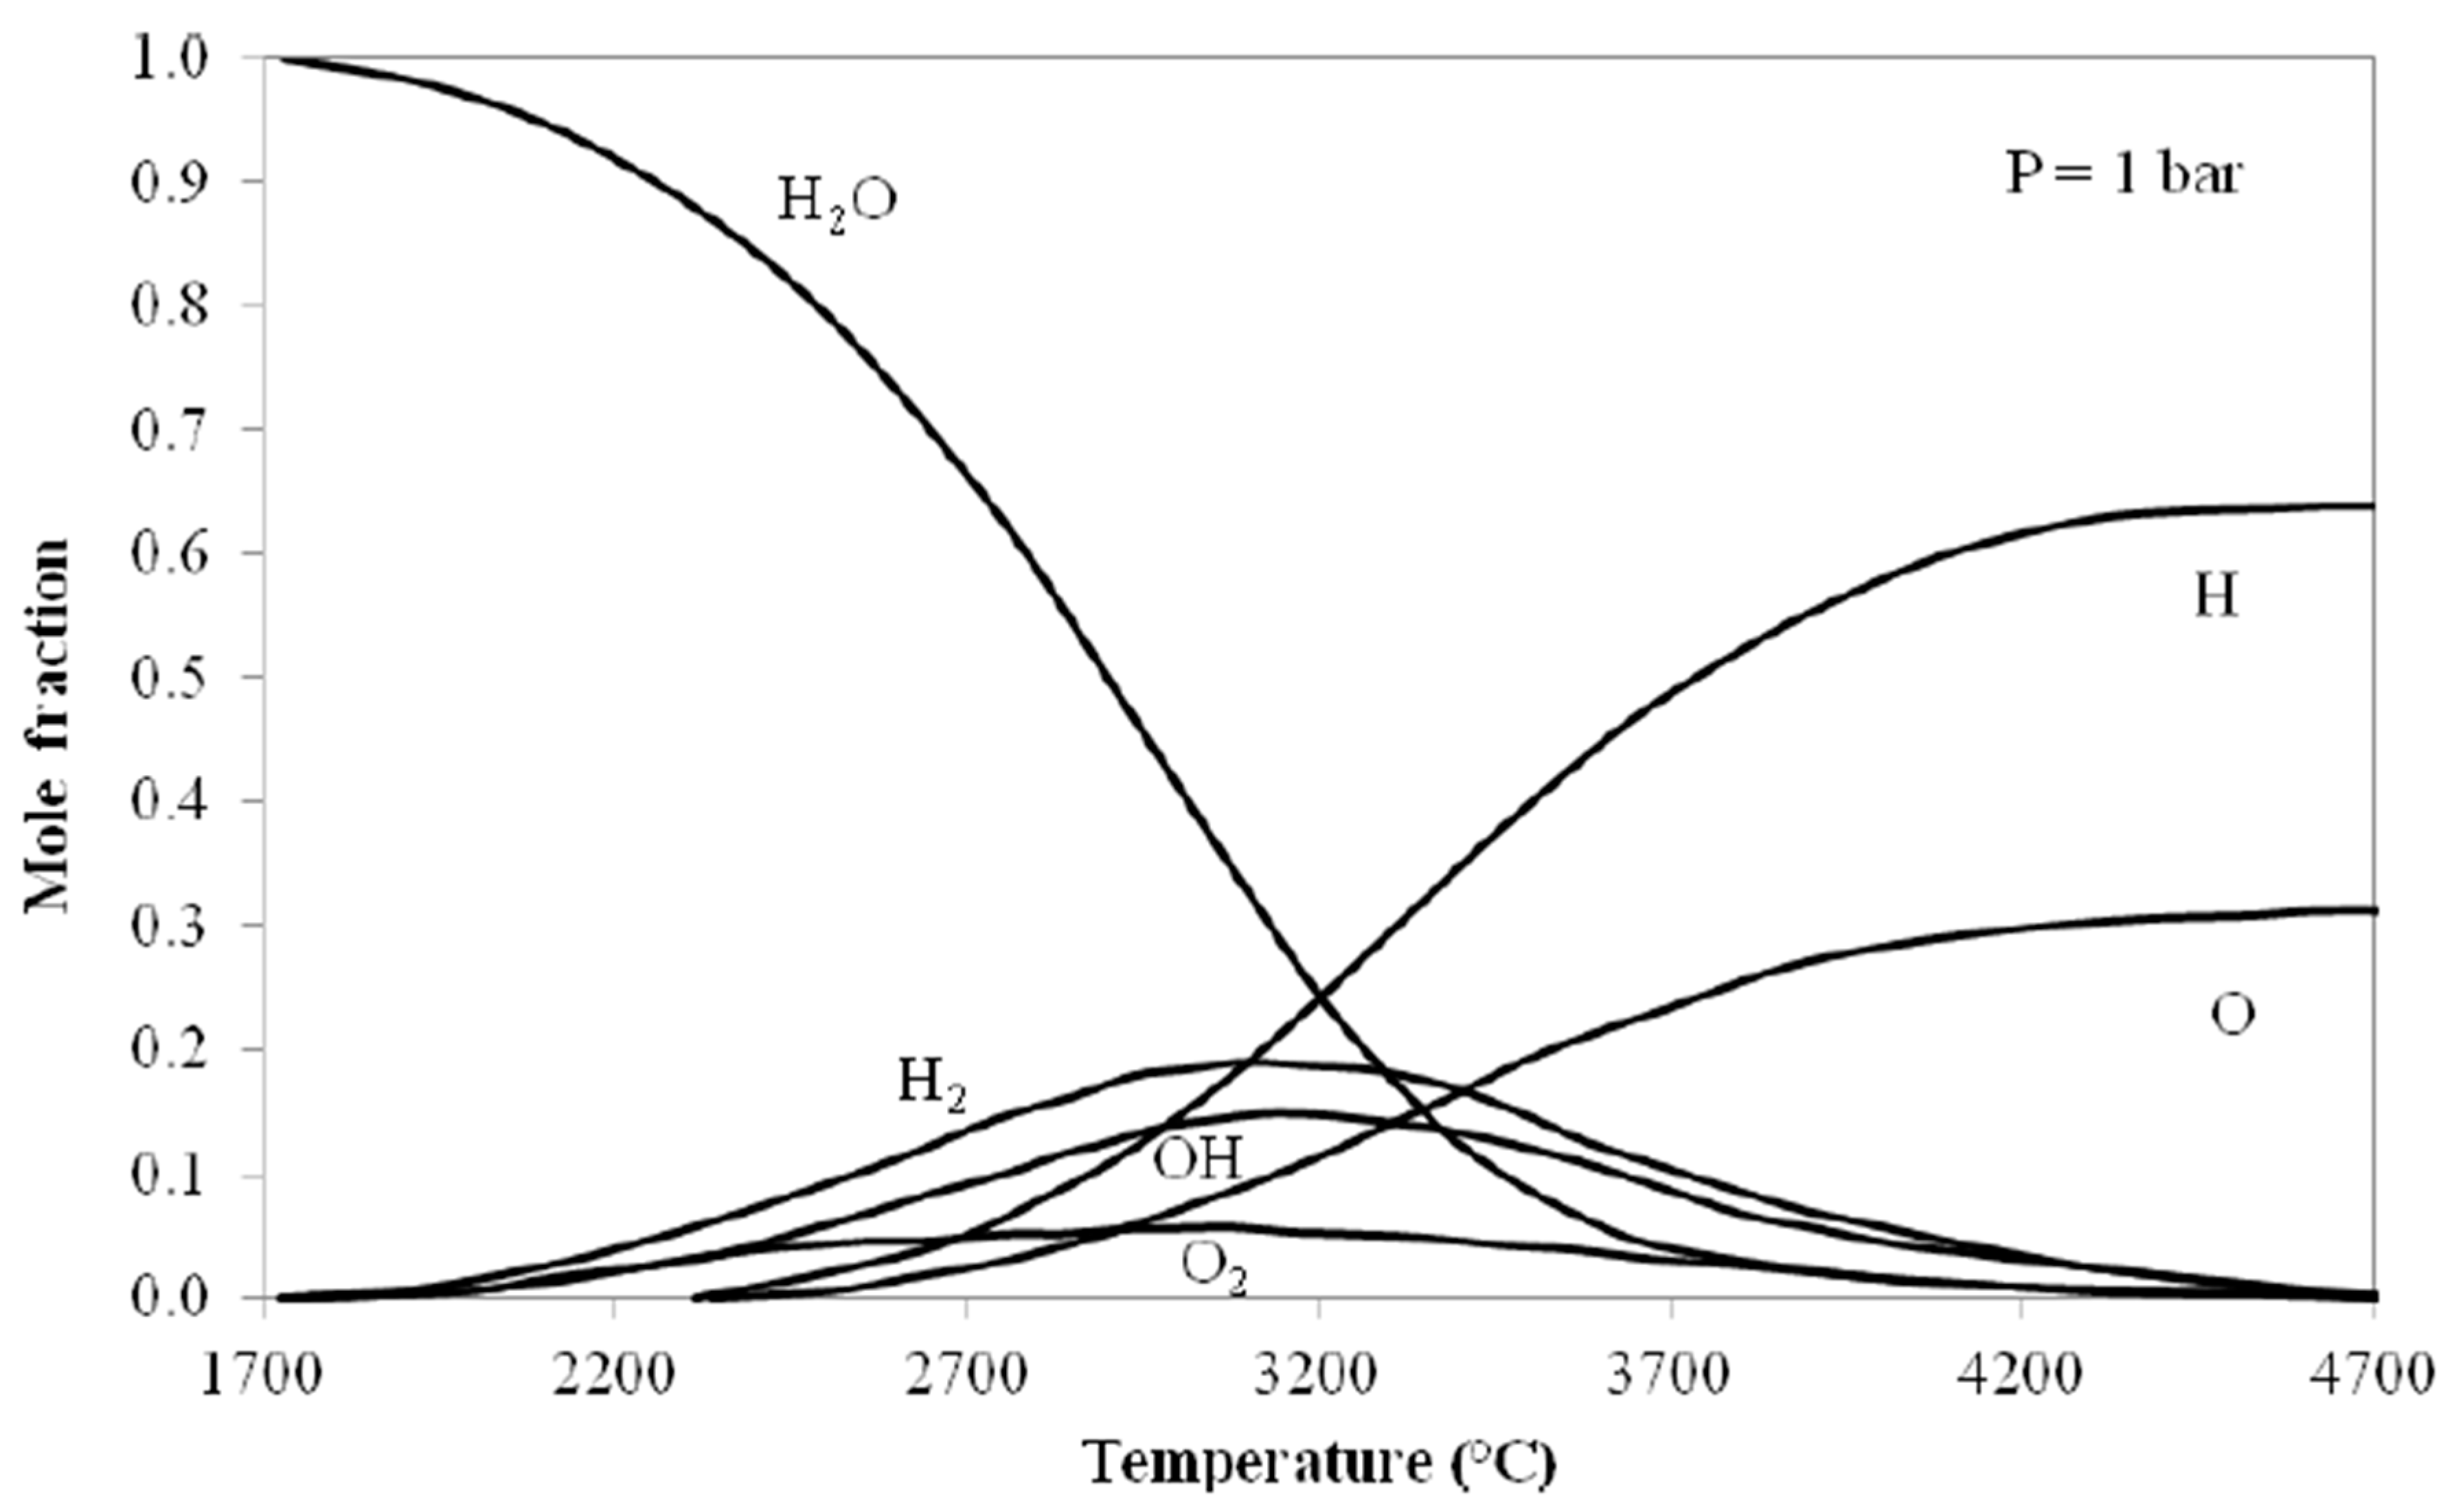
The ΔG reduces from 228.6 to 61.3 kJ mol−1 moving the temperature from 25 to 3000 °C: as shown in Figure 1 [3], molar fractions of hydrogen of practical interest (higher than 20%) may be attained only at temperatures over 3000 °C.
Presently, solar receivers work at temperatures lower than those required by the thermodynamics of the reaction (1). Most promising power generation systems use concentrating solar power (CSP) technologies that include [4]: (i) parabolic trough collectors (PTC) consisting of parabolic-shaped mirrors that concentrate incoming sunlight onto a central receiver tube at the focal line of the collector, (ii) linear Fresnel collectors (LFCs) that are similar to parabolic trough collectors but use a series of long flat, or slightly curved mirrors placed at different angles to concentrate the sunlight on either side of a fixed receiver (made of a long, selectively-coated absorber tube), (iii) solar towers using a ground-based field of mirrors to focus direct solar irradiation onto a receiver, and (iv) stirling dish system consisting of a parabolic dish-shaped concentrator (like a satellite dish) that reflects direct solar irradiation onto a receiver (e.g., a stirling engine or a micro-turbine) at the focal point. The operating conditions (thermal power and temperature) of the CSP systems are summarised in Table 1 [4,5].
Higher temperatures (1300 °C) are reported to be achievable by the “solar tower reflector”, systems where a tower receives the radiation from a heliostat field and, through a reflector installed at its top, redirects the concentrated solar radiation downward to a ground-level receiver [6].
Finally, from the development of innovative receivers for solar towers a further increase of the operating temperature is expected. The ceramic plat receiver is a pilot-phase technology able to guarantee the stability (in air) up to 1500 °C, while higher temperatures are expected to be achieved with further development of liquid metal receivers [7].
The other important aspect reported in literature concerns the need for thermochemical water splitting reactors of adopting a system for separating the hydrogen produced [8]. In the theoretical analysis performed in 1979, Diver and Fletcher considered the use of membranes capable of separating selectively the hydrogen through a transport model based on the Knudsen flow regime. These authors claimed the production of 6.9 mol s−1 of hydrogen at about 2500 °C from water with a membrane surface of 0.3 m2 [9]. For such a reactor, the membrane material has to be selected among the metals that exhibit high hydrogen permeability values and, at the same time, capability to operate at very high temperature (namely up to 2000 °C and over). In general, the refractory metals could be promising candidates for these applications [10] and, in particular, Ta tubes could be used as described in the case study of this paper.
When the hydrogen permeable membrane is integrated into the reactor to realize a “membrane reactor”, it is possible to increase the reaction conversion thanks to the well-known “shift effect” of the membrane [11]. In a membrane reactor, the reaction is pushed forward in order to balance the continuous removal of one (or more) reaction product(s) across the membrane: in such a way, high reaction conversions can be achieved, even beyond thermodynamic equilibrium values. The driving force of hydrogen permeation through metals is given by the difference of the square root of the hydrogen partial pressure up- and down-stream of the membrane walls [12]. Since the water splitting is thermodynamically promoted at low pressure, the efficient exploitation of a membrane reactor cannot be obtained by increasing the up-stream (feed) pressure but lowering the down-stream pressure as low as possible, e.g., by vacuum pumping. Recently, a solar membrane reactor using a hydrogen permeable membrane has been studied by C. Sui et al.: a conversion rate of 87.8% at 1500 °C has been calculated although the operating conditions adopted (pumping level on the permeated side of 1 Pa) seems practically unfeasible [13]. In fact, at values of vacuum pumping below the range 100–1000 Pa, the costs and sizes of pumping systems become too high for industrial applications.
Once it has been established that the use of one membrane capable of removing the hydrogen can improve the conversion of the water splitting reactor, it is worth investigating the effect of using simultaneously two membranes selectively permeable to hydrogen and oxygen, respectively [14]. This work analyses a membrane reactor that consists of two membranes (for separating respectively hydrogen and oxygen) and evaluates the conversion of the water splitting reaction at temperatures close to those of next-generation CPS systems.
2. Thermodynamics of Water Splitting
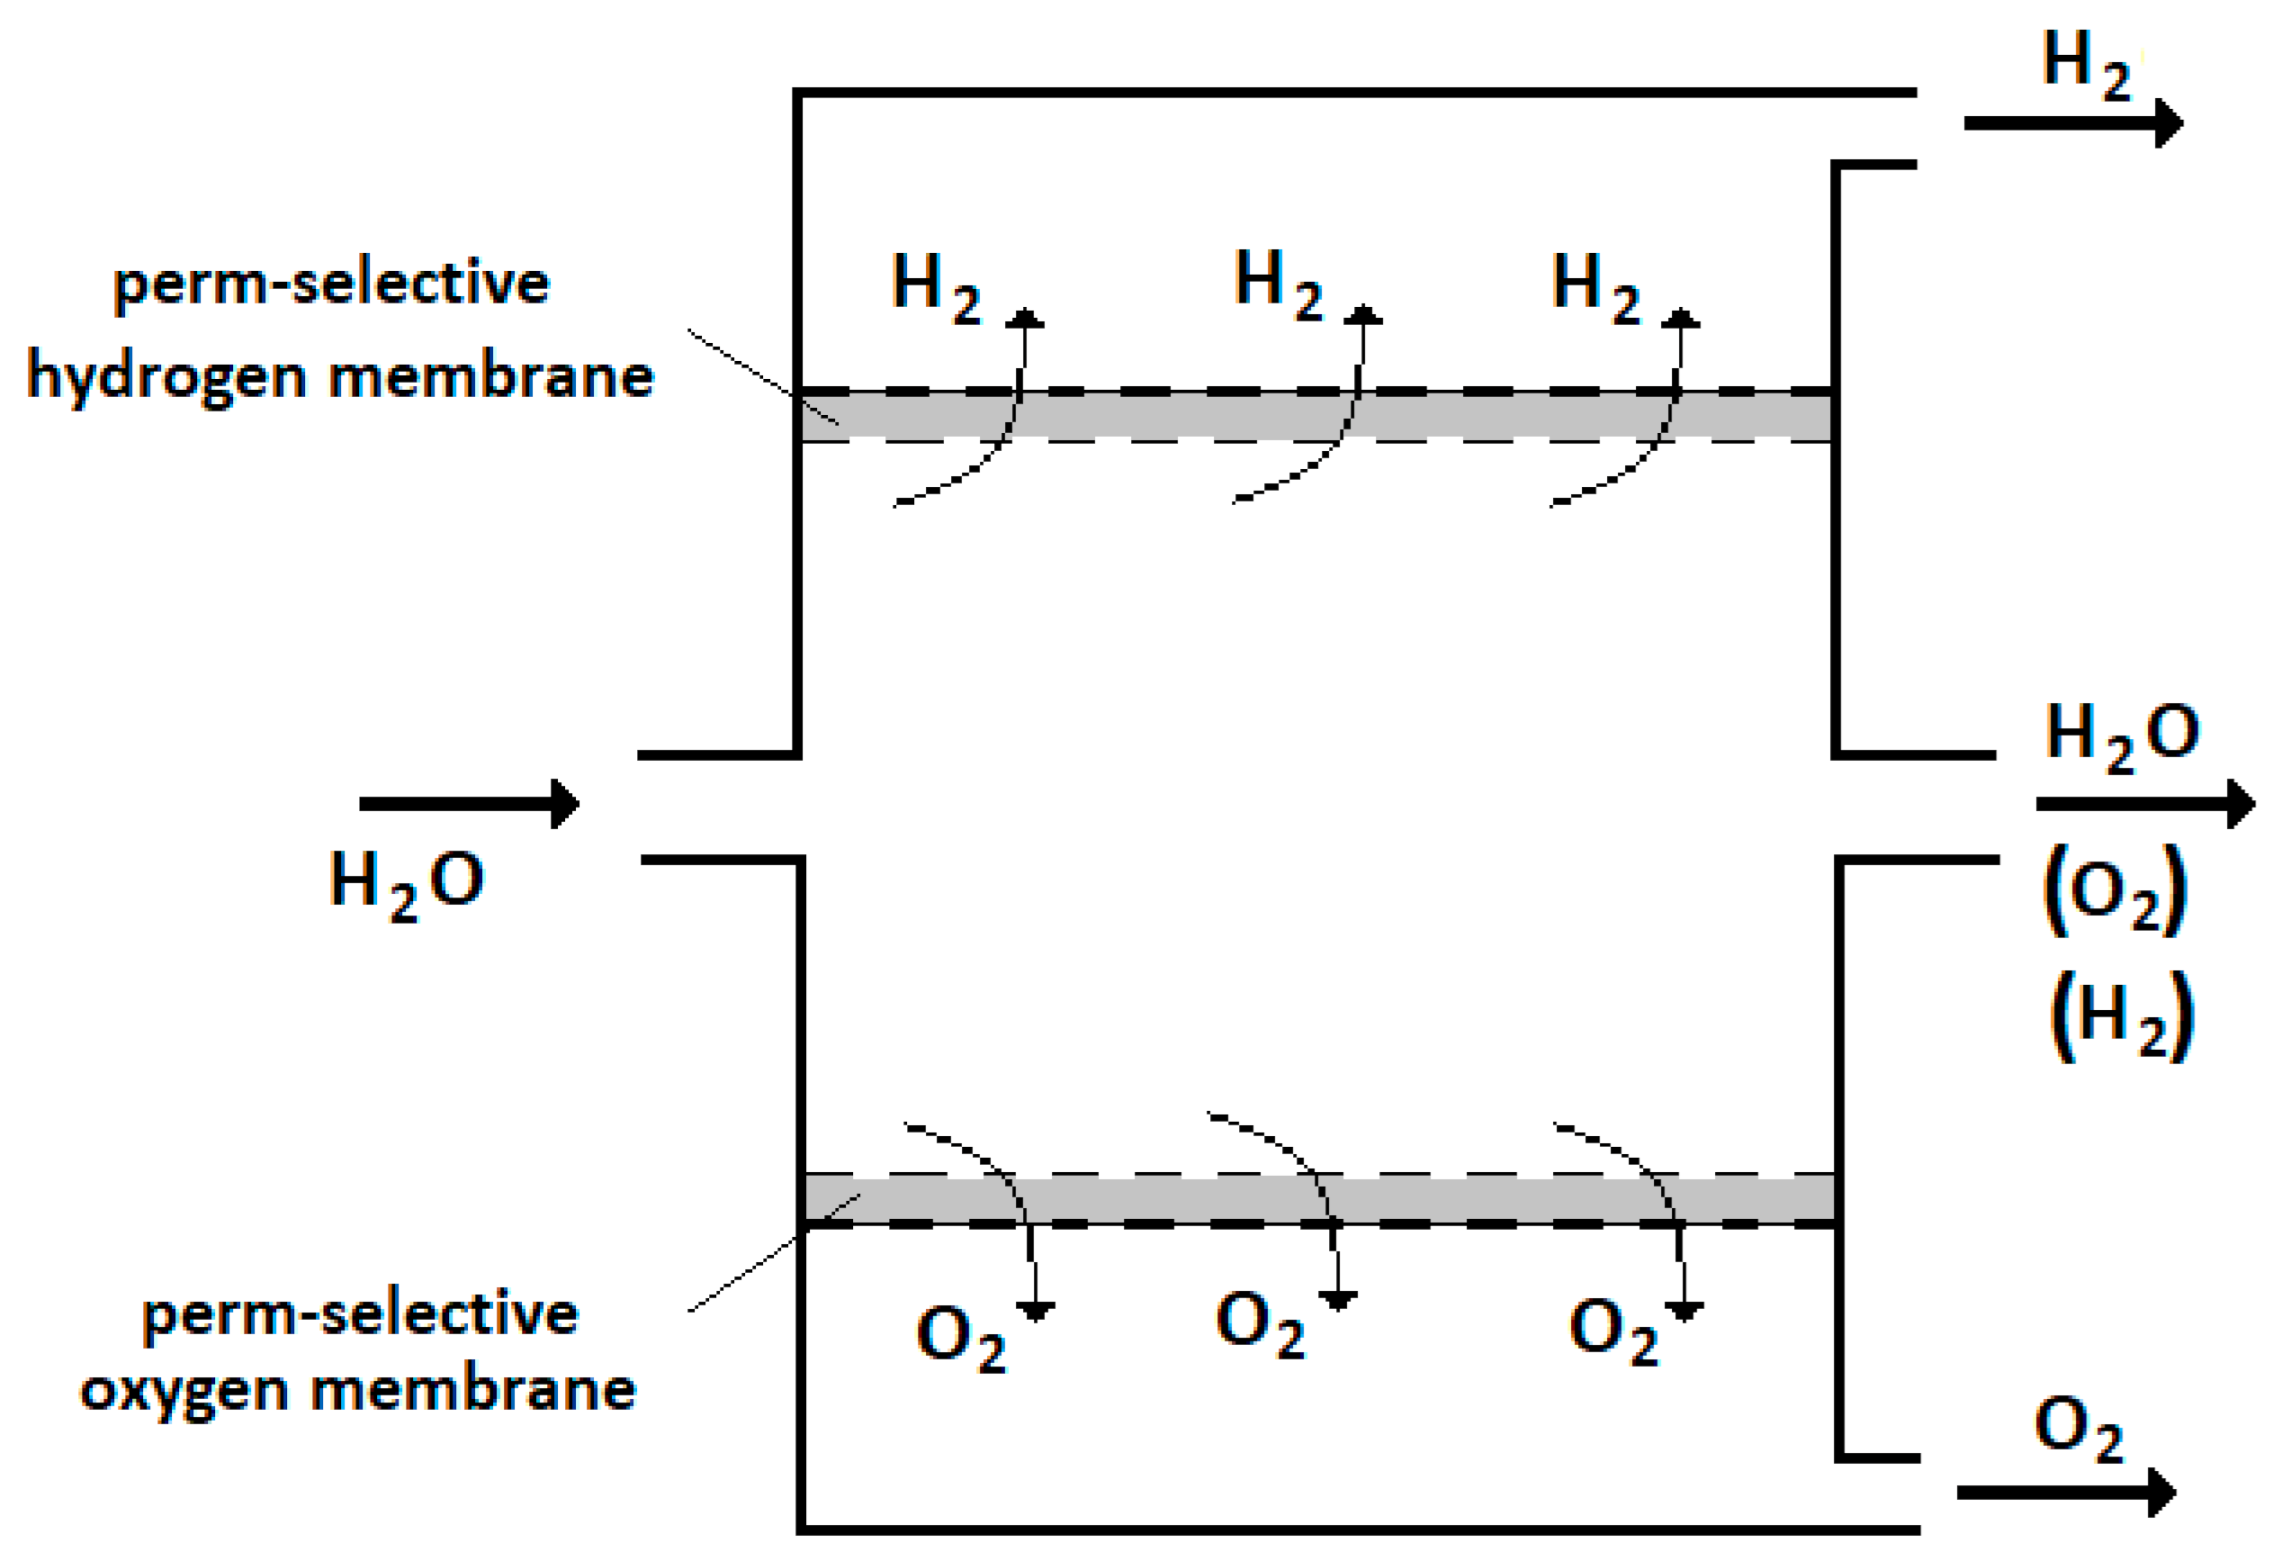
The membrane reactor schematically represented in Figure 2 is the object of this study. This device consists of a main chamber where the water fed reacts to produce hydrogen and oxygen that are separated by two selective membranes and then extracted via vacuum pumping. This membrane reactor has two permeate streams (one for the hydrogen and the other for the oxygen) and a retentate stream where the un-reacted water and the hydrogen and the non-permeated oxygen are collected.
For the reaction in gas phase (1), the equilibrium constant expressed in terms of partial pressure (Kp) is given by:
where is the standard Gibbs free energy change (J mol−1) of the reaction (1), R is the gas constant (8.31 J mol−1 K−1) and T (K) is the temperature.
In turn, Kp is defined by the expression:
where P denotes the partial pressure (bar) of each gas divided by the pressure at standard state (1 bar) and consequently Kp results dimensionless.
When expressed in terms of mole fractions, the equilibrium constant is:
where , and represent the mole fractions of oxygen, hydrogen and water, respectively.
The relationship between the two equilibrium constants is:
where P (dimensionless) is calculated as the reaction pressure (bar) divided by the pressure at standard state (1 bar). The equilibrium constant expressed in terms of mole fractions has been calculated along the temperature at different pressures by using the code Asther [15].
2.1. Use of a Traditional Reactor
The reaction conversion α is defined as the fraction of the reagent (water in this case) that is converted into the products (hydrogen and oxygen). In a traditional reactor, once Kx is known, the values of α can be calculated through the Formula (4) where the mole fractions of the reagent (water) and the products (hydrogen and oxygen) are obtained from the mass balances reported in the Appendix A.
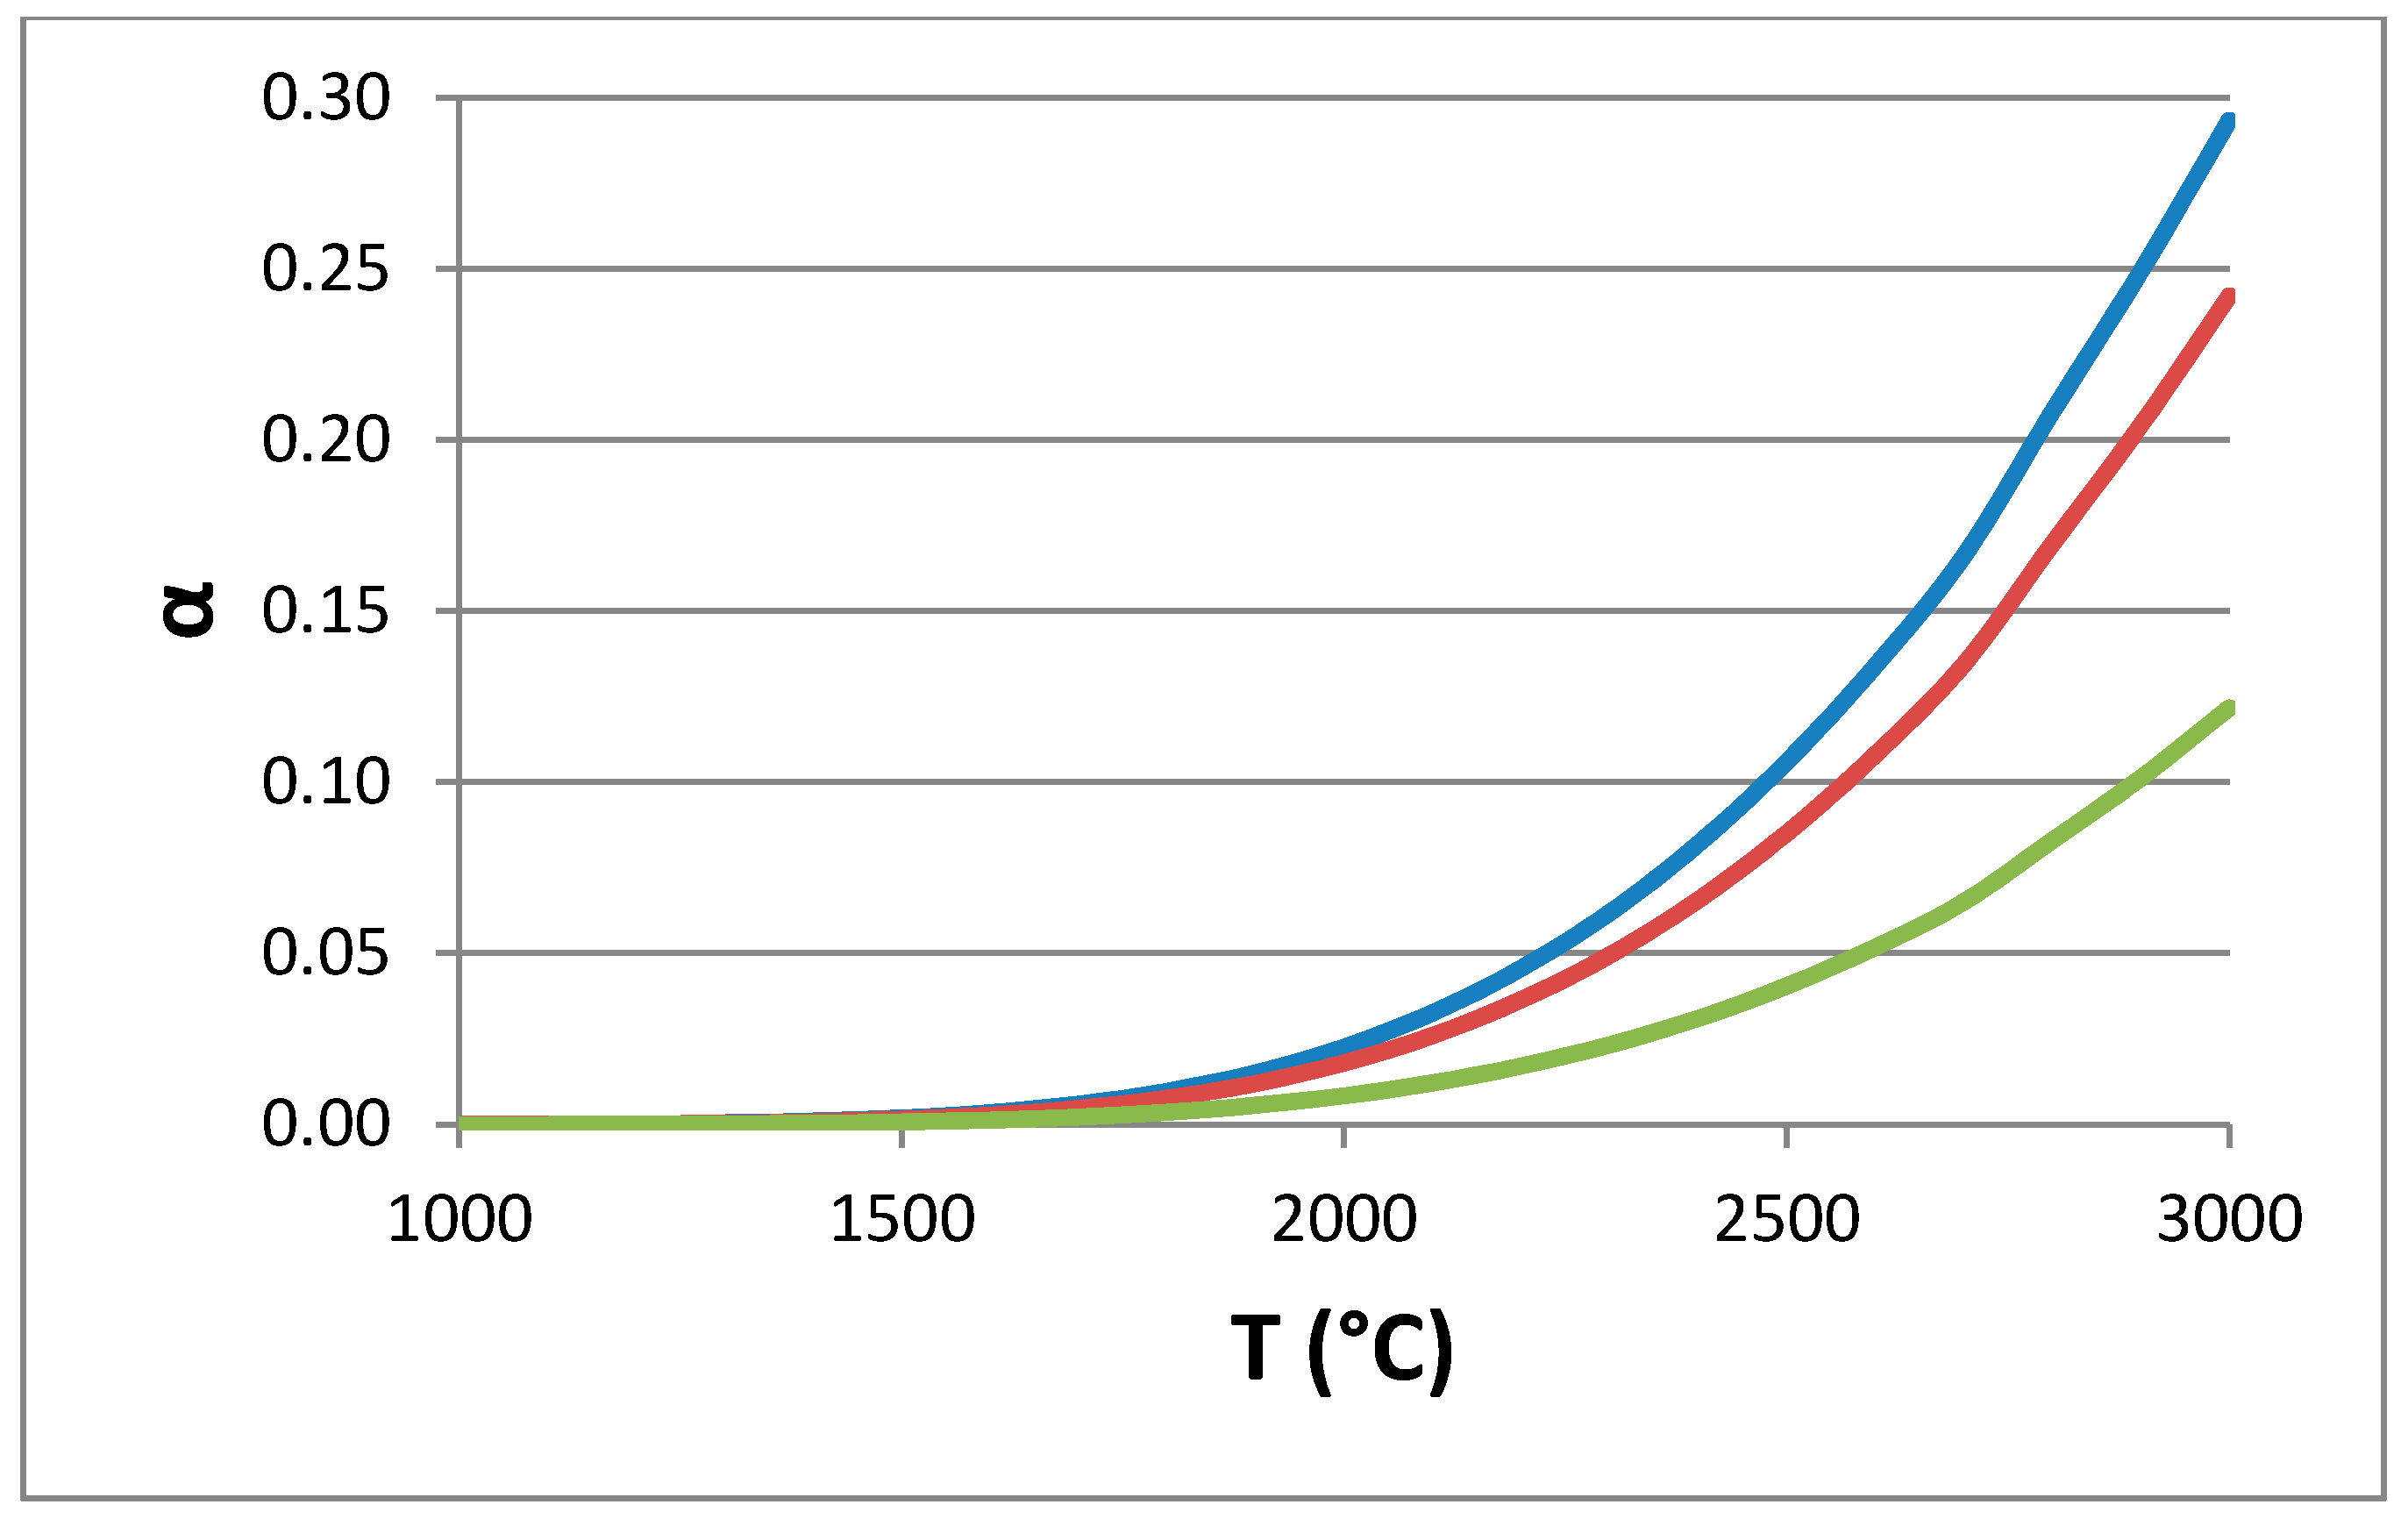
For the case of a traditional reactor, the conversion of the water splitting has been assessed vs. the temperature for the pressures of 0.5, 1 and 10 bar, as reported in Figure 3. This behavior is in agreement with the thermodynamics of reaction (1) that is very endothermic: it is promoted by a reduction of the pressure since it proceeds with an increase of moles. Practically, below 1500 °C negligible values of reaction conversion are assessed. At 2000 °C the conversion assumes values of a few percent making unfeasible any practical application also in an optimistic view of future development of solar tower technology as described in the Introduction. As anticipated, the reaction conversion reduces with the pressure: values around 20% are obtained at 2800 and 2900 °C for the pressures of 0.5 and 1 bar, respectively, while at 10 bar and 3000 °C the conversion is about 12%.
The following analysis dedicated to the case of a membrane reactor has been limited to the operating pressures of 0.5 and 1 bar: as will be discussed below, although below 0.5 bar higher reaction conversions are expected; in a membrane reactor the reduction of the reaction pressure introduces a dramatic increase of the membrane area and the costs as well. On the other hand, investigation over 1 bar is not of practical interest since the reaction conversion is too low.
2.2. Use of Membrane Reactors
In a membrane reactor, a fraction of the products (hydrogen and oxygen) is extracted via selective membranes. Hereafter, η and ε are respectively the fraction of hydrogen and oxygen separated by the membranes (also called “membrane separation efficiency”). They are defined as follows:
The mass balances are modified for the case of a membrane reactor by accounting for the separation of a fraction of hydrogen (η) and oxygen (ε) as reported in Appendix A.
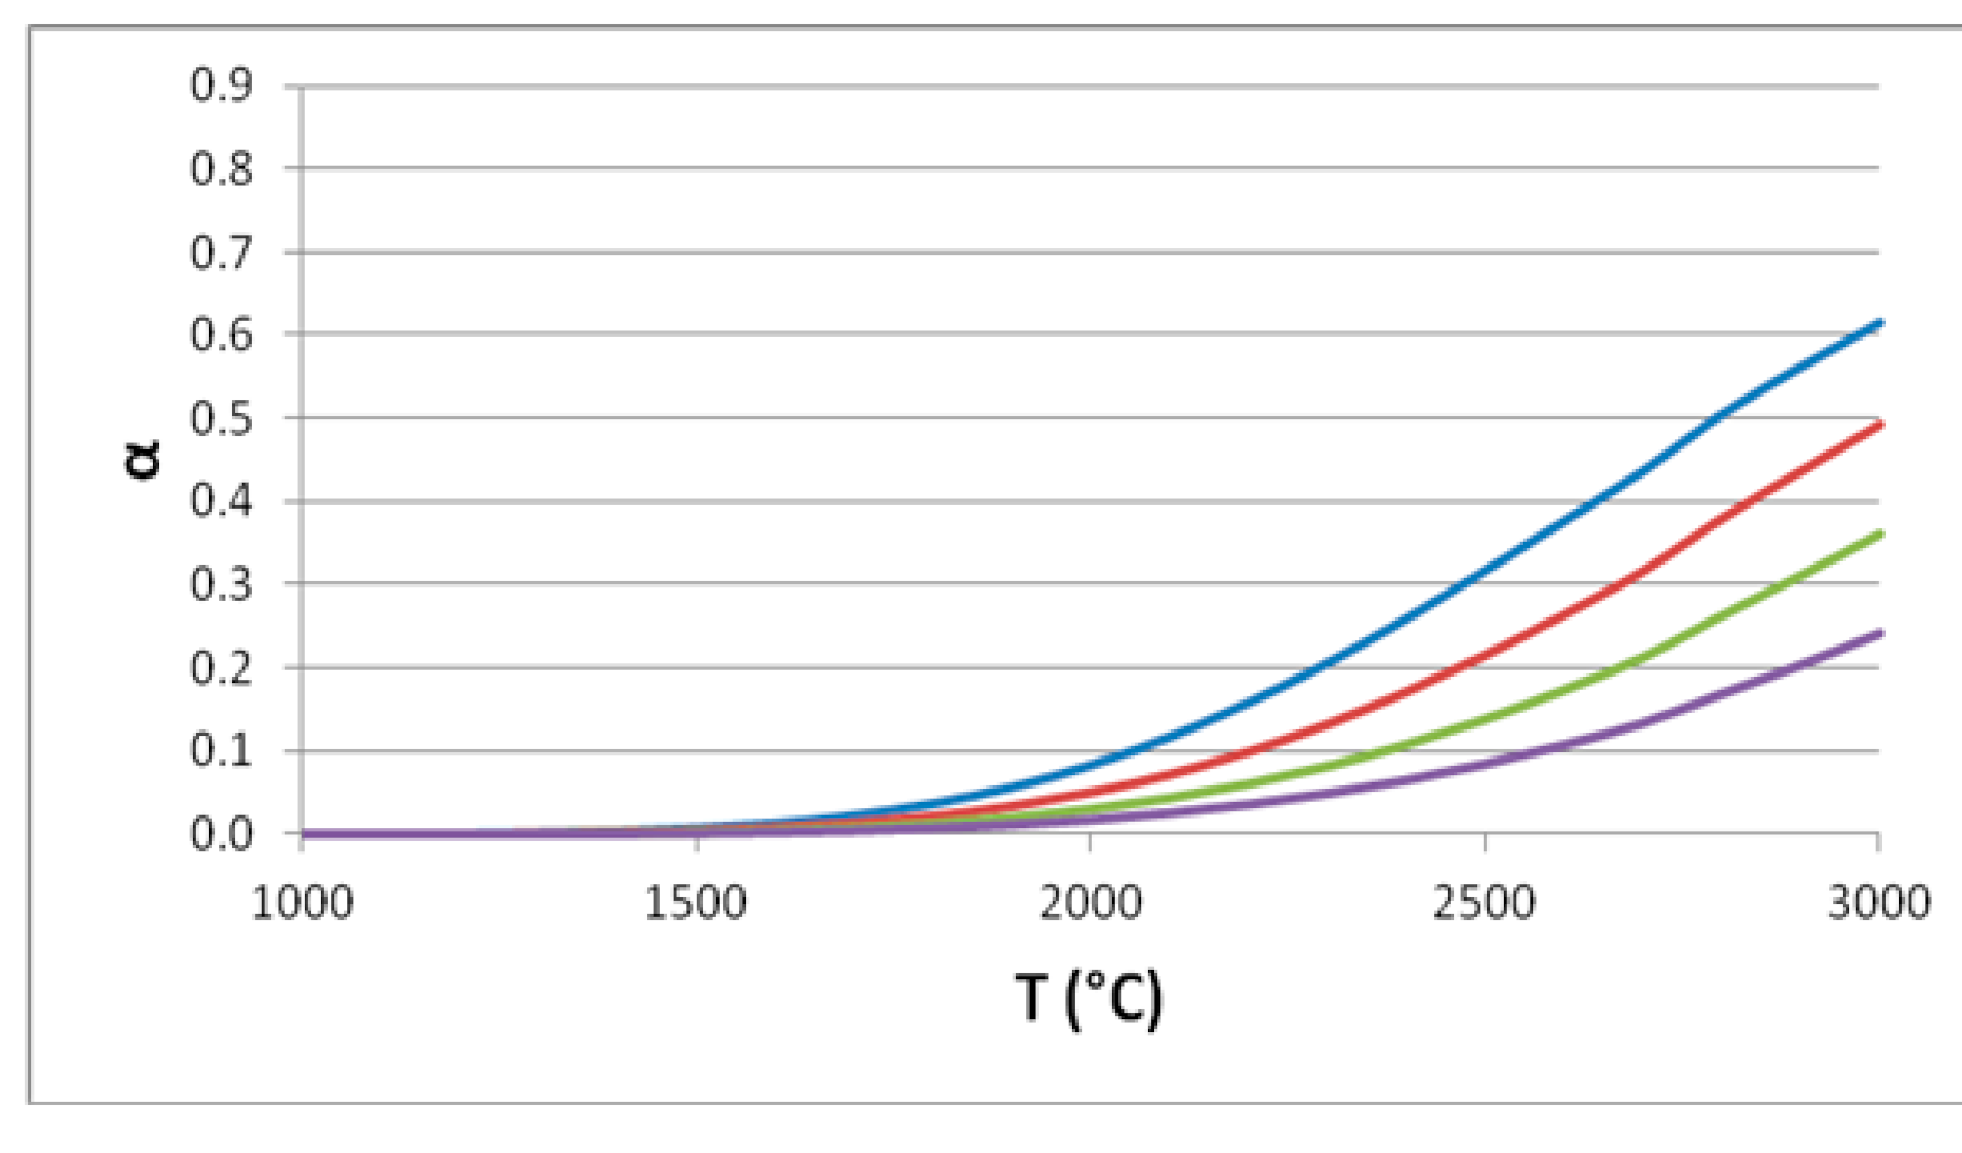
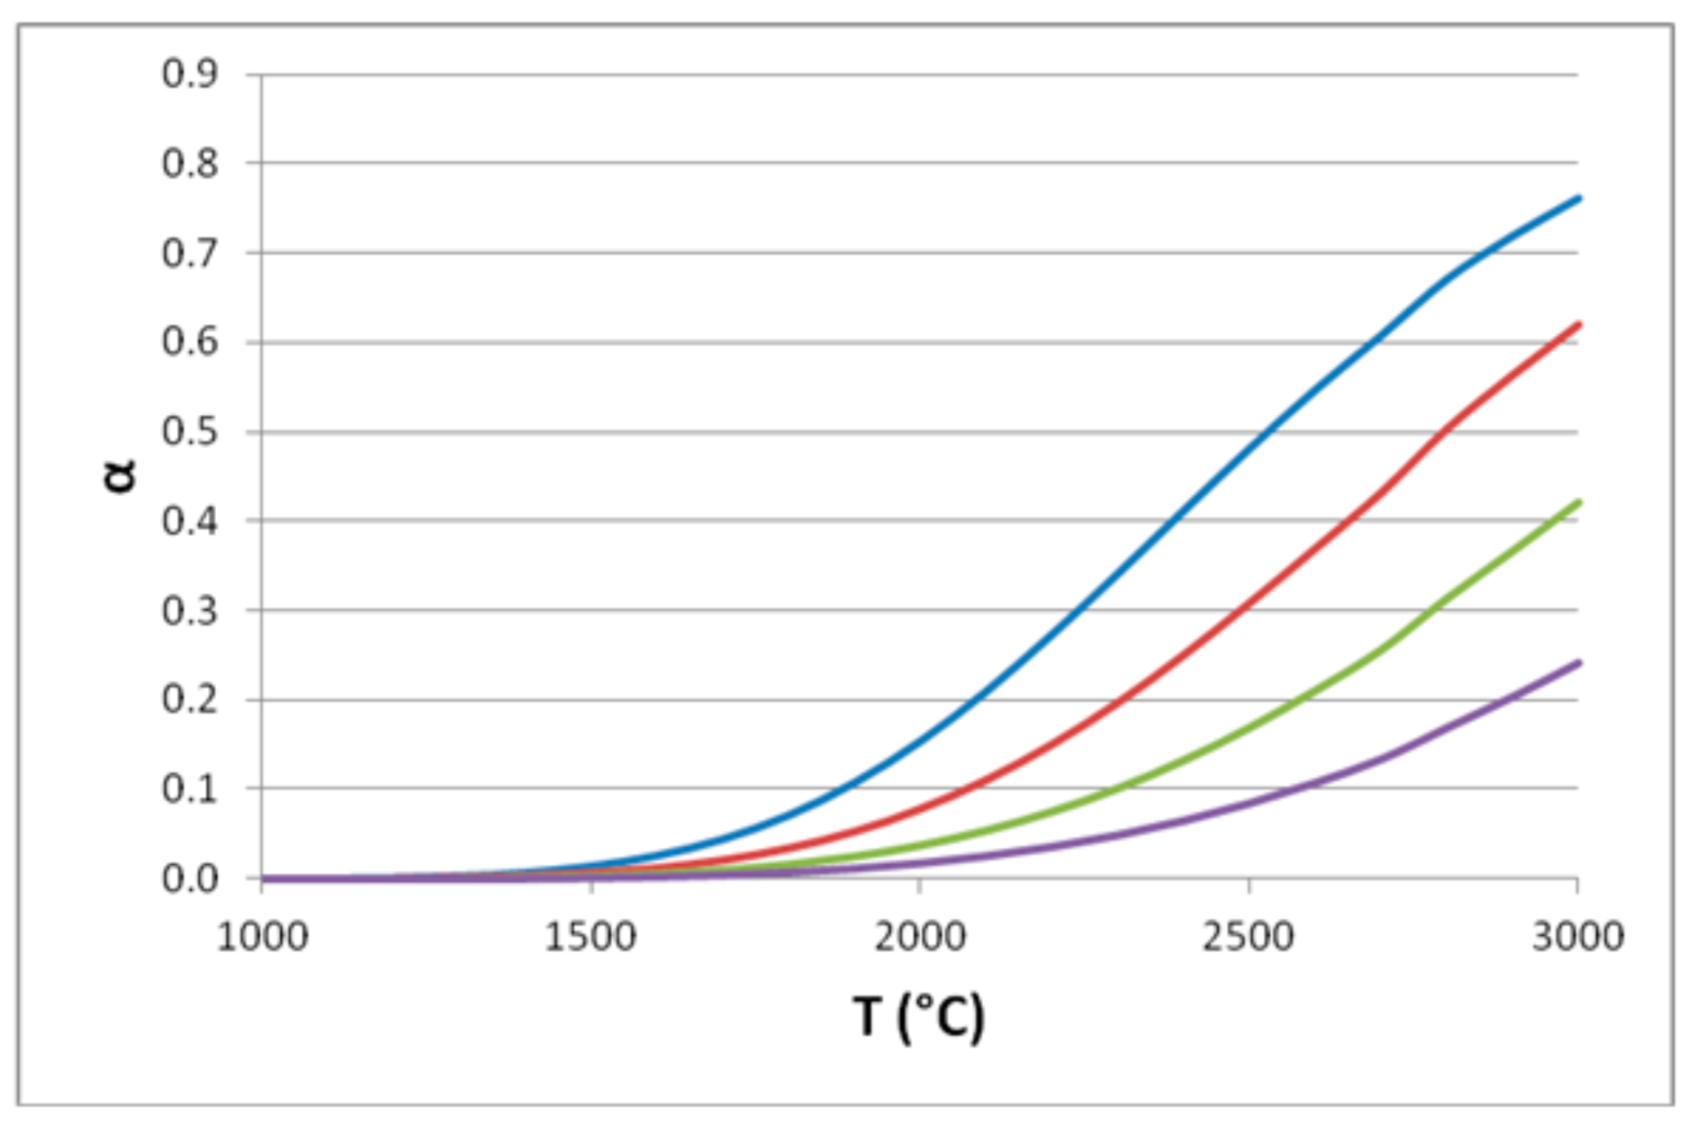
The reaction conversion has been calculated in the temperature range of 1000–3000 °C at 0.5 and 1 bar for the cases of using: (i) only one membrane (separating only hydrogen or only oxygen), and (ii) two membranes separating simultaneously both hydrogen and oxygen.
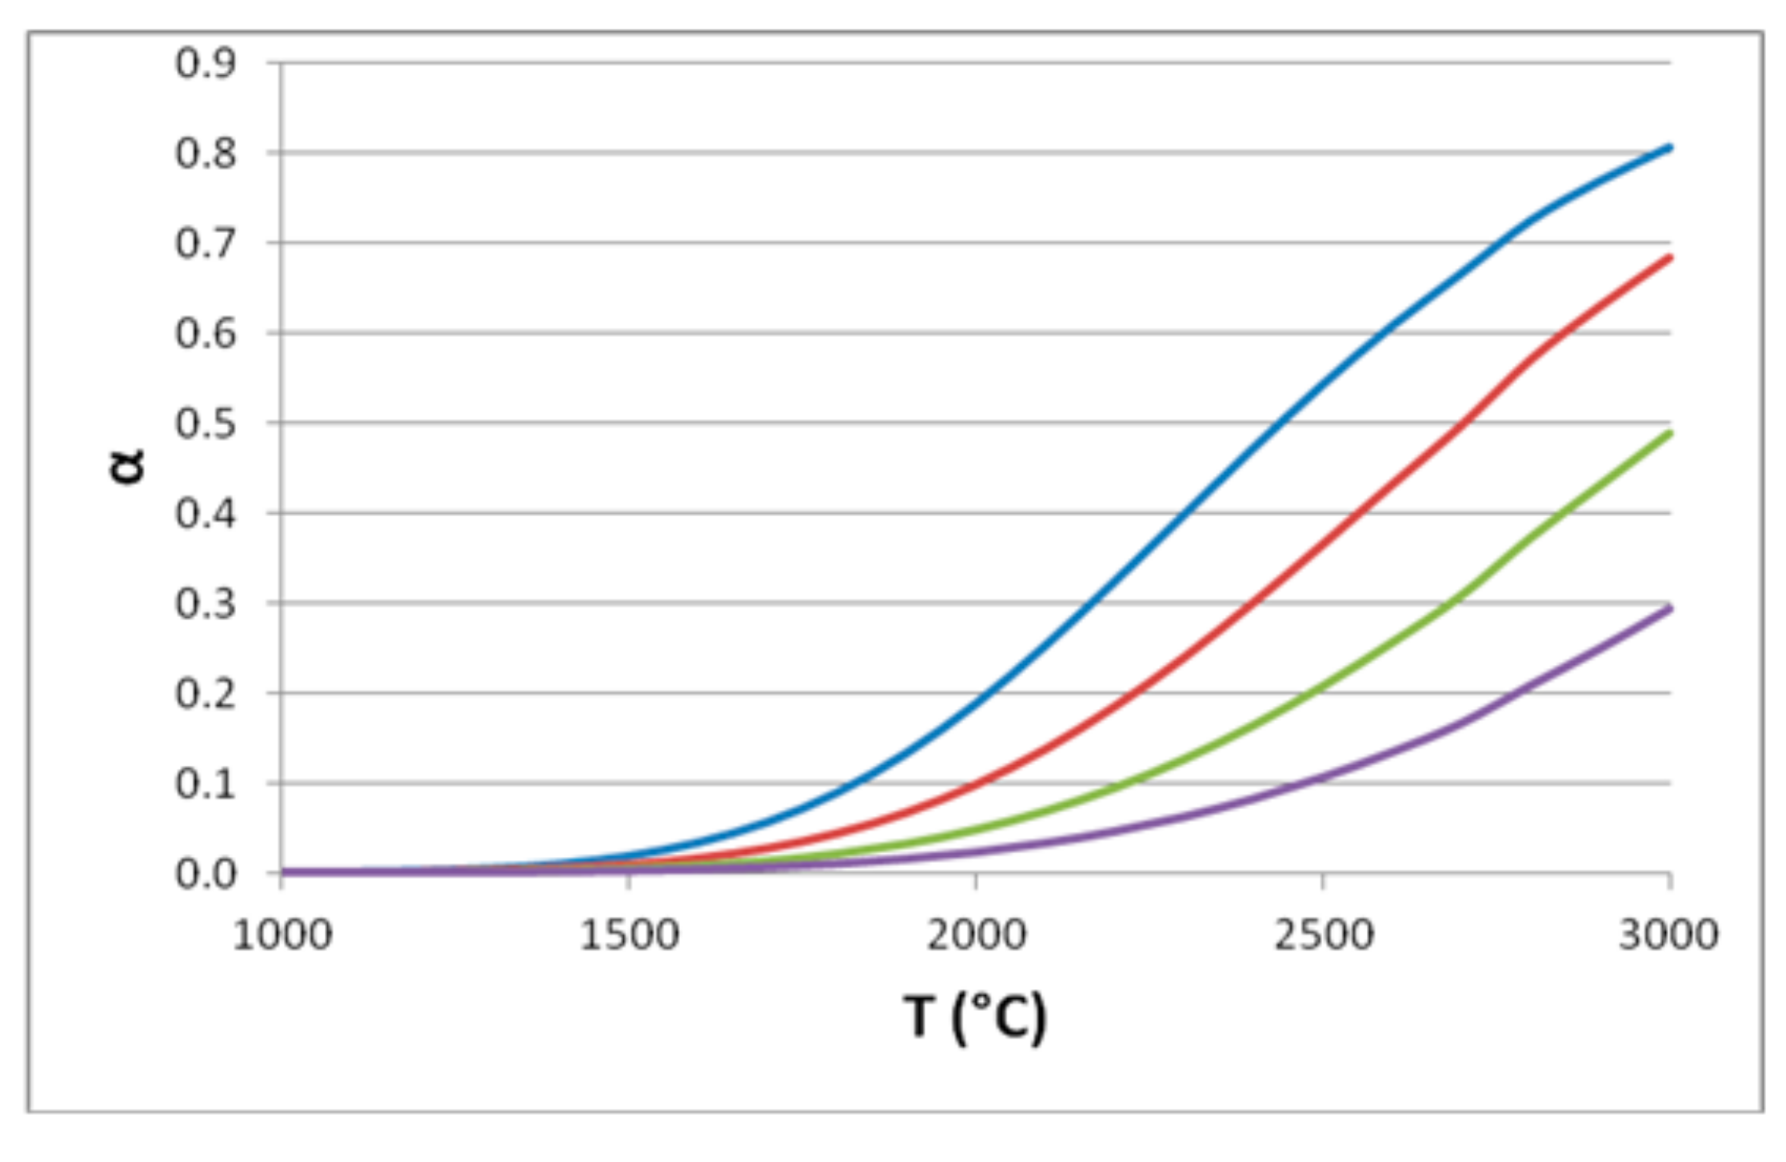
In designing a membrane reactor, separation efficiencies around 80% are generally assumed. Higher values of separation efficiency, typically up to 90%, require larger investment costs (e.g., larger membranes and/or higher vacuum level for extracting the permeate) and, therefore, are adopted when a further increase of the reaction conversion could be required. Figure 4, Figure 5, Figure 6 and Figure 7 report the results for the pressure of 0.5 and 1, respectively, for the case of membrane separation efficiency 0.8 (0.9).
As stated by the well-known “shift effect”, the use of a membrane capable of removing the reaction products promotes the reaction conversion. From this analysis it results that the “shift effect” of the membrane starts rising from 1500 °C. In the range 1500–2000 °C, that could be of practical interest by considering the future technological developments of solar receivers, the performances of the membrane reactors overcome significantly those of the traditional one: at 2000 °C the conversion of a membrane reactor with two membranes (for hydrogen and oxygen) of efficiency 0.9 is about 15% against the value of 1.8% of the traditional reactor. Above 2000 °C, the performances of the membrane reactor configurations improve further: at 2500 °C with a membrane efficiency of 0.9 the conversion achieves about 48% when using two membranes, 30% with the membrane separating hydrogen and 17% with the membrane separating oxygen.
It is remarkable to observe that the removal of hydrogen is more effective than that of oxygen according to the stoichiometry of reaction (1) that produces 1 mole of hydrogen and only half a mole of oxygen per mole of water reacted. This effect can be deducted observing that the extraction of the hydrogen reduces the numerator of formulas (3) and (4) more than the extraction of the oxygen: being Kp and then Kx fixed at a given pressure and temperature, the system will react by converting more water (with a proportional reduction of denominator of the above formulas) when hydrogen rather than oxygen is separated by membranes. For instance, at 0.5 bar (1 bar) with a membrane efficiency of 0.8 at 2000 °C the conversion passes from 2.2% (1.8%) of a traditional reactor to 3.8% (3.1%) of a membrane reactor with an oxygen membrane, to 6.4% (5.1%) for the case of a membrane reactor with a hydrogen membrane and 10% (8.4%) when two membranes (for hydrogen and oxygen) are simultaneously used. In case the efficiency of the membranes is 0.9, the conversion values are larger than the case with efficiency 0.8 by nearly a factor of two: e.g., at 2000 °C and 0.5 bar (1 bar) when using two membranes the conversion is about 19% (15%).
As seen in detail for the case of the traditional reactor, the thermodynamics of reaction (1) foresee an inverse effect of the pressure on the reaction conversion that, indeed, increases by lowering the pressure. In the membrane reactor, this thermodynamic (inverse) effect is balanced by a (direct) effect of the pressure that promotes the permeation and then the conversion. From the comparison of Figure 4, Figure 5, Figure 6 and Figure 7 it is evident only the thermodynamic (inverse) effect while the “membrane direct effect” cannot be noted here since this analysis is carried out by fixing the membrane efficiency (0.8 or 0.9). The thermodynamic inverse effect will be evident in the next paragraph where it is shown that the membrane reactor needs larger membrane areas when lowering the pressure.
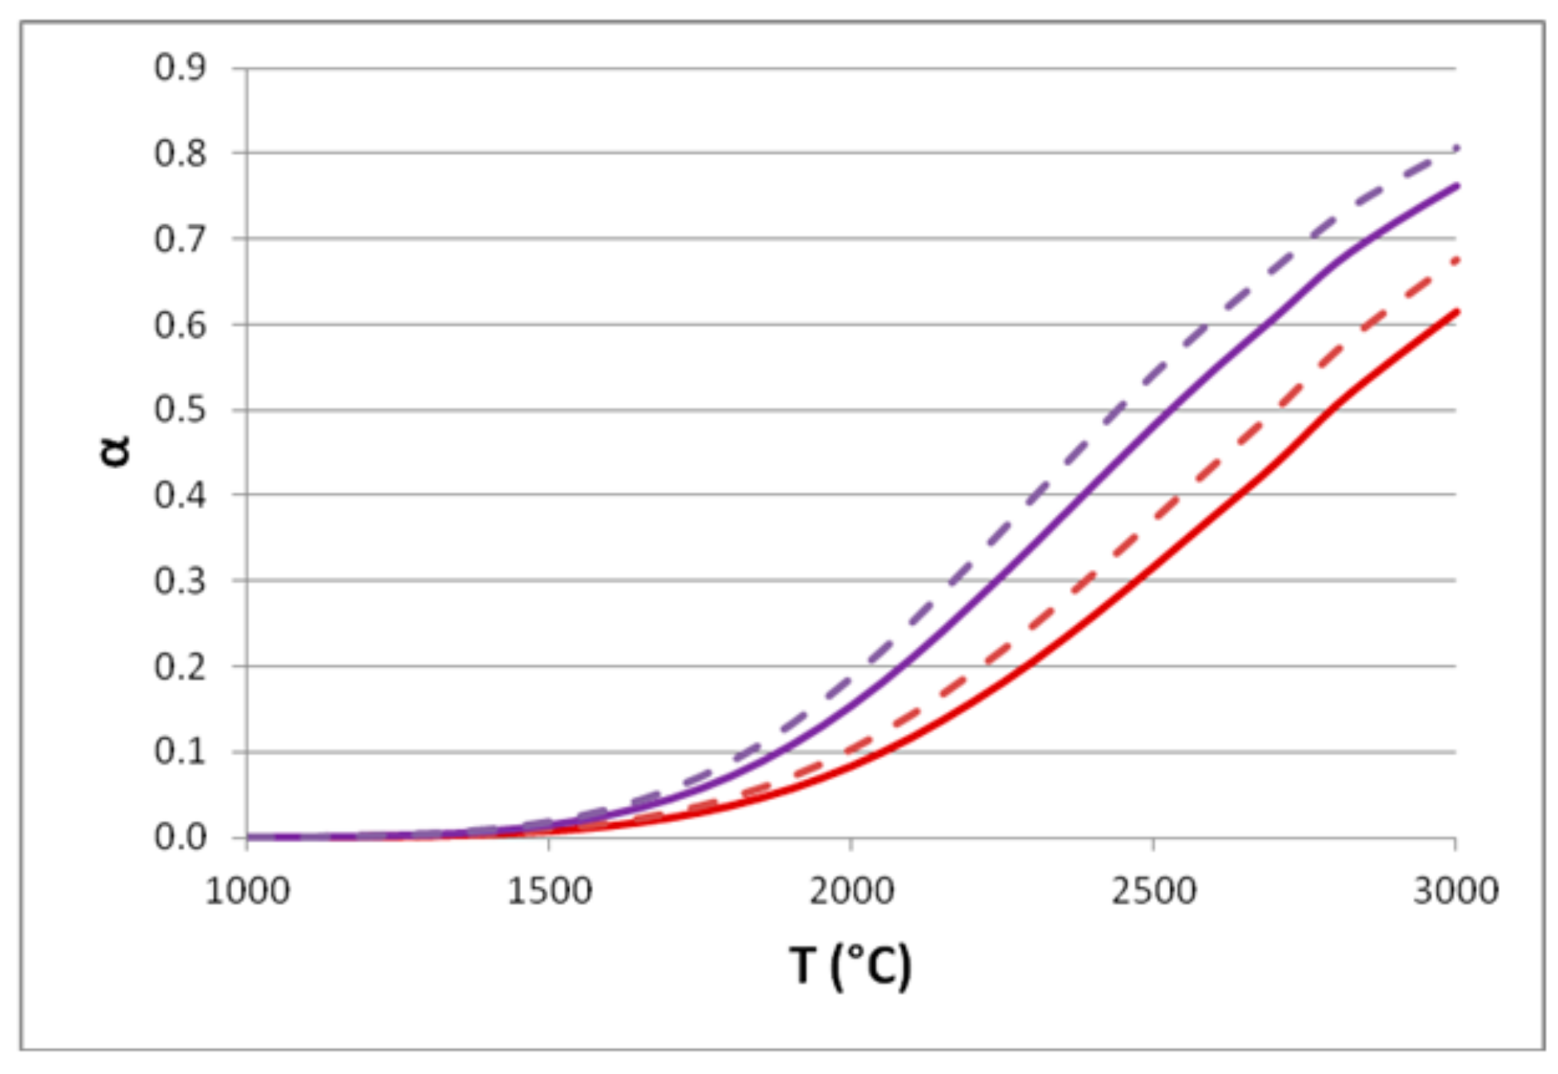
Finally, Figure 8 compares the behavior of membrane reactors using both the membranes (η = ε) of efficiencies 0.8 and 0.9 at the pressures 0.5 and 1 bar. Moving the membrane efficiency from 0.8 to 0.9 is more advantageous than reducing the pressure from 1 to 0.5 bar: at 2000 °C raising the efficiency from 0.8 to 0.9 the reaction conversion increases by about a factor 1.9 at both pressures (0.5 and 1 bar) while, for both efficiencies (0.8 and 0.9), by reducing the pressure from 1 to 0.5 bar the reaction conversion increases by about a factor 1.2.
3. Solar Membrane Reactor: A Case Study
As discussed before, thanks to its “shift effect” a membrane reactor can achieve, at a given temperature, conversions of the water splitting reaction higher than those of a traditional reactor. However, operating conditions of practical interest are not over 2000 °C which, as seen, is an optimistic limit for the next step developments of solar receiver systems.
Hereafter, a preliminary design of a solar membrane reactor is carried out. Generally, such a design has to address some specific aspects:
- -
- functional (e.g., membranes) and structural (e.g., external vessel) materials haveto operate at very high temperature;
- -
- the geometry and size (especially the surface) of the reactor has to be verified for both permeation flow-rates through the membranes and high heat fluxes coming from the solar receiver.
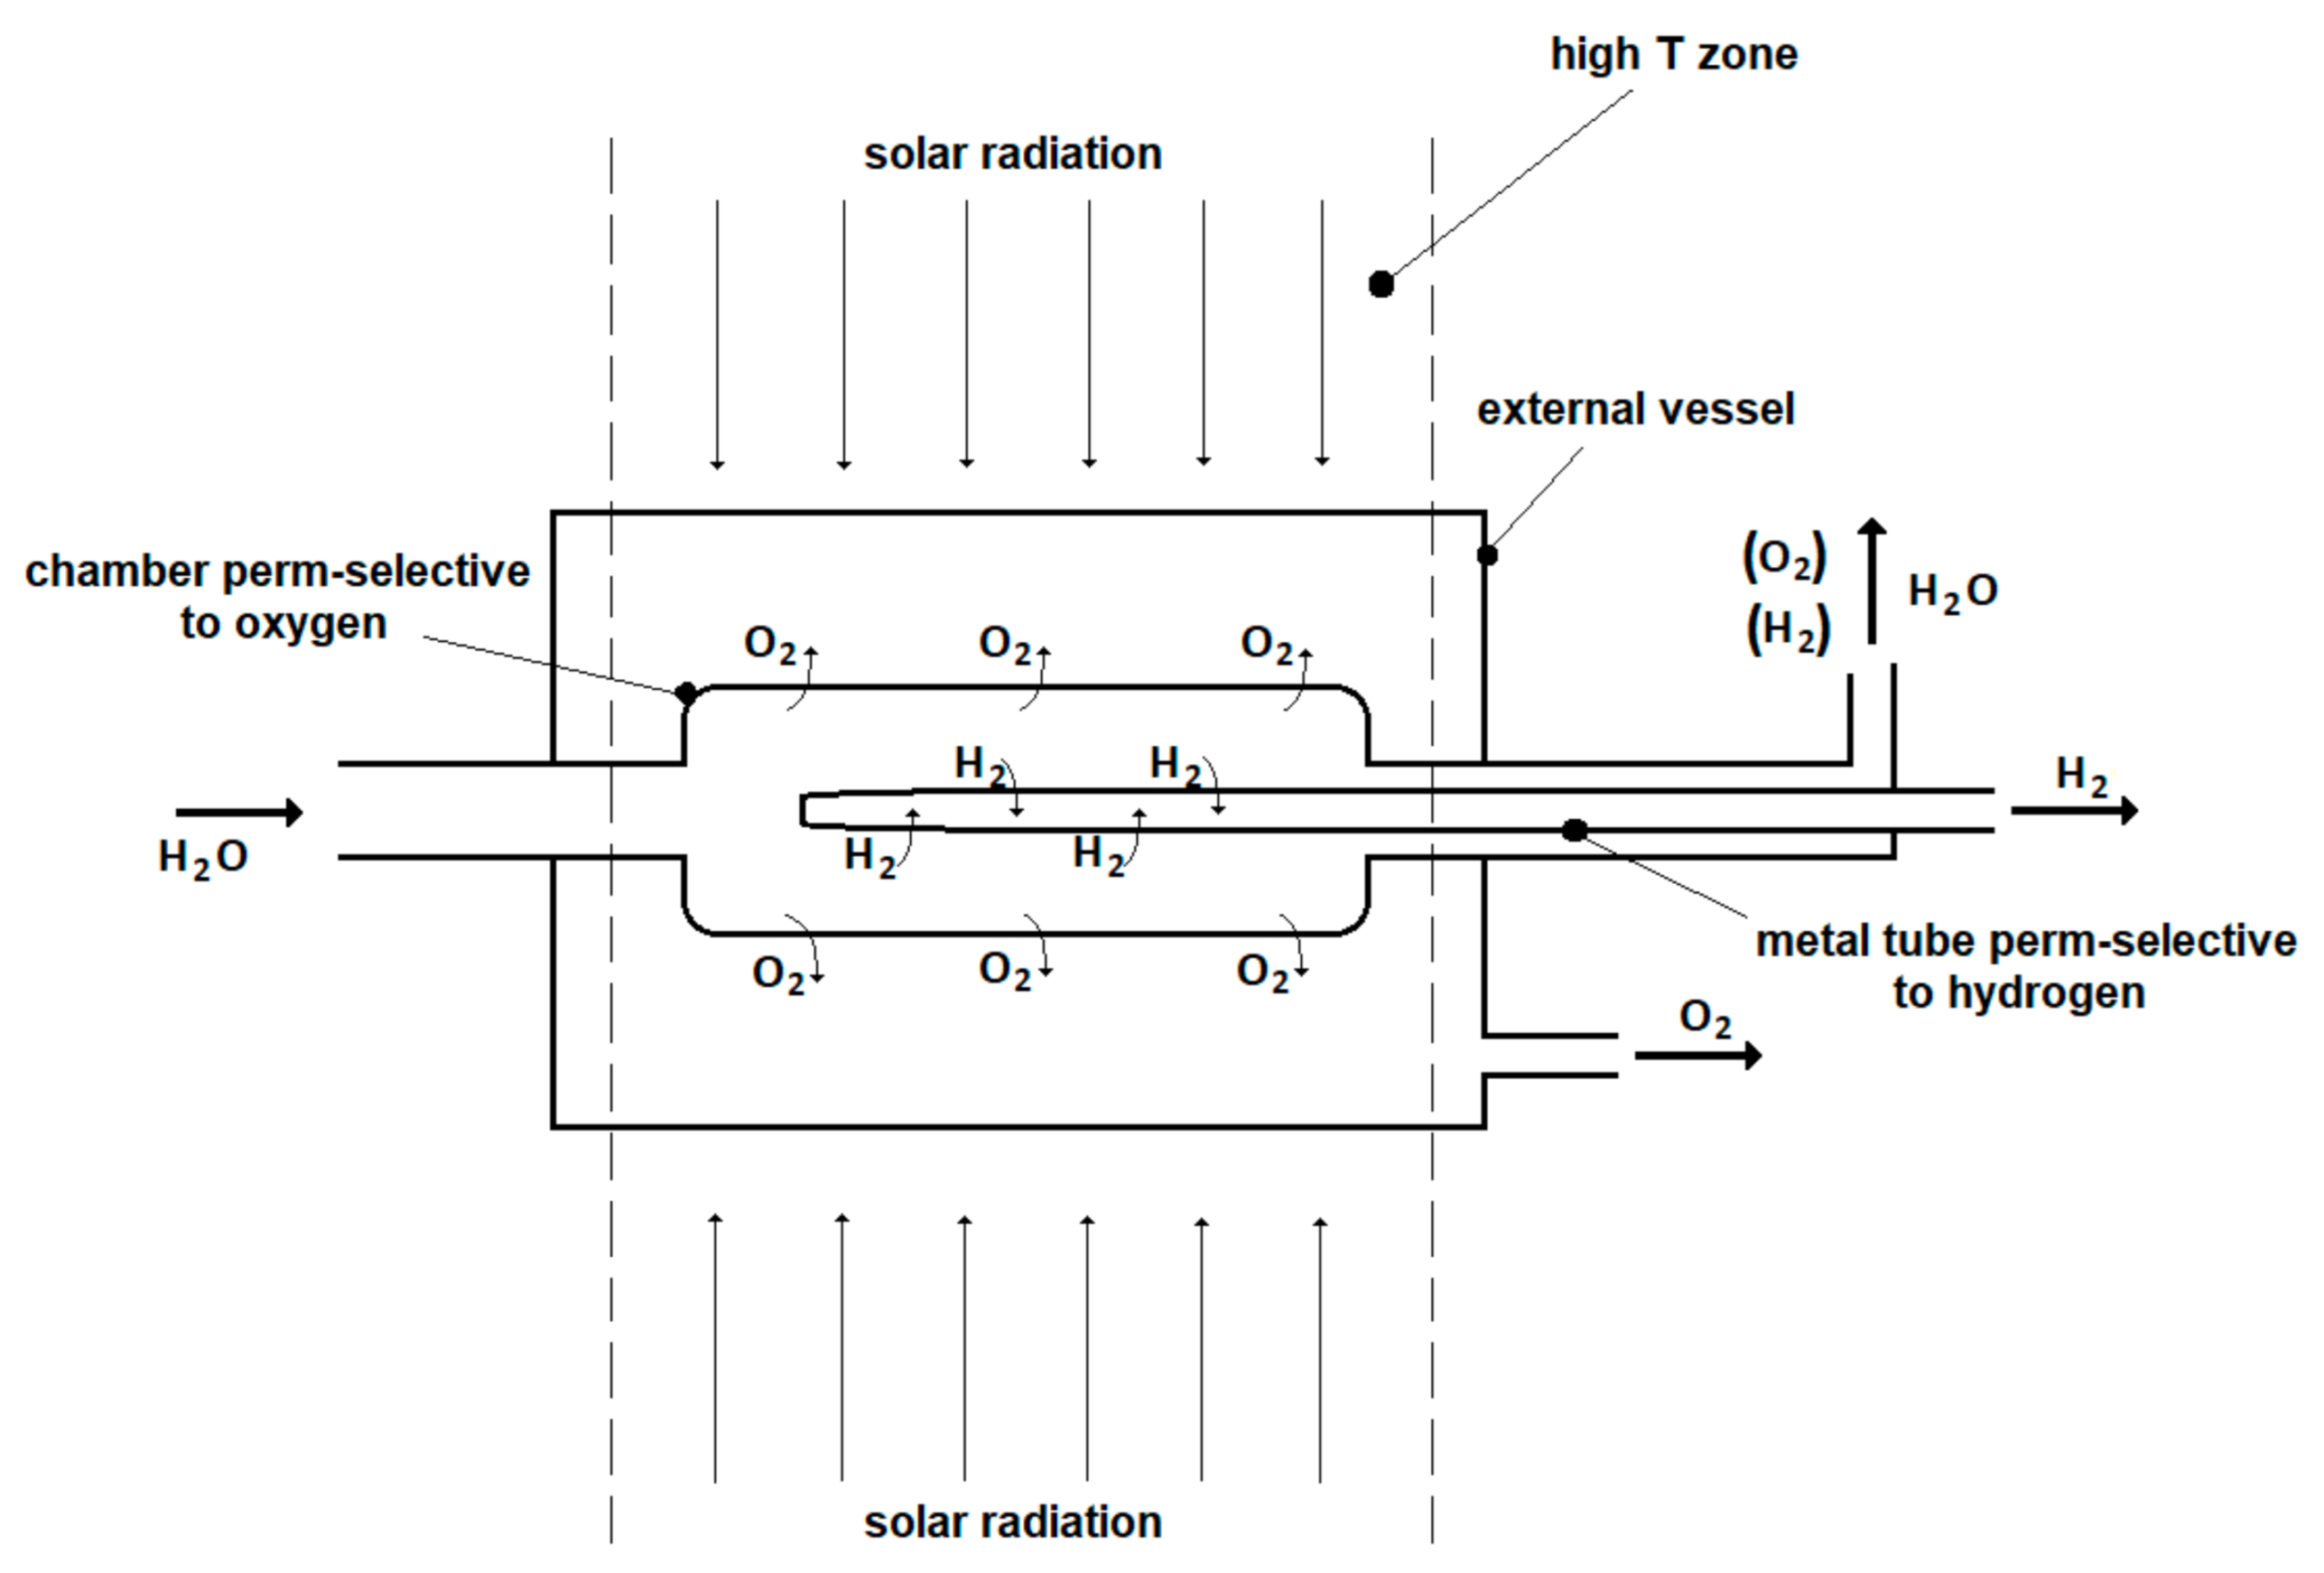
The configuration of the membrane reactor is shown in Figure 9: the water is fed inside a chamber perm-selective to oxygen where the water splitting reaction takes place. The hydrogen produced inside the chamber is separated through a metal tube perm-selective to hydrogen while the oxygen passes through the walls of the chamber itself. The retentate consists of the hydrogen and oxygen non-permeated and the water un-reacted. The oxygen permeated is collected in an external vessel (that has to be impermeable to this gas) while the hydrogen permeated is extracted from the lumen of the metal tube.
The materials considered for the solar membrane reactor are:
- -
- membrane tube(s) of thickness 0.15 mm made of Ta,
- -
- chamber perm-selective to oxygen made of hafnia of thickness 0.1 mm,
- -
- external vessel made of W (that is impermeable to oxygen).
In order to reduce the resulting permeation area, the thickness of the Ta membranes should be selected as low as possible. Although composite metal membranes can be realized by covering a porous support with thin metal layers [16], their use at very high temperature (over 1000 °C) could involve interdiffusion of metal atoms between the membrane active layer and the support with reduction of the permeability and/or delamination of the top layer due to its different thermal expansion with respect to the support. Furthermore, as verified by Pisarev et al. with Ta membranes of thickness 50 µm at 627 °C the hydrogen transport could be controlled by the surface reactions affecting the overall permeation law with a power coefficient close to 1 (instead of 0.5) [17]. Consequently, in this work thicker (0.15 mm) Ta membranes in the form of self-supported tubes are taken into consideration because of their better mechanical stability and less hydrogen transport limitations of composite and thin-walled membranes. A further aspect to be verified is the chemical stability of Ta that at high very temperature could react with water and oxygen to form oxides, in particular Ta2O5, and liquid phases (both Ta and Ta oxides) [18,19]. In principle, in a membrane reactor the presence of the membranes should keep the system far from the equilibrium, e.g., by lowering the hydrogen and oxygen partial pressures and then reducing the Ta oxidation. The resulting behavior of Ta membranes should then be verified in future experimental tests under the operating conditions proposed for this application.
The gas-tight connections between metal and ceramic parts (metal tube perm-selective to hydrogen and chamber perm-selective to oxygen, chamber perm-selective to oxygen and external vessel) are located in the zones at lower temperature in order to minimize the mechanical stresses due to differential thermal expansion of the different materials and to make the permeation of the gases negligible.
In the calculations, a water feed flow-rate of 1000 kg h−1 has been assumed while the permeation efficiency of membranes has been fixed to 0.9. The effect of temperature has been investigated in the range 1500–2500 °C. This temperature range considers the technological feasibility of future solar receivers (estimated up to 2000 °C) and higher values (2300–2400 °C) where the membrane reactor could assume sizes and costs of more practical interest. The permeate pressure has been fixed at 100 Pa, a minimum value providing the driving force needed for the permeation and, at the same time, requiring vacuum pumping levels realistic for industrial applications. As reaction pressure, the cases of 0.5 and 1 bar have been investigated.
3.1. Assessment of Membranes Surface
For the permeation of hydrogen and oxygen through the membranes the following law has been considered:
where F is the flow-rate of the gas permeated (mol s−1), Pe is the permeability (mol s−1 Pa−n m−2), and the partial pressures (Pa) of the permeating gas upstream and downstream the membrane, n the power coefficient (dimensionless) and A the membrane area (m2).
The Ta permeability used has been retrieved from literature [20] where the following expression with n = 0.5 is proposed for temperatures in the range 675–800 °C:
The hafnia permeability is driven by a power coefficient n = 0.25 experimentally determined in the temperature range 1100–2050 °C [21]:
As discussed in the previous paragraph, in a traditional reactor the reaction (1) proceeds with an increase of the moles number and, therefore, is promoted by low pressures. In a membrane reactor the amount of the reaction products removed from the reaction (in this case hydrogen and oxygen) increases with the pressure that is the driving force of the permeation. In practice, when increasing the pressure in a membrane reactor the resulting behavior is a balance of these two effects: (i) the conversion reduces due to thermodynamics, and (ii) the conversion increases due to an increase of the permeation.
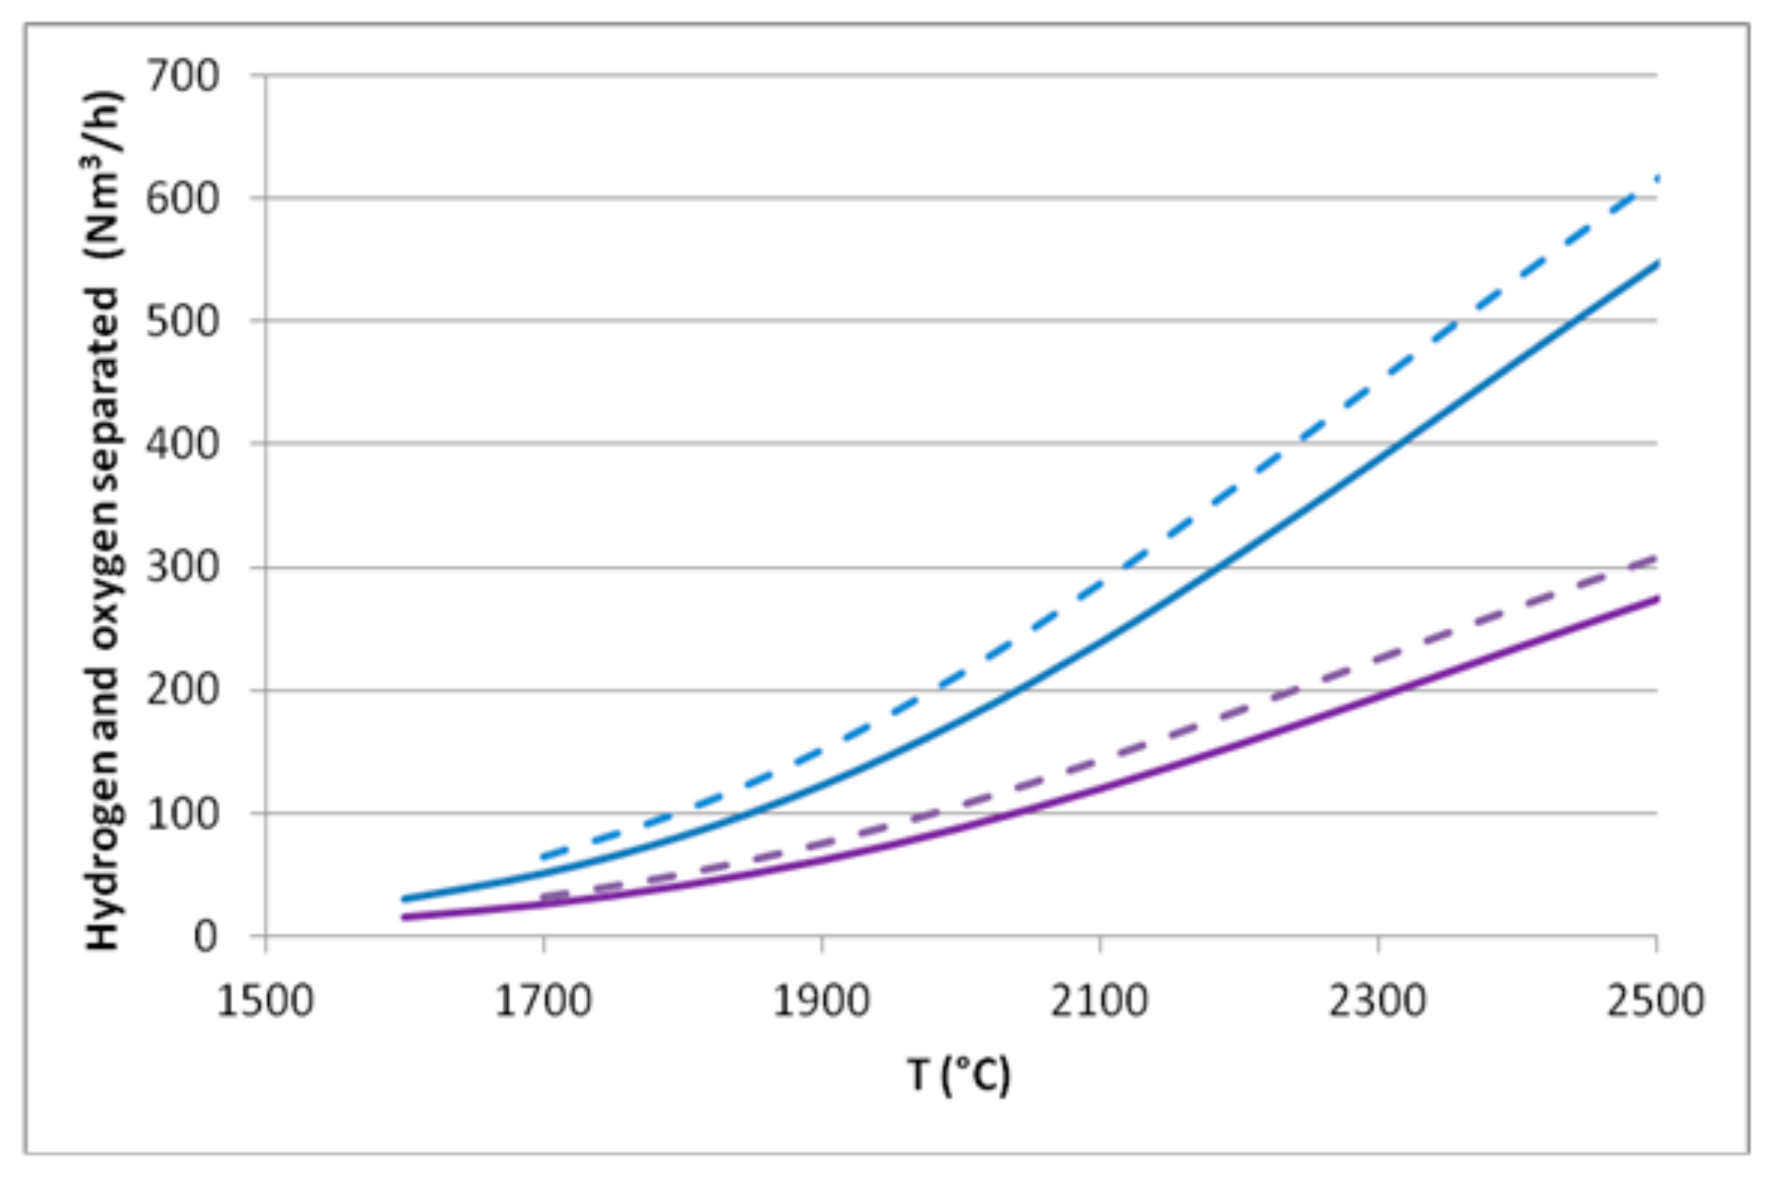
The results of the assessment are reported in Figure 10 in terms of flow rates of pure hydrogen and oxygen separated by the membranes at 0.5 and 1 bar. These values have been obtained from the reaction conversions calculated in Section 2 for the permeation efficiency of 0.9.
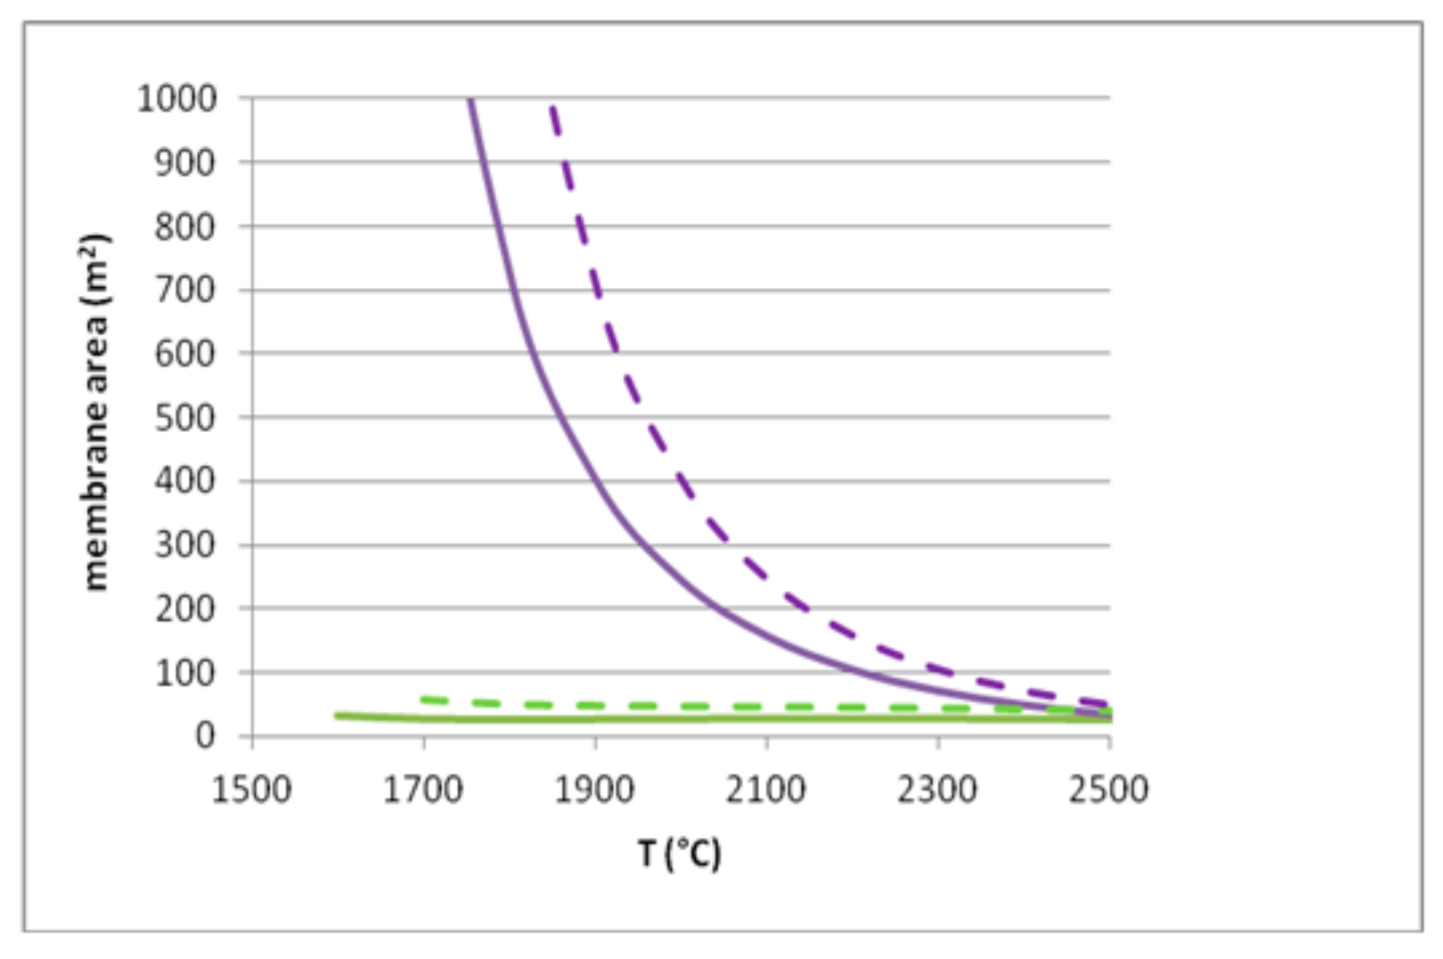
This study has shown a lower operational limit for the pressure of 0.5 bar (1 bar) at 1600 °C (1700 °C) below which the partial pressure of hydrogen and oxygen in the reaction side goes below the permeate pressure (100 Pa) and then permeation of hydrogen and oxygen cannot take place. Accordingly, in Figure 11 the results of the membrane area of Ta start from these temperatures, (1600 and 1700 °C for the operation at 0.5 and 1 bar, respectively) while the membrane area of the hafnia chamber assumes feasible values only approaching 2000 °C. In general, the operation at 0.5 bar has a more favorable result, producing slightly more hydrogen and oxygen. However, since the evaluation has been made by imposing the fraction of hydrogen and oxygen extracted via the membranes (0.9 in this case), the consequence is that when working at 0.5 bar a larger permeation area is required.
The permeation areas calculated vs. the temperature depend strongly on the behavior of the permeation coefficients of Formulas (9) and (10): the Ta permeability slightly decreases with the temperature, while the hafnia one decreases dramatically. The result is that below 2000 °C the surface area required for the hafnia membrane is too high. A fair criterion for a preliminary design suggests to work under conditions where the values of the membrane areas of Ta and hafnia are close each other so that the sizes of this two parts of the membrane device are similar thus involving a coherent dimensioning of the reactor. This condition appears verified over 2500 °C for both the operating pressures, with the temperature for the case at 1 bar being slightly higher. At this temperature the production of hydrogen and oxygen is close 600 and 300 m3 h−1 and the membrane areas are around 40 m2 at 0.5 bar and about 30 m2 at 1 bar: in fact, the higher the pressure the higher the permeation driving force and then the lower the membrane surface required.
On the other hand, if we consider as the upper temperature limit the value of 2000 °C, the resulting hafnia membrane at 0.5 bar would require around 400 m2 of surface, value that at 1 bar goes down to about 250 m2. Such a large membrane could be still feasible but its design should consider special configurations capable of maximizing the surface/volume ratio (e.g., membranes made of parallel of tubes or a design similar to that of plate heat exchangers). At 2000 °C the high investment costs could be balanced by the productivity of the membrane devices that, as reported in Figure 10, correspond to more than 200 m3 h−1 of hydrogen and about the half for the oxygen.
3.2. Energy Balances
A preliminary energy analysis has been evaluated by assessing the power needed to vaporize and heat from ambient temperature (25 °C) up to the operating temperature the water fed (1000 kg h−1) plus the enthalpy of reaction (1). The following expression has been adopted:
where is the power (W) to be provided to the water fed, is the feed water flow rate (mol s−1), λ is the latent heat of water (J mol−1), T is the operating temperature (°C), is the specific heat capacity of water (J mol−1 °C−1), ΔH is the enthalpy (J mol−1) of reaction (1) at the temperature T.
The recovery of a fraction ξ of heat from the retentate and permeate streams has been considered as well. These streams leave the membrane reactor at high temperature and can be exploited to provide heat to the reactor feed stream via heat exchangers and their partial recycling. The power that can be recovered from the retentate stream is the following:
where: and are the flow rates (mol s−1) in the retentate stream of hydrogen and oxygen, respectively, and and are the specific heat capacity (J mol−1 °C−1) of hydrogen and oxygen, respectively.
The power to be recovered from the two permeate streams of hydrogen and oxygen is:
where: and are the flow rates (mol s−1) of the permeate streams of hydrogen and oxygen, respectively.
In a very simplified approach, an overall efficiency (ξ) has been attributed to the heat recovery system. The resulting balance of the required power (W) is:
This preliminary energy analysis has been carried out for the pressures of 0.5 and 1 bar and efficiency of the two membranes η = ε = 0.9. Since the hypotheses at the basis of this assessment are very general, for the thermal recovery a conservative value (ξ = 0.6) has been assumed. The results are given in Table 2. The power required is practically unaffected by the pressure: in fact, most of the parameters used in the thermal balances (λ, ) depend very moderately on the pressure. The adoption of thermal recovery seems to become more effective when increasing the temperature: at 1500 °C about 35% of the power needed could be saved while at 2500 °C this share rises up to 40%.
Comparing the membrane areas assessed in Section 3.1 with the values of power required, it is possible to give a first estimation of the thermal fluxes over the materi-als. The results seem to be feasible for the materials proposed for the membrane reactor (tungsten or its alloys): in fact, operating at 1 bar they are about 10 kW m−2 (80 kW m−2) at 2000 °C (at 2300 °C).
4. Conclusions
The use of a membrane reactor with two perm-selective membranes, for separating hydrogen and oxygen, respectively, increases significantly (with a factor close to 2) the conversion of the water-splitting reaction when compared to the case of a membrane reactor separating only hydrogen. In particular, at 2000 °C a membrane reactor with two membranes may achieve reaction conversions over 20%.
A preliminary design of the proposed membrane reactor has been carried out: it consists of a tubular Ta membrane for extracting pure hydrogen and a hafnia chamber for separating the oxygen. The reactor has been designed for a water feed flow rate of 1000 kg h−1 for the pressures of 0.5 and 1 bar and membrane efficiencies of 0.9. Based on the optimization criterion of making the surface of the two membranes very close, the temperature of about 2500 °C has been identified. However, such a temperature is too high for coupling the membrane reactor with the solar receivers even under the most optimistic forecast of development of these technologies. At 2000 °C, a realistic operating temperature of future solar receivers, the preliminary design of a membrane reactor has assessed the production of more than 200 m3 h−1 of pure hydrogen and 100 m3 h−1 of pure oxygen. When working at 0.5 bar the estimated membrane area of hafnia is around 400 m2, a value that at 1 bar goes down to about 250 m2. The realization of this large membrane has to take into consideration configurations of the reactor capable to maximize the surface area, e.g., membranes made of parallel tubes or a design similar to that of plate heat exchangers.
Future work should be mainly focused on the characterization of the materials proposed for the realization of the membrane reactor under extreme operating conditions (very high temperature, gas chemistry, etc.) in order to verify their gas transport properties and chemical and mechanical stability.
5. Patents
This manuscript describes the invention of the Italian Patent Application n. 102020000023470 (06.10.2020) titled: “Processo a membrana per la produzione di idrogeno ed ossigeno mediante idrolisi dell’acqua e relativo apparato” [14].
Author Contributions
Conceptualization, S.T. and A.P.; Methodology, S.T., A.P., L.F. and A.S.; Formal Analysis, S.T.; Writing—Original Draft Preparation, S.T., A.P., L.F. and A.S.; Writing—Review & Editing, S.T., A.P., L.F. and A.S.; Supervision, S.T. All authors have read and agreed to the published version of the manuscript.
Funding
This research received no external funding.
Data Availability Statement
Not applicable.
Conflicts of Interest
The authors declare no conflict of interest.
Appendix A
The reaction conversion α is defined as the fraction of the reagent (water in this case) that is converted into the products (hydrogen and oxygen). Table A1 reports the mass balances for a traditional reactor where the water-splitting reaction (1) is carried out.

Table A1.
Mass balances of the water-splitting reaction in a traditional reactor expressed in terms of reaction conversion α.
Table A1.
Mass balances of the water-splitting reaction in a traditional reactor expressed in terms of reaction conversion α.
| H2O | O2 | H2 | Total | |
|---|---|---|---|---|
| initial moles | 1 | 0 | 0 | 1 |
| final moles | 1 − α | 0.5 α | α | 1 + 0.5 α |
| final mole fractions | 1 |
Introducing the results of these mass balances into the expression of the mole fractions equilibrium constant, the reaction conversion is calculated as the real root of the following equation:
In the case of a membrane reactor, a fraction of the products is extracted via selective membranes and, specifically, η and ε are, respectively, the fraction of hydrogen and oxygen separated by the membranes. Accordingly, the mass balances are modified as reported in Table A2.
Table A2.
Mass balances of the water splitting reaction in a membrane reactor expressed in terms of reaction conversion α and the fraction of hydrogen (η) and oxygen (ε) separated by the membranes.
Table A2.
Mass balances of the water splitting reaction in a membrane reactor expressed in terms of reaction conversion α and the fraction of hydrogen (η) and oxygen (ε) separated by the membranes.
| H2O | O2 | H2 | Total | |
|---|---|---|---|---|
| initial moles | 1 | 0 | 0 | 1 |
| final moles | 1 − α | (1 − ε) 0.5 α | (1 − η) α | |
| final mole fractions | 1 |
Once fixed the fractions of hydrogen (η) and oxygen (ε) separated by the membranes, the reaction conversion α is calculated by taking the real root of the following equation:
The particular cases of a membrane reactor capable of separating only hydrogen or only oxygen can be treated by posing in the expression (A2) ε = 0 or η = 0, respectively. In the case of a traditional reactor (ε = η = 0), it can be verified that the expression (A2) becomes (A1).
References
- International Energy Agency (IEA). World Energy Outlook 2018, Report OECD/IEA 2018. 2018. Available online: https://www.iea.org/reports/world-energy-outlook-2018 (accessed on 29 July 2020).
- Dawood, F.; Anda, M.; Shafiullah, G.M. Hydrogen production for energy: An overview. Int. J. Hydrog. Energy 2020, 45, 3847–3869. [Google Scholar] [CrossRef]
- Tsutsumi, A. Thermodynamics of Water Splitting, Energy Carriers and Conversion Systems—Volume I. Available online: https://www.eolss.net/Sample-Chapters/C08/E3-13-03-01.pdf (accessed on 3 August 2020).
- Renewable Energy Cost Analysis—Concentrating Solar Power, Volume1: PowerSector, Issue2/5, June 2010. Available online: https://irena.org/-/media/Files/IRENA/Agency/Publication/2012/RE_Technologies_Cost_Analysis-CSP.pdf (accessed on 3 June 2020).
- Fichtner. Technology Assessment of CSP Technologies for a Site Specific Project in South Africa Final Report; The World Bank; ESMAP: Washington, DC, USA, 2010. Available online: https://www.climateinvestmentfunds.org/sites/default/files/Presentation%20-%20WB%20 (accessed on 30 September 2020).
- Yogev, A.; Kribus, A.; Epstein, M.; Kogan, A. Solar “Tower Reflector” systems: A new approach forhigh-temperature solarplants. Int. J. Hydrog. Energy 1998, 23, 239–245. [Google Scholar] [CrossRef]
- Hoffschmidt, B. Receivers for Solar Tower Systems, June 2014. Available online: https://sfera2.sollab.eu/uploads/images/networking/SFERA%20SUMMER%20SCHOOL%202014%20-%20PRESENTATIONS/SolarTowerReceivers%20-%20Bernhard%20Hoffschmidt.pdf (accessed on 3 June 2020).
- Fletcher, E.A.; Moen, R.L. Hydrogen-and Oxygen from Water. Science 1977, 197, 1050–1056. [Google Scholar] [CrossRef] [PubMed]
- Diver, R.B.; Fletcher, E.A. Hydrogen and oxygen from water-II—Some considerations in the reduction of the idea to practice. Energy 1979, 4, 1139–1159. [Google Scholar] [CrossRef]
- Santucci, A.; Tosti, S.; Basile, A. Alternatives to palladium in membranes for hydrogen separation: Nickel, niobium and vanadium alloys, ceramic supports for metal alloys and porous glass membranes. In Handbook of Membrane Reactors; Woodhead Publishing Series in Energy—Cornwall (UK); Basile, A., Ed.; Woodhead Publishing: Cornwall, UK, 2013; Volume 1. [Google Scholar]
- Tosti, S.; Basile, A.; Bettinali, L.; Borgognoni, F.; Gallucci, F.; Rizzello, C. Design and process study of Pd membrane reactors. Int. J. Hydrog. Energy 2008, 33, 5098–5105. [Google Scholar] [CrossRef]
- Santucci, A.; Borgognoni, F.; Vadrucci, M.; Tosti, S. Testing of dense Pd–Ag tubes: Effect of pressure and membrane thickness on the hydrogen permeability. J. Membr. Sci. 2013, 444, 378–383. [Google Scholar] [CrossRef]
- Sui, C.; Wang, H.; Liu, X.; Hu, X. Solar Thermochemical Water-Splitting Reaction Enhanced by Hydrogen Permeation Membrane. arXiv 2018, arXiv:1808.02175. Available online: https://arxiv.org/ftp/arxiv/papers/1808/1808.02175.pdf (accessed on 3 June 2020).
- Tosti, S.; Pozio, A.; Farina, L.; Santucci, A. Processo a Membrana per la Produzione di Idrogeno ed Ossigeno Mediante Idrolisi Dell’acqua e Relativo Apparato. Italian Patent Application No.102020000023470, 6 October 2020. [Google Scholar]
- AsTher—Thermodynamic Database and Applications. Available online: http://www.asther.de/ (accessed on 16 September 2020).
- Basile, A.; Gallucci, F.; Tosti, S. Synthesis, characterization and applications of palladium membranes. In Inorganic Membranes: Synthesis, Characterization and Applications; Mallada, R., Menendez, M., Eds.; Elsevier: Amsterdam, The Netherlands, 2008; ISBN 978-0-444-53070-7. [Google Scholar]
- Pisarev, A.; Miyasaka, K.; Tanabe, T. Permeation of hydrogen through tantalum: Influence of surface effects. J. Nucl. Mater. 2003, 317, 195–203. [Google Scholar] [CrossRef]
- Garg, S.P.; Krishnamurthy, N.; Awasthi, A.; Venkatraman, M. The O–Ta (Oxygen–Tantalum) System. J. Phase Equilibria 1996, 17, 63–77. [Google Scholar] [CrossRef]
- Hong, H.S.; Lee, K.S. Thermodynamic evaluation of the Ta–O system from pure tantalum to tantalum pentoxide. J. Alloy. Compd. 2003, 360, 198–204. [Google Scholar] [CrossRef]
- Rothenberger, K.S.; Howard, B.H.; Killmeyer, R.P.; Cugini, A.V.; Enick, R.M.; Bustamante, F.; Ciocco, M.V.; Morreale, B.D.; Buxbaum, R.E. Evaluation of tantalum-based materials for hydrogen separation at elevated temperatures and pressures. J. Membr. Sci. 2003, 218, 19–37. [Google Scholar] [CrossRef]
- Smith, A.W.; Meszaros, P.W.; Amata, C.D. Permeability of Zirconia, Hafnia, and Thoria to Oxygen. J. Am. Ceram. Soc. 1966, 49, 240–244. [Google Scholar] [CrossRef]
Figure 1.
Equilibrium compositions of water splitting reaction [3].
Figure 1.
Equilibrium compositions of water splitting reaction [3].

Figure 2.
Conceptual scheme of the membrane reactor proposed for the water splitting.

Figure 3.
Reaction conversions in a traditional reactor along the temperature for the pressures of 0.5 bar (blue), 1 bar (red) and 10 bar (green).
Figure 3.
Reaction conversions in a traditional reactor along the temperature for the pressures of 0.5 bar (blue), 1 bar (red) and 10 bar (green).

Figure 4.
Reaction conversion calculated at 0.5 bar in a membrane reactor with fraction of separated hydrogen and oxygen of 0.8. The following cases are considered: traditional reactor (violet), only one membrane perm-selective to hydrogen (η = 0.8 and ε = 0) (red), only one membrane perm-selective to oxygen (ε = 0.8 and η = 0) (green), two membranes perm-selective to hydrogen and oxygen (ε = η = 0.8) (blue).

Figure 5.
Reaction conversion calculated at 0.5 bar in a membrane reactor with fraction of separated hydrogen and oxygen of 0.9. The following cases are considered: traditional reactor (violet), only one membrane perm-selective to hydrogen (η = 0.9 and ε = 0) (red), only one membrane perm-selective to oxygen (ε = 0.9 and η = 0) (green), two membranes perm-selective to hydrogen and oxygen (ε = η = 0.9) (blue).

Figure 6.
Reaction conversion calculated at 1 bar in a membrane reactor with fraction of separated hydrogen and oxygen of 0.8. The following cases are considered: traditional reactor (violet), only one membrane perm-selective to hydrogen (η = 0.8 and ε = 0) (red), only one membrane perm-selective to oxygen (ε = 0.8 and η = 0) (green), two membranes perm-selective to hydrogen and oxygen (ε = η = 0.8) (blue).

Figure 7.
Reaction conversion calculated at 1 bar in a membrane reactor with fraction of separated hydrogen and oxygen of 0.9. The following cases are considered: traditional reactor (violet), only one membrane perm-selective to hydrogen (η = 0.9 and ε = 0) (red), only one membrane perm-selective to oxygen (ε = 0.9 and η = 0) (green), two membranes perm-selective to hydrogen and oxygen (ε = 0.9 and η = 0.9) (blue).

Figure 8.
Reaction conversion calculated at 0.5 bar (dashed lines) and 1 bar (continuous lines) in a membrane reactor using both membranes perm-selective to hydrogen and oxygen (η = ε) with fraction of separated hydrogen and oxygen of 0.8 (red) and 0.9 (purple).
Figure 8.
Reaction conversion calculated at 0.5 bar (dashed lines) and 1 bar (continuous lines) in a membrane reactor using both membranes perm-selective to hydrogen and oxygen (η = ε) with fraction of separated hydrogen and oxygen of 0.8 (red) and 0.9 (purple).

Figure 9.
Schematic configuration of the membrane reactor proposed: a metal tube that separates pure hydrogen is contained in a ceramic chamber perm-selective to oxygen.
Figure 9.
Schematic configuration of the membrane reactor proposed: a metal tube that separates pure hydrogen is contained in a ceramic chamber perm-selective to oxygen.

Figure 10.
Pure hydrogen (blue) and oxygen (violet) collected by the membranes for the pressure of 0.5 bar (dashed lines) and 1 bar (continuous lines) for water feed flow-rate of 1000 kg h−1.
Figure 10.
Pure hydrogen (blue) and oxygen (violet) collected by the membranes for the pressure of 0.5 bar (dashed lines) and 1 bar (continuous lines) for water feed flow-rate of 1000 kg h−1.

Figure 11.
Membrane area required for Ta (green) and hafnia (violet) for the pressure of 0.5 bar (dashed lines) and 1 bar (continuous lines) for water feed flow-rate of 1000 kg h−1.
Figure 11.
Membrane area required for Ta (green) and hafnia (violet) for the pressure of 0.5 bar (dashed lines) and 1 bar (continuous lines) for water feed flow-rate of 1000 kg h−1.

| Parabolic Trough | Solar Tower | Linear Fresnel Dish | Stirling | |
|---|---|---|---|---|
| Typical capacity (MW) | 10–300 | 10–200 | 10–200 | 0.01–0.025 |
| Operating temperature (°C) | 350–550 | 250–565 | 390 | 550–750 |
Table 2.
Power required by the membrane reactor vs. temperature at 0.5 and 1 bar with fractions of heat recovery of 0 and 0.6.
Table 2.
Power required by the membrane reactor vs. temperature at 0.5 and 1 bar with fractions of heat recovery of 0 and 0.6.
| T, °C | 0.5 bar—ξ = 0 | 1 bar—ξ = 0 | 0.5 bar—ξ = 0.6 | 1 bar—ξ = 0.6 |
|---|---|---|---|---|
| Power (MW) | Power (MW) | Power (MW) | Power (MW) | |
| 1500 | 1.70 | 1.69 | 1.12 | 1.11 |
| 1600 | 1.84 | 1.81 | 1.20 | 1.18 |
| 1700 | 2.00 | 1.96 | 1.30 | 1.26 |
| 1800 | 2.21 | 2.14 | 1.43 | 1.37 |
| 1900 | 2.46 | 2.36 | 1.59 | 1.51 |
| 2000 | 2.75 | 2.62 | 1.77 | 1.68 |
| 2100 | 3.08 | 2.92 | 1.98 | 1.86 |
| 2200 | 3.44 | 3.25 | 2.20 | 2.06 |
| 2300 | 3.81 | 3.59 | 2.41 | 2.26 |
| 2400 | 4.17 | 3.95 | 2.62 | 2.46 |
| 2500 | 4.53 | 4.29 | 2.80 | 2.64 |
Publisher’s Note: MDPI stays neutral with regard to jurisdictional claims in published maps and institutional affiliations. |
© 2021 by the authors. Licensee MDPI, Basel, Switzerland. This article is an open access article distributed under the terms and conditions of the Creative Commons Attribution (CC BY) license (http://creativecommons.org/licenses/by/4.0/).
Share and Cite
MDPI and ACS Style
Tosti, S.; Pozio, A.; Farina, L.; Santucci, A. Hydrogen and Oxygen Production via Water Splitting in a Solar-Powered Membrane Reactor—A Conceptual Study. Hydrogen 2021, 2, 18-32. https://0-doi-org.brum.beds.ac.uk/10.3390/hydrogen2010002
AMA Style
Tosti S, Pozio A, Farina L, Santucci A. Hydrogen and Oxygen Production via Water Splitting in a Solar-Powered Membrane Reactor—A Conceptual Study. Hydrogen. 2021; 2(1):18-32. https://0-doi-org.brum.beds.ac.uk/10.3390/hydrogen2010002
Chicago/Turabian StyleTosti, Silvano, Alfonso Pozio, Luca Farina, and Alessia Santucci. 2021. "Hydrogen and Oxygen Production via Water Splitting in a Solar-Powered Membrane Reactor—A Conceptual Study" Hydrogen 2, no. 1: 18-32. https://0-doi-org.brum.beds.ac.uk/10.3390/hydrogen2010002