Article

Selected Aspects of Hydrogen Production via Catalytic Decomposition of Hydrocarbons

by
Aleksey A. Vedyagin
1,2,*,
Ilya V. Mishakov
1,2,
Denis V. Korneev
3,
Yury I. Bauman
1,2,
Anton Yu. Nalivaiko
2 and
Alexander A. Gromov
2
1
Department of Materials Science and Functional Materials, Boreskov Institute of Catalysis SB RAS, Lavrentieva Ave 5, 630090 Novosibirsk, Russia
2
Catalysis Lab, National University of Science and Technology MISIS, Leninskiy Prospect 4, 119049 Moscow, Russia
3
School of Biological Sciences, Monash University, 25 Rainforest Walk, Clayton, VIC 3800, Australia
*
Author to whom correspondence should be addressed.
Submission received: 8 January 2021 / Revised: 8 February 2021 / Accepted: 12 February 2021 / Published: 20 February 2021

Abstract

:
Owing to the high hydrogen content, hydrocarbons are considered as an alternative source for hydrogen energy purposes. Complete decomposition of hydrocarbons results in the formation of gaseous hydrogen and solid carbonaceous by-product. The process is complicated by the methane formation reaction when the released hydrogen interacts with the formed carbon deposits. The present study is focused on the effects of the reaction mixture composition. Variations in the inlet hydrogen and methane concentrations were found to influence the carbon product’s morphology and the hydrogen production efficiency. The catalyst containing NiO (82 wt%), CuO (13 wt%), and Al2O3 (5 wt%) was prepared via a mechanochemical activating procedure. Kinetics of the catalytic process of hydrocarbons decomposition was studied using a reactor equipped with McBain balances. The effects of the process parameters were explored in a tubular quartz reactor with chromatographic analysis of the outlet gaseous products. In the latter case, the catalyst was loaded piecemeal. The texture and morphology of the produced carbon deposits were investigated by nitrogen adsorption and electron microscopy techniques.

1. Introduction

Nowadays, hydrogen is a valuable chemical product demanded in a series of industrially important processes such as the production of ammonia [1], methanol [2,3], hydrazine [4], and synthetic hydrocarbons [5]. Not the least is the role hydrogen plays in the food industry, where it is applied for the hydrogenation of vegetable oils [6,7]. On the other hand, hydrogen is considered one of the most ecologically friendly sources of heat energy [8]. Owing to energetic versatility, hydrogen can replace any type of fuel in various fields of energetics, transportation, and industry. Growing needs from the chemical industry and energetics facilitate an increase in hydrogen production. For instance, during the last decade, the annual growth of the world hydrogen production was estimated to be 4.5%, and the current level of its manufacture exceeds 100 million tons per year.
In the near future, a sharp rise in hydrogen demand is expected due to an increase in the depth of oil processing, the volume of ammonia and methanol production, and the production of refined or synthetic liquid fuels, among others. The main contribution to world hydrogen demand is anticipated from the automobile industry and distributed energy supply systems, where hydrogen serves as an energy carrier, which can be stored and transported similarly to natural gas. In contrast to methane, hydrogen does not have any resource limits and does not form greenhouse gases being burnt.
On the industrial scale, hydrogen is produced via steam reforming of methane, oxidation of heavy oil, coal gasification, and water electrolysis [9,10,11]. It should be noted that biomass is considered as a potential hydrogen source as well [12]. All these technologies, despite the number of disadvantages, are commercially applied for a long time. However, no hydrogen production approach comprising both efficiency and ecological safety is being realized.
An alternative process yielding hydrogen is catalytic pyrolysis of hydrocarbons, which is traditionally used for the synthesis of carbon materials. In a general view, the process can be expressed by the following equation:
CnHm → nC + (m/2)H2
This process is well-known under the name of catalytic chemical vapor deposition (CCVD) and is widely applied to obtain carbon nanotubes (CNTs) and nanofibers (CNFs) [13]. In world practice, the CCVD method has established a reputation as a relatively simple, versatile, and easy-to-scale way to produce carbon materials with desired structural and morphological characteristics. The main advantage of this method in relation to hydrogen production is an absence of carbon oxide impurities in the composition of the produced hydrogen-containing mixture, which eliminates the need for an additional stage of its deep purification from CO and CO2.
Therefore, light alkanes are considered as unique pure hydrogen storage compounds, and hydrogen can be easily retracted from them via catalytic decomposition onto constituents—carbon and hydrogen [14,15,16,17,18,19,20,21,22]. For instance, 1 ton of liquefied butane contains 1.5 times higher hydrogen than 1 ton of water. Consequently, the process of hydrogen production from hydrocarbon sources of different origin is prospective to replace the water electrolysis based methods at a number of chemical plants, where the purity of hydrogen is not crucial. In principle, the purity of hydrogen can be improved by using membrane or adsorption technologies [23,24]. Hydrogen produced via such a process was named blue hydrogen [25]. The attractiveness of this approach is also connected with low power inputs, compactness of the technological apparatus, and a low price for the hydrocarbon source.
As natural gas generally consists of methane (up to 98 vol%), the most attention of the research groups all over the world is paid to the development of efficient catalysts for methane decomposition [21,22,26,27,28,29,30]. The choice of the catalysts, active in the CCVD of various hydrocarbons, is practically unlimited. Such catalytic systems can be as monometallic as multicomponent alloyed ones. As reported, good enough activity in the process is performed by dispersed particles of copper [31] or palladium [32]. Nevertheless, the most commonly used compositions include metals of the iron subgroup (Fe, Co, and Ni) [33,34,35,36,37]. These systems are well-studied and traditionally applied for the catalytic deposition of carbon from the gas phase.
The metal particles exhibit activity in a well-dispersed state. Such a state can be achieved using various supports and structural promoters, stabilizing the active component particles and preventing their sintering at elevated temperatures of the reaction (500–900 °C). According to ideas about the reaction mechanism (so-called ‘carbide cycle mechanism’), the dispersed metal particles simultaneously play a few roles: decomposition of hydrocarbon molecule with hydrogen formation and unstable carbides, diffusive transfer of carbon atoms, and subsequent deposition and growth of the graphite-like phase (carbon nanofibers) [38]. The rates of hydrogen formation and the carbon product deposition, as well as maximal hydrogen yield per 1 g of the catalyst, are known to be dependent on the catalyst’s composition, the exact composition of the hydrocarbon source, and the temperature of the process. It should be mentioned that the same factors affect the morphology, structural, and textural features of the carbon by-product. According to the literature, the maximal hydrogen yield for the case of methane decomposition in a temperature range of 700–750 °C varies in a range of 60–80 vol% [21,26,33].
On the other hand, the methane molecule is characterized by very high stability. The reaction of methane decomposition on carbon and hydrogen is endothermic and reversible, which distinguishes it from the decomposition reactions of other hydrocarbons, which proceed irreversibly with a heat release. In theory, the methane conversion’s depth is limited by the thermodynamic equilibrium that implies the simultaneous presence of methane and hydrogen in the gas-phase reaction products. The equilibrium methane conversion increases with the temperature; however, even such a high temperature as 1000 °C does not provide a 100% methane conversion into hydrogen and carbon because of thermodynamic limitation. Therefore, it can be summarized that the catalytic decomposition of any C2+ hydrocarbons onto carbon and hydrogen will always be accompanied by the reverse reaction of carbon hydrogenation with the formation of methane (Equation (2)).
C + 2H2 → CH4
Within the temperature interval of 500–900 °C, which targets the decomposition of hydrocarbons, methane formation reaction (2) always takes place. This fact explains the driving force’s appearance for the carbon hydrogenation process in any hydrocarbon cases, except methane itself. Thereby, the hydrogen-containing gas mixture resulting from the hydrocarbon decomposition is always represented by a mix of hydrogen and methane.
The present research aims to go deep inside the features of the process of hydrogen production from hydrocarbons via their catalytic decomposition. The effects of the exact reaction mixture composition on the hydrogen production process and the structural characteristics of the carbon by-product were revealed during this study for the first time. All the experiments were performed using the NiO-CuO-Al2O3 composition as a model catalyst. The choice of this composition is based on our long-term experimental practice in the decomposition of various hydrocarbons. Pure nickel catalyst exhibits good initial activity, but undergoes rapid deactivation within the studied range of reaction conditions. The doping of nickel with copper helps to optimize its activity, thus improving the overall catalyst’s efficiency. The dilution of the NiO-CuO system with a textural promoter stabilizes the nickel-copper particles in a highly dispersed state [39]. Alumina was found to serve this function perfectly. The genesis of the catalyst during the exploitation is out of the research’s topics. The main focus is on the conceptual aspects of the catalytic process of hydrocarbons’ decomposition.

2. Experimental Section

2.1. Synthesis of the Catalyst

The catalyst used in the present study contains 82 wt% NiO, 13 wt% CuO, and 5 wt% Al2O3. The synthesis of the catalyst was performed by mixing nickel oxide (JSC Ural Plant of Chemical Reagents, Verkhnyaya Pyshma, Russia), copper oxide (JSC Ural Plant of Chemical Reagents, Verkhnyaya Pyshma, Russia), and aluminum hydroxide (LLC Pikalyovo Chemical Plant, Pikalyovo, Russia) taken in an appropriate ratio. The obtained mixture was subjected to mechanochemical activation in a planetary mill ‘Activator 2S’ (Engineering Plant ‘Activator’, Ltd.; Novosibirsk, Russia). The grinding medium (GM) was steel balls of 8 mm in diameter. The milling procedure was carried out for 15 min with the GM acceleration of 390 m/s2. Thus, the obtained powder catalyst consists of irregularly shaped granules with a size of 5–20 µm.

2.2. Catalytic Decomposition of Hydrocarbons

The kinetics of the catalytic decomposition process was investigated using a quartz reactor equipped with McBain balances as described elsewhere [39,40]. The specimen of the catalyst (5 mg) was placed in a foamed quartz basket. The preliminary reduction of the catalyst required for its activation was performed in a flow of 40 vol% hydrogen in argon (flowrate of 250 mL/min) at heating up to 600 °C with a heating rate of 20 °C/min and subsequent maintenance at this temperature for 10 min. Then, the desired reaction gas mixture was passed through the reactor. The compositions of the reaction mixtures used for the catalytic tests are summarized in Table 1. The mixtures RM-1, RM-2, RM-3, RM-4, and RM-5 were purchased from the local gas supplier LLC NskGas (Novosibirsk, Russia). All the other mixtures were prepared by a simple dilution with hydrogen (or methane) in the required proportion. The total flow rate of the reaction mixture was 500 mL/min. The duration of the process was varied depending on the catalyst’s activity. When the experiment was finished, the reactor was cooled down to room temperature, and the carbon by-product was unloaded, weighted, and characterized.
The features of the catalytic decomposition process were studied using a specially designed horizontal flow quartz reactor shown in Figure 1. The catalyst was evenly distributed within the reactor in six positions along the reactor length. The weight of each catalyst’s portion was 5 mg. The reactor has one main inlet at the beginning to feed the reaction mixture, one main outlet at the end, and seven add-on outlets to control the composition of the reaction mixture after each portion of the catalyst. Five independent heating elements provide a linear temperature profile along the reactor at the desired temperature with an accuracy of ±2 °C. Before the experiment, the reactor was purged with argon. Then, 40 vol% hydrogen was added to the gas flow, and the reactor was heated to 600 °C with a heating rate of 20 °C/min, thus providing the reduction of the catalyst. After the reduction procedure, the reactor was fed with the desired reaction mixture (Table 1). The composition of the reaction mixture at the reactor’s outlets was analyzed by a dual-channel gas chromatograph ‘CHROMOS’ with a flame ionization detector (LLC ‘Chromos Engineering’, Dzerzhinsk, Russia). A CarbonBlack column (#80459-800, 0.19% picric acid; Restek Corp., State College, Bellefonte, PA, USA) was used to separate the reaction mixture components. Helium was fed as a purge gas with a flowrate of 30 mL/min.

2.3. Characterization of the Carbon by-Product

The specific surface area (SSA) of the carbon by-product was measured by low-temperature nitrogen adsorption using the Brunauer–Emmett–Teller (BET) method. The nitrogen adsorption isotherms were recorded at 77 K on ASAP-2400 apparatus (Micromeritics, Norcross, GA, USA).
The structural and morphological features of the carbon by-product were studied by scanning (SEM) and transmission electron microscopies (TEM). In the case of scanning electron microscopy, a JSM-6460 microscope (JEOL Ltd., Tokyo, Japan) with magnifications ranging from ×8 to ×300,000 was used. The transmission electron microscopic (TEM) images were obtained using a JEOL JEM-2010 electron microscope (JEOL Ltd., Tokyo, Japan). The latter microscope operates at an accelerating voltage of 200 kV and possesses a lattice resolution of 0.14 nm.

3. Results and Discussion

At the first stage of the research, the kinetics of the catalytic decomposition process for various reaction mixtures was studied. The accumulation of the carbon by-product was monitored by McBain balances. The results for the three mixtures representing natural gas (RM-2), associated petroleum gas (RM-3), and household fuel gas (RM-4) are shown in Figure 2. No odd hydrogen or methane was added to the mixture in this case. As seen from the graph, the highest weight change corresponding to the highest carbon yield is observed for the household fuel gas decomposition. This reaction mixture initially does not contain methane at all (Table 1). In the case of associated petroleum gas (RM-3), the ratio of methane to fat C2+ hydrocarbons is almost 1:1. Thereby, the decomposition of this mixture gives a 1.4 times lower value of the carbon yield. The lowest carbon yield is expectedly found for natural gas (RM-2), which predominantly contains methane (Table 1). The corresponding weight change is 6.5 and 4.5 lower compared with RM-4 and RM-3, accordingly. Such a low efficiency of the catalyst in the methane decomposition is explained by the thermodynamic limitations of the reaction. An additional curve was obtained by the simple summation of the RM-2 and RM-4 curves with equal contributions of 0.5, which approximately corresponds to the RM-3 composition. As seen, this calculated curve lies below the RM-3 curve. This means that, in practice, the decomposition of the fat C2+ hydrocarbons of the reaction mixture with the formation of carbon by-product and hydrogen proceeds more efficiently in the presence of methane. Methane presented in the gas phase suppresses the methane formation reaction and shifts the equilibrium towards the carbon and hydrogen side.
It should be emphasized that, in all the cases, after 4–7 min of the experiment, the kinetic curves reach a plateau, indicating the deactivation of the catalyst. As reported by Streltsov et al. [39,41], the deactivation process is connected with the formation of non-structured carbon deposits, blocking the active sites, and preventing them from contact with hydrocarbon molecules.
The addition of extra hydrogen to the reaction mixture RM-2 (natural gas) changes the situation significantly. As follows from Figure 3, the hydrogen addition stabilizes the catalyst’s activity and allows obtaining a higher carbon yield. The more hydrogen that is added, the higher the carbon yield achieved. It is evident that the deactivation process is reversible. Odd hydrogen interacts firstly with non-structured carbon deposits and cleans the surface of metal particles, thus making it accessible for the reagents. When the concentration of odd hydrogen was 20 vol%, the slope of the kinetic curve remained unchanged during the whole experiment. Therefore, under such conditions, the process of the non-structured carbon deposition is practically prevented. On the other hand, this means that the hydrogen concentration in the reaction volume should always be high enough to provide the stable operation of the catalyst. Presumably, hydrogen excess in the reaction medium can affect the texture and morphology of the structured carbon by-product.
As the interaction of hydrogen with any carbon results in the formation of methane (Equation (2)), the addition of odd methane is of high interest. An increase in the methane concentration in the reaction volume should shift the reaction equilibrium towards carbon and hydrogen. For the kinetic studies, three reaction mixtures with different methane concentrations were used. Kinetic curves for these mixtures are presented in Figure 4. In the case of the mixture RM-5 consisting of pure methane (80 vol%) and hydrogen (20 vol%), the carbon by-product deposition efficiency is the worst one. Dilution of the RM-2 mixture with 20 vol% hydrogen leads to a methane concentration of 73.6 vol% along with the sum content of the fat C2+ hydrocarbons of 1.6 vol%. Such a mixture decomposes more efficiently. At the same time, the slope of the curve decreases after 30 min of the experiment. A more linear curve is observed for the RM-1 mixture diluted with 20 vol% of hydrogen. In this mixture, the methane concentration is as low as 71.2 vol%, and the concentration of the fat C2+ hydrocarbons is as high as 5.2 vol%. Under such conditions, the catalyst exhibits a better and stable catalytic performance.
Therefore, in the case of processing of natural gas with a high content of methane, the addition of 5–20 vol% of odd hydrogen is required to provide the deep enough conversion of hydrocarbons. This amount of hydrogen can be further recycled at the scale of industrial implementation of the process. On the contrary, the processing of associated petroleum gases containing a considerable amount of fat C2+ hydrocarbons can be realized without the addition of odd hydrogen, as far as the amount of hydrogen formed during the decomposition is enough for the stable catalyst operation. Along with this, the hydrogen concentration affects the texture and morphology of the co-produced carbon materials. As an example, Figure 5a shows the SEM images of the carbon by-product collected during the experiment with the RM-1 + 20% H2 reaction mixture. The formed nanofibers are characterized by relatively wide diameter distribution, which is quite typical for the kind of catalyst used. The size of the fibers can be estimated from Figure 5b–d, where the magnified images are demonstrated. It is evident from the images that, besides the thin fibers of a few nm in diameter, a dominant amount of thick fibers with a diameter range of 0.1–0.6 µm is present.
In the next series of experiments performed in the horizontal reactor with control of the reaction gases’ composition at six outlets (see Figure 1), the RM-4 mixture was used. The mixture was also diluted with hydrogen or methane. Figure 6 shows how the gas composition and the specific surface area of the carbon by-product change from one portion of the catalyst to others. In the case of the pure RM-4 mixture (Figure 6a), decomposition of propane, butane, and other C2+ hydrocarbons is intensified starting from the second position. The hydrogen concentration grows almost linearly and reaches the maximal value of ~55 vol% at the fourth position. This point seems to be crucial in terms of the methane formation reaction. Before this point, the methane concentration increases slowly, then the process of the methane formation noticeably accelerates. Thus, in the fourth position, the methane content was just 9 vol%, and at the sixth position, it was already 44 vol%. Such intensive methane formation decreases the hydrogen concentration to 50 vol%. The observed changes in the local reaction conditions result in a drop in the SSA value at the fifth position. According to the TEM data (Figure 7a), the carbon by-product is represented by dense nanofibers of a fishbone morphology.
Dilution of the RM-4 mixture with hydrogen (42 vol%) significantly decreases the conversion of hydrocarbons and, therefore, the efficiency of hydrogen production (Figure 6b). The contribution of the methane formation reaction is not so high. The maximum concentration of formed methane does not exceed 6.4 vol%. At the same time, the SSA values for the carbon by-product at all the catalyst positions surpass 215 m2/g. The fibers possess such a developed surface area due to a fluffy disordered structure (Figure 7b), which was named as a feathery-like structure [42].
In the last case, when methane was added to the RM-4 mixture instead of hydrogen, no formation of additional methane was observed (Figure 6c). Moreover, methane was involved in the decomposition process. Its concentration reduced on 3 vol%, if compared with the first and the sixth positions. The propane conversion reached 35% at the main outlet. The corresponding concentration of the produced hydrogen was as high as 18.7 vol%. These data are in good agreement with the results presented in Figure 2. Odd methane completely hinders the methane formation route. The dominant morphology of the formed carbon fibers is so-called pseudo-nanotube—fishbone nanofibers with a hollow channel inside (Figure 7c). According to the SSA values presented in Figure 6c, which are the lowest compared with the two previous cases, the obtained nanofibers are the densest and structured ones. The difference in the SSA values between the samples from the first and sixth positions is not crucial and does not exceed 30 m2/g.
Taking into account all the presented results, it can be assumed that, depending on the exact composition of the mixture of hydrocarbons, the hydrogen production efficiency and the morphology of the formed carbon by-product can be sufficiently different. The morphological types observed within the present study are ordered fishbone fibers, disordered feathery-like fibers, and semi-ordered fishbone fibers with a hollow channel inside. The higher the methane content, the more ordered the structure of the carbon by-product. In contrast, if the methane content is low or if odd hydrogen is added to the reaction volume, the structure of the formed fibers is maximally disordered. Such a feature is explained by the occurrence of the methane formation reaction.
As the composition of the hydrocarbon mixture from real natural sources can be varied in a wide range, the C1/C2+ ratio should be used as a criterion to choose between the qualification of the carbon by-product and the hydrogen productivity. It should also be mentioned that the continual presence of hydrogen in the reaction volume is required to provide the stable operation of the catalyst without its deactivation caused by the coke formation.

4. Conclusions

The features of the hydrogen production and the carbon by-product formation via the catalytic decomposition of various hydrocarbon mixtures were revealed. Hydrocarbons originating from different natural sources (natural gas, associated petroleum gas, and so on) represent a mixture of a complex composition. Usually, such a mixture contains methane and fat C2+ hydrocarbons. In the present research, a few reaction mixtures with different C1/C2+ ratios were used for the catalytic decomposition process. The effect of odd hydrogen addition to the reaction mixture was studied as well. The experiments were performed in the vertical quartz reactor equipped with McBain balances, which allowed following the kinetics of the process, and in the horizontal quartz reactor with piecemeal loading of the catalyst. The following conclusions can be formulated based on the obtained results.
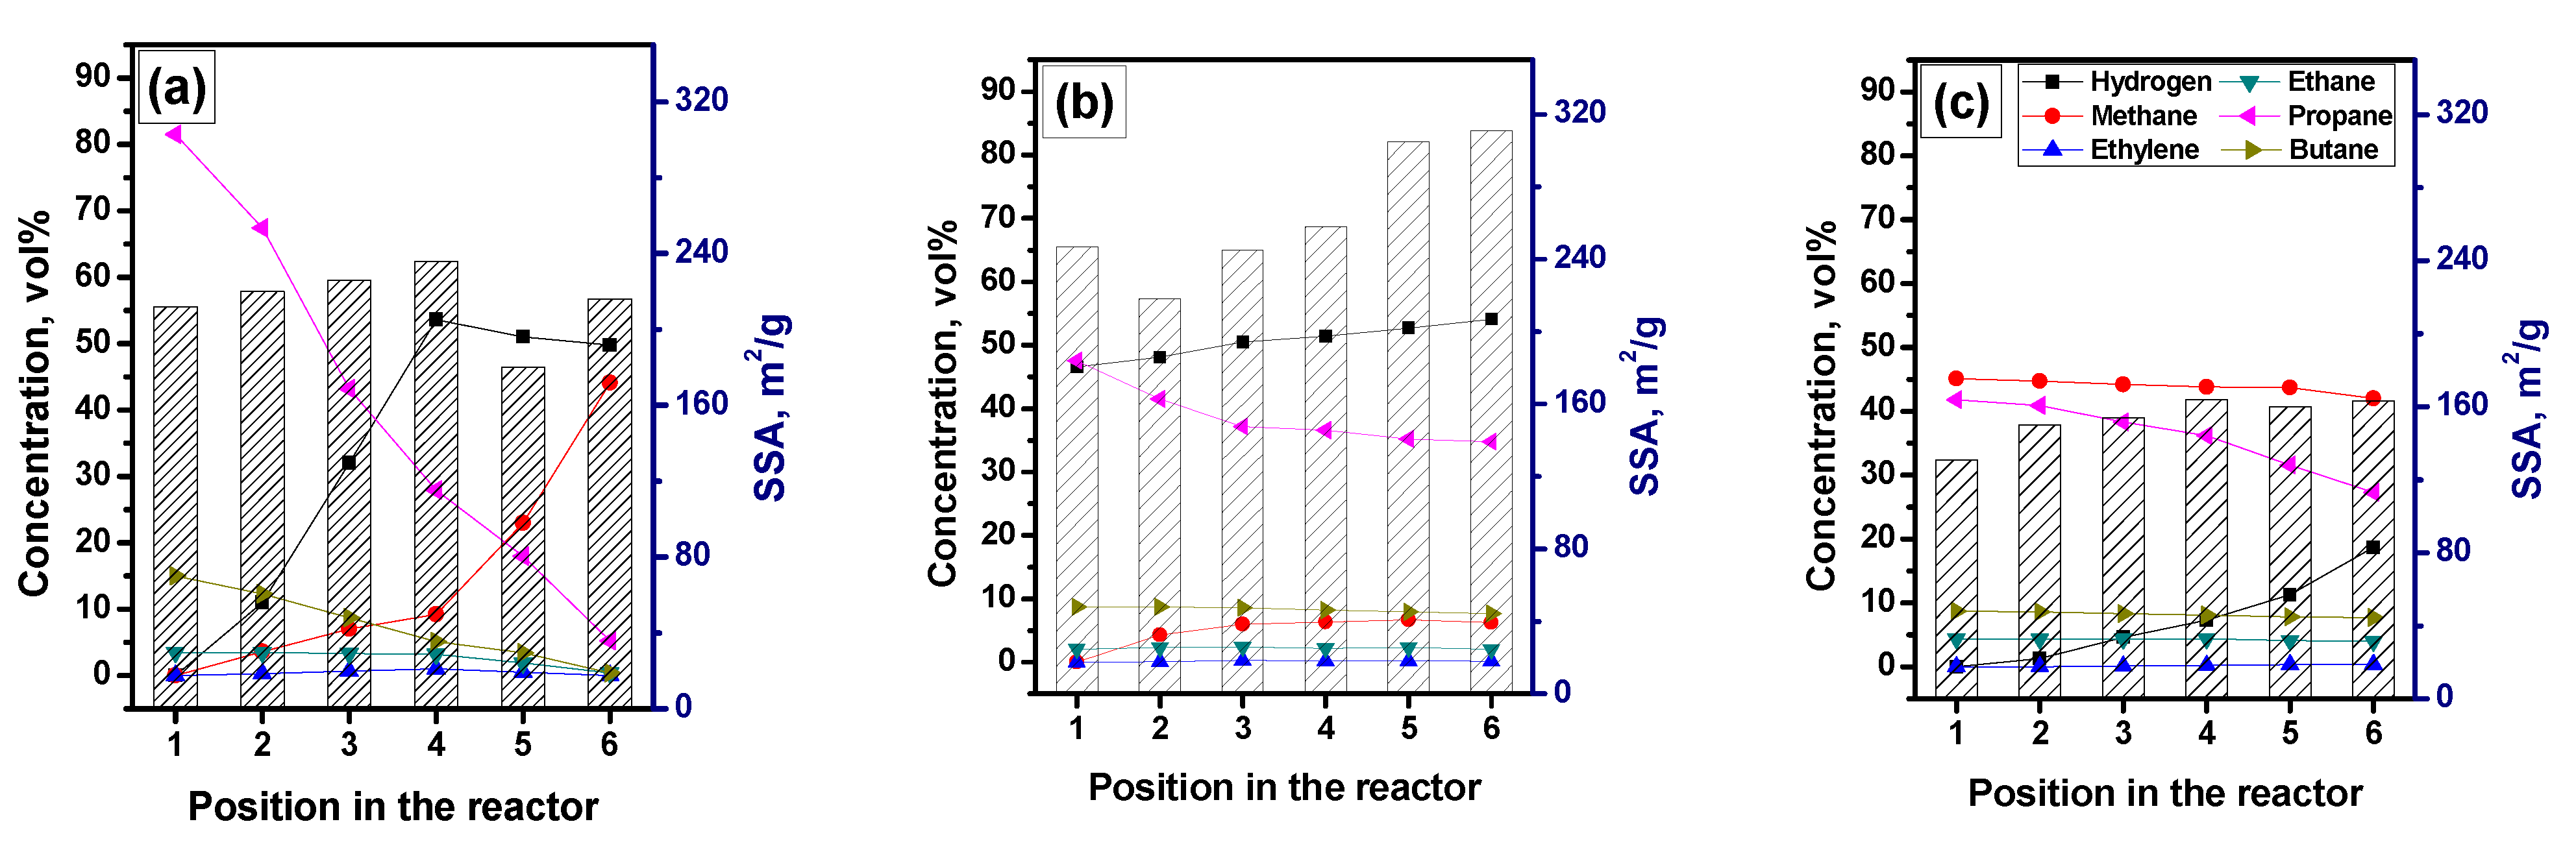
  • The presence of odd hydrogen in the reaction volume is required for the stable operation of the catalyst. Otherwise, the catalyst will be deactivated by the forming coke, and the process will stop.
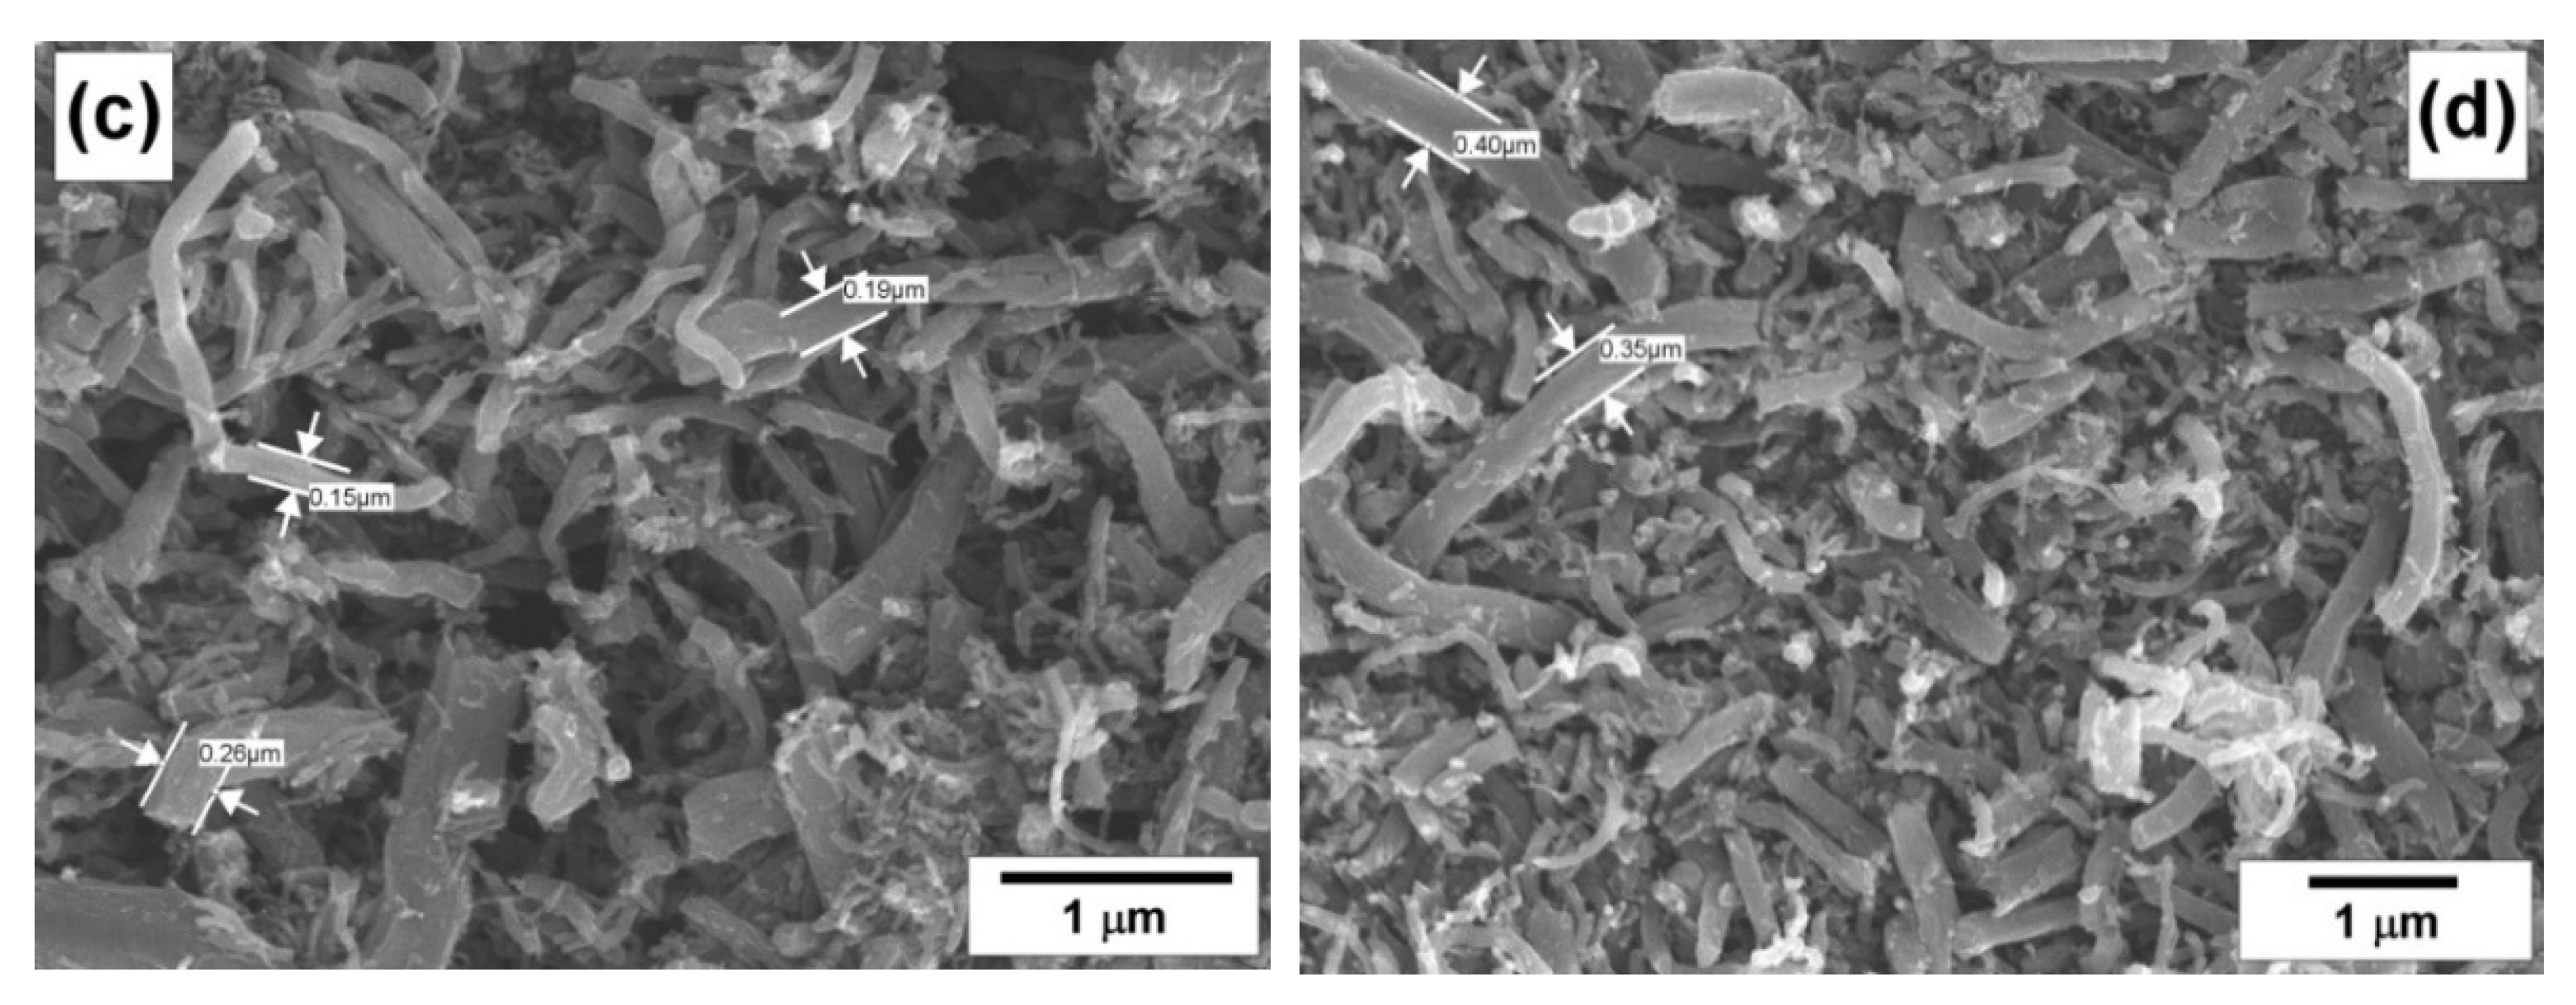
  • If the hydrogen concentration in the reaction volume surpasses a crucial value of ~50 vol%, the methane formation reaction accelerates, thus leading to the loss of the produced hydrogen. In this case, the morphology of the carbon by-product corresponds to fluffy nanofibers with a feathery-like disordered structure.
  • The methane formation reaction can be suppressed by increasing the methane concentration in the reaction mixture. The formed carbon nanofibers are characterized by increased density and a completely ordered structure.

Author Contributions

Conceptualization, A.A.V. and I.V.M.; methodology, Y.I.B.; validation, Y.I.B., A.Y.N. and A.A.V.; formal analysis, A.A.G. and I.V.M.; investigation, Y.I.B. and D.V.K.; resources, I.V.M., A.Y.N. and A.A.G.; data curation, Y.I.B. and I.V.M.; writing—original draft preparation, A.A.V. and I.V.M.; writing—review and editing, A.A.V.; supervision, A.A.G. and I.V.M.; project administration, A.Y.N.; funding acquisition, A.A.G. All authors have read and agreed to the published version of the manuscript.

Funding

This research was funded by the Ministry of Science and Higher Education of the Russian Federation, project numbers AAAA-A21-121011390054-1 and 075-00268-20-02 (ID: 07180-2020-0040).

Institutional Review Board Statement

Not applicable.

Informed Consent Statement

Not applicable.

Data Availability Statement

The data presented in this study are available on request from the corresponding author. The data are not publicly available due to privacy reasons.

Acknowledgments

Microscopic studies of the carbon materials were partly performed using the equipment of the Center of Collective Use ‘National Center of Catalysts Research’.

Conflicts of Interest

The authors declare no conflict of interest.

References

  1. Rouwenhorst, K.H.R.; Krzywda, P.M.; Benes, N.E.; Mul, G.; Lefferts, L. Ammonia Production Technologies. In Techno-Economic Challenges of Green Ammonia as an Energy Vector; Academic Press: Cambridge, MA, USA, 2021; pp. 41–83. [Google Scholar] [CrossRef]
  2. Kim, S.; Kim, J. The optimal carbon and hydrogen balance for methanol production from coke oven gas and Linz-Donawitz gas: Process development and techno-economic analysis. Fuel 2020, 266. [Google Scholar] [CrossRef]
  3. Monnerie, N.; Gan, P.G.; Roeb, M.; Sattler, C. Methanol production using hydrogen from concentrated solar energy. Int. J. Hydrog. Energy 2020, 45, 26117–26125. [Google Scholar] [CrossRef]
  4. Zeinalipour-Yazdi, C.D.; Catlow, C.R.A. A Computational Study of the Heterogeneous Synthesis of Hydrazine on Co3Mo3N. Catal. Lett. 2017, 147, 1820–1826. [Google Scholar] [CrossRef] [PubMed] [Green Version]
  5. Sun, X.; Chen, M.; Jensen, S.H.; Ebbesen, S.D.; Graves, C.; Mogensen, M. Thermodynamic analysis of synthetic hydrocarbon fuel production in pressurized solid oxide electrolysis cells. Int. J. Hydrog. Energy 2012, 37, 17101–17110. [Google Scholar] [CrossRef]
  6. Gupta, M.K. Hydrogenation. In Practical Guide to Vegetable Oil Processing; AOCS Press: Urbana, IL, USA, 2017; pp. 171–215. [Google Scholar] [CrossRef]
  7. Dijkstra, A.J.; van Duijn, G. Vegetable Oils: Oil Production and Processing. In Encyclopedia of Food and Health; Academic Press: Cambridge, MA, USA, 2016; pp. 373–380. [Google Scholar] [CrossRef]
  8. Sun, Z.-Y. Hydrogen energy. In Sustainable Fuel Technologies Handbook; Academic Press: Cambridge, MA, USA, 2021; pp. 339–365. [Google Scholar] [CrossRef]
  9. Yürüm, Y. Hydrogen Production Methods. In Hydrogen Energy System; Springer: Dordrecht, The Netherlands, 1995; pp. 15–30. [Google Scholar] [CrossRef]
  10. Balat, M. Hydrogen-Rich Gas Production from Biomass via Pyrolysis and Gasification Processes and Effects of Catalyst on Hydrogen Yield. Energy Sourcespart A Recoveryutilizationand Environ. Eff. 2008, 30, 552–564. [Google Scholar] [CrossRef]
  11. Franchi, G.; Capocelli, M.; De Falco, M.; Piemonte, V.; Barba, D. Hydrogen Production via Steam Reforming: A Critical Analysis of MR and RMM Technologies. Membranes 2020, 10, 10. [Google Scholar] [CrossRef] [PubMed] [Green Version]
  12. Koskin, A.P.; Zibareva, I.V.; Vedyagin, A.A. Conversion of Rice Husk and Nutshells into Gaseous, Liquid, and Solid Biofuels. In Biorefinery of Alternative Resources: Targeting Green Fuels and Platform Chemicals; Springer: Singapore, 2020; pp. 171–194. [Google Scholar] [CrossRef]
  13. Shimamoto, D.; Muramatsu, H.; Fujisawa, K.; Hayashi, T.; Kim, Y.A.; Endo, M. Synthesis of catalytic chemical vapor grown carbon fibers: Carbon nanotube and carbon nanofiber. Carbon 2011, 49. [Google Scholar] [CrossRef]
  14. Docekal, J. Hydrogen production from hydrocarbons. Int. J. Hydrog. Energy 1986, 11, 709–714. [Google Scholar] [CrossRef]
  15. Li, Y.; Chen, J.; Qin, Y.; Chang, L. Simultaneous Production of Hydrogen and Nanocarbon from Decomposition of Methane on a Nickel-Based Catalyst. Energy Fuels 2000, 14, 1188–1194. [Google Scholar] [CrossRef]
  16. Muradov, N.; Vezirolu, T. From hydrocarbon to hydrogen–carbon to hydrogen economy. Int. J. Hydrog. Energy 2005, 30, 225–237. [Google Scholar] [CrossRef]
  17. Rahman, M.S.; Croiset, E.; Hudgins, R.R. Catalytic Decomposition of Methane for Hydrogen Production. Top. Catal. 2006, 37, 137–145. [Google Scholar] [CrossRef]
  18. Onsan, I. Catalytic Processes for Clean Hydrogen Production from Hydrocarbons. Turk. J. Chem. 2007, 31, 531–550. [Google Scholar]
  19. Nguyen, M.C.; Lee, H.; Ihm, J. Hydrogen storage using functionalized saturated hydrocarbons. Solid State Commun. 2008, 147, 419–422. [Google Scholar] [CrossRef]
  20. Ahmed, S.; Aitani, A.; Rahman, F.; Al-Dawood, A.; Al-Muhaish, F. Decomposition of hydrocarbons to hydrogen and carbon. Appl. Catal. A Gen. 2009, 359, 1–24. [Google Scholar] [CrossRef]
  21. Ibrahim, A.A.; Fakeeha, A.H.; Al-Fatesh, A.S.; Abasaeed, A.E.; Khan, W.U. Methane decomposition over iron catalyst for hydrogen production. Int. J. Hydrog. Energy 2015, 40, 7593–7600. [Google Scholar] [CrossRef]
  22. Tezel, E.; Figen, H.E.; Baykara, S.Z. Hydrogen production by methane decomposition using bimetallic Ni–Fe catalysts. Int. J. Hydrog. Energy 2019, 44, 9930–9940. [Google Scholar] [CrossRef]
  23. Swesi, Y.; Kerleau, P.; Pitault, I.; Heurtaux, F.; Ronze, D. Purification of hydrogen from hydrocarbons by adsorption for vehicles application. Sep. Purif. Technol. 2007, 56, 25–37. [Google Scholar] [CrossRef]
  24. Shelepova, E.V.; Vedyagin, A.A.; Mishakov, I.V.; Noskov, A.S. Simulation of hydrogen and propylene coproduction in catalytic membrane reactor. Int. J. Hydrog. Energy 2015, 40, 3592–3598. [Google Scholar] [CrossRef]
  25. Newborough, M.; Cooley, G. Developments in the global hydrogen market: The spectrum of hydrogen colours. Fuel Cells Bull. 2020, 2020, 16–22. [Google Scholar] [CrossRef]
  26. Al-Fatesh, A.S.; Fakeeha, A.H.; Khan, W.U.; Ibrahim, A.A.; He, S.; Seshan, K. Production of hydrogen by catalytic methane decomposition over alumina supported mono-, bi- and tri-metallic catalysts. Int. J. Hydrog. Energy 2016, 41, 22932–22940. [Google Scholar] [CrossRef]
  27. Chesnokov, V.V.; Chichkan, A.S. Production of hydrogen by methane catalytic decomposition over Ni–Cu–Fe/Al2O3 catalyst. Int. J. Hydrog. Energy 2009, 34, 2979–2985. [Google Scholar] [CrossRef]
  28. Silva, R.R.C.M.; Oliveira, H.A.; Guarino, A.C.P.F.; Toledo, B.B.; Moura, M.B.T.; Oliveira, B.T.M.; Passos, F.B. Effect of support on methane decomposition for hydrogen production over cobalt catalysts. Int. J. Hydrog. Energy 2016, 41, 6763–6772. [Google Scholar] [CrossRef]
  29. Syed Muhammad, A.F.; Awad, A.; Saidur, R.; Masiran, N.; Salam, A.; Abdullah, B. Recent advances in cleaner hydrogen productions via thermo-catalytic decomposition of methane: Admixture with hydrocarbon. Int. J. Hydrog. Energy 2018, 43, 18713–18734. [Google Scholar] [CrossRef] [Green Version]
  30. Jian, X.; Jiang, M.; Zhou, Z.; Zeng, Q.; Lu, J.; Wang, D.; Zhu, J.; Gou, J.; Wang, Y.; Hui, D.; et al. Gas-Induced Formation of Cu Nanoparticle as Catalyst for High-Purity Straight and Helical Carbon Nanofibers. ACS Nano 2012, 6, 8611–8619. [Google Scholar] [CrossRef] [PubMed]
  31. Simon, A.; Seyring, M.; Kämnitz, S.; Richter, H.; Voigt, I.; Rettenmayr, M.; Ritter, U. Carbon nanotubes and carbon nanofibers fabricated on tubular porous Al2O3 substrates. Carbon 2015, 90, 25–33. [Google Scholar] [CrossRef]
  32. Bayat, N.; Rezaei, M.; Meshkani, F. Methane decomposition over Ni–Fe/Al2O3 catalysts for production of COx-free hydrogen and carbon nanofiber. Int. J. Hydrog. Energy 2016, 41, 1574–1584. [Google Scholar] [CrossRef]
  33. Fakeeha, A.H.; Ibrahim, A.A.; Khan, W.U.; Seshan, K.; Al Otaibi, R.L.; Al-Fatesh, A.S. Hydrogen production via catalytic methane decomposition over alumina supported iron catalyst. Arab. J. Chem. 2018, 11, 405–414. [Google Scholar] [CrossRef] [Green Version]
  34. Shen, Y.; Lua, A.C. Synthesis of Ni and Ni–Cu supported on carbon nanotubes for hydrogen and carbon production by catalytic decomposition of methane. Appl. Catal. B Environ. 2015, 164, 61–69. [Google Scholar] [CrossRef]
  35. Ping, D.; Wang, C.; Dong, X.; Dong, Y. Co-production of hydrogen and carbon nanotubes on nickel foam via methane catalytic decomposition. Appl. Surf. Sci. 2016, 369, 299–307. [Google Scholar] [CrossRef]
  36. Karaismailoglu, M.; Figen, H.E.; Baykara, S.Z. Hydrogen production by catalytic methane decomposition over yttria doped nickel based catalysts. Int. J. Hydrog. Energy 2019, 44, 9922–9929. [Google Scholar] [CrossRef]
  37. Berndt, F.M.; Perez-Lopez, O.W. Catalytic decomposition of methane over Ni/SiO2: Influence of Cu addition. React. Kinet. Mech. Catal. 2016, 120, 181–193. [Google Scholar] [CrossRef]
  38. Chesnokov, V.V.; Buyanov, R.A. The formation of carbon filaments upon decomposition of hydrocarbons catalysed by iron subgroup metals and their alloys. Russ. Chem. Rev. 2000, 69, 623–638. [Google Scholar] [CrossRef]
  39. Strel’tsov, I.A.; Vinokurova, O.B.; Tokareva, I.V.; Mishakov, I.V.; Isupov, V.P.; Shubin, Y.V.; Vedyagin, A.A. Effect of the nature of a textural promoter on the catalytic properties of a nickel-copper catalyst for hydrocarbon processing in the production of carbon nanofibers. Catal. Ind. 2014, 6, 176–181. [Google Scholar] [CrossRef]
  40. Bauman, Y.I.; Lysakova, A.S.; Rudnev, A.V.; Mishakov, I.V.; Shubin, Y.V.; Vedyagin, A.A.; Buyanov, R.A. Synthesis of nanostructured carbon fibers from chlorohydrocarbons over Bulk Ni-Cr Alloys. Nanotechnologies Russ. 2014, 9, 380–385. [Google Scholar] [CrossRef]
  41. Streltsov, I.A.; Mishakov, I.V.; Vedyagin, A.A.; Melgunov, M.S. Synthesis of Carbon Nanomaterials from Hydrocarbon Raw Material on Ni/SBA–15 Catalyst. Chem. Sustain. Dev. 2014, 22, 185–192. [Google Scholar]
  42. Mishakov, I.V.; Buyanov, R.A.; Zaikovskii, V.I.; Strel’tsov, I.A.; Vedyagin, A.A. Catalytic synthesis of nanosized feathery carbon structures via the carbide cycle mechanism. Kinet. Catal. 2008, 49, 868–872. [Google Scholar] [CrossRef]
Figure 1. Scheme of the tubular catalytic reactor for the decomposition of hydrocarbons (HC).
Hydrogen 02 00007 g001
Figure 2. Effect of the reaction mixture (RM) composition on the kinetics of carbon deposition over NiO-CuO-Al2O3 catalyst at 600 °C. The mixtures represent natural gas (RM-2), associated petroleum gas (RM-3), and household fuel gas (RM-4). The exact reaction mixture compositions are given in Table 1. The calculated curve is observed by the summation of the RM-2 and RM-4 curves with a 0.5 contribution.
Hydrogen 02 00007 g002
Figure 3. Effect of the hydrogen concentration in the reaction mixture RM-2 on the kinetics of carbon deposition over NiO-CuO-Al2O3 catalyst at 600 °C. The exact reaction mixture compositions are given in Table 1.
Hydrogen 02 00007 g003
Figure 4. Effect of the methane concentration in the reaction mixture on the kinetics of carbon deposition over the NiO-CuO-Al2O3 catalyst at 600 °C and hydrogen content of 20 vol%. The exact reaction mixture compositions are given in Table 1.
Hydrogen 02 00007 g004
Figure 5. Scanning electron microscopy (SEM) images of the carbon by-product obtained via decomposition of the RM-1 + 20% H2 reaction mixtures over NiO-CuO-Al2O3 catalyst at 600 °C. The magnifications are ×9000 (a), ×9500 (b), ×22,000 (c), and ×14,000 (d).
Hydrogen 02 00007 g005aHydrogen 02 00007 g005b
Figure 6. Composition of the outlet gaseous products and specific surface area (SSA) of the solid carbonaceous by-product obtained via the decomposition of various reaction mixtures over NiO-CuO-Al2O3 catalyst at 600 °C: (a) RM-4; (b) RM-4 + 42% H2; and (c) RM-4 + 45% CH4. The exact reaction mixture compositions are given in Table 1.
Hydrogen 02 00007 g006
Figure 7. Transmission electron microscopy (TEM) images of the solid carbonaceous by-product obtained via the decomposition of various reaction mixtures over NiO-CuO-Al2O3 catalyst at 600 °C: (a) RM-4; (b) RM-4 + 42% H2; and (c) RM-4 + 45% CH4. The exact reaction mixture compositions are given in Table 1.
Hydrogen 02 00007 g007
Table 1. The composition of the model reaction mixtures used for the catalytic tests.
The Reaction Mixture (RM)Composition of the Model Reaction Mixture, vol.%
H2CH4C2H6C3H8C4H10CO2N2S-Containing Compounds
RM-1089.05.01.00.54.500
RM-2092.02.02.04.0traces
RM-30465112traces
RM-4003.581.51500traces
RM-52080000000
RM-1 + 20% H22071.25.23.600
RM-2 + 5% H2587.41.91.93.8traces
RM-2 + 10% H21082.81.81.83.6traces
RM-2 + 15% H21578.21.71.73.4traces
RM-2 + 20% H22073.61.61.63.2traces
RM-4 + 42% H24202.047.38.700traces
RM-4 + 45% CH40451.944.88.300traces
Publisher’s Note: MDPI stays neutral with regard to jurisdictional claims in published maps and institutional affiliations.

