
Obesity and Ideal Cardiovascular Health: Results from the My Research Legacy Study


1
Division of Cardiovascular Medicine, Brigham and Women’s Hospital, Harvard Medical School, 77 Avenue Louis Pasteur, NRB630K, Boston, MA 02115, USA
2
Division of Cardiovascular Medicine, Brigham and Women’s Hospital, Harvard Medical School, 75 Francis Street, Boston, MA 02115, USA
*
Author to whom correspondence should be addressed.
Obesities 2021, 1(1), 36-48; https://0-doi-org.brum.beds.ac.uk/10.3390/Obesities1010004
Submission received: 4 April 2021
/
Revised: 23 April 2021
/
Accepted: 23 April 2021
/
Published: 28 April 2021
Abstract
:Obesity is associated with increased risk for cardiovascular diseases compared to normal-weight and overweight status. We hypothesized that obese subjects would have lower ideal cardiovascular health than normal-weight and overweight subjects, but a subset among the obese would have a favorable cardiovascular health profile. Differences in ideal cardiovascular health between normal-weight (n = 523), overweight (n = 378), and obese (n = 660) subjects were examined using data from the Life’s Simple 7 survey and digital health devices. Obese participants were more likely to have prevalent cardiovascular disease, diabetes mellitus, hypertension, and hypercholesterolemia compared to normal weight and overweight (all p < 0.01). Life’s Simple 7 Health Scores, a measure of ideal cardiovascular health, were lower in obese than in normal-weight and overweight groups (5.6 ± 1.2 vs. 8.0 ± 1.1 vs. 6.8 ± 1.1, p < 0.01). A subset of obese with ideal cardiovascular health scores was identified (n = 103). Compared to obese with non-ideal health scores (n = 557), these individuals were more likely to have ideal cardiovascular risk factor status, diet, and exercise profiles. These findings indicate that there is heterogeneity among obese persons and suggest that an assessment of cardiovascular health factors and behaviors can identify areas for intervention beyond weight reduction alone to optimize cardiovascular health.
1. Introduction
Obesity is recognized as an independent risk factor for incident cardiovascular diseases and major adverse cardiovascular and cerebrovascular events [1,2,3]. The National Heart, Lung, and Blood Institutes (NHLBI) define obesity as a body mass index (BMI) ≥ 30 kg/m2: a BMI of <25 kg/m2 is normal weight and a BMI ≥ 25–29.9 kg/m2 is considered overweight [3,4]. In the United States, using National Health and Nutrition Examination Survey (NHANES) study data from 2015 to 2016, the prevalence of obesity was 39.6% [5]. In this study population, 36.0% of males and 40.4% of females met criteria for obesity with a higher percentage of women than men having severe or class III obesity (BMI ≥ 40 kg/m2) [5,6]. The age-standardized prevalence of obesity among adults in the United States has increased substantially over the past decade with a linear trend observed in women (36.5% to 41.1%), but not in men (33.4% to 35.1%) [5,7]. There are also race, ethnic, and regional differences in the prevalence of obesity with higher rates in Hispanics and non-Hispanic blacks than in whites and Asians, and variability is also noted by region [3,6].
The correlation between obesity and cardiovascular risk is substantial with increased risk associated with a higher BMI [8]. This relationship has been attributed, in part, to a higher prevalence of diabetes mellitus, hypertension, and hypercholesterolemia in obese compared to non-obese individuals [3,8,9]. In 2013, a meta-analysis reported that there was an obesity paradox, and that cardiovascular mortality was lower in overweight and obese individuals compared to normal-weight individuals [10]. This concept was controversial in the field, and investigators suggested that the observed obesity paradox was due to misclassification bias, selection bias, or reverse causation [11,12,13,14,15]. An important concept known as the “fat-but-fit” paradigm emerged from the controversy surrounding the meta-analysis: a subgroup of obese individuals exists with high levels of cardiorespiratory fitness and lower cardiovascular risk than unfit obese individuals [16]. It has been estimated that ~17% of individuals aged 20–49 years in the United States would be considered fat-but-fit, and this has been observed in both men and women [16,17,18,19,20].
The American Heart Association has recognized the role of body weight in achieving ideal cardiovascular health [3,21,22]. The Life’s Simple 7 survey, an instrument created by the American Heart Association to assess ideal cardiovascular health, includes maintenance of a healthy body weight (BMI < 25 kg/m2) as an ideal component of the overall health score. In addition to weight, the Life’s Simple 7 instrument evaluates 6 other health factors and health behaviors that are related to cardiovascular health and disease and are modifiable with lifestyle interventions [22,23]. These health factors and behaviors include blood pressure, cholesterol levels, blood glucose levels, smoking, diet, and physical activity [23]. By focusing on weight, associated comorbidities, and lifestyle behaviors related to cardiorespiratory fitness, the Life’s Simple 7 survey provides a comprehensive picture of cardiovascular health.
In the current study, we hypothesized that ideal cardiovascular health assessed by Life’s Simple 7 would be lower in obese compared to normal-weight and overweight individuals. We further hypothesized that there was heterogeneity among obese individuals and that we would identify a subgroup of obese individuals with ideal cardiovascular health factor status and health behavior profiles that differed significantly from obese individuals who did not achieve ideal cardiovascular health.
2. Materials and Methods
2.1. Study Cohort
The My Research Legacy study was a cross-sectional study that examined ideal cardiovascular health in samples from across the United States [24]. This was a direct-to-participant study that was conducted entirely online and enrolled participants between November 2016 and October 2018. The study was sponsored by the American Heart Association and open to all individuals ≥18 years of age who resided in the United States and had internet access. The study was approved by the Advarra Institutional Review Board (www.advarra.com accessed on 27 April 2021) (approval# 31995). Individuals who participated in the study signed informed consent online. Participants in the study self-reported demographic data, prior history of cardiovascular diseases, and cardiovascular disease risk factors and answered questions about health and lifestyle data in the Life’s Simple 7 survey of ideal cardiovascular health [24].
Participants were also offered the option to provide digital health device data for the study; however, the study protocol did not mandate use of these devices for participation. A subgroup of participants who provided informed consent for this part of the study either registered their own device with the study or were provided a Fitbit Charge 2 digital health and activity device by the sponsor. Individuals who submitted digital weight data had linked their digital scales to their other digital health devices. The subgroup of participants who registered digital devices received a unique link to Validic (Validic Inc., Durham, NC, USA) to upload their digital health device data. The uploaded digital health device data were de-identified, sorted into weight, fitness, or routine data by Validic based on device-specific algorithms, and transmitted as JSON files to secure servers at The Broad Institute (Cambridge, MA, USA) and REAN Cloud LLC (Herndon, VA, USA) [24].
2.2. Overweight, Obesity, and Ideal Cardiovascular Health
Weight status was ascertained by participant self-report and categorized as normal weight (BMI < 25.0 kg/m2), overweight (BMI ≥ 25.0 kg/m2 and ≤ 29.9 kg/m2), or obese (BMI ≥ 30 kg/m2). Obesity class was determined using NHLBI categories (class I = BMI 30–35 kg/m2; class II = BMI > 35–39.9 kg/m2; class III = BMI > 40 kg/m2) [3]. The Life’s Simple 7 survey instrument was used as a tool to assess ideal cardiovascular health. Study participants answered survey questions online about health factors (blood pressure, cholesterol, and blood glucose levels) and health behaviors (weight, smoking history, diet, and moderate and vigorous exercise). A score of 0, 1, or 2 is assigned to each category based on criteria defined by a panel of experts and corresponds to poor, intermediate, or ideal for each of the health factors and health behaviors. The overall Life’s Simple 7 Health Score ranges between 0 (poor) and 10 (ideal) and is calculated using scores from the 7 health factors and behaviors category scores [22,23]. Ideal cardiovascular health has also been defined by having an ideal score for a minimum of 5 health factor and behavior categories as well as a Life’s Simple 7 Health Score of >7.0 [3,21].
2.3. Statistical Analysis
Sample size estimation to ensure that obese individuals were represented adequately in our study cohort was determined based on the study population of 1561 participants who completed the Life’s Simple 7 survey instrument. Assuming a prevalence of obesity of 39.6% at the time of the start of the study [25], to achieve 95% power with an alpha = 0.05, the minimum sample size of obese individuals required was 298 participants.
Normality was assessed using the Shapiro–Wilk test. Comparisons between continuous variables were performed using t-tests or one-way ANOVA. Categorical variables were analyzed using a chi-square or Fisher’s exact test. Nonparametric data were analyzed using the Wilcoxon-rank sum test or Kruskal–Wallis test. Data are presented as mean ± SD, and p values < 0.05 were considered significant. Data were analyzed using Stata 15/SE 15.1 (StataCorp LLC, College Station, TX, USA) and Prism 9.0 (GraphPad, San Diego, CA, USA).
3. Results
3.1. Differences in Ideal Cardiovascular Health Data among Normal-Weight, Overweight, and Obese Participants
Of the 1561 participants who completed the Life’s Simple 7 assessment of ideal cardiovascular health, 523 were normal weight, 378 were overweight, and 660 were obese (class I: n = 303; class II: n = 180; class III: n = 177). Normal-weight participants were younger than overweight and obese participants (Table 1). There were differences between the weight groups with respect to sex distribution with a higher percentage of women being normal weight or obese compared to overweight (p < 0.01). There were also differences in race, ethnicity, and regionality among the weight groups (p < 0.01). A higher percentage of Hispanic and black participants were obese compared to normal weight. In contrast, individuals who were Asian or white were more likely to be normal weight than obese. There was also a difference between the weight groups in the prevalence of prior cardiovascular diseases, diabetes mellitus, hypertension, hypercholesterolemia, and smoking status, with obese individuals having the highest burden of established cardiovascular diseases and cardiovascular disease risk factors compared to normal-weight and overweight participants (all p < 0.01).
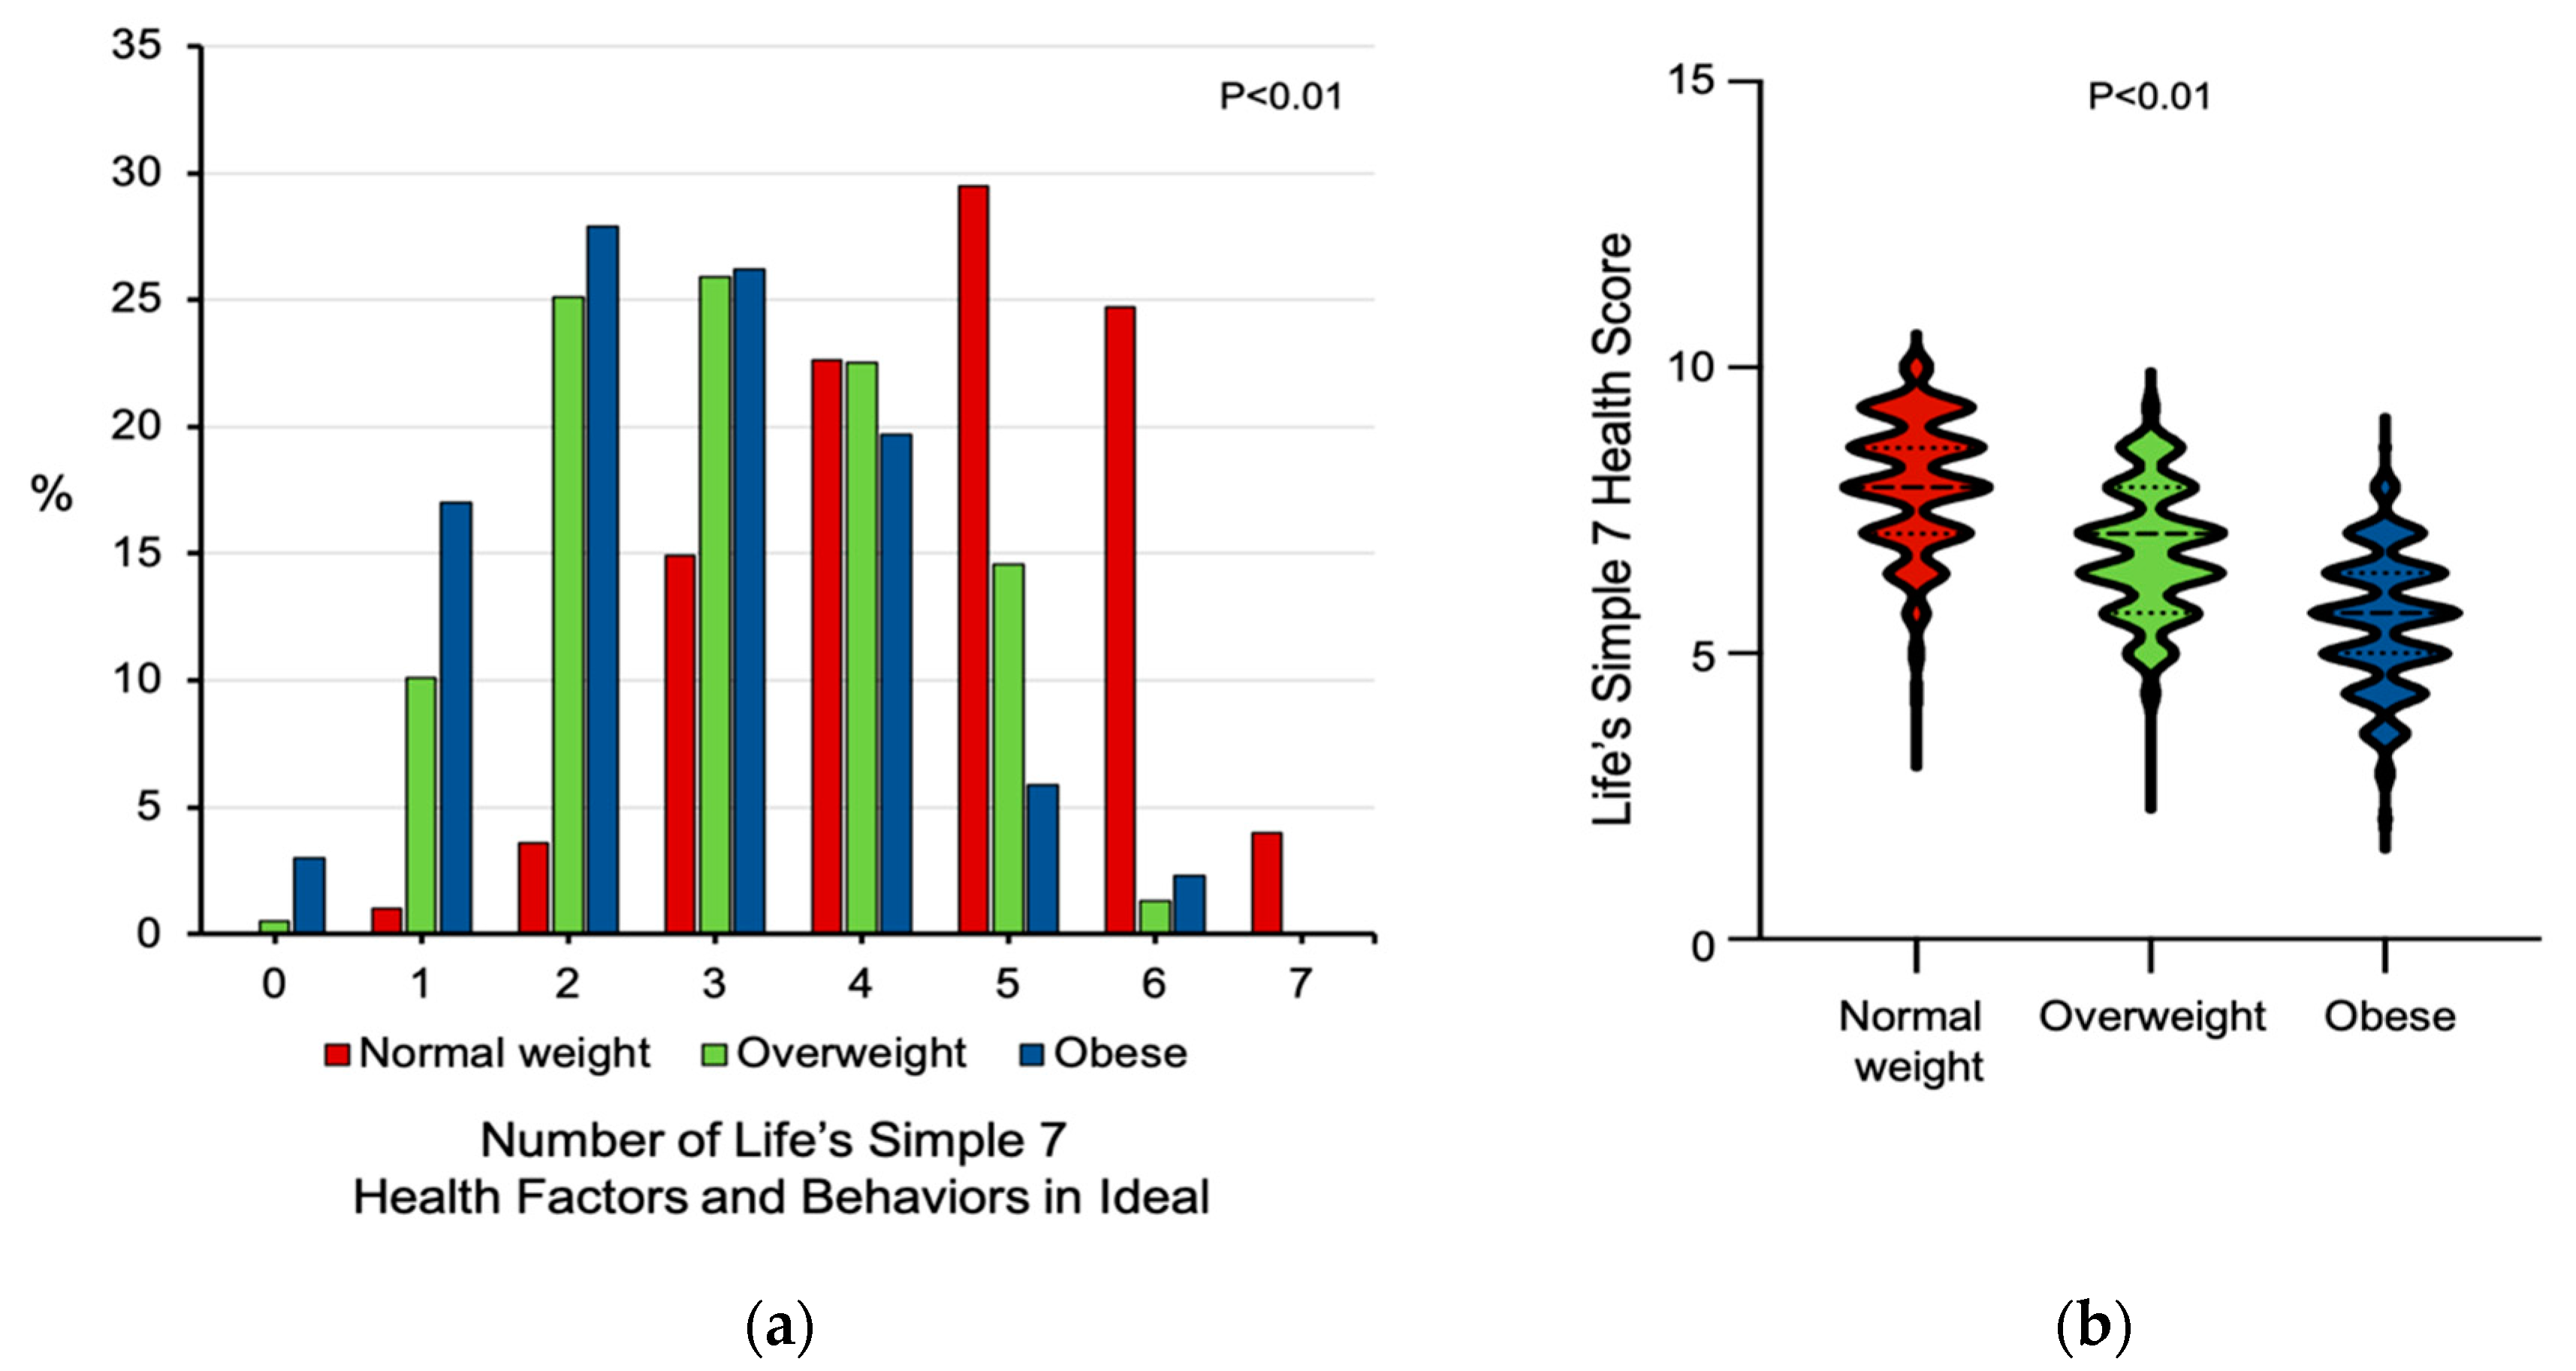
There were also significant differences among the weight groups with respect to health factors, including systolic and diastolic blood pressure (p < 0.01), total cholesterol (p < 0.04), and blood glucose levels (p < 0.01), with obese individuals having higher blood pressure, cholesterol, and glucose levels compared to normal-weight and overweight participants (Table 1). The weight groups differed significantly in their dietary choices and exercise health behaviors. There were differences between normal-weight, overweight, and obese individuals with respect to servings of vegetables (p < 0.01), fruits (p < 0.01), fish (p < 0.02), whole grains (p < 0.01), and weekly consumption of sugar-sweetened beverages (p < 0.01). Compared to normal-weight and overweight participants, obese participants were more likely to consume prepackaged foods (p < 0.01). There was also a significant difference in the weekly minutes of moderate or vigorous exercise, with obese participants exercising fewer minutes than normal-weight and overweight individuals (p < 0.01). As a result of these differences, the percentage of individuals with 5 or more Life’s Simple 7 health factors and behaviors categories scored as ideal was lower in obese compared to overweight or normal-weight individuals (p < 0.01) (Figure 1a). Similarly, Life’s Simple 7 Health Scores, a measure of ideal cardiovascular health, were lower in obese than in normal-weight and overweight groups, respectively (5.6 ± 1.2 vs. 8.0 ± 1.1 vs. 6.8 ± 1.1, p < 0.01) (Figure 1b).
3.2. Ideal Cardiovascular Health in Obese Participants
Next, we identified 103 obese individuals with a Life’s Simple 7 Health Score > 7.0 (mean = 7.3 ± 0.3) and compared these individuals to the remaining 557 obese individuals who had a mean health score of 5.2 ± 1.0 (p < 0.01) (Table 2). We utilized this strategy to determine if there was a subpopulation of fat-but-fit-like individuals in our study or if other factors contributed to their ideal health score. Obese individuals with ideal health scores were significantly younger with no differences in sex distribution, race, and ethnicity, or regionality than obese individuals with non-ideal health scores. There was, however, a higher percentage of individuals with class I obesity and a lower percentage with class III obesity in the group with ideal health scores than non-ideal health scores (p < 0.04).
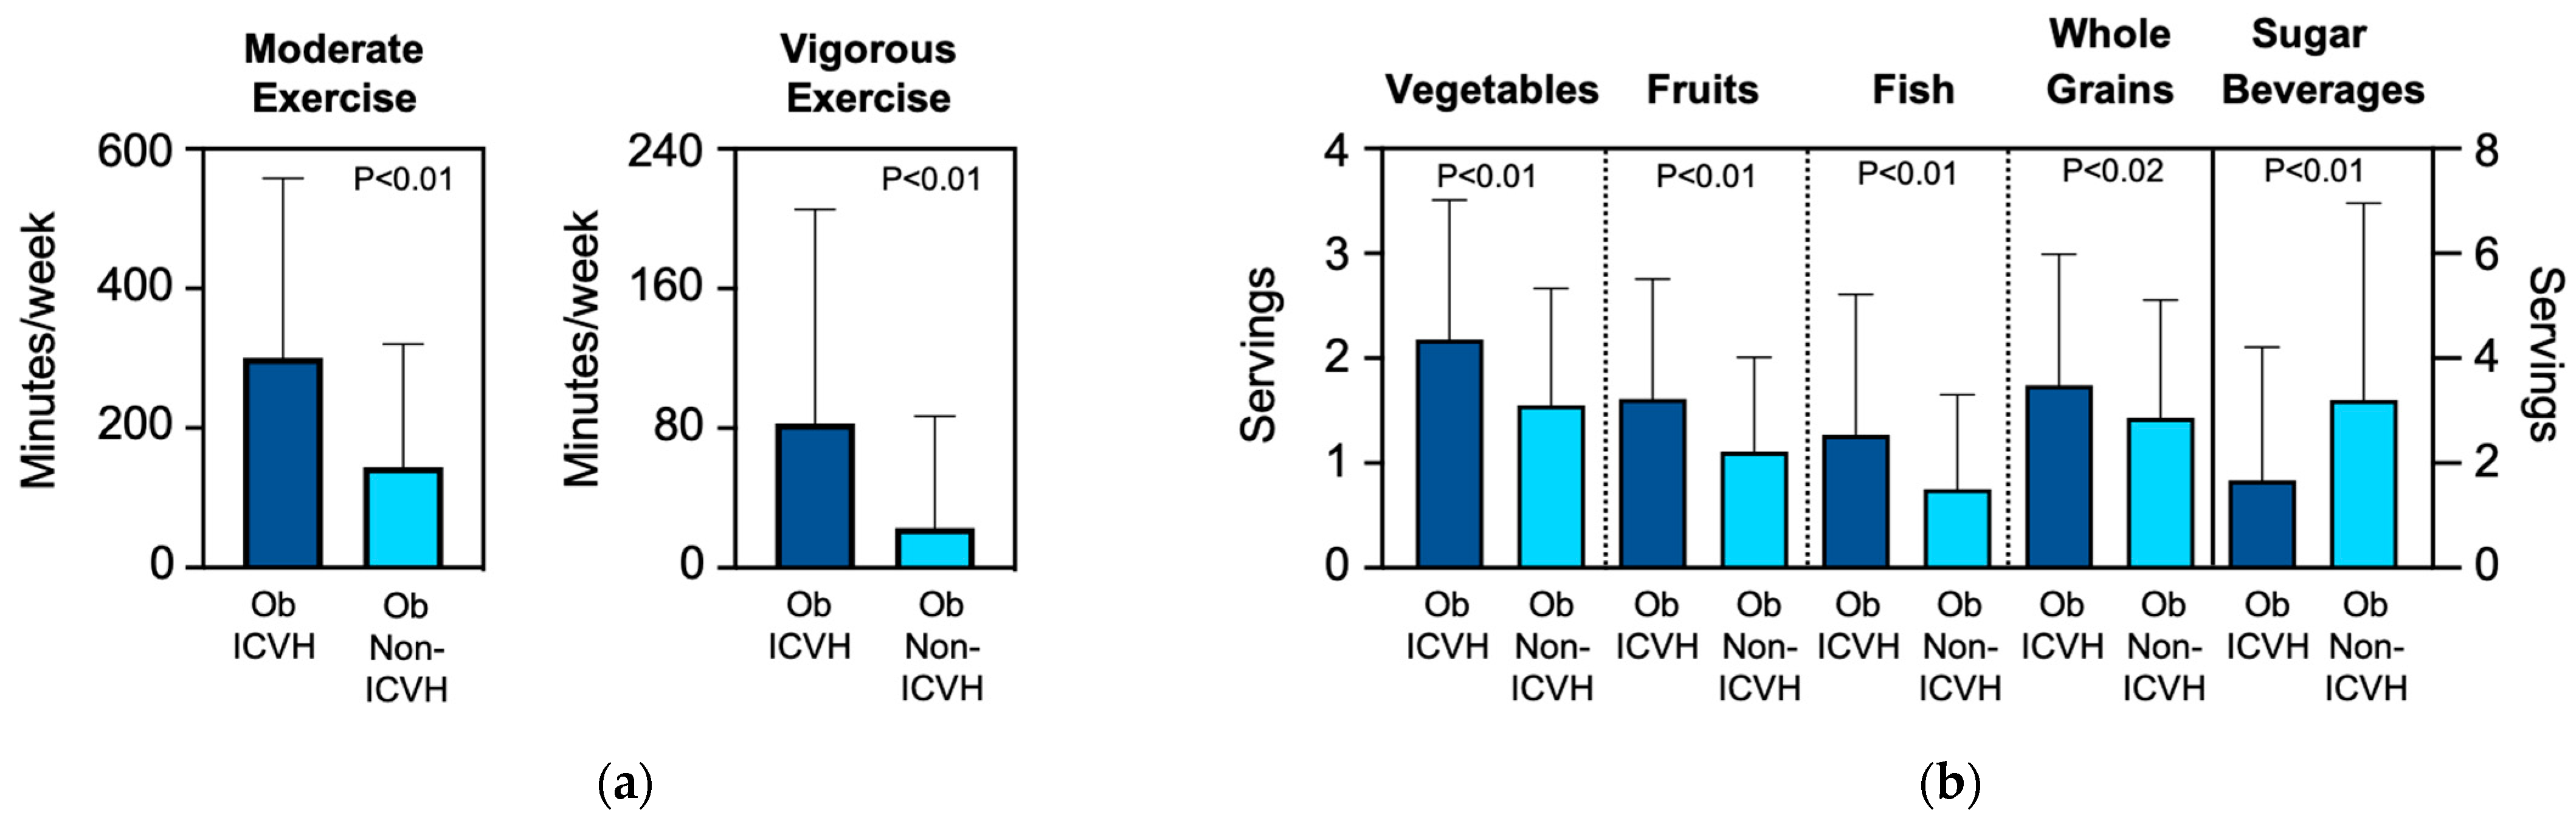
Obese participants with ideal health scores reported more weekly minutes of moderate activity (300.9 ± 257.0 vs. 144.1 ± 176.3 min/week, p < 0.01) and vigorous activity (82.8 ± 122.5 vs. 22.8 ± 64.0 min/week, p < 0.01) than obese individuals with non-ideal health scores, suggesting that they resembled the fat-but-fit paradigm (Figure 2a). Obese individuals with ideal health scores were less likely to have prior cardiovascular disease (p < 0.03) and had a lower prevalence of hypertension, diabetes mellitus, hypercholesterolemia, and current smokers than those with non-ideal health scores (all p < 0.01). They also had lower systolic and diastolic blood pressures, blood glucose levels, and cholesterol levels than individuals with non-ideal health scores (p < 0.01). Individuals with ideal health scores subscribed to more heart healthy dietary habits with higher intake of vegetables, fruits, fish, and whole grains (all p < 0.01) as well as a lower consumption of sugar-sweetened beverages (1.7 ± 2.5 vs. 3.2 ± 3.8 drinks/week, p < 0.01) (Figure 2b). They also tended to avoid eating out (p < 0.01), consuming prepackaged foods (p < 0.01), and use of salt at home (p < 0.05) compared to individuals with non-ideal cardiovascular health scores. A total of 39.8% of individuals with ideal health scores had ideal scores in 5 or more cardiovascular health factors and behaviors categories compared to 0.0% of individuals with non-ideal health scores (p < 0.01).
3.3. Digital Health Data and Life’s Simple 7 Health Score
We next examined how objective weight and exercise data collected from digital health devices informed ideal cardiovascular health among normal-weight, overweight, and obese participants. Of the 390 individuals who consented to provide digital device data, weight data were not transmitted by 95 participants, and digital exercise data were not transmitted by 35 individuals. There was no difference between the weight groups with respect to the type of digital health device registered with the study (p = 0.89).
Weights measured by digital health devices differed significantly between normal-weight, overweight, and obese participants (63.4 ± 9.2 vs. 78.2 ± 10.0 vs. 101.3 ± 27.4 kg, p < 0.01) as did BMI (22.4 ± 2.2 vs. 27.2 ± 1.9 vs. 36.2 ± 5.7 kg/m2, p < 0.01) (Table 3). The mean difference between self-reported and digital health device measured weight or BMI was similar between the groups. There was, however, reclassification of the weight score for 29 individuals based on digital weight data, with 11.1% of individuals in the normal weight group moving from an ideal to an intermediate score. In the overweight group, 7.4% of participants moved from an intermediate to poor score, while an additional 7.4% moved to an ideal score. In the obese group, 6.8% of individuals moved from a score of poor to intermediate. The distribution of poor, intermediate, and ideal scores remained significantly different between the groups (p < 0.01).
Exercise and activity data recorded by digital health devices over a 7-day period were also evaluated. Compared to normal-weight and overweight individuals, obese participants recorded a similar number of weekly minutes of moderate exercise (157.3 ± 206.6 vs. 135.8 ± 170.8 vs. 112.2 ± 138.3 min/week, p = 0.12) and vigorous exercise (184.6 ± 234.0 vs. 167.9 ± 218.0 vs. 140.9 ± 233.4 min/week, p = 0.31). This distribution of participants with poor, intermediate, and ideal activity scores was also similar between the weight groups (p = 0.12). When the digital health device recorded weight and activity data were used to recalculate the Life’s Simple 7 Health Score, it remained higher in normal weight and overweight individuals than obese participants (7.9 ± 1.0 vs. 7.1 ± 1.2 vs. 6.0 ± 1.0, p < 0.01). We also examined average daily step count and found differences between normal-weight, overweight, and obese individuals (8593.0 ± 5186.2 vs. 8069.6 ± 4463.9 vs. 6756.0 ± 4145.0 average steps/day, p < 0.01).
4. Discussion
We evaluated ideal cardiovascular health among individuals that were normal weight, overweight, and obese using the American Heart Association’s Life’s Simple 7 survey that examines cardiovascular health factors and health behaviors. Compared to normal-weight and overweight participants, obese individuals had a higher burden of prevalent cardiovascular disease and associated risk factors. Analysis of the modifiable health factors further revealed that obese individuals had higher blood pressures, blood glucose levels, and total cholesterol levels and were more likely to take medications for these conditions compared to overweight and normal-weight individuals. Obese individuals consumed fewer servings of heart healthy foods, more sugar-sweetened beverages, and were less likely to practice other heart healthy eating habits compared to normal-weight and overweight groups. The exercise profiles of obese individuals revealed fewer minutes of weekly exercise compared to normal-weight and overweight individuals. This resulted in obese participants having, on average, lower ideal cardiovascular health scores than the other weight groups.
A second key finding from our study was the identification of a subgroup of obese individuals who did achieve ideal cardiovascular health. These individuals differed significantly from other obese patients in that they were younger, had a lower prevalence of established cardiovascular disease and associated risk factors, and had optimized heart healthy lifestyle behaviors, including dietary choices and habits as well as exercise. When incorporating digital health data from a subset of participants, we found that obese participants performed fewer minutes of moderate exercise activity than self-reported on the Life’s Simple 7 survey and had fewer average steps per day compared to the other weight groups. However, obese participants recorded more weekly minutes of vigorous exercise than self-reported, resulting in a distribution of poor, intermediate, and ideal activity scores that were similar to normal weight and overweight participants. This suggests the benefit of using digital activity devices to provide objective exercise data for more precise allocation of the exercise status among individuals.
Over the past several decades, the prevalence of obesity in the United States and worldwide has reached epidemic proportions [4,6,16,26]. In adults (age ≥ 20 years) in the United States alone, age-standardized obesity increased from 30.5% in 1999–2000 to 39.5% in 2015–2016, with the Centers for Disease Control and Prevention reporting the prevalence of obesity was 42.4% in 2017–2018 [5,6]. Worldwide, the prevalence of obesity has almost tripled since 1975 [26]. In the context of cardiovascular disease, obesity is recognized as an independent risk factor and viewed as a complex and heterogeneous condition that increases risk owing to its association with hypertension, diabetes mellitus, and hypercholesterolemia [27]. The rate of development of these comorbid conditions, and, therefore, increased cardiovascular risk is proportional to the BMI. In our study, 42.2% of participants were obese, which is reflective of the United States population [4,6].
The concept of fat-but-fit acknowledges heterogeneity among obese individuals, and several studies from the Aerobics Center Longitudinal Study support the fat-but-fit paradigm. In one study of 25,714 men, individuals classified as obese by BMI that were physically fit had a lower risk of cardiovascular mortality than men who were normal weight (or obese) and physically unfit [17]. A second study evaluated 21,925 men and used percentage of body fat as a measure of obesity. This analysis also reported that fat-but-fit individuals had lower cardiovascular disease mortality than individuals who were lean and unfit [18]. These findings were subsequently confirmed in women as well as individuals with diabetes mellitus and hypertension [19,20,28,29]. A contemporary study from the United Kingdom Biobank also examined the relationship between fatness and fitness in 77,169 individuals. This study reported an increased risk of early mortality for unfit participants regardless of their level of adiposity as compared to the normal weight and fit reference group [30]. The relationship between ideal cardiovascular health and cardiorespiratory fitness was also investigated in the Aerobics Center Longitudinal Study. Individuals with high cardiorespiratory fitness levels had 45% higher health scores than individuals with poor cardiorespiratory fitness. However, the proportion of individuals who were obese, fat-but-fit, or fat-but-unfit and how these categorizations related to health score was not examined [31]. Although our study was cross-sectional and did not examine hard clinical endpoints, such as cardiovascular mortality, we identified a subset of obese individuals that could be considered fat-but-fit as they had ideal cardiovascular health scores. These obese individuals were younger with lower rates of established cardiovascular disease and cardiovascular risk factors than the obese and unfit participants. The fat-but-fit participants had also adopted a heart healthy diet and exercise program, which is in agreement with expert consensus opinion regarding the mechanisms that explain the fat-but-fit paradigm [16,32].
Our study has several limitations that may affect the generalizability of our findings. First, our study is cross-sectional, and the duration of obesity remains unknown. Furthermore, our study did not collect data on abdominal circumference, hypertriglyceridemia, or HDL levels to determine if participants had metabolic syndrome. Although the duration of obesity has been associated with an increased cardiovascular risk, several studies provide evidence to indicate that current BMI is a more robust predictor of outcomes than the duration of obesity [33,34,35]. Since our study enrolled a mostly white sample and substantially fewer participants that identified as other races and ethnicities, we are unable to assess the relationship between race, ethnicity, and obesity in our study. Using longitudinal data from the National Health and Nutrition Examination Study from 1999 to 2016, investigators reported that 56.3% of non-Hispanic black women and 46.7% of Hispanic women were obese as compared to 35.2% of non-Hispanic white women [35]. In men, approximately one-third of non-Hispanic white, non-Hispanic Black, and Hispanic men met criteria for obesity. This underscores the need for better representation of different races and ethnicities in studies of ideal cardiovascular health. Furthermore, data on social determinants of health, which may provide insights into differences between non-ideal and ideal cardiovascular health, should also be collected [21,36]. Our study design may have introduced bias as enrollment in the study was voluntary, and demographic as well as Life’s Simple 7 data were self-reported. Since our study protocol did not mandate registration of a digital health device to participate in the study, only 21% of obese individuals enrolled in the study provided digital device data. Interestingly, only 20% of the individuals who transmitted data would have been classified as fat-but-fit, indicating that our digital health data were representative of the entire obese (and normal-weight and overweight) study population. Our finding that digital activity devices recorded more minutes of vigorous activity than self-reported is important for future clinical studies that enroll obese individuals and address weight, exercise, and ideal cardiovascular health. This conclusion is supported by a systematic review of intervention studies for long-term weight management in obese individuals. This study reported that wearable digital devices could improve weight loss and physical activity but indicated that further study was needed [37].
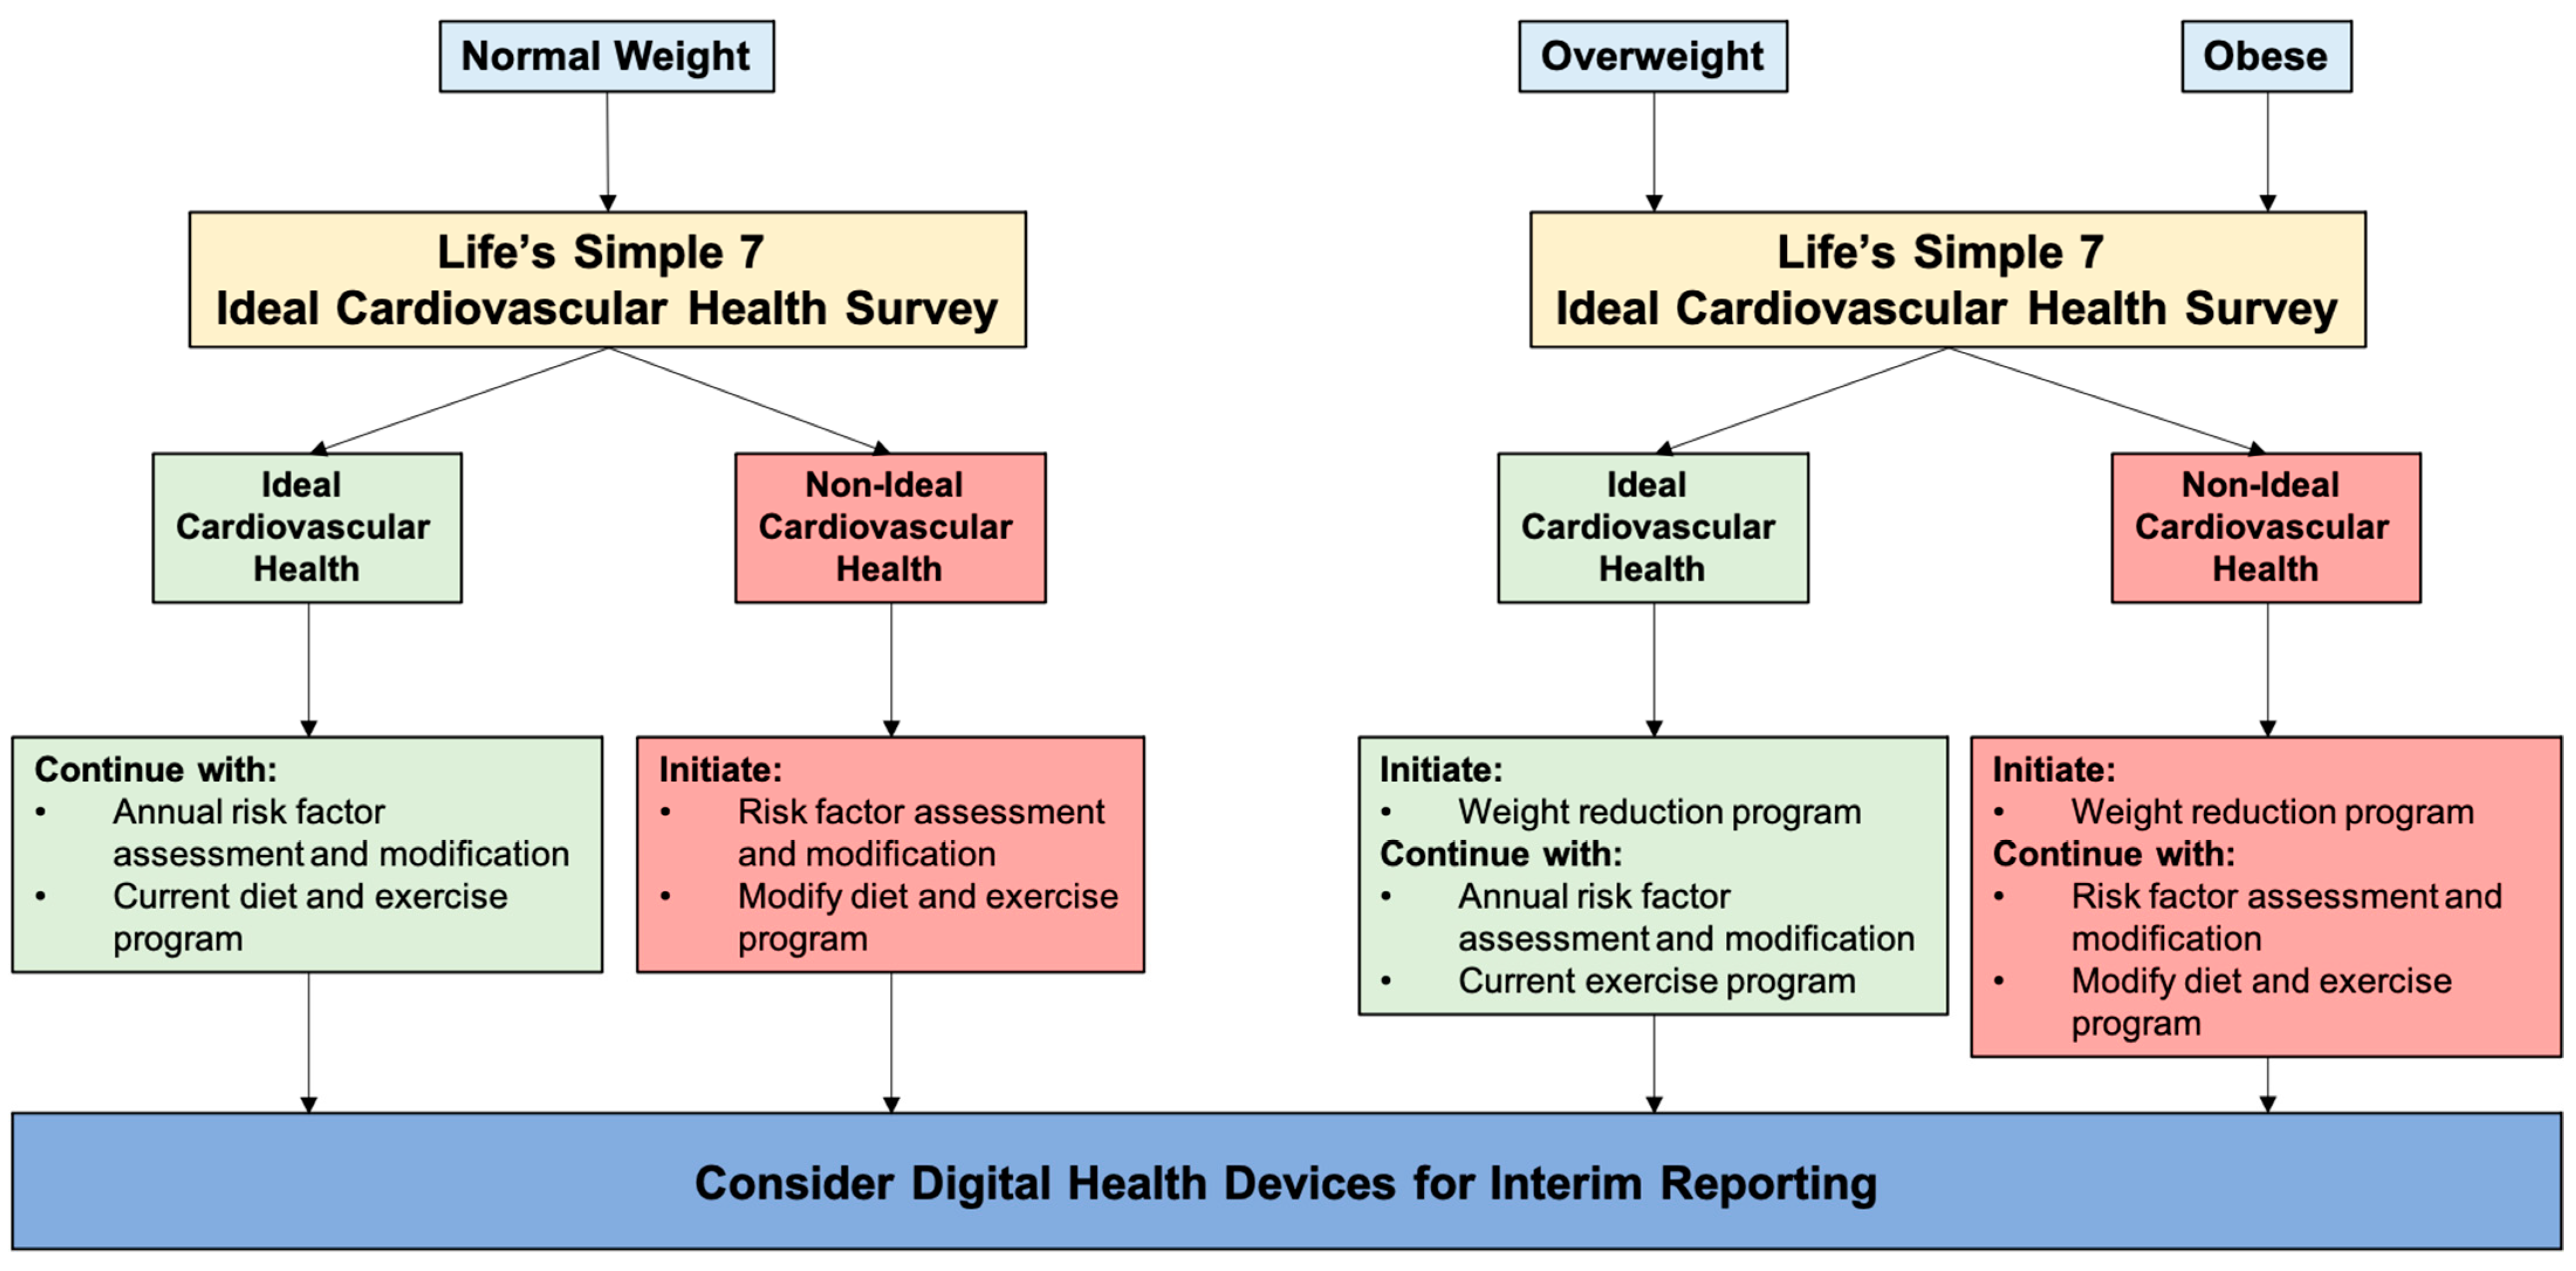
Findings from our study have important clinical care and public health implications for obese and overweight individuals. We propose that the American Heart Association’s Life’s Simple 7 survey instrument should be administered to all persons at the time of first contact for an assessment of cardiovascular health and annually thereafter. This strategy, which can be readily implemented using electronic health records, provides both immediate identification of normal-weight, overweight, and obese status as well as a history, physical and laboratory assessment of cardiovascular disease risk factors as well as longer-term follow-up (Figure 3). The additional information gathered by including an assessment of dietary choices and habits as well as exercise profiles would allow for a more complete picture of cardiovascular health. The subgroup of obese individuals that meet criteria for fat-but-fit could be distinguished from other obese and inactive patients that require more advanced interventions to optimize several cardiovascular health factors and behaviors. For those individuals that are overweight or obese and have ideal cardiovascular health, a weight reduction program could lead to improvements in other comorbidities that are not assessed by the Life’s Simple 7 survey. For example, weight reduction has been shown to improve obstructive sleep apnea and non-alcoholic steatotic hepatitis [38]. This schema also identifies normal-weight but unfit individuals who are at higher risk for cardiovascular diseases than their active counterparts and would similarly benefit from targeted interventions to improve ideal cardiovascular health. Longitudinal administration of the survey would serve as a check-in to review progress toward establishing or maintaining ideal cardiovascular health. Digital health devices should also be considered a mechanism to provide additional objective data between visits. Utilizing the Life’s Simple 7 survey with digital health devices allows for a personalized and precision medicine approach to achieve ideal cardiovascular health for obese and non-obese individuals.
Author Contributions
Conceptualization, J.A.L. and E.M.A.; formal analysis, J.A.L.; investigation, J.A.L. and E.M.A.; data curation, J.A.L.; writing—original draft preparation, J.A.L. and E.M.A.; writing—review and editing, J.A.L. and E.M.A. All authors have read and agreed to the published version of the manuscript.
Funding
This research was funded by the American Heart Association AIM 19AIML34980000, the National Institutes of Health/National Heart, Lung, and Blood Institute U01 HL125215 (J.A.L.).
Institutional Review Board Statement
The study was conducted according to the guidelines of the Declaration of Helsinki and approved by the Advarra Institutional Review Board (approval #31995, approved 11 October 2016).
Informed Consent Statement
Informed consent was obtained from all subjects involved in the study.
Data Availability Statement
For information regarding data availability, please contact the corresponding author. The data are not publicly available due to privacy restrictions and protection of personal data.
Conflicts of Interest
The authors declare no conflict of interest. The funders participated in the design of the study. The funders had no role in the collection, analyses, or interpretation of data; in the writing of the manuscript, or in the decision to publish the results.
References
- Klein, S. Clinical Implications of Obesity with Specific Focus on Cardiovascular Disease. Circulation 2004, 110, 2952–2967. [Google Scholar] [CrossRef]
- Poirier, P.; Giles, T.D.; Bray, G.A.; Hong, Y.; Stern, J.S.; Pi-Sunyer, F.X.; Eckel, R.H. Obesity and Cardiovascular Disease. Arter. Thromb. Vasc. Biol. 2006, 26, 968–976. [Google Scholar] [CrossRef] [PubMed]
- Virani, S.S.; Alonso, A.; Benjamin, E.J.; Bittencourt, M.S.; Callaway, C.W.; Carson, A.P.; Chamberlain, A.M.; Chang, A.R.; Cheng, S.; Delling, F.N.; et al. Heart Disease and Stroke Statistics—2020 Update: A Report from the American Heart Association. Circulation 2020, 141, e139–e596. [Google Scholar] [CrossRef] [PubMed]
- Centers for Disease Control and Prevention. Overweight & Obesity. 2020. Available online: www.cdc.gov (accessed on 1 March 2021).
- Hales, C.M.; Fryar, C.D.; Carroll, M.D.; Freedman, D.S.; Ogden, C.L. Trends in Obesity and Severe Obesity Prevalence in US Youth and Adults by Sex and Age, 2007–2008 to 2015–2016. JAMA 2018, 319, 1723–1725. [Google Scholar] [CrossRef] [Green Version]
- Centers for Disease Control and Prevention. Adult Obesity Facts. 2020. Available online: https://www.cdc.gov/obesity/data/adult.html (accessed on 1 March 2021).
- Flegal, K.M.; Kruszon-Moran, D.; Carroll, M.D.; Fryar, C.D.; Ogden, C.L. Trends in Obesity Among Adults in the United States, 2005 to 2014. JAMA 2016, 315, 2284–2291. [Google Scholar] [CrossRef] [Green Version]
- Khan, S.S.; Ning, H.; Wilkins, J.T.; Allen, N.; Carnethon, M.; Berry, J.D.; Sweis, R.N.; Lloyd-Jones, D.M. Association of Body Mass Index with Lifetime Risk of Cardiovascular Disease and Compression of Morbidity. JAMA Cardiol. 2018, 3, 280–287. [Google Scholar] [CrossRef]
- Eckel, N.; Meidtner, K.; Kalle-Uhlmann, T.; Stefan, N.; Schulze, M.B. Metabolically healthy obesity and cardiovascular events: A systematic review and meta-analysis. Eur. J. Prev. Cardiol. 2016, 23, 956–966. [Google Scholar] [CrossRef]
- Flegal, K.M.; Kit, B.K.; Orpana, H.; Graubard, B.I. Association of All-Cause Mortality with Overweight and Obesity Using Standard Body Mass Index Categories. JAMA 2013, 309, 71–82. [Google Scholar] [CrossRef] [Green Version]
- Banack, H.R.; Stokes, A. The ‘obesity paradox’ may not be a paradox at all. Int. J. Obes. 2017, 41, 1162–1163. [Google Scholar] [CrossRef] [PubMed] [Green Version]
- Wells, J.C.K. Commentary: The paradox of body mass index in obesity assessment: Not a good index of adiposity, but not a bad index of cardio-metabolic risk. Int. J. Epidemiol. 2014, 43, 672–674. [Google Scholar] [CrossRef] [PubMed] [Green Version]
- Lajous, M.; Bijon, A.; Fagherazzi, G.; Boutron-Ruault, M.-C.; Balkau, B.; Clavel-Chapelon, F.; Hernán, M.A. Body Mass Index, Diabetes, and Mortality in French Women. Epidemiology 2014, 25, 10–14. [Google Scholar] [CrossRef]
- Hernán, M.A.; Hernández-Díaz, S.; Robins, J.M. A Structural Approach to Selection Bias. Epidemiology 2004, 15, 615–625. [Google Scholar] [CrossRef] [PubMed] [Green Version]
- Stokes, A.; Preston, S.H. Smoking and reverse causation create an obesity paradox in cardiovascular disease. Obesity 2015, 23, 2485–2490. [Google Scholar] [CrossRef] [PubMed] [Green Version]
- Ortega, F.B.; Lavie, C.J.; Blair, S.N. Obesity and Cardiovascular Disease. Circ. Res. 2016, 118, 1752–1770. [Google Scholar] [CrossRef] [PubMed] [Green Version]
- Wei, M.; Kampert, J.B.; Barlow, C.E.; Nichaman, M.Z.; Gibbons, L.W.; Paffenbarger, J.R.S.; Blair, S.N. Relationship Between Low Cardiorespiratory Fitness and Mortality in Normal-Weight, Overweight, and Obese Men. JAMA 1999, 282, 1547–1553. [Google Scholar] [CrossRef] [PubMed]
- Lee, C.D.; Blair, S.N.; Jackson, A.S. Cardiorespiratory fitness, body composition, and all-cause and cardiovascular disease mortality in men. Am. J. Clin. Nutr. 1999, 69, 373–380. [Google Scholar] [CrossRef] [PubMed]
- Lyerly, G.W.; Sui, X.; Lavie, C.J.; Church, T.S.; Hand, G.A.; Blair, S.N. The Association Between Cardiorespiratory Fitness and Risk of All-Cause Mortality Among Women with Impaired Fasting Glucose or Undiagnosed Diabetes Mellitus. Mayo Clin. Proc. 2009, 84, 780–786. [Google Scholar] [CrossRef] [PubMed] [Green Version]
- Farrell, S.W.; Fitzgerald, S.J.; Mcauley, P.A.; Barlow, C.E. Cardiorespiratory Fitness, Adiposity, and All-Cause Mortality in Women. Med. Sci. Sports Exerc. 2010, 42, 2006–2012. [Google Scholar] [CrossRef]
- Angell, S.Y.; McConnell, M.V.; Anderson, C.A.; Bibbins-Domingo, K.; Boyle, D.S.; Capewell, S.; Ezzati, M.; De Ferranti, S.; Gaskin, D.J.; Goetzel, R.Z.; et al. The American Heart Association 2030 Impact Goal: A Presidential Advisory from the American Heart Association. Circulation 2020, 141, e120–e138. [Google Scholar] [CrossRef] [PubMed]
- Sanchez, E. Life’s Simple 7: Vital but Not Easy. J. Am. Hearth Assoc. 2018, 7, e009324. [Google Scholar] [CrossRef] [PubMed]
- Lloyd-Jones, D.M.; Hong, Y.; Labarthe, D.; Mozaffarian, D.; Appel, L.J.; Van Horn, L.; Greenlund, K.; Daniels, S.; Nichol, G.; Tomaselli, G.F.; et al. American heart association strategic planning task force and statistics committee defining and setting national goals for cardiovascular health promotion and disease reduction: The American heart association’s strategic impact goal through 2020 and beyond. Circulation 2010, 121, 586–613. [Google Scholar] [CrossRef] [PubMed] [Green Version]
- Leopold, J.; Davis, R.; Antman, E. Data from Digital Health Devices Informs Ideal Cardiovascular Health. J. Pers. Med. 2021, 11, 189. [Google Scholar] [CrossRef] [PubMed]
- Hales, C.M.; Carroll, M.D.; Fryar, C.D.; Ogden, C.L. Prevalence of Obesity among Adults and Youth: United States, 2015–2016; NCHS Data Brief; National Center for Health Statistics: Hyattsville, MD, USA, 2017; pp. 1–8. [Google Scholar]
- World Health Organization. Obesity and Overweight. Available online: www.who.int (accessed on 1 March 2021).
- Piché, M.-E.; Poirier, P.; Lemieux, I.; Després, J.-P. Overview of Epidemiology and Contribution of Obesity and Body Fat Distribution to Cardiovascular Disease: An Update. Prog. Cardiovasc. Dis. 2018, 61, 103–113. [Google Scholar] [CrossRef]
- Church, T.S.; LaMonte, M.J.; Barlow, C.E.; Blair, S.N. Cardiorespiratory Fitness and Body Mass Index as Predictors of Cardiovascular Disease Mortality among Men with Diabetes. Arch. Intern. Med. 2005, 165, 2114–2120. [Google Scholar] [CrossRef] [PubMed]
- McAuley, P.A.; Sui, X.; Church, T.S.; Hardin, J.W.; Myers, J.N.; Blair, S.N. The Joint Effects of Cardiorespiratory Fitness and Adiposity on Mortality Risk in Men with Hypertension. Am. J. Hypertens. 2009, 22, 1062–1069. [Google Scholar] [CrossRef] [PubMed] [Green Version]
- Tarp, J.; Grøntved, A.; Sanchez-Lastra, M.A.; Dalene, K.E.; Ding, D.; Ekelund, U. Fitness, Fatness, and Mortality in Men and Women from the UK Biobank: Prospective Cohort Study. J. Am. Hearth Assoc. 2021, 10, e019605. [Google Scholar] [CrossRef]
- Ross, L.M.; Barber, J.L.; McLain, A.C.; Weaver, R.G.; Sui, X.; Blair, S.N.; Sarzynski, M.A. The Association of Cardiorespiratory Fitness and Ideal Cardiovascular Health in the Aerobics Center Longitudinal Study. J. Phys. Act. Health 2019, 16, 968–975. [Google Scholar] [CrossRef] [PubMed]
- Elagizi, A.; Kachur, S.; Lavie, C.J.; Carbone, S.; Pandey, A.; Ortega, F.B.; Milani, R.V. An Overview and Update on Obesity and the Obesity Paradox in Cardiovascular Diseases. Prog. Cardiovasc. Dis. 2018, 61, 142–150. [Google Scholar] [CrossRef] [PubMed] [Green Version]
- Abdullah, A.; Wolfe, R.; Stoelwinder, J.U.; De Courten, M.; Stevenson, C.; Walls, H.L.; Peeters, A. The number of years lived with obesity and the risk of all-cause and cause-specific mortality. Int. J. Epidemiol. 2011, 40, 985–996. [Google Scholar] [CrossRef] [Green Version]
- Dowd, J.B.; Zajacova, A. Long-Term Obesity and Cardiovascular, Inflammatory, and Metabolic Risk in U.S. Adults. Am. J. Prev. Med. 2014, 46, 578–584. [Google Scholar] [CrossRef]
- Tanamas, S.K.; Wong, E.; Backholer, K.; Abdullah, A.; Wolfe, R.; Barendregt, J.; Peeters, A. Duration of obesity and incident hypertension in adults from the Framingham Heart Study. J. Hypertens. 2015, 33, 542–545. [Google Scholar] [CrossRef] [PubMed]
- Egan, B.M.; Li, J.; Sutherland, S.E.; Jones, D.W.; Ferdinand, K.C.; Hong, Y.; Sanchez, E. Sociodemographic Determinants of Life’s Simple 7: Implications for Achieving Cardiovascular Health and Health Equity Goals. Ethn. Dis. 2020, 30, 637–650. [Google Scholar] [CrossRef] [PubMed]
- Fawcett, E.; van Velthoven, M.H.; Meinert, E. Long-Term Weight Management Using Wearable Technology in Overweight and Obese Adults: Systematic Review. JMIR mHealth uHealth 2020, 8, e13461. [Google Scholar] [CrossRef] [PubMed]
- Ryan, D.H.; Yockey, S.R. Weight Loss and Improvement in Comorbidity: Differences at 5%, 10%, 15%, and over. Curr. Obes. Rep. 2017, 6, 187–194. [Google Scholar] [CrossRef]
Figure 1.
Ideal cardiovascular health in normal-weight, overweight, and obese individuals. (a) The Life’s Simple 7 survey instrument assesses 7 health factors and health behaviors that are scored as poor, intermediate, or ideal based on criteria defined by an expert panel. The number of categories scored as ideal is shown for normal-weight (n = 523), overweight (n = 378), and obese individuals (n = 660). (b) The distribution of Life’s Simple 7 Health Scores for normal-weight, overweight, and obese participants is shown as violin plots. Median and quartiles are identified by dashed lines.

Figure 2.
Exercise and diet profiles of obese individuals with ideal cardiovascular health and non-ideal cardiovascular health. (a) Self-reported minutes/week of moderate exercise and vigorous exercise are shown for obese individuals with ideal cardiovascular health (ObICVH) (n = 103) and obese individuals with non-ideal cardiovascular health (ObNon-ICVH) (n = 557). (b) Self-reported dietary choices are shown for obese individuals with ideal cardiovascular health (ObICVH) and obese individuals with non-ideal cardiovascular health (ObNon-ICVH). Daily servings of vegetables, fruits, and whole grains as well as weekly servings of fish and sugar-sweetened beverages are shown. Data are presented as mean ± standard deviation.

Figure 3.
Life’s Simple 7 survey as a tool to achieve ideal cardiovascular health for normal weight, overweight, and obese individuals. The Life’s Simple 7 survey is a useful tool to assess ideal cardiovascular health in all weight classes and encourages individuals with ideal cardiovascular health to continue their heart healthy behaviors. In those individuals with non-ideal cardiovascular health, the survey identifies areas that could improve with intervention.


Table 1.
Participant self-reported demographics, clinical, and Life’s Simple 7 data.
| Normal Weight (n = 523) | Overweight (n = 378) | Obese (n = 660) | p Value | |
|---|---|---|---|---|
| Age (years) | 42.7 ± 14.0 | 44.8 ± 13.6 | 45.1 ± 11.8 | <0.01 |
| Gender (% female) | 82.6 | 74.3 | 81.5 | <0.01 |
| Race and Ethnicity (no.) | <0.01 | |||
| Asian | 17 | 17 | 8 | |
| Black | 12 | 10 | 38 | |
| Hispanic | 16 | 22 | 30 | |
| White | 458 | 322 | 557 | |
| Other | 20 | 7 | 27 | |
| Region (no.) | <0.01 | |||
| Northeast | 74 | 61 | 92 | |
| South | 199 | 148 | 275 | |
| Midwest | 120 | 77 | 181 | |
| West | 130 | 92 | 112 | |
| Diagnosed with Cardiovascular Disease (%) | 29.3 | 36.0 | 42.0 | <0.01 |
| Diabetes mellitus (%) | 1.5 | 6.9 | 19.2 | <0.01 |
| Hypertension (%) | 34.2 | 47.9 | 63.3 | <0.01 |
| Hypercholesterolemia (%) | 13.8 | 22.5 | 24.9 | <0.01 |
| Medications (%) | <0.01 | |||
| Diabetes mellitus | 1.5 | 5.3 | 16.5 | |
| Hypertension | 16.6 | 29.9 | 46.5 | |
| Hypercholesterolemia | 17.4 | 17.4 | 24.9 | |
| Smoking status (%) | <0.01 | |||
| Current | 5.5 | 5.3 | 8.9 | |
| Quit ≤ 1 year | 2.9 | 4.0 | 4.4 | |
| Quit > 1 year | 18.4 | 23.0 | 28.2 | |
| Never | 73.2 | 67.7 | 58.5 | |
| Clinical Data | ||||
| Weight (kg) | 62.7 ± 9.0 | 77.9 ± 9.6 | 104.8 ± 21.9 | <0.01 |
| BMI (kg/m2) | 22.2 ± 1.9 | 27.3 ± 1.4 | 37.6 ± 6.8 | <0.01 |
| Systolic blood pressure (mmHg) * | 113.5 ± 11.4 | 118.5 ± 12.1 | 121.4 ± 13.0 | <0.01 |
| Diastolic blood pressure (mmHg) * | 70.7 ± 8.0 | 73.6 ± 8.1 | 75.3 ± 8.9 | <0.01 |
| Total cholesterol (mmol/L) * | 186.0 ± 29.9 | 189.7 ± 31.6 | 190.2 ± 27.1 | <0.04 |
| Blood glucose (mmol/L) * | 94.9 ± 12.0 | 99.3 ± 14.6 | 102.7 ± 22.7 | <0.01 |
| Diet | ||||
| Vegetables/day (cups) | 2.1 ± 1.4 | 2.0 ± 1.3 | 1.6 ± 1.2 | <0.01 |
| Fruit/day (cups) | 1.5 ± 1.1 | 1.4 ± 1.2 | 1.2 ± 1.0 | <0.01 |
| Fish (servings/week) | 1.0 ± 1.1 | 1.0 ± 1.0 | 0.8 ± 1.0 | <0.01 |
| Whole grains (servings/day) | 1.7 ± 1.2 | 1.6 ± 1.2 | 1.5 ± 1.1 | <0.01 |
| Sugar-sweetened beverages (servings/week) | 1.9 ± 3.0 | 2.2 ± 3.2 | 3.0 ± 3.6 | <0.01 |
| Avoid prepackaged foods (%) | 62.7 | 56.4 | 41.5 | <0.01 |
| Avoid eating out (%) | 40.3 | 37.6 | 35.5 | 0.23 |
| Avoid salt at home (%) | 52.8 | 56.4 | 59.9 | 0.05 |
| Exercise | ||||
| Moderate exercise (min/week) | 237.2 ± 224.1 | 219.9 ± 219.9 | 168.6 ± 199.2 | <0.01 |
| Vigorous exercise (min/week) | 102.7 ± 137.4 | 79.6 ± 123.9 | 32.2 ± 79.1 | <0.01 |
| Life’s Simple 7 | ||||
| Smoking score (%) | <0.05 | |||
| Poor | 5.5 | 5.3 | 8.9 | |
| Intermediate | 2.9 | 4.0 | 4.4 | |
| Ideal | 91.6 | 90.7 | 86.7 | |
| Activity score (%) | <0.01 | |||
| Poor | 1.2 | 0.5 | 3.3 | |
| Intermediate | 23.7 | 30.2 | 53.0 | |
| Ideal | 75.1 | 69.3 | 43.7 | |
| Diet score (%) | <0.01 | |||
| Poor | 36.0 | 41.5 | 52.3 | |
| Intermediate | 51.8 | 48.7 | 42.4 | |
| Ideal | 12.2 | 9.8 | 5.3 | |
| Weight score (%) | <0.01 | |||
| Poor | 0 | 0 | 100.0 | |
| Intermediate | 0 | 100 | 0.0 | |
| Ideal | 100 | 0 | 0.0 | |
| Blood glucose score (%) | <0.01 | |||
| Poor | 0.2 | 3.2 | 7.1 | |
| Intermediate | 29.3 | 40.0 | 38.5 | |
| Ideal | 70.5 | 56.8 | 54.4 | |
| Cholesterol score (%) | <0.01 | |||
| Poor | 3.2 | 3.7 | 1.4 | |
| Intermediate | 40.0 | 52.9 | 55.9 | |
| Ideal | 56.8 | 43.4 | 42.7 | |
| Blood pressure score (%) | <0.01 | |||
| Poor | 3.3 | 4.5 | 9.4 | |
| Intermediate | 37.7 | 56.9 | 61.8 | |
| Ideal | 59.0 | 38.6 | 28.8 |
* Contains imputed data from Life’s Simple 7; categorical variables are analyzed by Chi-Square test; continuous variables are analyzed by ANOVA; non-parametric variables were analyzed by Kruskal–Wallis test.
Table 2.
Self-reported data from obese with ideal and non-ideal cardiovascular health.
| Obese Ideal Cardiovascular Health (n = 103) | Obese Non-Ideal Cardiovascular Health (n = 557) | p Value | |
|---|---|---|---|
| Age (years) | 38.3 ± 11.1 | 46.3 ± 11.5 | <0.01 |
| Gender (% female) | 85.4 | 80.8 | 0.26 |
| Race and Ethnicity (no.) | 0.36 | ||
| Asian | 1 | 7 | |
| Black | 8 | 30 | |
| Hispanic | 7 | 23 | |
| White | 81 | 476 | |
| Other | 6 | 21 | |
| Region (no.) | 0.67 | ||
| Northeast | 18 | 74 | |
| South | 42 | 233 | |
| Midwest | 28 | 153 | |
| West | 15 | 97 | |
| Diagnosed with Cardiovascular Disease (%) | 32.0 | 43.8 | <0.03 |
| Diabetes mellitus (%) | 1.0 | 22.6 | <0.01 |
| Hypertension (%) | 31.1 | 69.3 | <0.01 |
| Hypercholesterolemia (%) | 17.5 | 65.7 | <0.01 |
| Medications (%) | <0.01 | ||
| Diabetes mellitus | 1.0 | 19.4 | |
| Hypertension | 20.4 | 51.4 | |
| Hypercholesterolemia | 3.9 | 28.7 | |
| Smoking status (%) | <0.01 | ||
| Current | 0.0 | 10.6 | |
| Quit ≤ 1 year | 0.0 | 5.2 | |
| Quit > 1 year | 35.0 | 26.9 | |
| Never | 65.0 | 57.3 | |
| CLINICAL DATA | |||
| Weight (kg) | 97.6 ± 17.1 | 106.2 ± 22.4 | <0.01 |
| BMI (kg/m2) | 35.6 ± 5.0 | 37.9 ± 7.1 | <0.01 |
| Systolic blood pressure (mmHg) * | 113.3 ± 9.6 | 122.9 ± 13.0 | <0.01 |
| Diastolic blood pressure (mmHg) * | 71.2 ± 6.2 | 76.1 ± 9.2 | <0.01 |
| Total cholesterol (mmol/L) * | 180.5 ± 21.4 | 191.9 ± 27.3 | <0.01 |
| Blood glucose (mmol/L) * | 94.1 ± 6.0 | 104.3 ± 24.2 | <0.01 |
* Contains imputed data from Life’s Simple 7; categorical variables are analyzed by Chi-Square test; continuous variables are analyzed by t-test; non-parametric variables were analyzed by Kruskal–Wallis test.
Table 3.
Digital health device measured weight and exercise data.
| Normal Weight (n = 108) | Overweight (n = 81) | Obese (n = 103) | p Value | |
|---|---|---|---|---|
| Weight (kg) | 63.4 ± 9.2 | 78.2 ± 10.0 | 101.3 ± 27.4 | <0.01 |
| Delta reported vs. measured weight (kg) | −0.8 ± 3.9 | 0.0 ± 2.8 | −0.7 ± 5.7 | 0.47 |
| BMI (kg/m2) | 22.4 ± 2.2 | 27.2 ± 1.9 | 36.2 ± 5.7 | <0.01 |
| Delta reported vs. measured BMI (kg/m2) | −0.3 ± 1.4 | 0.0 ± 1.0 | −0.3 ± 2.0 | 0.42 |
| Healthy Weight Score (%) | <0.01 | |||
| Poor | 0.0 | 7.4 | 93.2 | |
| Intermediate | 11.1 | 85.2 | 6.8 | |
| Ideal | 88.9 | 7.4 | 0.0 | |
| Normal Weight (n = 128) | Overweight (n = 103) | Obese (n = 124) | p Value | |
| Moderate exercise (min/week) | 157.3 ± 206.6 | 135.8 ± 170.8 | 112.2 ± 138.3 | 0.12 |
| Delta reported vs. measured moderate exercise (min/week) | 90.1 ± 288.4 | 75.9 ± 244.4 | 72.5 ± 216.8 | 0.84 |
| Vigorous exercise (min/week) | 184.6 ± 234.0 | 167.9 ± 218.0 | 140.9 ± 233.4 | 0.31 |
| Delta reported vs. measured vigorous exercise (min/week) | −66.0 ± 236.2 | −66.0 ± 192.0 | −97.1 ± 239.1 | 0.46 |
| Physical Activity Score (%) | 0.12 | |||
| Poor | 0.0 | 0.0 | 0.0 | |
| Intermediate | 35.2 | 35.9 | 46.8 | |
| Ideal | 64.8 | 64.1 | 53.2 | |
| Normal Weight (n = 99) | Overweight (n = 79) | Obese (n = 94) | p Value | |
| Recalculated LS7 Health Score | 7.9 ± 1.0 | 7.1 ± 1.2 | 6.0 ± 1.0 | <0.01 |
| Normal Weight (n = 137) | Overweight (n = 107) | Obese (n = 131) | p Value | |
| Steps per day | 8593.0 ± 5186.2 | 8069.6 ± 4463.9 | 6756.0 ± 4145.0 | <0.01 |
Publisher’s Note: MDPI stays neutral with regard to jurisdictional claims in published maps and institutional affiliations. |
© 2021 by the authors. Licensee MDPI, Basel, Switzerland. This article is an open access article distributed under the terms and conditions of the Creative Commons Attribution (CC BY) license (https://creativecommons.org/licenses/by/4.0/).
Share and Cite
MDPI and ACS Style
Leopold, J.A.; Antman, E.M. Obesity and Ideal Cardiovascular Health: Results from the My Research Legacy Study. Obesities 2021, 1, 36-48. https://0-doi-org.brum.beds.ac.uk/10.3390/Obesities1010004
AMA Style
Leopold JA, Antman EM. Obesity and Ideal Cardiovascular Health: Results from the My Research Legacy Study. Obesities. 2021; 1(1):36-48. https://0-doi-org.brum.beds.ac.uk/10.3390/Obesities1010004
Chicago/Turabian StyleLeopold, Jane A., and Elliott M. Antman. 2021. "Obesity and Ideal Cardiovascular Health: Results from the My Research Legacy Study" Obesities 1, no. 1: 36-48. https://0-doi-org.brum.beds.ac.uk/10.3390/Obesities1010004