
Postprandial Triglycerides, Flow-Mediated Dilation, and the Inflammatory Cytokine Milieu in Metabolically Healthy Obesity: A Cross-Sectional Pilot Study

 , and
, and
Abstract
: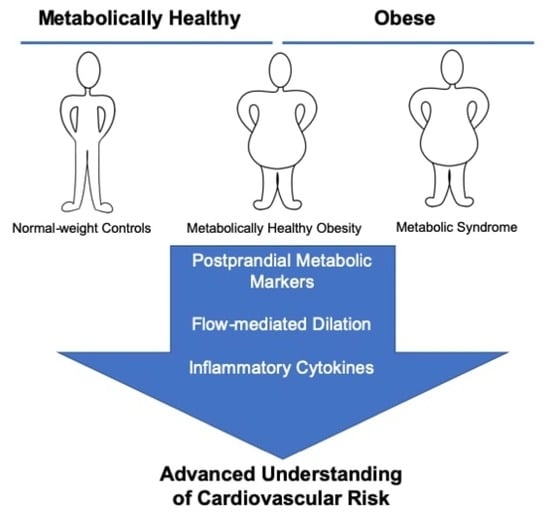
1. Introduction
2. Materials and Methods
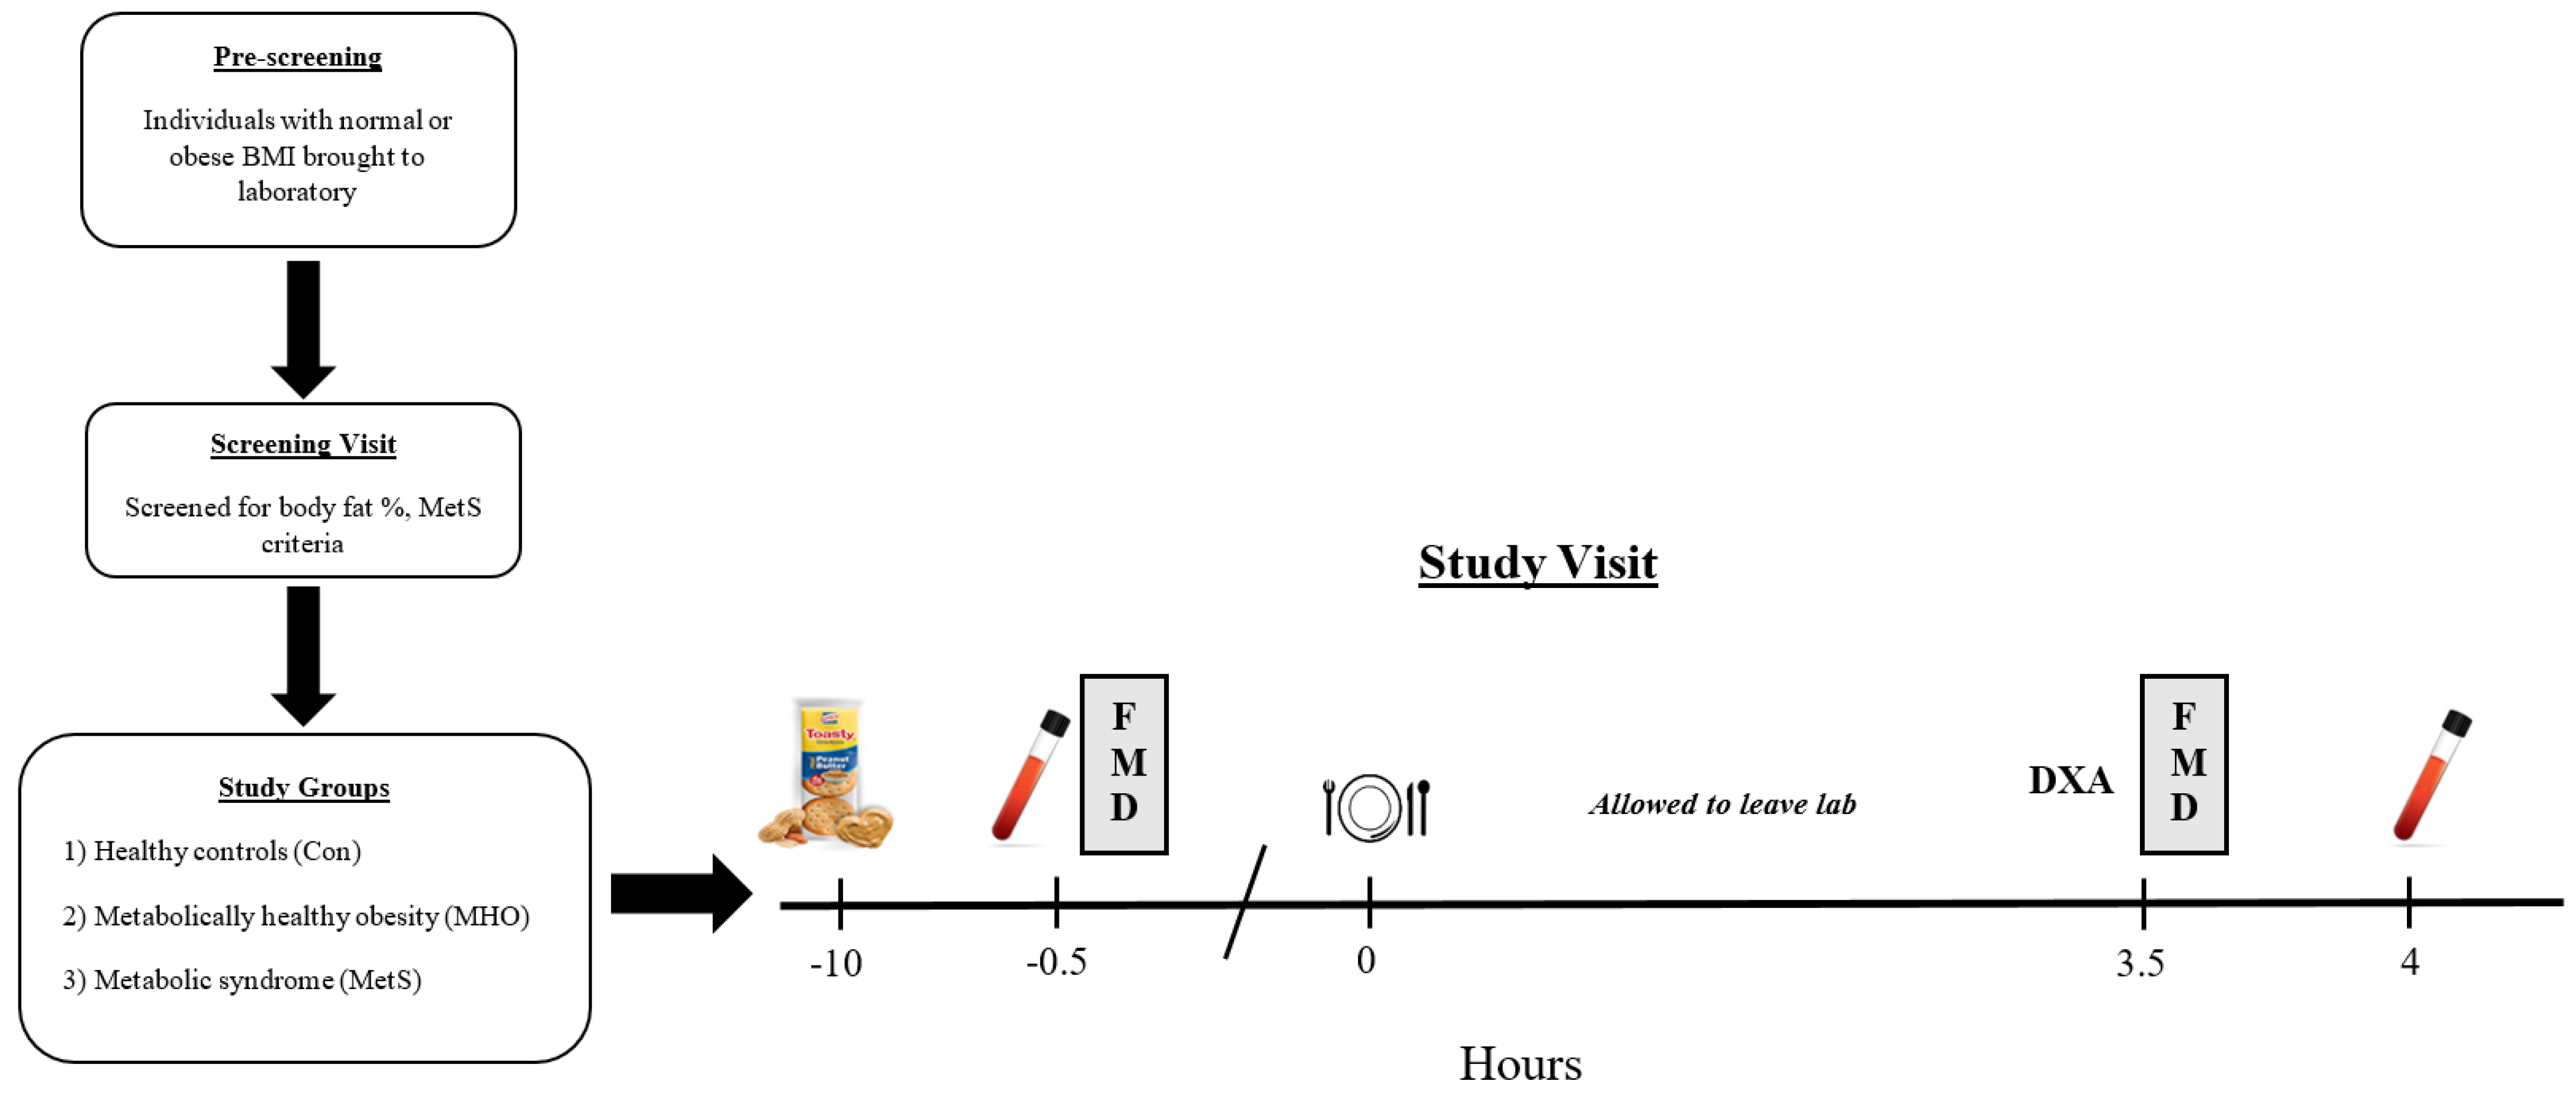
2.1. Participants
2.2. Initial Assessment
2.3. Fat Tolerance Test
2.4. Body Composition Assessment
2.5. Vascular Function
2.6. Serum Analyses
2.7. Statistical Analyses
3. Results
3.1. Participant Characteristics
3.2. Postprandial Metabolic Parameters
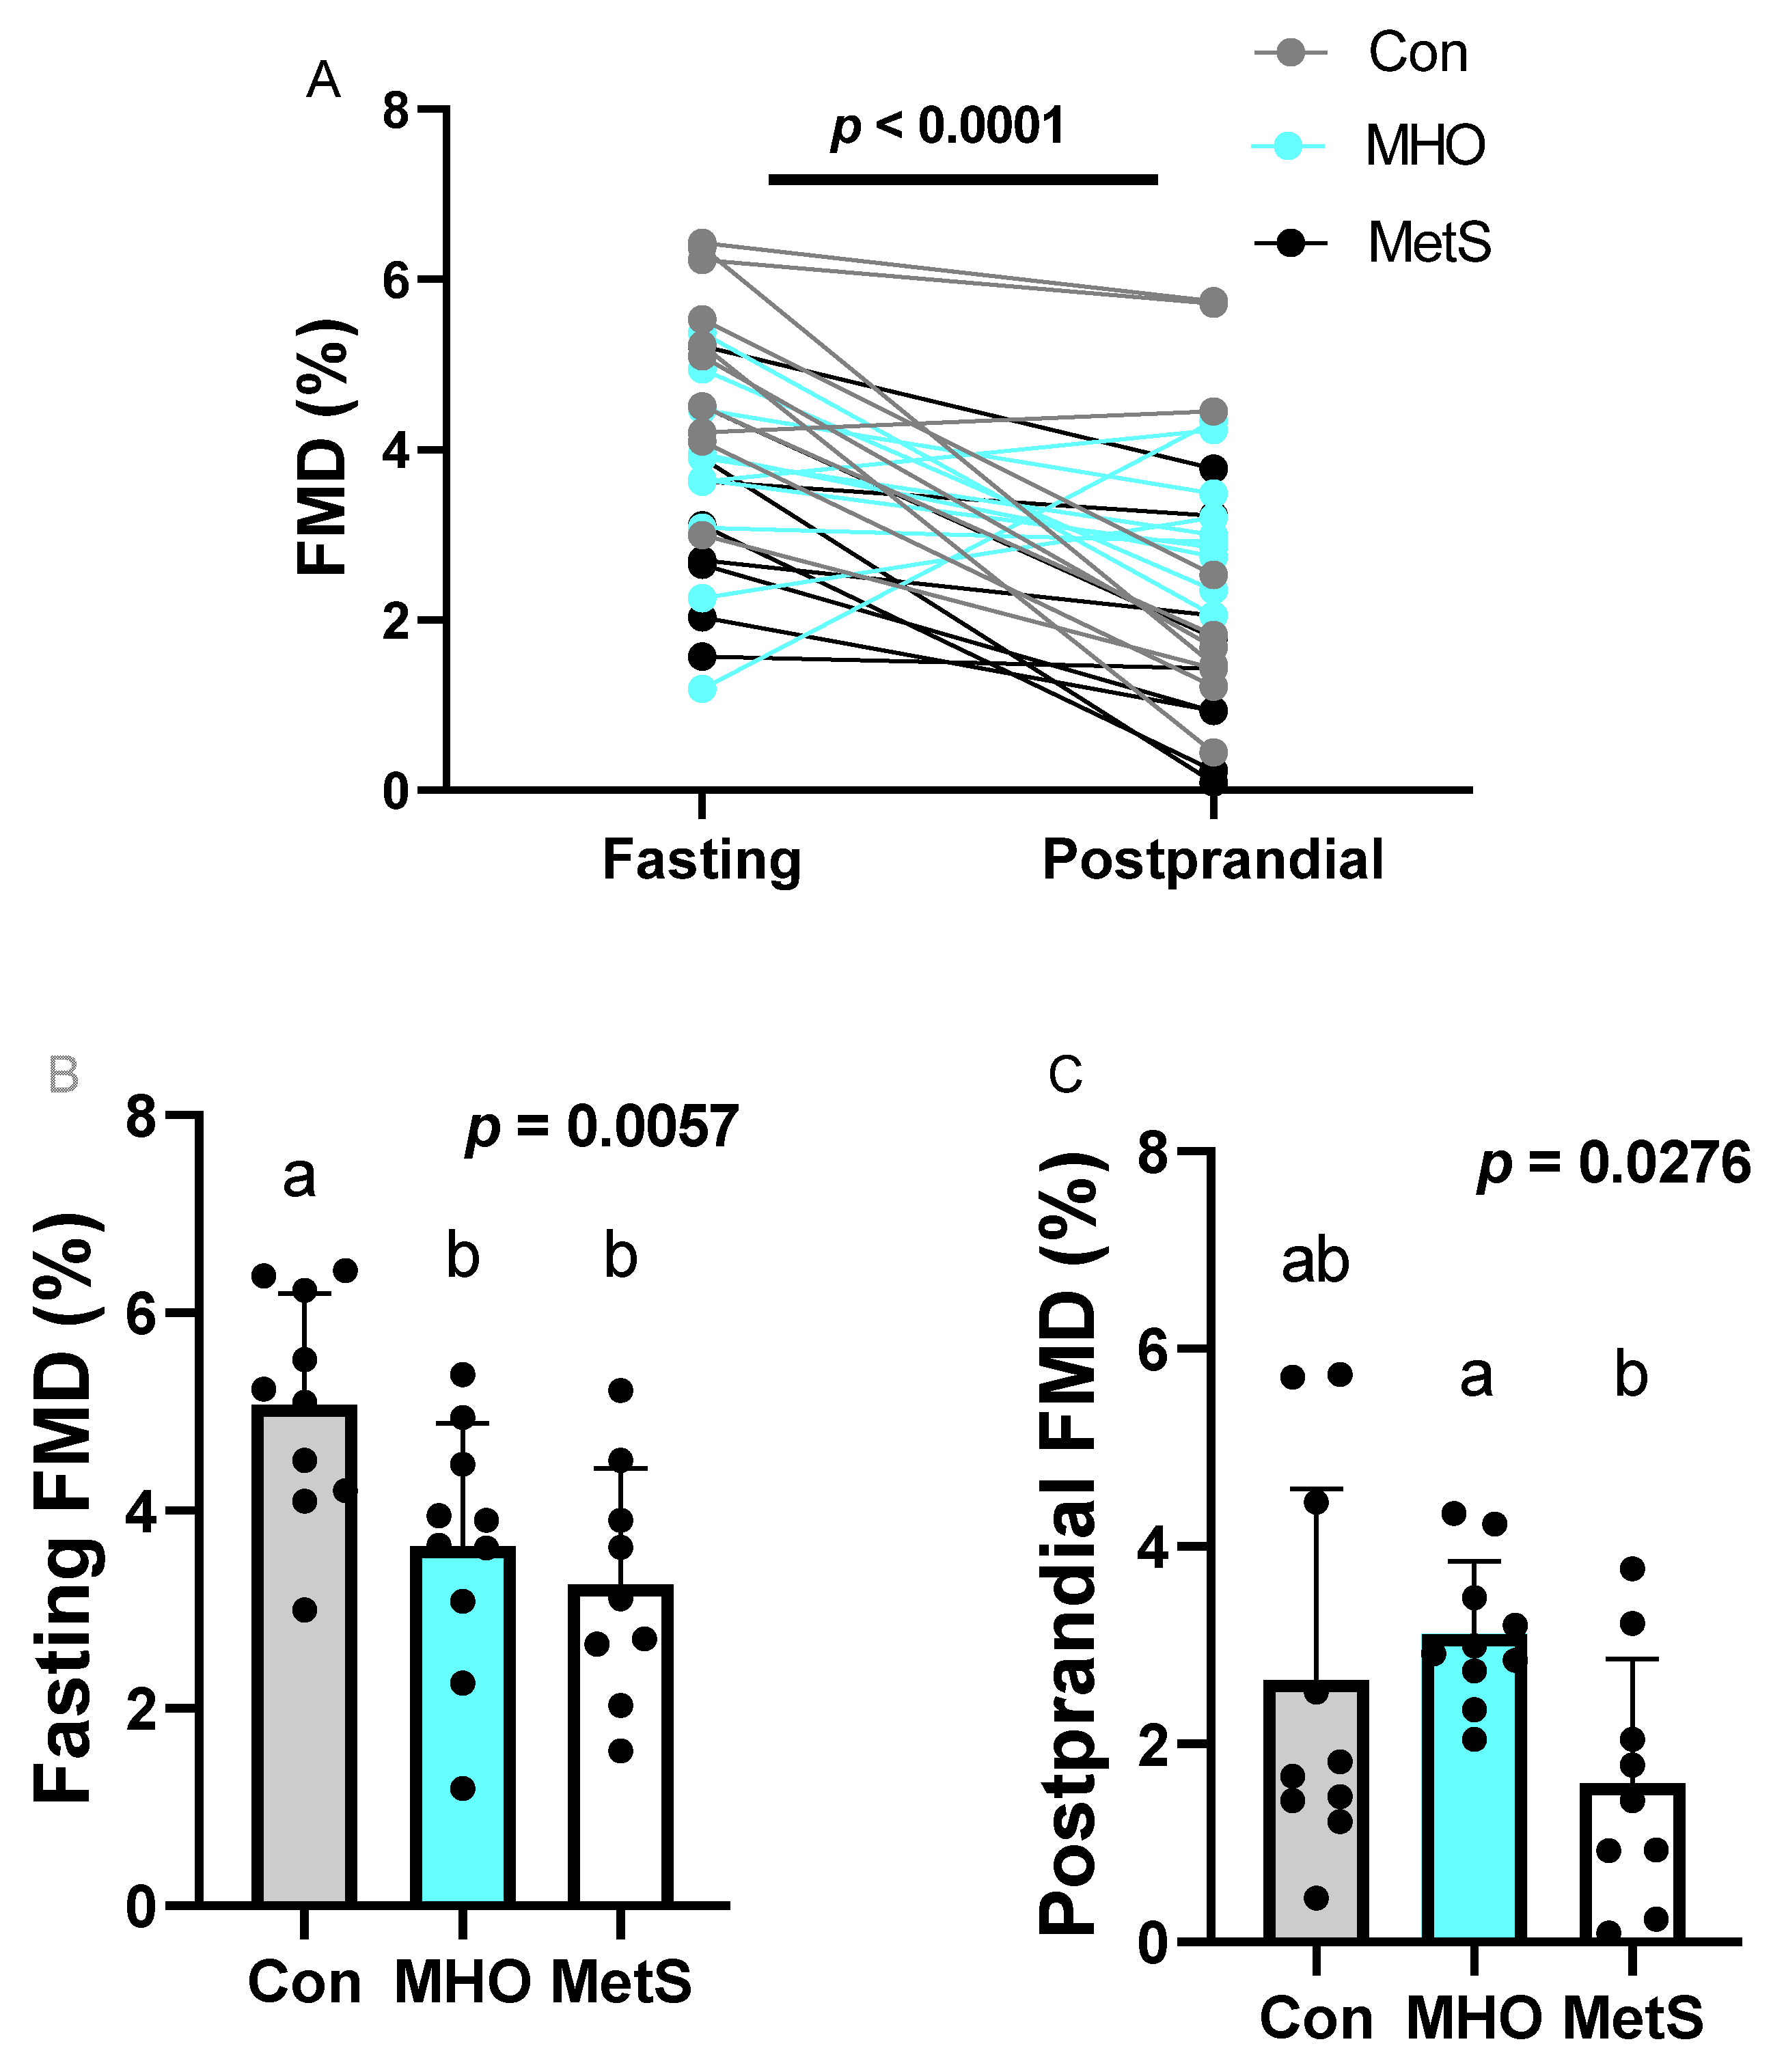
3.3. Flow-Mediated Dilation
3.4. Inflammatory Mediators
4. Discussion
5. Conclusions
Author Contributions
Funding
Institutional Review Board Statement
Informed Consent Statement
Acknowledgments
Conflicts of Interest
References
- Solomon, C.G.; E Manson, J. Obesity and mortality: A review of the epidemiologic data. Am. J. Clin. Nutr. 1997, 66, 1044S–1050S. [Google Scholar] [CrossRef] [PubMed] [Green Version]
- Mokdad, A.H.; Ford, E.S.; Bowman, B.A.; Dietz, W.H.; Vinicor, F.; Bales, V.S.; Marks, J.S. Prevalence of Obesity, Diabetes, and Obesity-Related Health Risk Factors. JAMA 2003, 289, 76–79. [Google Scholar] [CrossRef] [PubMed]
- Lavie, C.J.; Milani, R.V.; Ventura, H.O. Obesity and cardiovascular disease: Risk factor, paradox, and impact of weight loss. J. Am. Coll. Cardiol. 2009, 53, 1925–1932. [Google Scholar] [CrossRef] [PubMed] [Green Version]
- Smith, G.I.; Mittendorfer, B.; Klein, S. Metabolically healthy obesity: Facts and fantasies. J. Clin. Investig. 2019, 129, 3978–3989. [Google Scholar] [CrossRef] [PubMed] [Green Version]
- Blüher, M. Metabolically Healthy Obesity. Endocr. Rev. 2020, 41, 405–420. [Google Scholar] [CrossRef] [PubMed] [Green Version]
- Stefan, N.; Häring, H.-U.; Hu, F.B.; Schulze, M.B. Metabolically healthy obesity: Epidemiology, mechanisms, and clinical implications. Lancet Diabetes Endocrinol. 2013, 1, 152–162. [Google Scholar] [CrossRef]
- Hinnouho, G.-M.; Czernichow, S.; Dugravot, A.; Nabi, H.; Brunner, E.J.; Kivimaki, M.; Singh-Manoux, A. Metabolically healthy obesity and the risk of cardiovascular disease and type 2 diabetes: The Whitehall II cohort study. Eur. Hear. J. 2015, 36, 551–559. [Google Scholar] [CrossRef]
- Kuk, J.L.; Ardern, C.I. Are Metabolically Normal but Obese Individuals at Lower Risk for All-Cause Mortality? Diabetes Care 2009, 32, 2297–2299. [Google Scholar] [CrossRef] [Green Version]
- Choi, K.M.; Cho, H.J.; Choi, H.Y.; Yang, S.J.; Yoo, H.J.; Seo, J.A.; Kim, S.G.; Baik, S.H.; Choi, D.S.; Kim, N.H. Higher mortality in metabolically obese normal-weight people than in metabolically healthy obese subjects in elderly Koreans. Clin. Endocrinol. 2013, 79, 364–370. [Google Scholar] [CrossRef]
- Lee, H.-J.; Choi, E.-K.; Lee, S.-H.; Kim, Y.-J.; Han, K.-D.; Oh, S. Risk of ischemic stroke in metabolically healthy obesity: A na-tionwide population-based study. PLoS ONE 2018, 13, e0195210. [Google Scholar] [CrossRef] [Green Version]
- Zheng, R.; Zhou, D.; Zhu, Y. The long-term prognosis of cardiovascular disease and all-cause mortality for metabolically healthy obesity: A systematic review and meta-analysis. J. Epidemiol. Community Health 2016, 70, 1024–1031. [Google Scholar] [CrossRef]
- Bansal, S.; Buring, J.E.; Rifai, N.; Mora, S.; Sacks, F.M.; Ridker, P.M. Fasting Compared with Nonfasting Triglycerides and Risk of Cardiovascular Events in Women. JAMA 2007, 298, 309–316. [Google Scholar] [CrossRef] [Green Version]
- Koemel, N.A.; Sciarrillo, C.M.; Bode, K.B.; Dixon, M.D.; Lucas, E.A.; Jenkins, N.D.; Emerson, S.R. Postprandial Metabolism and Vascular Function: Impact of Aging and Physical Activity Level. Int. J. Sport Nutr. Exerc. Metab. 2020, 30, 1–8. [Google Scholar] [CrossRef] [PubMed]
- Sciarrillo, C.M.; Koemel, N.A.; Keirns, B.H.; Banks, N.F.; Rogers, E.M.; Rosenkranz, S.K.; Kurti, S.P.; Jenkins, N.D.; Emerson, S.R. Who would benefit most from postprandial lipid screening? Clin. Nutr. 2021. [Google Scholar] [CrossRef]
- Klöting, N.; Fasshauer, M.; Dietrich, A.; Kovacs, P.; Schön, M.; Kern, M.; Stumvoll, M.; Blüher, M. Insulin-sensitive obesity. Am. J. Physiol. Metab. 2010, 299, E506–E515. [Google Scholar] [CrossRef] [PubMed]
- Esser, N.; L’Homme, L.; De Roover, A.; Kohnen, L.; Scheen, A.J.; Moutschen, M.; Piette, J.; Legrand-Poels, S.; Paquot, N. Obesity phenotype is related to NLRP3 inflammasome activity and immunological profile of visceral adipose tissue. Diabetology 2013, 56, 2487–2497. [Google Scholar] [CrossRef] [Green Version]
- Shin, M.-J.; Hyun, Y.J.; Kim, O.Y.; Kim, J.Y.; Jang, Y.; Lee, J.H. Weight loss effect on inflammation and LDL oxidation in metabolically healthy but obese (MHO) individuals: Low inflammation and LDL oxidation in MHO women. Int. J. Obes. 2006, 30, 1529–1534. [Google Scholar] [CrossRef] [PubMed] [Green Version]
- Karelis, A.D.; Faraj, M.; Bastard, J.-P.; St-Pierre, D.H.; Brochu, M.; Prud’Homme, D.; Rabasa-Lhoret, R. The Metabolically Healthy but Obese Individual Presents a Favorable Inflammation Profile. J. Clin. Endocrinol. Metab. 2005, 90, 4145–4150. [Google Scholar] [CrossRef] [Green Version]
- Koster, A.; Stenholm, S.; Alley, D.E.; Kim, L.J.; Simonsick, E.M.; Kanaya, A.M.; Visser, M.; Houston, D.; Nicklas, B.J.; Tylavsky, F.A.; et al. Body Fat Distribution and Inflammation Among Obese Older Adults with and Without Metabolic Syndrome. Obesity 2010, 18, 2354–2361. [Google Scholar] [CrossRef]
- International Diabetes Federation. The IDF Consensus Worldwide Definition of the Metabolic Syndrome. International Diabetes Federation. Available online: https://www.idf.org/e-library/consensus-statements/60-idfconsensus-worldwide-definitionof-the-metabolic-syndrome (accessed on 15 March 2021).
- Kolovou, D.G.; Mikhailidis, P.D.; Kovar, J.; Lairon, D.; Nordestgaard, G.B.; Chye Ooi, T.; Perez-Martinez, P.; Bilianou, H.; Anagnostopoulou, K.; Panotopoulos, G. Assessment and clinical relevance of non-fasting and postprandial triglycerides: An expert panel statement. Curr. Vasc. Pharmacol. 2011, 9, 258–270. [Google Scholar] [CrossRef]
- Sciarrillo, C.M.; Koemel, N.A.; Kurti, S.P.; Emerson, S.R. Validity of an Abbreviated, Clinically Feasible Test for Postprandial Lipemia in Healthy Adults: A Randomized Cross-Over Study. Nutrition 2019, 11, 180. [Google Scholar] [CrossRef] [PubMed] [Green Version]
- Dixon, M.D.; Koemel, N.A.; Sciarrillo, C.M.; Lucas, E.A.; Jenkins, N.D.; Emerson, S.R. The reliability of an abbreviated fat tolerance test: A comparison to the oral glucose tolerance test. Clin. Nutr. ESPEN 2021, 43, 428–435. [Google Scholar] [CrossRef] [PubMed]
- Bots, M.L.; Westerink, J.H.D.M.; Rabelink, T.; De Koning, E.J. Assessment of flow-mediated vasodilatation (FMD) of the brachial artery: Effects of technical aspects of the FMD measurement on the FMD response. Eur. Hear. J. 2004, 26, 363–368. [Google Scholar] [CrossRef] [PubMed]
- Motulsky, H.J.; Brown, R.E. Detecting outliers when fitting data with nonlinear regression–a new method based on robust nonlinear regression and the false discovery rate. BMC Bioinform. 2006, 7, 1–20. [Google Scholar] [CrossRef] [PubMed] [Green Version]
- Nordestgaard, B.G.; Benn, M.; Schnohr, P.; Tybjaerg-Hansen, A. Nonfasting Triglycerides and Risk of Myocardial Infarction, Ischemic Heart Disease, and Death in Men and Women. JAMA 2007, 298, 299–308. [Google Scholar] [CrossRef] [PubMed] [Green Version]
- Lindman, A.S.; Veierød, M.B.; Tverdal, A.; Pedersen, J.I.; Selmer, R. Nonfasting triglycerides and risk of cardiovascular death in men and women from the Norwegian Counties Study. Eur. J. Epidemiol. 2010, 25, 789–798. [Google Scholar] [CrossRef] [Green Version]
- Stefan, N.; Kantartzis, K.; Machann, J.; Schick, F.; Thamer, C.; Rittig, K.; Balletshofer, B.; Machicao, F.; Fritsche, A.; Häring, H.-U. Identification and Characterization of Metabolically Benign Obesity in Humans. Arch. Intern. Med. 2008, 168, 1609–1616. [Google Scholar] [CrossRef]
- Gill, J.M.; Brown, J.C.; Bedford, D.; Wright, D.M.; Cooney, J.; A Hughes, D.; Packard, C.J.; Caslake, M.J. Hepatic production of VLDL1 but not VLDL2 is related to insulin resistance in normoglycaemic middle-aged subjects. Atherosclerosis 2004, 176, 49–56. [Google Scholar] [CrossRef]
- Adiels, M.; Taskinen, M.-R.; Packard, C.; Caslake, M.J.; Soro-Paavonen, A.; Westerbacka, J.; Vehkavaara, S.; Häkkinen, A.; Olofsson, S.-O.; Yki-Järvinen, H.; et al. Overproduction of large VLDL particles is driven by increased liver fat content in man. Diabetology 2006, 49, 755–765. [Google Scholar] [CrossRef] [Green Version]
- Ras, R.T.; Streppel, M.T.; Draijer, R.; Zock, P.L. Flow-mediated dilation and cardiovascular risk prediction: A systematic review with meta-analysis. Int. J. Cardiol. 2013, 168, 344–351. [Google Scholar] [CrossRef]
- Temizkan, Ş.; Özderya, A.; Demir, Ş.; Öztürk, H.T.; Sargın, M.; Aydın, K. Endothelial Function in Distinct Phenotypes of Obesity. Turk. J. Endocrinol. Metab. 2016, 20, 117–122. [Google Scholar] [CrossRef] [Green Version]
- Sprung, V.S.; Davies, K.A.B.; A Norman, J.; Thompson, A.; Mitchell, K.L.; Wilding, J.P.H.; Kemp, G.J.; Cuthbertson, D.J. Metabolic syndrome is associated with reduced flow mediated dilation independent of obesity status. Eur. J. Endocrinol. 2020, 183, 211–220. [Google Scholar] [CrossRef] [PubMed]
- Ghiadoni, L.; Penno, G.; Giannarelli, C.; Plantinga, Y.; Bernardini, M.; Pucci, L.; Miccoli, R.; Taddei, S.; Salvetti, A.; Del Prato, S. Metabolic Syndrome and Vascular Alterations in Normotensive Subjects at Risk of Diabetes Mellitus. Hypertension 2008, 51, 440–445. [Google Scholar] [CrossRef] [PubMed] [Green Version]
- Schinzari, F.; Iantorno, M.; Campia, U.; Mores, N.; Rovella, V.; Tesauro, M.; Di Daniele, N.; Cardillo, C. Vasodilator responses and endothelin-dependent vasoconstriction in metabolically healthy obesity and the metabolic syndrome. Am. J. Physiol. Metab. 2015, 309, E787–E792. [Google Scholar] [CrossRef] [PubMed] [Green Version]
- Brant, L.C.C.; Wang, N.; Ojeda, F.M.; LaValley, M.; Barreto, S.M.; Benjamin, E.; Mitchell, G.F.; Vasan, R.S.; Palmisano, J.N.; Münzel, T.; et al. Relations of Metabolically Healthy and Unhealthy Obesity to Digital Vascular Function in Three Community-Based Cohorts: A Meta-Analysis. J. Am. Hear. Assoc. 2017, 6, 004199. [Google Scholar] [CrossRef] [Green Version]
- Vogel, R.A.; Corretti, M.C.; Plotnick, G.D. Effect of a Single High-Fat Meal on Endothelial Function in Healthy Subjects. Am. J. Cardiol. 1997, 79, 350–354. [Google Scholar] [CrossRef]
- Bae, J.-H.; Bassenge, E.; Kim, K.-B.; Kim, Y.-N.; Kim, K.-S.; Lee, H.-J.; Moon, K.-C.; Lee, M.-S.; Park, K.-Y.; Schwemmer, M. Postprandial hypertriglyceridemia impairs endothelial function by enhanced oxidant stress. Atherosclerosis 2001, 155, 517–523. [Google Scholar] [CrossRef]
- Marchesi, S.; Lupattelli, G.; Schillaci, G.; Pirro, M.; Siepi, D.; Roscini, A.R.; Pasqualini, L.; Mannarino, E. Impaired flow-mediated vasoactivity during post-prandial phase in young healthy men. Atherosclerosis 2000, 153, 397–402. [Google Scholar] [CrossRef]
- Mohammadi, M.; Gozashti, M.; Aghadavood, M.; Mehdizadeh, M.R.; Hayatbakhsh, M.M. Clinical Significance of Serum IL-6 and TNF-α Levels in Patients with Metabolic Syndrome. Rep. Biochem. Mol. Biol. 2017, 6, 74–79. [Google Scholar] [PubMed]
- Hotamisligil, G.S. Inflammation and metabolic disorders. Nature 2006, 444, 860–867. [Google Scholar] [CrossRef]
- Iglesias Molli, A.E.; Penas Steinhardt, A.; López, A.P.; González, C.D.; Vilarino, J.; Frechtel, G.D.; Cerrone, G.E. Metabolically healthy obese individuals present similar chronic inflammation level but less insulin-resistance than obese individuals with metabolic syndrome. PLoS ONE 2017, 12, e0190528. [Google Scholar] [CrossRef]
- Fabbrini, E.; Cella, M.; Mccartney, S.A.; Fuchs, A.; Abumrad, N.A.; Pietka, T.A.; Chen, Z.; Finck, B.N.; Han, D.H.; Magkos, F.; et al. Association Between Specific Adipose Tissue CD4+ T-Cell Populations and Insulin Resistance in Obese Individuals. Gastroenterology 2013, 145, 366–374.e3. [Google Scholar] [CrossRef] [PubMed] [Green Version]
- Kouvari, M.; Panagiotakos, D.B.; Yannakoulia, M.; Georgousopoulou, E.; Critselis, E.; Chrysohoou, C.; Tousoulis, D.; Pitsavos, C.; The ATTICA Study Investigators. Transition from metabolically benign to metabolically unhealthy obesity and 10-year cardiovascular disease incidence: The ATTICA cohort study. Metabolism 2019, 93, 18–24. [Google Scholar] [CrossRef]
- Porsche, C.E.; Delproposto, J.B.; Geletka, L.; O’Rourke, R.; Lumeng, C.N. Obesity results in adipose tissue T cell exhaustion. JCI Insight 2021, 6, 6. [Google Scholar] [CrossRef] [PubMed]
- Cavaillon, J.M. Pro- versus anti-inflammatory cytokines: Myth or reality. Cell. Mol. Boil. 2001, 47, 695–702. [Google Scholar]


| Con | MHO | MetS | p-Value | |
|---|---|---|---|---|
| Participant Characteristics | ||||
| Age (years) | 27 ± 5 | 30 ± 9 | 36 ± 7 | 0.0514 |
| Mass (kg) | 67.4 ± 10.8 b | 96.9 ± 11.9 a | 110.7 ± 21.2 a | <0.0001 |
| BMI (kg/m2) | 22.1 ± 1.6 b | 33.8 ± 4.1 a | 37.9 ± 4.5 a | <0.0001 |
| WC (in) | 29.0 ± 2.3 c | 39.1 ± 4.2 b | 44.8 ± 5.7 a | <0.0001 |
| Body Fat (%) | 23.4 ± 5.5 b | 40.2 ± 8.2 a | 37.8 ± 8.3 a | 0.0006 |
| Body Fat (kg) | 15.8 ± 3.7 b | 38.8 ± 9.4 a | 42.0 ± 12.5 a | <0.0001 |
| VAT (g) | 233.4 ± 66.0 c | 561.4 ± 132.0 b | 795.7 ± 244.7 a | <0.0001 |
| Lean mass (%) | 74.0 ± 6.0 a | 57.3 ± 8.4 b | 59.8 ± 8.0 b | 0.0007 |
| Lean mass (kg) | 50.1 ± 10.3 b | 55.6 ± 10.8 ab | 65.9 ± 13.2 a | 0.0269 |
| Systolic BP (mmHg) | 108 ± 12.0 | 115 ± 12 | 122 ± 16 | 0.1214 |
| Diastolic BP (mmHg) | 74 ± 9 | 82 ± 10 | 84 ± 15 | 0.1387 |
| Fasting Glucose (mg/dL) | 92.4 ± 6.7 b | 95.6 ± 3.9 b | 103.6 ± 12.4 a | 0.0162 |
| Fasting Total-C (mg/dL) | 154.6 ± 31.6 | 170.4 ± 26.0 | 180.3 ± 33.3 | 0.1786 |
| Fasting HDL-C (mg/dL) | 66.6 ± 11.0 a | 58.1 ± 10.5 ab | 47.2 ± 12.2 b | 0.0026 |
| Fasting LDL-C (mg/dL) | 75.0 ± 26.1 b | 93.6 ± 21.5 ab | 105.3 ± 27.8 a | 0.0375 |
| Fasting VLDL-C (mg/dL) | 12.8 ± 3.6 b | 18.5 ± 7.8 b | 27.9 ± 11.8 a | 0.0015 |
| Fasting Non-HDL-C (mg/dL) | 88.0 ± 25.1 b | 112.4 ± 21.6 ab | 133.1 ± 31.8 a | 0.0027 |
| Fasting TC/HDL | 2.3 ± 0.3 c | 3.0 ± 0.6 b | 4.0 ± 1.1 a | <0.0001 |
| Fasting Triglycerides (mg/dL) | 64.5 ± 18.0 b | 89.8 ± 32.6 b | 139.1 ± 59.1 a | 0.0010 |
| Fasting ALT (U/L) | 22.3 ± 6.1 b | 27.4 ± 6.2 b | 41.7 ± 16.2 a | 0.0008 |
| Fasting AST (U/L) | 26.6 ± 5.9 | 23.8 ± 4.8 | 29.8 ± 8.7 | 0.1343 |
| Fasting insulin (mU/L) | 1.1 ± 0.6 b | 2.6 ± 2.1 b | 5.5 ± 3.6 a | 0.0023 |
| HOMA-IR | 0.2 ± 0.1 b | 0.6 ± 0.5 b | 1.5 ± 1.1 a | 0.0024 |
| Fat Tolerance Test Meal | ||||
| Total kcal | 607 ± 97.4 c | 872.3 ± 107.0 b | 996 ± 191 a | <0.0001 |
| Fat (g) | 47.2 ± 7.6 c | 67.9 ± 8.3 b | 77.5 ± 14.9 a | <0.0001 |
| Carbohydrate (g) | 31.8 ± 5.1 c | 45.8 ± 5.6 b | 52.3 ± 10.0 a | <0.0001 |
| Protein (g) | 15.2 ± 2.4 c | 21.8 ± 2.7 b | 24.9 ± 4.8 a | <0.0001 |
| Con | MHO | MetS | p-Value | |
|---|---|---|---|---|
| Final (4 h) | ||||
| Glucose (mg/dL) | 90.1 ± 6.4 | 94.2 ± 8.7 | 94.7 ± 2.9 | 0.2408 |
| Total-C (mg/dL) | 157.6 ± 30.7 | 169.3 ± 29.6 | 178.0 ± 35.9 | 0.3433 |
| HDL-C (mg/dL) | 66.5 ± 12.3 b | 55.8 ± 12.3 ab | 45.4 ± 12.3 a | 0.0027 |
| LDL-C (mg/dL) | 76.3 ± 22.3 | 91.8 ± 24.90 | 96.7 ± 26.7 | 0.1734 |
| VLDL-C (mg/dL) | 14.7 ± 2.8 b | 21.9 ± 9.6 b | 35.6 ± 15.3 a | 0.0005 |
| Non-HDL-C (mg/dL) | 90.9 ± 23.1 b | 113.6 ± 23.7 ab | 132.5 ± 32.5 a | 0.0063 |
| TC/HDL | 2.4 ± 0.3 c | 3.2 ± 0.7 b | 4.1 ± 1.2 a | <0.0001 |
| Triglycerides (mg/dL) | 73.7 ± 13.9 b | 109.4 ± 49.1 b | 178.3 ± 76.4 a | 0.0005 |
| ALT (U/L) | 24.5 ± 6.4 b | 27.8 ± 5.0 b | 42.5 ± 17.3 a | 0.0020 |
| AST (U/L) | 29.0 ± 5.9 ab | 23.2 ± 2.9 b | 32.6 ± 10.2 a | 0.0187 |
| Delta | ||||
| Glucose (mg/dL) | −2.3 ± 0.9 | −1.4 ± 8.5 | −8.9 ± 11.0 | 0.1324 |
| Total-C (mg/dL) | 3.0 ± 8.6 | −1.1 ± 9.4 | −3.9 ± 2.4 | 0.3205 |
| HDL-C (mg/dL) | −0.1 ± 4.1 | −2.3 ± 4.0 | −1.8 ± 3.0 | 0.0980 |
| LDL-C (mg/dL) | 1.3 ± 8.4 b | −1.7 ± 6.9 b | −8.6 ± 6.0 a | 0.0093 |
| VLDL-C (mg/dL) | 1.9 ± 3.7 b | 3.5 ± 3.6 b | 7.7 ± 6.0 a | 0.0220 |
| Non-HDL-C (mg/dL) | 2.9 ± 6.0 | 1.3 ± 6.1 | -0.6 ± 4.5 | 0.3890 |
| TC/HDL | 0.1 ± 0.1 | 0.1 ± 0.2 | 0.04 ± 0.1 | 0.3044 |
| Triglycerides (mg/dL) | 9.2 ± 17.1 b | 19.6 ± 23.8 ab | 39.2 ± 29.9 a | 0.0299 |
| ALT (U/L) | 2.2 ± 3.5 | 0.5 ± 2.4 | 1.3 ± 1.6 | 0.3294 |
| AST (U/L) | 2.4 ± 4.7 | 0.5 ± 2.8 | 2.8 ± 5.8 | 0.4832 |
| Con | MHO | MetS | p-Value | |
|---|---|---|---|---|
| GM-CSF (pg/mL) | 19.43 ± 18.17 b | 45.93 ± 34.01 a | 11.82 ± 5.60 b | 0.0025 |
| IFN-γ (pg/mL) | 3.76 ± 2.40 | 3.68 ± 1.91 | 2.97 ± 2.18 | 0.6526 |
| IL-1β (pg/mL) | 1.08 ± 0.48 ab | 1.52 ± 0.81 a | 0.71 ± 0.39 b | 0.0249 |
| IL-2 (pg/mL) | 2.28 ± 1.35 | 2.28 ± 1.22 | 2.03 ± 1.73 | 0.6490 |
| IL-5 (pg/mL) | 1.38 ± 0.62 ab | 1.89 ± 1.02 a | 0.99 ± 0.50 b | 0.0408 |
| IL-6 (pg/mL) | 1.78 ± 1.69 b | 12.33 ± 13.22 a | 2.29 ± 2.16 b | 0.0059 |
| IL-8 (pg/mL) | 19.07 ± 16.25 b | 58.70 ± 52.35 a | 10.13 ± 4.29 b | 0.0154 |
| IL-12p70 (pg/mL) | 2.65 ± 1.36 | 2.35 ± 0.87 | 2.07 ± 1.37 | 0.5458 |
| IL-13 (pg/mL) | 5.25 ± 4.02 b | 14.78 ± 11.18 a | 3.82 ± 3.00 b | 0.0043 |
| IL-17 (pg/mL) | 9.25 ± 4.63 | 10.17 ± 5.63 | 10.13 ± 8.37 | 0.9380 |
| TNF-α (pg/mL) | 4.78 ± 1.89 b | 7.51 ± 3.33 a | 7.83 ± 2.13 a | 0.0233 |
| IL-4 (pg/mL) | 37.93 ± 41.34 | 52.07 ± 49.02 | 29.18 ± 29.68 | 0.4671 |
| IL-10 (pg/mL) | 4.56 ± 2.16 | 4.01 ± 1.12 | 3.53 ± 2.09 | 0.4699 |
Publisher’s Note: MDPI stays neutral with regard to jurisdictional claims in published maps and institutional affiliations. |
© 2021 by the authors. Licensee MDPI, Basel, Switzerland. This article is an open access article distributed under the terms and conditions of the Creative Commons Attribution (CC BY) license (https://creativecommons.org/licenses/by/4.0/).
Share and Cite
Keirns, B.H.; Hart, S.M.; Sciarrillo, C.M.; Poindexter, K.L.; Clarke, S.L.; Emerson, S.R. Postprandial Triglycerides, Flow-Mediated Dilation, and the Inflammatory Cytokine Milieu in Metabolically Healthy Obesity: A Cross-Sectional Pilot Study. Obesities 2021, 1, 58-71. https://0-doi-org.brum.beds.ac.uk/10.3390/Obesities1010006
Keirns BH, Hart SM, Sciarrillo CM, Poindexter KL, Clarke SL, Emerson SR. Postprandial Triglycerides, Flow-Mediated Dilation, and the Inflammatory Cytokine Milieu in Metabolically Healthy Obesity: A Cross-Sectional Pilot Study. Obesities. 2021; 1(1):58-71. https://0-doi-org.brum.beds.ac.uk/10.3390/Obesities1010006
Chicago/Turabian StyleKeirns, Bryant H., Samantha M. Hart, Christina M. Sciarrillo, Kara L. Poindexter, Stephen L. Clarke, and Sam R. Emerson. 2021. "Postprandial Triglycerides, Flow-Mediated Dilation, and the Inflammatory Cytokine Milieu in Metabolically Healthy Obesity: A Cross-Sectional Pilot Study" Obesities 1, no. 1: 58-71. https://0-doi-org.brum.beds.ac.uk/10.3390/Obesities1010006