Article

Acute and Chronic Effects of Low-Volume High-Intensity Interval Training Compared to Moderate-Intensity Continuous Training on Glycemic Control and Body Composition in Older Women with Type 2 Diabetes

by
Alexis Marcotte-Chénard
1,2,
Dominic Tremblay
2,3,
Marie-Michelle Mony
1,2,
Pierre Boulay
1,
Martin Brochu
1,2,
José A. Morais
4,
Isabelle J. Dionne
1,2,
Marie-France Langlois
3,5,
Warner M. Mampuya
3,
Daniel M. Tessier
2,3,
Normand G. Boulé
6 and
Eléonor Riesco
1,2,*
1
Faculty of Physical Activity Sciences, University of Sherbrooke, Sherbrooke, QC J1K 2R1, Canada
2
Research Centre on Aging, CIUSSS de l’Estrie-CHUS, Sherbrooke, QC J1H 4C4, Canada
3
Faculty of Medicine and Health Sciences, University of Sherbrooke, Sherbrooke, QC J1H 5N4, Canada
4
Research Centre of McGill University Health Centre (MUHC), Division of Geriatric Medicine of MUHC, Montréal, QC H4A 3J1, Canada
5
Research Centre of the CHUS, Sherbrooke, QC J1H 5N4, Canada
6
Faculty of Kinesiology, Sport, and Recreation, University of Alberta, Edmonton, AB T6G 2R3, Canada
*
Author to whom correspondence should be addressed.
Submission received: 21 May 2021 / Revised: 10 June 2021 / Accepted: 17 June 2021 / Published: 22 June 2021

Abstract

:
Objective: To compare the acute and chronic effects of low-volume high-intensity interval training (HIIT) to moderate-intensity continuous training (MICT) on glycemic control, body composition and continuous glucose monitoring (CGM) in older women with type 2 diabetes (T2D). Methods: Thirty older women (68 ± 5 years) with T2D were randomized in two groups—HIIT (75 min/week) or MICT (150 min/week). Glucose homeostasis (A1c, glucose, insulin, HOMA-IR2) and body composition (iDXA) were measured before and after the 12-week exercise intervention. During the first and last week of training (24-h before and 48-h after exercise), the following CGM-derived data were measured: 24-h and peak glucose levels, glucose variability and time spent in hypoglycemia as well as severe and mild hyperglycemia. Results: While lean body mass increased (p = 0.035), total and trunk fat mass decreased (p ≤ 0.007), without any difference between groups (p ≥ 0.81). Fasting glucose levels (p = 0.001) and A1c (p = 0.014) significantly improved in MICT only, with a significant difference between groups for fasting glucose (p = 0.02). Neither HIIT nor MICT impacted CGM-derived data at week 1 (p ≥ 0.25). However, 24-h and peak glucose levels, as well as time spent in mild hyperglycemia, decreased in HIIT at week 12 (p ≤ 0.03). Conclusion: These results suggest that 12 weeks of low-volume HIIT is enough to provide similar benefit to MICT for body composition and improve the acute effect of exercise when measured with CGM.

1. Introduction

Type 2 diabetes (T2D) is one of the most prevalent chronic diseases in the world, affecting nearly 425 million individuals in 2017, with a much higher prevalence in the elderly [1]. Older women with T2D have poorer glycemic control compared to older men [2], and are less likely to achieve glycated hemoglobin (A1c) targets [3]. Along with pharmacotherapy and diet, exercise is considered to be one of the cornerstones in the management of T2D [4,5] as it is known to acutely improve glycemic control in the following hours by stimulating insulin-independent glucose uptake by skeletal muscles [6]. Moreover, the accumulation of multiple acute bouts of exercise can lead to chronic adaptations, such as increased capillary density and mitochondrial content, which are known to be associated with better insulin sensitivity [7,8,9].
In this context, many studies have investigated the benefits of different aerobic exercise modalities on glycemic control, including moderate-intensity continuous training (MICT) and high-intensity interval training (HIIT). Recent meta-analyses [10,11,12] reported no difference between HIIT and MICT intervention on the improvement of A1c. In contrast, other meta-analyses had shown that higher exercise intensity produces larger improvement in A1c in T2D individuals [13,14]. However, these meta-analyses pointed out that more evidence is needed to confirm these results and that data are still scarce regarding differential benefits of exercise protocols with varying intensity, frequency, volume, rest time and types of exercise in T2D management [12,14].
Moreover, most studies assessing the glycemic response to an exercise intervention mainly measured A1c, considering that it reflects the glycemic exposure of the past 3 months [11,14]. Nonetheless, two individuals could have the same A1c but have divergent daily patterns of glucose excursions, which places them at different levels of cardiovascular risk [15]. From clinical and populational standpoints, A1c remains an essential tool. Nevertheless, its combination with other indices, such as glycemic variability (GV) and time spent in hyperglycemia, allows a broader understanding of how exercise training can modulate acute and chronic glycemic control. GV has been shown to be an independent risk factor for many diabetic complications [16] and can be measured with continuous glucose monitoring (CGM). Furthermore, most studies using CGM had strict dietary conditions, meaning that the energy intake, the proportion of macronutrients and the timing of each meal were controlled [17,18]. Despite the fact that controlling for diet is essential to isolate and investigate the postprandial states and underlying mechanisms of glycemic control following an exercise session, it compromises the ecological validity of exercise interventions since it is not representative of free-living conditions. To our knowledge, no study has evaluated how the acute effect of exercise on glycemic control can be modulated by exercise-induced chronic adaptations in free-living and ecological conditions using a CGM device. Considering that GV and time spent in hyperglycemia are known to be deleterious to metabolic and cardiovascular health [19], studies are needed to investigate the acute and chronic effects of exercise on these parameters.
Finally, knowing the close relationship between adiposity, especially visceral adipose tissue, and insulin resistance [20], it is of importance to consider exercise training-associated changes in body composition to properly evaluate the effect of the exercise on glycemic control.
Therefore, the main objective of the present study was to compare 12 weeks of low-volume HIIT to MICT on glycemic control and body composition in older women with T2D. The secondary objective was to investigate if the acute effect of exercise on 24-h glucose, GV, and time spent in hyperglycemia may be modulated by chronic exercise adaptations in free-living and ecological conditions.

2. Materials and Methods

2.1. Study Protocol

Considering that exercise is recognized to improve health in older adults, this was a randomized two-arm parallel design study with no control group. Indeed, several meta-analyses have shown the absence of improvement in the control group compared to exercise when assessing its effect on glycemic control [10,13]. Therefore, for ethical reasons, no control group was included in the present study. Different size block randomization (2 and 4) was performed to achieve balance in the allocation of participants to the study groups. The sequence was generated by the principal investigator using Sealed Envelope Ltd. The randomization sequence was unknown to the exercise physiologist who was in charge of the project, until participants had completed all pre-intervention testing. Participants were recruited from the Sherbrooke area in the Province of Quebec, Canada, using a local recruitment database (Nabû), and during presentations in community organizations. After the confirmation of eligibility, participants were invited for three baseline visits at the Research Centre on Aging. During the first baseline visit, the following assessments and tests were conducted: (1) resting metabolic rate (indirect calorimetry); (2) resting heart rate (HR) and blood pressure; (3) anthropometry and body composition; (4) 12 h-overnight fasting metabolic profile (lipid profile, glucose, insulin, A1c); (5) medical history and physical activity levels; (6) explanation of the 3-day dietary record for nutritional habits; (7) installation of the accelerometer to assess energy expenditure of the next 7 consecutive days.
After at least 7 days, participants were invited to a second visit during which a cardiopulmonary exercise test (CPET) was carried out to obtain medical clearance and prescribe exercise. During the third visit, a dietician provided individual nutritional counselling for T2D management according to the current guidelines [21] and provided nutritional advice on low-glycemic index food (LGI) diet. The sole purpose of this meeting was to ensure that every participant had a similar level of knowledge on the current guideline considering that most women had their diagnosis of T2D more than 10 years ago. No food portion training was involved, and no diet regimen was enforced. All measurements were performed before and after the 12-week intervention, except for CGM, which was used during the first (week 1) and last week (week 12) of exercise in a subsample (n = 12). This study was conducted according to the guidelines laid down in the Declaration of Helsinki and all procedures were approved by the Ethics Committee of the CIUSSS de l’Estrie-CHUS (2016–574-IUGS; 5 November 2015). Written informed consent was obtained from all participants before entering the study.

2.2. Participants

A total of 30 women with T2D, between 60 and 85 years of age, were included between January 2016 and September 2019. To meet the inclusion criteria, participants had to be non-smokers, none or light drinkers (≤15 g ethanol/day = 1 alcoholic beverage/day), and physically inactive (<75 min of structured exercise/week). Exclusion criteria were: (1) having received hormonal replacement therapy for more than 3 years; (2) insulin therapy; (3) changes in all type of medications in the last 6 months; (4) uncontrolled hypertension measured during the first visit (>160/90 mmHg); (5) uncontrolled lipid profile (total cholesterol > 8 mmol/L; triglycerides > 10 mmol/L; LDL-C > 4 mmol/L); (6) unstable weight in the last 6 months (±5 lbs); (7) physical disability limiting the capacity to perform exercise; (8) diagnosed diabetic nephropathy, retinopathy or neuropathy; (9) planned surgery during the intervention period or (10) coronary artery diseases without revascularization, peripheral arterial diseases, venous thrombosis or pulmonary embolism and cerebrovascular diseases (stroke) in the past 3 years.

2.3. Cardiopulmonary Exercise Testing

CPET was performed using a ramp protocol (Ball State University-Bruce ramp) on a treadmill under the supervision of a clinician and an exercise physiologist [22]. To be considered as a VO2 max, at least two of the following criteria must be attained: respiratory exchange ratio ≥1.15; failure to increase HR despite an increase in workload; no further increase in VO2 (<150 mL/min) despite an increased workload [23]. If the criteria mentioned above were not reached, the highest value of oxygen consumption was considered as the VO2 peak. Gas exchange was measured using a breath-by-breath system (Ergocard; Medisoft, Sorinnes, Belgium). Heart rate was continuously monitored with a 12-lead electrocardiogram (Quinton Q-stress, Quinton Inc., Bothell, WA, USA). The highest HR value recorded during the CPET was used to calculate heart rate reserve (HRR) and then used to prescribe exercise intensity. For individuals using beta-adrenergic blocking agents, CPET was performed in the morning at the same time of planned exercise sessions to ensure that the pharmacokinetics of the beta-blockers were similar in both situations.

2.4. Anthropometrics and Body Composition

Body weight (±0.2 kg) was measured using an electronic scale (SECA 707, Hamburg, Germany) and height (±0.1 cm) with a wall stadiometer (Takei, Tokyo, Japan). Body mass index (BMI) was calculated using the following formula: BMI = weight (kg)/height (m)2. Waist circumference was measured at the midpoint between the inferior costal border and the iliac crest [24]. Lean body mass, fat mass and visceral adipose tissue were estimated using Dual Energy X-ray absorptiometry (iDXA, GE Healthcare, Chicago, IL, USA; EnCORE Version 16 software). The coefficient of variation for fat mass and lean body mass, measured at a one-week interval for 100 individuals, in our laboratory is 1.9% and 1.2%, respectively.

2.5. Cardiometabolic Profile

Blood samples were obtained after a 12-h overnight fast by a certified research nurse. A total of 35 mL of blood was collected and sent to the CIUSSS de l’Estrie-CHUS biochemistry laboratory to measure glucose metabolism (A1c, insulin, and glucose) by enzymatic and immunologic methods. Post-intervention measurements were performed at least 72-h after the last training session to prevent the acute effect of exercise from biasing the results. Homeostasis model assessment of insulin resistance 2 (HOMA2-IR) was calculated using the HOMA2 Calculator [25]. Resting systolic and diastolic blood pressure was measured after 5 min of rest in a sitting position using an automatic blood pressure monitor (Spot Vital Signs LXi, Welch Allyn Inc., NY, USA) on the left arm.

2.6. Continuous Glucose Monitoring

On Monday (Day 1) of the first week (week 1), participants consumed their usual breakfast before reporting to the laboratory (before noon). A CGM sensor (iPro™ 2 professional CGM and Enlite™ sensor, Medtronic, Northridge, CA, USA) was inserted in the abdominal area by a registered nurse and was worn for 4 days. Participants then received a brief course on how to fill the logbook, which recorded the timing and quantity of each meal and snack during the day, bedtime hours, timing of hypoglycemic medication, and capillary glucose (4/day; before meal and sleep). To limit device-associated variability, participants were given a Onetouch Ultra 2 glucometer (LifeScan, Milpitas, CA, USA) and were trained to use the device. On Tuesday (Day 2) and Thursday (Day 4), measures were performed with participants in free-living conditions without restriction, except for limiting their participation in unusual physical activity. On Wednesday (Day 3), participants arrived at the laboratory approximately 1 h after their usual breakfast to perform their assigned training regimen (HIIT or MICT). On Friday (Day 5), the CGM sensor was removed before the training session and the data were then retrieved from the device using the CareLink iPro software.
The primary outcomes for CGM data were 24-h glucose, time spent in hyperglycemia (>10 mmol/L), mild hyperglycemia (>8.3 mmol/L), hypoglycemia (<3.8 mmol/L), standard deviation of CGM glucose (SD), and continuous overall net glycemic action (CONGA1). These outcomes were chosen in accordance with the Clinical Targets for Continuous Glucose Monitoring Data Interpretation [26] and are presented for Tuesday (control day), Wednesday (exercise day) and Thursday (24 to 48-h post-exercise). All variables were manually calculated for each participant by extracting raw data from the CareLink iPro software with the exception of glycemic variability indices (SD, CONGA1) that were analyzed using Excel Macro (Easy GV; version 9.0) developed by Rodbard [27].

2.7. Macronutrient Intakes

Dietary habits were assessed using a 3-day dietary record [28] on two non-consecutive weekdays and one weekend day before and after the 12-week intervention. Dietary habits were also recorded using a nutritional diary during the first and last week of the exercise training while the participants wore the CGM sensor. Total energy, carbohydrate, lipid, protein, and fibre intakes were estimated with the Nutrific software (Laval University, Sainte-Foy, QC, Canada). To facilitate the use of the food diary, participants received a food scale (5 kg) and appropriate explanation to fill in the journal adequately. Written explanation was available on the first page of the food diary as well as an example of a normal day of eating. Portion sizes could be written in kg, in mL or even in cups (or spoons) if applicable (e.g., for any liquid). Participants also had the phone number of the research team in case they had any questions.

2.8. Estimated Energy Expenditure and Physical Activity Levels

Resting metabolic rate (RMR), was estimated via indirect calorimetry in a supine position using a metabolic cart (CCM Express metabolic cart; Novus Medical Inc., Oakville, ON, Canada) for a 30-min period. Participants were in a fasted state for at least 12-h before the testing and were also instructed to avoid caffeine and alcohol consumption as well as moderate to vigorous physical activity during the evening before testing. The room temperature was controlled (21–23 °C), with dim lighting, and participants were instructed to relax and avoid any movement without falling asleep. Data from a steady state of 15 min (variation <10% of VO2 and <5% of respiratory quotient) were used to estimate RMR.
Despite estimating energy expenditure and caloric intake, the inherent complexity of energy balance and its effect on glucose regulation could bias how we interpret the CGM data. Therefore, the RMR of each participant was multiplied by a factor corresponding to the most appropriate physical activity levels (1.375; light exercise 1–3 days/week). Their estimated total caloric intake was then subtracted from total estimated energy expenditure. This allows us to have an approximation of energy balance: a positive value indicates a caloric surplus, and a negative value indicates a caloric deficit.
Energy expenditure was estimated using an accelerometer (Philips Respironics, Bend, OR, USA) before and after the intervention as well as during the first and last week of exercise in participants wearing the CGM device. The accelerometer was worn at waist level, at the left anterior axillary line, for 7 consecutive days, and was considered valid if they had at least 5 valid days out of 7. All data were collected in 15-s epoch length. The measure of energy expenditure using the Actical monitor was validated in an elderly population (≥65 years old; [29]). To confirm accelerometry data, a physical activity log [30] was also used during that time period. Finally, the participants also filled the Physical Activity Scale for the Elderly (PASE) questionnaire [31]. The PASE is a self-administered 7-day questionnaire that evaluates occupational, leisure and physical activity levels with scores ranging between 0 and 793, where a higher score indicates a higher level of activity.

2.9. Training Capillary Blood Glucose Levels before and after Exercise

Capillary glucose levels were measured before and after every exercise session. To ensure a proper measure, 70% isopropyl alcohol was used to clean the finger before each measurement. Accu-Chek® Safe-T-Pro Plus (Roche Diagnostic, Bâle, Switzerland) was used to puncture the side of the fingertip and the first drop of blood was removed. The second drop of blood was collected with a strip and glucose concentration was estimated with an Accu-Chek® Informe II (Roche Diagnostic, Bâle, Switzerland) glucometer.

2.10. Exercise Intervention

Three exercise sessions per week, on non-consecutive days, were performed on a treadmill (Life Fitness, Club Series, FlexDeck®; Rosemont, IL, USA) for 12 weeks, usually 1-h after breakfast. All training sessions were conducted under the supervision of an exercise physiologist at the Research Centre on Aging exercise training room, dedicated to research purposes only. Participants in the HIIT and the MICT group were trained separately in small group (maximum of 3 individuals trained at the same time) to avoid any contamination bias. The HIIT protocol was developed to be approximately 50% of the duration and total workload of MICT protocol. The treadmill was used instead of bicycle ergometer to favor recruitment and reduce the risk of drop out during the study because walking is the preferred physical activity of older adults [32]. The low-volume HIIT consisted of a 3-min warm-up (2 min at 55% HRR and 1 min at 75% HRR) followed by six 60-s intervals at 90% HRR with a 2-min active recovery at 45% HRR. A 2-min cooldown period at 40% HRR ended the training session, for a total of 25 min per session and 75 min per week. To achieve the prescribed intensity, a 4-week adaptation period was performed, leaving the participants in the HIIT group with 8 weeks of training at prescribed intensities (Supplementary material: Table S1). The MICT consisted of a 2-min warm-up at 45% HRR followed by 45 min at 60% HRR ending with a 3-min cooldown at 40% HRR. No adaptation period was required considering the training protocol was at moderate intensity. Speed (km/h) and grade (%) needed to achieve the prescribed intensity were determined using the trial-and-error method during the first exercise session and were adjusted if necessary. Participants in both groups received verbal encouragement throughout the exercise session. HR was measured during all training sessions using an HR monitor (Polar H7; Polar, Kempele, Finland) and recorded via the Polar Club app (Polar, Kempele, Finland) on an IPad (Apple, Cupertino, CA, USA).

2.11. Statistical Analysis

GPower V3.1 was used to calculate the sample size of our study (30 participants) to compare HIIT and MICT on A1c using the study by Mitranun and colleagues (2014) [33]. Considering that CGM measures were secondary analyses and measured to support the main outcome (A1c), no sample size was calculated. Based on the study of Terada et al. 2016 [34], it was expected that a large effect size (Cohen’s d = 0.90) would be detectable with this sample size. The normality of data was assessed with a combination of the Shapiro–Wilk test and visual evaluation of the quartile histograms and the Q-Q plots generated by these variables in both groups (HIIT and MICT). The comparison between groups at baseline was conducted with independent t-tests or Mann–Whitney U tests when data were not normally distributed. The same procedure was applied to examine if the CGM subsample was representative of the total sample (the CGM sample was excluded from the total sample to allow this comparison). The effect of the intervention and the interaction between groups were analysed with repeated measures ANOVA (2 groups × 2 measures). Partial eta-square (ηp2) are presented and the benchmarks suggested by Cohen (1969), defined as small (0.0099), medium (0.0588), and large (0.1379), were used. Mauchly’s test of sphericity was automatically respected because there are only two levels of comparison. The equality of variances was also verified with Levene’s test considering that the two groups have a different sample size (HIIT vs. MICT). For metabolic profile and CGM data, Wilcoxon signed-rank tests were performed as the data were not normally distributed even after different transformation procedures, and comparison of changes (delta) between groups were performed using Mann–Whitney U tests. For the Wilcoxon test, the effect size was calculated using the following formula (r = z/√N), where z represents the Wilcoxon test output and N the number of observation and was interpreted using Cohen’s d value [35,36]. Two-hour post-exercise CGM glucose well as pre- and post-exercise capillary glucose were analyzed using the linear mixed effects model, which uses pairwise deletion, in contrast to the repeated measure ANOVA, which uses listwise deletion. When a significant effect was detected, multiple pairwise comparisons were performed and then corrected with the False discovery rate procedure (FDR) [37]. All analyses were performed using SPSS IBM 22.0 with a per-protocol approach. The significance threshold was set at p ≤ 0.05 but the p-value was not solely interpreted in a dichotomous manner (significant or not), but rather as a continuous value [38]. Because some data were not normally distributed, they are presented as median (interquartile range), unless mentioned otherwise.

3. Results

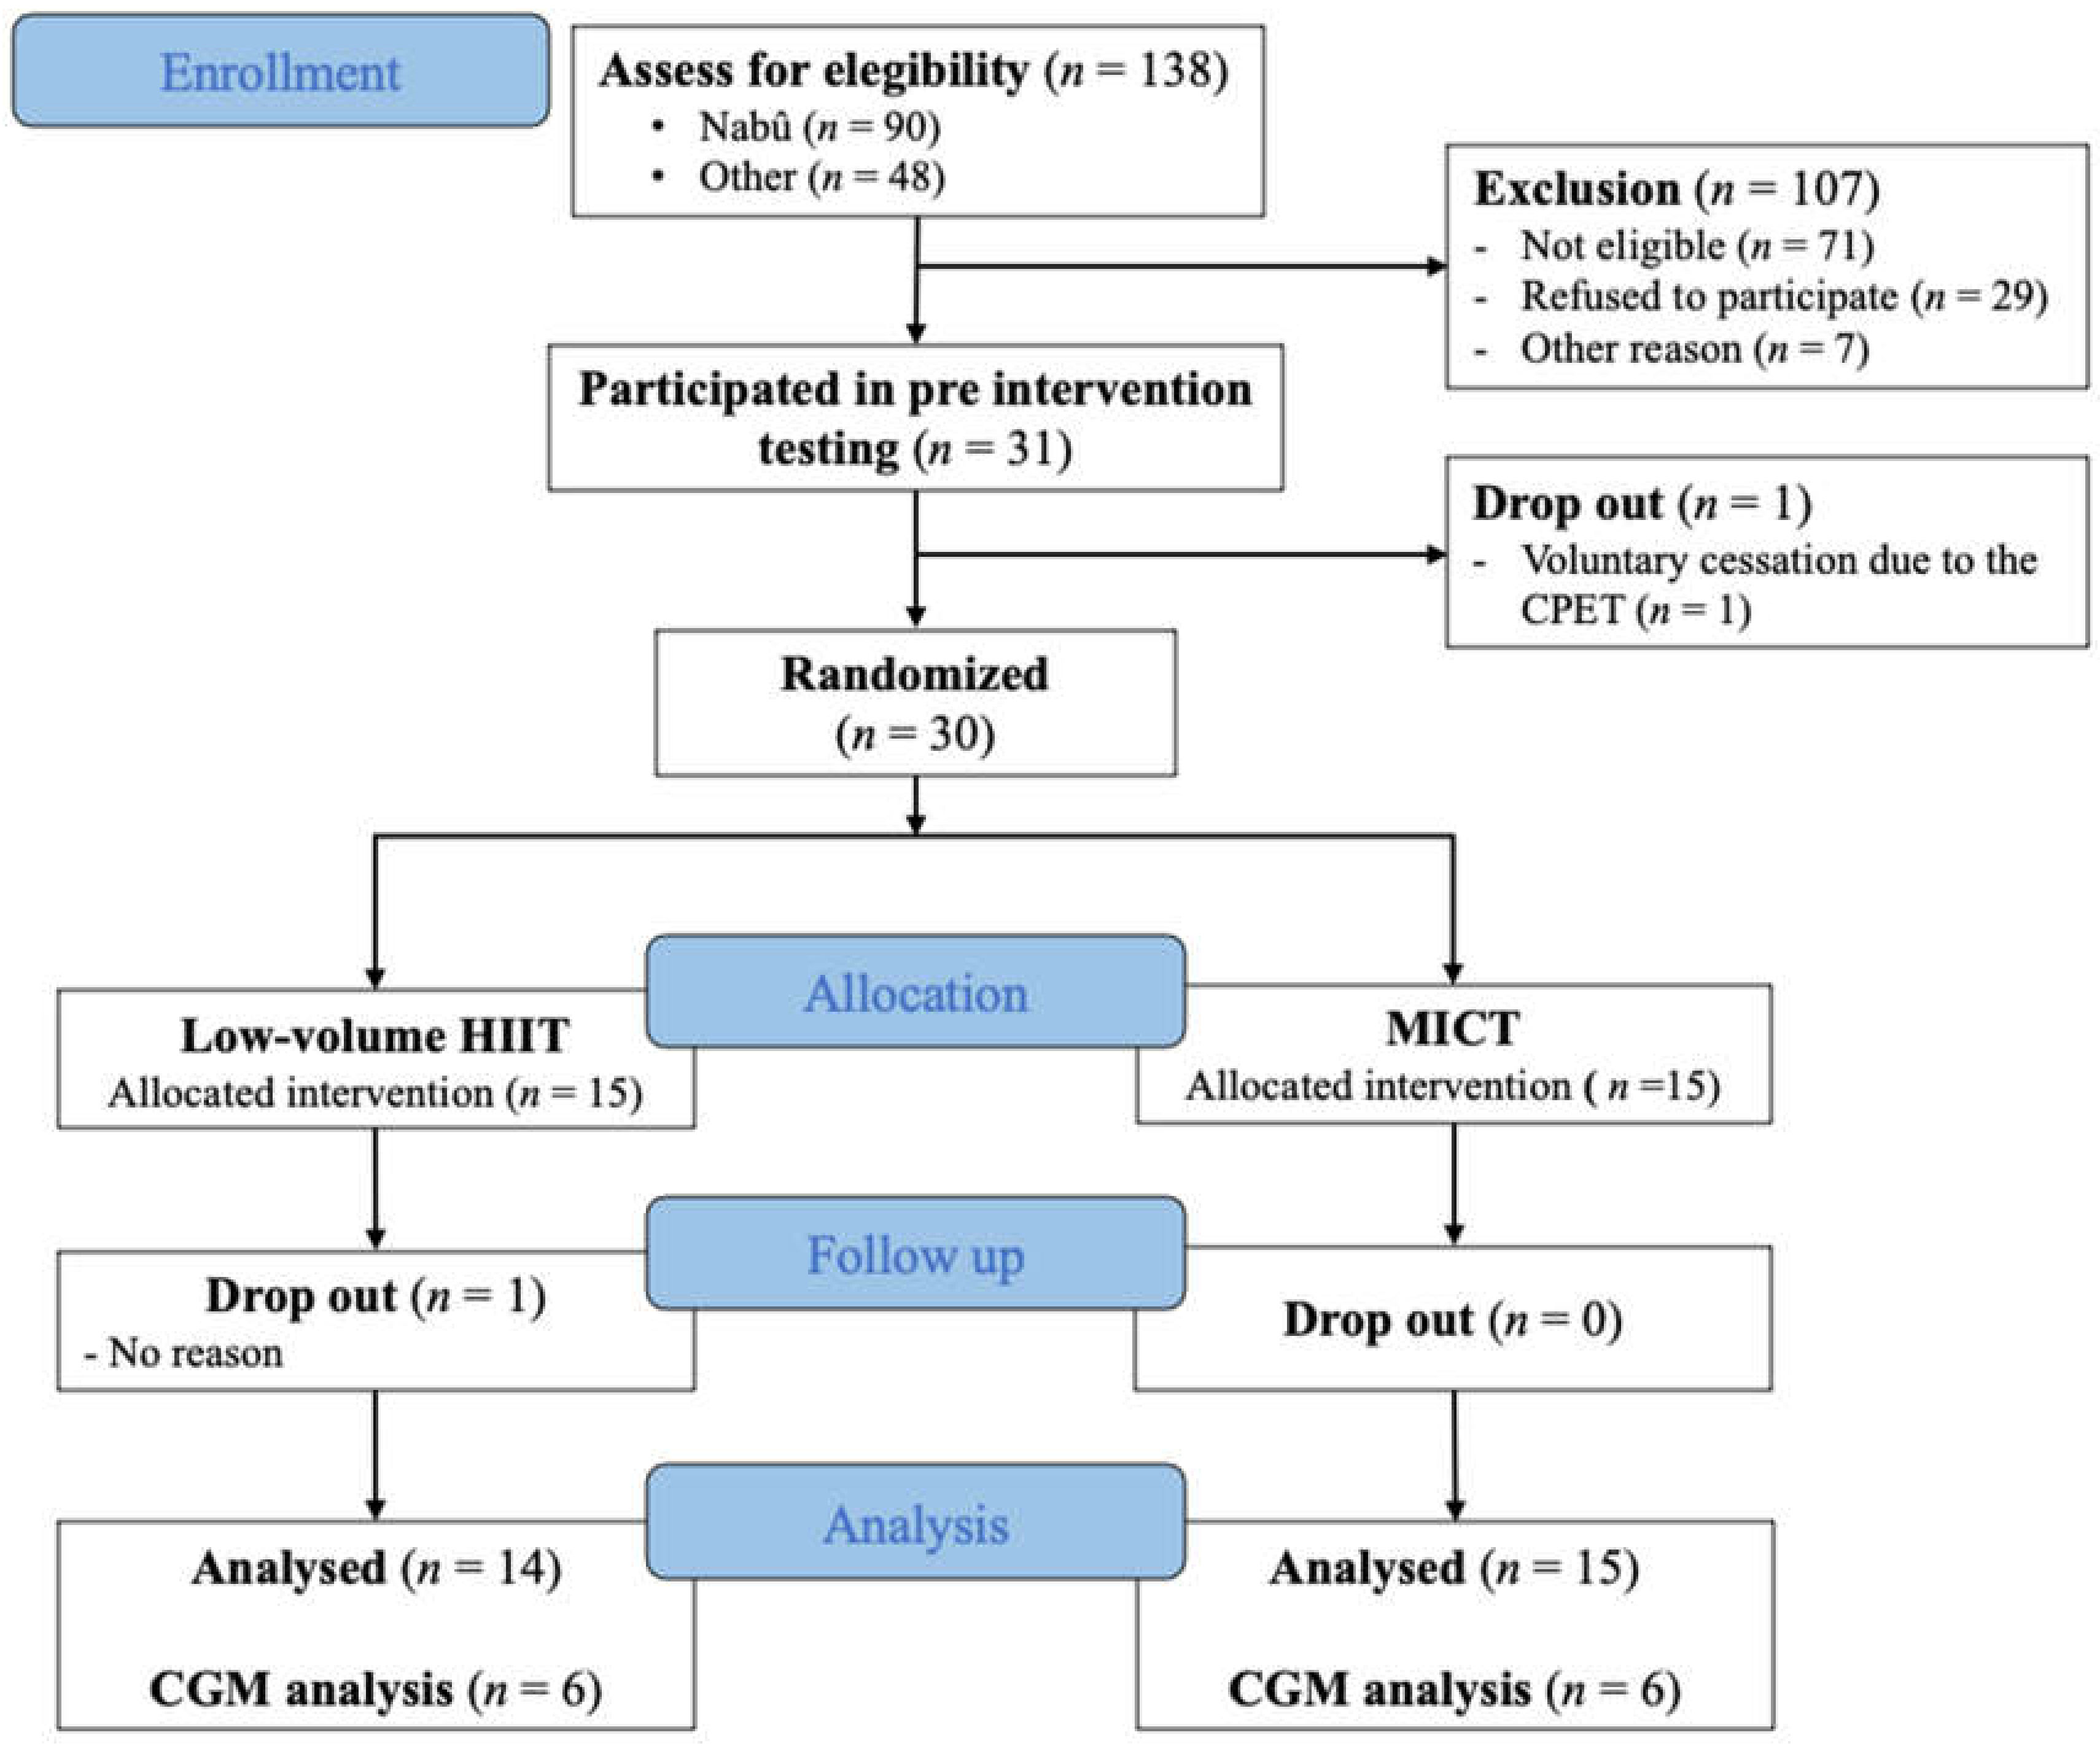
3.1. Recruitment and Participants Characteristics

Between January 2016 and September 2019, 138 participants were contacted and screened for eligibility. Of the 138 participants, 71 did not meet the inclusion criteria, 29 refused to participate and 7 were excluded for other reasons (living too far from the research center, taking care of a family member, etc.). Therefore, 31 participants were recruited, for whom baseline evaluations were performed. One woman dropped out before randomization because she did not want to perform the CPET, which left us with 30 participants. From the 30 women who were enrolled in this study (HIIT: n = 15 and MICT: n = 15), a subsample of 12 women wore a CGM device (HIIT: n = 6 and MICT: n = 6). One non-CGM participant from the HIIT group dropped out of the intervention after 4 weeks of training (unknown reason; Figure 1). One participant in the MICT group had poor glycemic control and her medication dose was increased at the eighth week of exercise intervention (adding 12.5 mg of Alogliptin; DPP4 inhibitor). However, excluding that participant from analyses did not change the direction nor the amplitude of the results.
At baseline, both groups had similar characteristics (all p > 0.05; Table 1). In the CGM subsample, while not significant, fasting glucose and A1c seems to be clinically higher in MICT compared to HIIT (p = 0.11 and p = 0.13, respectively). Participants had similar training attendance in HIIT and MICT (Mean ± SD: 91.3 ± 11.3% and 96.3 ± 4.7%, respectively). Exercise intensity during training from week 5 to 12 was 87.5 ± 13.0% HRR in the HIIT and 65.4 ± 9.4% HRR in the MICT group.

3.2. Metabolic Profile and Glycemic Control

The metabolic profile was similar between HIIT and MICT before the intervention (all p ≥ 0.36; Table 2). While fasting insulin and HOMA2-IR did not change (all p ≥ 0.12), A1c (p = 0.014; r = 0.45) and fasting glucose (p = 0.001; r = 0.59) decreased significantly in MICT only (HIIT: all p ≥ 0.37). Comparison of changes in both groups showed a difference for fasting glucose (p = 0.022) only.

3.3. Anthropometrics and Body Composition

Compared to baseline, total body weight (p = 0.025; ηp2 = 0.173) and total fat mass (p = 0.006; ηp2 = 0.256) significantly decreased, while appendicular lean body mass significantly increased (p = 0.035; ηp2 = 0.160) without any group interaction (Table 3). Visceral adipose tissue remained statistically unchanged (p = 0.299).

3.4. Acute Effect of Exercise on Continuous Glucose Monitoring

Figure 2 illustrates the acute effects of exercise up to 2 h after exercise. The linear mixed model shows a time effect (pre-exercise vs. post-exercise: p = 0.04), with no group effect (HIIT vs. MICT; p = 0.63), intervention effect (week 1 vs. week 12; p = 0.92), nor interaction (p = 0.51). Multiple pairwise comparisons with FDR correction revealed a significant effect when comparing pre- to post-exercise (p = 0.03), to 1 h (p = 0.02), and to 2 h (p = 0.02) glucose levels, with no difference between post-exercise glucose levels (immediately post exercise, 1-h and 2-h post-exercise).
As shown in Table 4, mean 24-h glucose levels did not significantly change after the exercise session in HIIT and MICT, as well as 48-h post-exercise compared to the control day at week 1 (p ≥ 0.25). During week 12, 24-h glucose (p = 0.03), time spent in mild hyperglycemia (p = 0.04) and peak glucose levels (p = 0.05) significantly decreased after a single session of HIIT, while no significant change was observed in MICT (all p ≥ 0.60). No episode of hypoglycemia was observed in the MICT group, while one woman had hypoglycemia the day after exercise at week 1 and week 12 in the HIIT group.

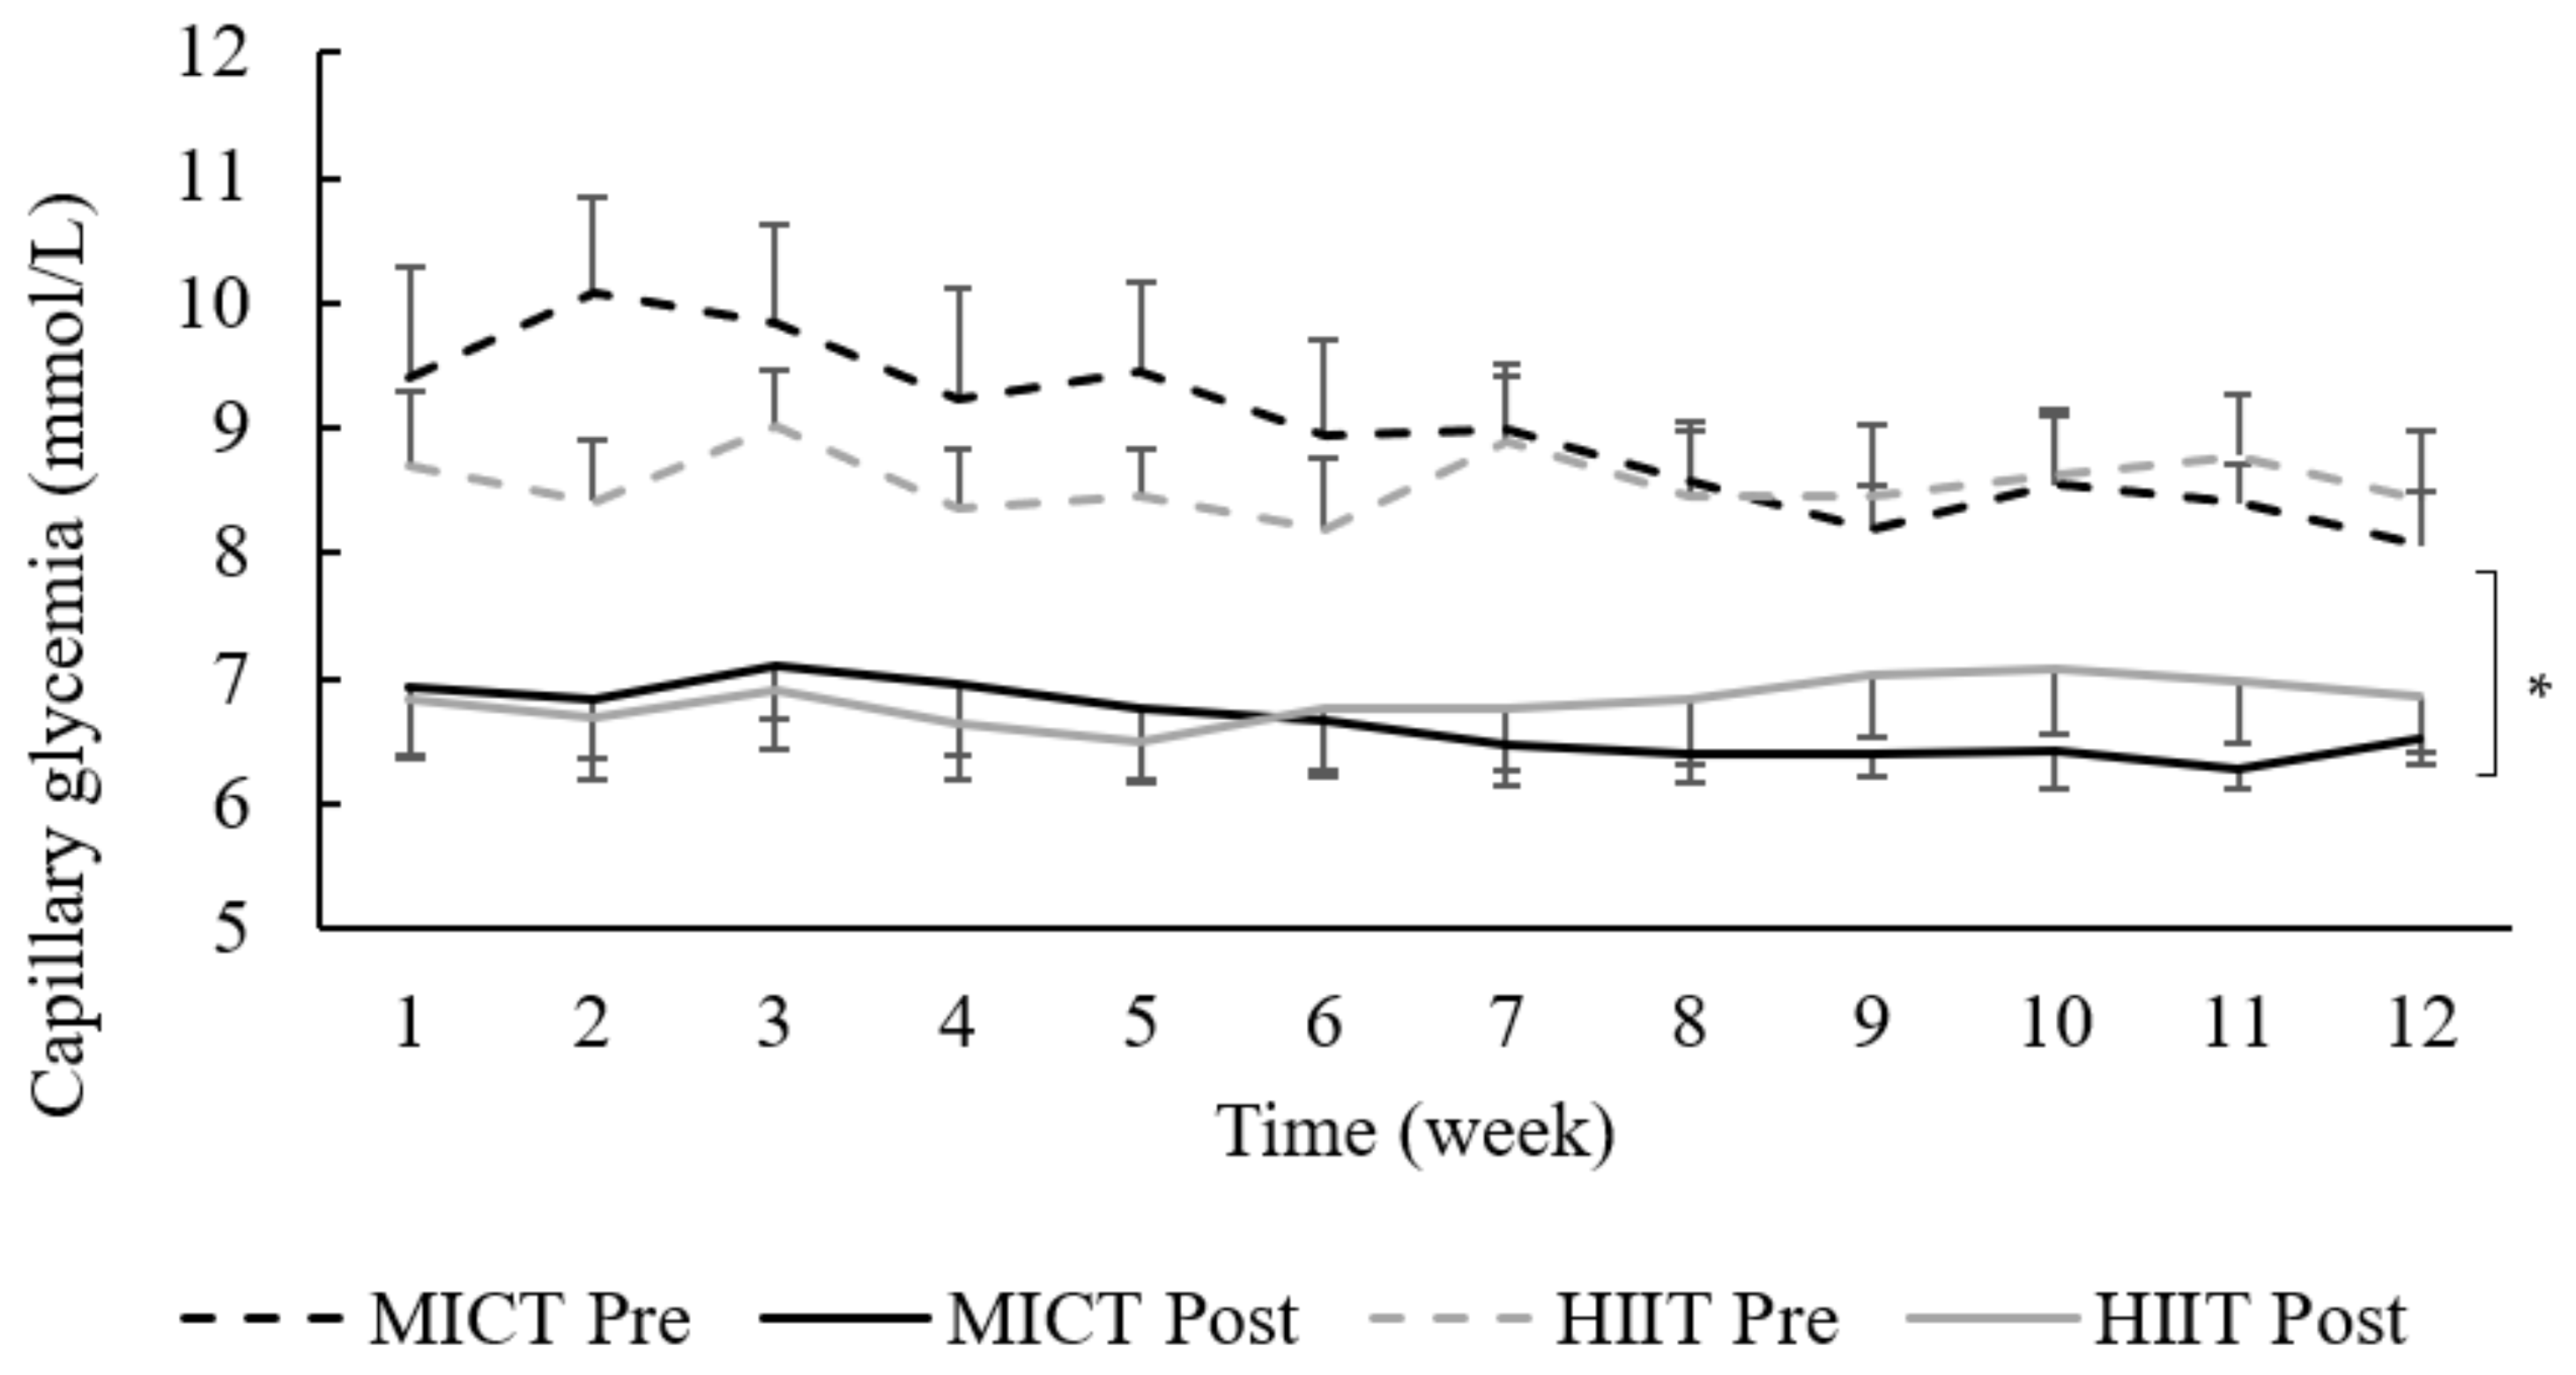
3.5. Capillary Glucose in Response to Exercise

The linear mixed model revealed an acute decrease in glucose levels after exercise (from 8.7 ± 1.9 mmol/L to 6.7 ± 1.4 mmol/L; p = 0.0001), without any group effect (HIIT vs. MICT; p = 0.40), intervention effect (week 1 to 12; p = 0.66), nor interaction (p = 0.96), as shown in Figure 3.

3.6. Energy Intake, Energy Expenditure, and Energy Balance

Neither total energy intake nor macronutrients changed after the intervention (p ≥ 0.26). Due to technical issues with the accelerometers (missing data, low battery, software errors, and an exporting error), data analyses were only performed in 15 participants (HIIT: n = 8; MICT: n = 7). Estimated energy expenditure did not significantly change from week 1 to week 12 (p = 0.09), with no difference between groups (p = 0.65). No significant change was observed for estimated energy balance (HIIT: 433 (−136–789) to 443 (−55–699) kcal; MICT:114 (−287–515) to 196 (26–327) kcal; p > 0.53). No difference was observed regarding the PASE score (HIIT: 103 (80–143) to 134 (92–159); MICT: 105 (53–160) to 103 (90–156); p > 0.45).

4. Discussion

The objective of this study was to compare a 12-week low-volume HIIT and MICT on glycemic control and body composition in older women with T2D. The main results showed that, while MICT provided greater benefits on fasting glucose levels compared to low-volume HIIT (Δ: −1.5 mmol/L, r = 0.59 vs. Δ: +0.1 mmol/L, r = 0.16), changes in body composition and A1c were not different between both exercise modalities. Interestingly, even if exercise-associated capillary glucose levels were not different between groups, CGM data showed that low-volume HIIT clinically decreased 24-h and peak glucose levels as well as time spent in mild hyperglycemia, even if women in the MICT had a poorer glycemic control.
Several factors could explain the different response between both exercise modalities. The low-volume HIIT protocol was developed to represent 50% of MICT total workload and time spent exercising. Because exercise duration was previously suggested as the primary factor that influences insulin sensitivity in sedentary obese individuals after a 6-month exercise intervention [39], a lower exercise duration may reduce the benefits on fasting glucose. Regarding A1c, a meta-analysis comparing workload-matched HIIT and MICT in T2D patients showed no difference between both exercise modalities [11], while others suggest that higher exercise intensity elicits greater favorable changes in A1c compared to lower intensity (reviewed in Liubaoerjijin et al. 2016; [14]). In the present study, the comparison of A1c changes did not show any differences between both groups, with a decrease of −0.20% (−0.60–0.00) in MICT and −0.15% (−0.30–0.15) in HIIT. It is interesting to note that only 50% of MICT duration and workload were sufficient to favor a real A1c decrease (i.e., greater than the laboratory A1c coefficient of variation). Although this result tends to support the greater chronic benefits of high intensity on glycemic control, we must acknowledge the fact that the decrease in HIIT was not significant. Contrary to the present study, another low-volume HIIT protocol performed on bicycle ergometer generated a statistically significant A1c reduction in low-volume HIIT (−0.1%), but no change in MICT (0.0%), after an 11-week intervention [40]. This discrepancy could partially be explained by the fact that compared to MICT, the HIIT workload was 36% lower in Winding et al. (2018), while, in the present study, it was 49% lower than MICT. In this context, the lower workload combined with lesser time exercising at higher intensity could explain the difference between the two types of HIIT protocol.
Fat mass loss (HIIT = −0.8 kg (−2.1–0.5); MICT = −1.1 kg (−2.5–−0.1)) and appendicular lean body mass increase (HIIT= +0.4 kg (−0.1–1.0); MICT= +0.1 kg (−0.1–0.8)) were not statistically different between groups. These results are in line with meta-analyses reporting similar effects of HIIT and MICT on body composition in overweight and obese adults [41,42]. Interestingly, a previous study conducted in our laboratory demonstrated that the same low- volume HIIT protocol (6 × 1 min at 90% HRR) does not improve body composition after an 8-week intervention in obese older women without T2D [43]. Despite participants in both studies having similar weight and total fat mass at baseline, changes were only observed in the present study with a longer intervention duration (12 vs. 8 weeks). This underlines the importance of study duration when evaluating body composition. Even if appendicular lean body mass was negatively associated with A1c at baseline (rho = −0.40, p = 0.039; data not shown), changes in appendicular lean body mass were not associated with changes in either A1c or fasting glucose. Therefore, low-volume HIIT could be a suitable and time-efficient exercise modality to induce fat mass loss in T2D older women.
The secondary objective of this study was to investigate the acute effect of an exercise session post-exercise glucose levels as well as 24-h glucose levels, GV, and time spent in hyperglycemia during free-living conditions. During the first week of training, neither HIIT nor MICT induced a reduction in CGM-derived data compared to a control day without exercise, despite the post-exercise reduction in capillary glucose, as well as the absence of change in caloric intake, macronutrient proportion, and accelerometer-derived energy expenditure. These results are in line with a previous study reporting no acute impact of moderate-intensity walking (50 min) on 24-h-glucose levels and time spent in hyperglycemia in older adults with T2D [44]. Many other CGM studies also reported no improvement regarding the time spent in hyperglycemia after a single session of HIIT or MICT [45,46,47,48]. In fact, Munan et al. demonstrated that 24-h-glucose levels did not significantly decrease after exercise when using free-living food intake (−0.2 mmol/L; p = 0.29) compared to interventions that provided meals (−0.5 mmol/L; p< 0.001); [49]). This suggests that conclusions arising from studies investigating the acute effect of exercise in free-living conditions may differ from those under more controlled dietary conditions. Nevertheless, compared to the control day (without exercise), 24-h-glucose and peak glucose levels as well as time spent in mild hyperglycemia were lower after one session of HIIT during the last week of training (week 12), while no effect was observed in MICT. The difference between the first and the last week of HIIT could be explained by training progression. Indeed, HIIT intervals were performed at 60% HRR during the first week of training (adaptation period) compared to 90% HRR during the last 8 weeks of training. These results are clinically relevant considering that chronic hyperglycemia is directly correlated with higher risk of cardiovascular outcomes, increasing the risk of premature mortality [19], even in the absence of T2D [50].
The acute effect of exercise on glucose in following hours was similar with both exercise modalities. In fact, as shown in Figure 2, HIIT and MICT both induced a reduction in 2-h post-exercise glucose levels. These results are interesting considering that hyperglycemia is usually most pronounced 1.5 to 2-h after breakfast in T2D individuals [51]. A study by Hanefeld et al. (1996) showed that post-breakfast blood glucose levels are associated with an increased risk of myocardial infarction and mortality compared to fasting blood glucose [52]. Therefore, a single session of HIIT or MICT after breakfast could reduce time spent in hyperglycemia during this specific period, which could ultimately lower the risk of cardiovascular events and the risk of premature mortality [49,53]. However, the timing of HIIT deserves to be better investigated, as recently suggested [49].
The results of the present study should be interpreted considering its limitations. The statistical power for this intervention was calculated based on Mitranun et al. (2014), using A1c as the primary outcome. Therefore, the data from the CGM subsample must be interpreted with caution considering that we may not be sufficiently powered for these CGM-derived outcomes. However, despite the GV and time spent in hyperglycemia were not the primary aim of this study, we believe these indices provided a broader understanding of how exercise modulates glycemic control. Furthermore, while some would view free-living food intake as a limitation in our study design, free-living condition studies ensures ecological validity, which is essential in clinical research to be able to generalize to real-life situation. This is also the main reason why a walking HIIT protocol was used, considering that walking is the favorite activity in the elderly population [32] and could later be transferred out of the research context. Finally, without a control group it is impossible to conclude in absolute certainty that the change observe during this intervention is due to the exercise session and not only by the intervention “per se”. These limitations are counterbalanced by several strengths. Indeed, to our knowledge, this is the first study to investigate, in the same design, the chronic (>12 weeks) and acute effects of exercise. It is also the first to investigate the effect of a low-volume HIIT intervention on CGM parameters in an elderly population at high risk of cardiovascular diseases. Knowing that the current population is aging, and that older adults have metabolic differences compared to younger individuals [54], it is crucial to investigate the effect of different exercise modalities on this growing segment of the population. Finally, exercise interventions reporting effects exclusively on women are scarce and, considering that exercise-related physiologic adaptations are sex-specific [55], such data are relevant in the context of precision medicine.

5. Conclusions

In the present study, MICT provides greater benefits in terms of fasting glucose compared to low-volume HIIT, while both modalities had similar effects on body composition and glucose control, indicating a promising time-efficient alternative for older women with T2D. While it remained to be investigated whether chronic adaptations occurred, HIIT acutely reduced 24-h-glucose and peak glucose levels as well as time spent in mild hyperglycemia compared to a day without exercise. Irrespective of the growing popularity of low-volume HIIT in the fitness industry and in the scientific community, more research is needed to better understand the potential effect of chronic HIIT-associated adaptations in free-living conditions, especially in the elderly population. This study suggests that with 50% less commitment, older women with T2D may still experience significant benefits from exercise when HIIT is performed under supervision.

Supplementary Materials

The following are available online at https://0-www-mdpi-com.brum.beds.ac.uk/article/10.3390/Obesities1020007/s1, Table S1: HIIT progression protocol from week 1 to 4.

Author Contributions

Conceptualization, I.J.D., M.B., P.B., N.G.B. and E.R.; methodology, I.J.D., N.G.B., P.B., M.-F.L., and E.R.; validation, A.M.-C., D.M.T., M.-M.M., P.B., M.B., J.A.M., I.J.D., M.-F.L., W.M.M., D.M.T., N.G.B., and E.R.; formal analysis, A.M.-C. and E.R.; data collection, A.M.-C., D.T., and M.-M.M.; resources, P.B., I.J.D., and E.R.; writing—original draft preparation, A.M.-C.; writing—review and editing, A.M.-C., D.T., M.-M.M., P.B., M.B., J.A.M., I.J.D., M.-F.L., W.M.M., D.M.T., N.G.B., and E.R.; visualization, A.M.-C., D.T., M.-M.M., P.B., M.B., J.A.M., I.J.D., M.-F.L., W.M.M., D.M.T., N.G.B., and E.R.; supervision, A.M.-C., E.R.; project administration, E.R.; funding acquisition, M.B., J.A.M., I.J.D., M.-F.L., P.B. and E.R. All authors have read and agreed to the published version of the manuscript.

Funding

This research was funded by the Quebec Network for Research on Aging and the Faculty of physical activity sciences of the University of Sherbrooke. I.J. Dionne is the holder of the Canada Research Chair in Exercise Recommendations for Healthy Aging. A. Marcotte-Chénard, D. Tremblay, and M-M. Mony are supported by Fonds de Recherche du Québec en Santé (FRQ-S).

Institutional Review Board Statement

The study was conducted according to the guidelines of the Declaration of Helsinki, and approved by the Ethics Committee of the CIUSSS de l’Estrie-CHUS (2016–574-IUGS; 05/11/2015).

Informed Consent Statement

Informed consent was obtained from all subjects involved in the study.

Data Availability Statement

The datasets generated and analysed during the current study are available from the corresponding author on reasonable request.

Acknowledgments

The authors are grateful to all women who participated in this study and would like to thank all the undergraduate and graduate students who helped in the realization of this research.

Conflicts of Interest

The authors declare no conflict of interest.

References

  1. Cho, N.H.; Shaw, J.E.; Karuranga, S.; Huang, Y.; da Rocha Fernandes, J.D.; Ohlrogge, A.W.; Malanda, B. IDF Diabetes Atlas: Global estimates of diabetes prevalence for 2017 and projections for 2045. Diabetes Res. Clin. Pract. 2018, 138, 271–281. [Google Scholar] [CrossRef] [PubMed]
  2. Mauvais-Jarvis, F. Gender differences in glucose homeostasis and diabetes. Physiol. Behav. 2018, 187, 20–23. [Google Scholar] [CrossRef] [PubMed]
  3. Wexler, D.J.; Grant, R.W.; Meigs, J.B.; Nathan, D.M.; Cagliero, E. Sex disparities in treatment of cardiac risk factors in patients with type 2 diabetes. Diabetes Care 2005, 28, 514–520. [Google Scholar] [CrossRef] [Green Version]
  4. Sigal, R.J.; Armstrong, M.J.; Bacon, S.L.; Boulé, N.G.; Dasgupta, K.; Kenny, G.P.; Riddell, M.C. Physical Activity and Diabetes. Can. J. Diabetes 2018, 42, S54–S63. [Google Scholar] [CrossRef] [Green Version]
  5. Association, A.D. Lifestyle management: Standards of medical care in Diabetesd. Diabetes Care 2018, 41, S38–S50. [Google Scholar] [CrossRef] [Green Version]
  6. Richter, E.A.; Hargreaves, M. Exercise, GLUT4, and skeletal muscle glucose uptake. Physiol. Rev. 2013, 93, 993–1017. [Google Scholar] [CrossRef] [Green Version]
  7. Holloszy, J.O.; Coyle, E.F. Adaptations of skeletal muscle to endurance exercise and their metabolic consequences. J. Appl. Physiol. Respir. Environ. Exerc. Physiol. 1984, 56, 831–838. [Google Scholar] [CrossRef]
  8. Pinkney, J.H.; Stehouwer, C.D.A.; Coppack, S.W.; Yudkin, J.S. Endothelial dysfunction: Cause of the insulin resistance syndrome. Diabetes 1997, 46, S9–S13. [Google Scholar] [CrossRef] [PubMed]
  9. Short, K.R.; Bigelow, M.L.; Kahl, J.; Singh, R.; Coenen-Schimke, J.; Raghavakaimal, S.; Nair, K.S. Decline in skeletal muscle mitochondrial function with aging in humans. Proc. Natl. Acad. Sci. USA 2005, 102, 5618–5623. [Google Scholar] [CrossRef] [Green Version]
  10. Jelleyman, C.; Yates, T.; O’Donovan, G.; Gray, L.J.; King, J.A.; Khunti, K.; Davies, M.J. The effects of high-intensity interval training on glucose regulation and insulin resistance: A meta-analysis. Obes. Rev. 2015, 16, 942–961. [Google Scholar] [CrossRef] [Green Version]
  11. De Nardi, A.T.; Tolves, T.; Lenzi, T.L.; Signori, L.U.; Silva, A.M.V. da High-intensity interval training versus continuous training on physiological and metabolic variables in prediabetes and type 2 diabetes: A meta-analysis. Diabetes Res. Clin. Pract. 2018, 137, 149–159. [Google Scholar] [CrossRef] [PubMed]
  12. Lora-Pozo, I.; Lucena-Anton, D.; Salazar, A.; Galán-Mercant, A.; Moral-Munoz, J.A. Anthropometric, Cardiopulmonary and Metabolic Benefits of the High-Intensity Interval Training Versus Moderate, Low-Intensity or Control for Type 2 Diabetes: Systematic Review and Meta-Analysis. Int. J. Environ. Res. Public Health 2019, 16, 4524. [Google Scholar] [CrossRef] [PubMed] [Green Version]
  13. Boulé, N.G.; Kenny, G.P.; Haddad, E.; Wells, G.A.; Sigal, R.J. Meta-analysis of the effect of structured exercise training on cardiorespiratory fitness in Type 2 diabetes mellitus. Diabetologia 2003, 46, 1071–1081. [Google Scholar]
  14. Liubaoerjijin, Y.; Terada, T.; Fletcher, K.; Boulé, N.G. Effect of aerobic exercise intensity on glycemic control in type 2 diabetes: A meta-analysis of head-to-head randomized trials. Acta Diabetol. 2016, 53, 769–781. [Google Scholar] [CrossRef] [PubMed]
  15. Leiter, L.A.; Ceriello, A.; Davidson, J.A.; Hanefeld, M.; Monnier, L.; Owens, D.R.; Tajima, N.; Tuomilehto, J. Postprandial glucose regulation: New data andnew implications. Clin. Ther. 2005, 27, S42–S56. [Google Scholar] [CrossRef] [PubMed]
  16. Nalysnyk, L.; Hernandez-Medina, M.; Krishnarajah, G. Glycaemic variability and complications in patients with diabetes mellitus: Evidence from a systematic review of the literature. Diabetes Obes. Metab. 2010, 12, 288–298. [Google Scholar] [CrossRef]
  17. Van Dijk, J.W.; Manders, R.J.F.; Tummers, K.; Bonomi, A.G.; Stehouwer, C.D.A.; Hartgens, F.; Van Loon, L.J.C. Both resistance- and endurance-type exercise reduce the prevalence of hyperglycaemia in individuals with impaired glucose tolerance and in insulin-treated and non-insulin-treated type 2 diabetic patients. Diabetologia 2012, 55, 1273–1282. [Google Scholar] [CrossRef] [Green Version]
  18. Karstoft, K.; Clark, M.A.; Jakobsen, I.; Müller, I.A.; Pedersen, B.K.; Solomon, T.P.J.; Ried-Larsen, M. The effects of 2 weeks of interval vs continuous walking training on glycaemic control and whole-body oxidative stress in individuals with type 2 diabetes: A controlled, randomised, crossover trial. Diabetologia 2017, 60, 508–517. [Google Scholar] [CrossRef] [PubMed]
  19. Stolar, M. Glycemic Control and Complications in Type 2 Diabetes Mellitus. Am. J. Med. 2010, 123, S3–S11. [Google Scholar] [CrossRef]
  20. Ross, R.; Aru, J.; Freeman, J.; Hudson, R.; Janssen, I. Abdominal adiposity and insulin resistance in obese men. Am. J. Physiol. Endocrinol. Metab. 2002, 282, 657–663. [Google Scholar] [CrossRef] [Green Version]
  21. Sievenpiper, J.L.; Chan, C.B.; Dworatzek, P.D.; Med, C.F.; Williams Med, S.L. 2018 Clinical Practice Guidelines Nutrition Therapy Diabetes Canada Clinical Practice Guidelines Expert Committee. Can. J. Diabetes 2018, 48, 896–902. [Google Scholar]
  22. Kaminsky, L.A.; Whaley, M.H. Evaluation of a New Standardized Ramp Protocol: The BSU/Bruc Ramp protocol. J. Cardiopulm. Rehabil. Prev. 1998, 18, 438–444. [Google Scholar] [CrossRef] [PubMed]
  23. Riebe, D.; Ehrman, J.K.; Liguori, G.; Magal, M. ACSM’s Guidelines for Exercise Testing and Prescription—American College of Sports Medicine, 10th ed.; Kluwer, W., Ed.; Lippincott Williams & Wilkins: Philadelphia, PA, USA, 2018. [Google Scholar]
  24. Higgins, P.B.; Comuzzie, A.G. Measures of waist circumference. In Handbook of Anthropometry: Physical Measures of Human Form in Health and Disease; Springer: New York, NY, USA, 2012; pp. 881–891. ISBN 9781441917881. [Google Scholar]
  25. Levy, J.C.; Matthews, D.R.; Hermans, M.E. Correct homeostasis model assessment (HOMA) evaluation uses the computer program. Diabetes Care. 1998, 21, 2191–2192. [Google Scholar] [CrossRef]
  26. Battelino, T.; Danne, T.; Bergenstal, R.M.; Amiel, S.A.; Beck, R.; Biester, T.; Bosi, E.; Buckingham, B.A.; Cefalu, W.T.; Close, K.L.; et al. Clinical targets for continuous glucose monitoring data interpretation: Recommendations from the international consensus on time in range. Diabetes Care 2019, 42, 1593–1603. [Google Scholar] [CrossRef] [Green Version]
  27. Rodbard, D. Display of glucose distributions by date, time of day, and day of week: New and improved methods. J. Diabetes Sci. Technol. 2009, 3, 1388–1394. [Google Scholar] [CrossRef] [Green Version]
  28. Lührmann, P.M.; Herbert, B.M.; Gaster, C.; Neuhäuser-Berthold, M. Validation of a Self-Administered 3-Day Estimated Dietary Record for Use in the Elderly. Eur. J. Nutr. 1999, 38, 235–240. [Google Scholar] [PubMed]
  29. Hooker, S.P.; Feeney, A.; Hutto, B.; Pfeiffer, K.A.; McIver, K.; Heil, D.P.; Vena, J.E.; LaMonte, M.J.; Blair, S.N. Validation of the actical activity monitor in middle-aged and older adults. J. Phys. Act. Health 2011, 8, 372–381. [Google Scholar] [CrossRef] [Green Version]
  30. Bouchard, C.; Tremblay, A.; Leblanc, C.; Lortie, G.; Savard, R.; Thériault, G. A method to assess energy expenditure in children and adults. Am. J. Clin. Nutr. 1983, 37, 461–467. [Google Scholar] [CrossRef]
  31. Washburn, R.A.; Smith, K.W.; Jette, A.M.; Janney, C.A. The physical activity scale for the elderly (PASE): Development and evaluation. J. Clin. Epidemiol. 1993, 46, 153–162. [Google Scholar] [CrossRef]
  32. Szanton, S.L.; Walker, R.K.; Roberts, L.; Thorpe, R.J.; Wolff, J.; Agree, E.; Roth, D.L.; Gitlin, L.N.; Seplaki, C. Older adults’ favorite activities are resoundingly active: Findings from the NHATS study. Geriatr. Nurs. 2015, 36, 131–135. [Google Scholar] [CrossRef] [Green Version]
  33. Mitranun, W.; Deerochanawong, C.; Tanaka, H.; Suksom, D. Continuous vs interval training on glycemic control and macro- and microvascular reactivity in type 2 diabetic patients. Scand. J. Med. Sci. Sports 2014, 24, e69–e76. [Google Scholar] [CrossRef]
  34. Terada, T.; Wilson, B.J.; Myette-Cóté, E.; Kuzik, N.; Bell, G.J.; McCargar, L.J.; Boulé, N.G. Targeting specific interstitial glycemic parameters with high-intensity interval exercise and fasted-state exercise in type 2 diabetes. Metabolism 2016, 65, 599–608. [Google Scholar] [CrossRef] [PubMed]
  35. Rosethal, R.; Cooper, H.; Hedges, L. Parametric measures of effect size. The Handbook of Research Synthesis 1994, 621, 232–244. [Google Scholar]
  36. Cohen, J. Statistical Power Analysis for the Behavioral Sciences. Academic press 2013. [Google Scholar]
  37. Curran-Everett, D. Multiple comparisons: Philosophies and illustrations. Am. J. Physiol. Regul. Integr. Comp. Physiol. 2000, 279, R1–R8. [Google Scholar] [CrossRef]
  38. Wasserstein, R.L.; Schirm, A.L.; Lazar, N.A. Moving to a World Beyond “p < 0.05”. Am. Stat. 2019, 73, 1–19. [Google Scholar]
  39. Houmard, J.A.; Tanner, C.J.; Slentz, C.A.; Duscha, B.D.; McCartney, J.S.; Kraus, W.E. Effect of the volume and intensity of exercise training on insulin sensitivity. J. Appl. Physiol. 2004, 96, 101–106. [Google Scholar] [CrossRef] [PubMed] [Green Version]
  40. Winding, K.M.; Munch, G.W.; Iepsen, U.W.; Van Hall, G.; Pedersen, B.K.; Mortensen, S.P. The effect on glycaemic control of low-volume high-intensity interval training versus endurance training in individuals with type 2 diabetes. Diabetes Obes. Metab. 2018, 20, 1131–1139. [Google Scholar] [CrossRef] [PubMed] [Green Version]
  41. Wewege, M.; van den Berg, R.; Ward, R.E.; Keech, A. The effects of high-intensity interval training vs. moderate-intensity continuous training on body composition in overweight and obese adults: A systematic review and meta-analysis. Obes. Rev. 2017, 18, 635–646. [Google Scholar] [CrossRef]
  42. Maillard, F.; Pereira, B.; Boisseau, N. Effect of High-Intensity Interval Training on Total, Abdominal and Visceral Fat Mass: A Meta-Analysis. Sport. Med. 2018, 48, 269–288. [Google Scholar] [CrossRef]
  43. Boukabous, I.; Marcotte-Chénard, A.; Amamou, T.; Boulay, P.; Brochu, M.; Tessier, D.; Dionne, I.; Riesco, E. Low-volume high-intensity interval training versus moderate-intensity continuous training on body composition, cardiometabolic profile, and physical capacity in older women. J. Aging Phys. Act. 2019, 27, 879–889. [Google Scholar] [CrossRef] [PubMed]
  44. Rees, J.L.; Chang, C.R.; François, M.E.; Marcotte-Chénard, A.; Fontvieille, A.; Klaprat, N.D.; Dyck, R.A.; Funk, D.R.; Snydmiller, G.; Bastell, K.; et al. Minimal effect of walking before dinner on glycemic responses in type 2 diabetes: Outcomes from the multi-site E-PAraDiGM study. Acta Diabetol. 2019, 56, 755–765. [Google Scholar] [CrossRef] [PubMed]
  45. Haxhi, J.; Leto, G.; Palumbo, A.; Sbriccoli, P.; Guidetti, L.; Fantini, C.; Buzzetti, R.; Caporossi, D.; Luigi, L.; Sacchetti, M.; et al. Exercise at lunchtime: Effect on glycemic control and oxidative stress in middle-aged men with type 2 diabetes. Eur. J. Appl. Physiol. 2016, 116, 573–582. [Google Scholar] [CrossRef]
  46. Karstoft, K.; Christensen, C.S.; Pedersen, B.K.; Solomon, T.P.J. The acute effects of interval- Vs continuous-walking exercise on glycemic control in subjects with type 2 diabetes: A crossover, controlled study. J. Clin. Endocrinol. Metab. 2014, 99, 3334–3342. [Google Scholar] [CrossRef] [PubMed] [Green Version]
  47. Godkin, F.E.; Jenkins, E.M.; Little, J.P.; Nazarali, Z.; Percival, M.E.; Gibala, M.J. The effect of brief intermittent stair climbing on glycemic control in people with type 2 diabetes: A pilot study. Appl. Physiol. Nutr. Metab. 2018, 43, 969–972. [Google Scholar] [CrossRef] [PubMed]
  48. Figueira, F.R.; Umpierre, D.; Casali, K.R.; Tetelbom, P.S.; Henn, N.T.; Ribeiro, J.P.; Schaan, B.D. Aerobic and combined exercise sessions reduce glucose variability in type 2 diabetes: Crossover randomized trial. PLoS ONE 2013, 8, e57733. [Google Scholar] [CrossRef]
  49. Munan, M.; Oliveira, C.L.P.; Marcotte-Chénard, A.; Rees, J.L.; Prado, C.M.; Riesco, E.; Boulé, N.G. Acute and Chronic Effects of Exercise on Continuous Glucose Monitoring Outcomes in Type 2 Diabetes: A Meta-Analysis. Front. Endocrinol. 2020, 11, 495. [Google Scholar] [CrossRef] [PubMed]
  50. Merino, J.; Leong, A.; Posner, D.C.; Porneala, B.; Masana, L.; Dupuis, J.; Florez, J.C. Genetically driven hyperglycemia increases risk of coronary artery disease separately from type 2 diabetes. Diabetes Care. 2017, 40, 687–693. [Google Scholar] [CrossRef] [Green Version]
  51. Monnier, L.; Colette, C.; Rabasa-Lhoret, R.; Lapinski, H.; Caubel, C.; Avignon, A.; Boniface, H. Morning hyperglycemic excursions: A constant failure in the metabolic control of non-insulin-using patients with type 2 diabetes. Diabetes Care. 2002, 25, 737–741. [Google Scholar] [CrossRef] [Green Version]
  52. Hanefeld, M.; Fischer, S.; Julius, U.; Schulze, J.; Schwanebeck, U.; Schmechel, H.; Ziegelasch, H.J.; Lindner, J. Risk factors for myocardial infarction and death in newly detected NIDDM: The Diabetes Intervention Study, 11-year follow-up. Diabetologia 1996, 39, 1577–1583. [Google Scholar] [CrossRef]
  53. Sievers, M.L.; Bennett, P.H.; Nelson, R.G. Effect of glycemia on mortality in Pima Indians with type 2 diabetes. Diabetes 1999, 48, 896–902. [Google Scholar] [CrossRef] [PubMed]
  54. Ottinger, M.A. A Comparative Approach to Metabolic Aspects of Aging: Conserved Mechanisms and Effects of Calorie Restriction and Environment. Prog. Mol. Biol. Transl. Sci. 2018, 155, 109–127. [Google Scholar] [PubMed]
  55. Gibala, M.J.; Gillen, J.B.; Percival, M.E. Physiological and Health-Related Adaptations to Low-Volume Interval Training: Influences of Nutrition and Sex. Sport. Med. 2014, 44, 127–137. [Google Scholar] [CrossRef] [PubMed] [Green Version]
Figure 1. Flow chart diagram. Flow diagram of participants through all steps of the study; HIIT= high-intensity interval training; MICT= moderate-intensity continuous training; CGM = Continuous glucose monitoring.
Obesities 01 00007 g001
Figure 2. Two-hour effect of exercise on CGM-derived glucose levels. Data are presented as mean ± SEM. HIIT and MICT data are provided to show the absence of difference between groups regarding the acute effect of exercise. Three individuals in the MICT group ate between the 1 h and 2 h post-exercise at week 12. * p < 0.03: significantly different from pre-exercise glucose levels.
Obesities 01 00007 g002
Figure 3. Capillary glucose levels at each week. Data are presented as mean ± SEM; HIIT = high-intensity interval training; MICT = moderate-intensity continuous training; each data point represents the weekly mean capillary glycose of 3 exercise sessions (Monday, Wednesday and Friday). * p = 0.0001: significant acute effect of exercise (pre- vs. post-exercise sessions).
Obesities 01 00007 g003
Table 1. Participants’ baseline characteristics for total sample and CGM subsample.
VariablesTotal SampleCGM Sample
HIIT (n = 14)MICT (n = 15)HIIT (n = 6)MICT (n = 6)
Age (years)67.1 (63.0–70.6)68.1 (64.1–70.4)66.2 (63.0–70.3)63.9 (62.55–69.55)
Duration of T2D (years)10.0 (5.1–15.1)10.0 (3.5–12.0)7.5 (2.4–17.5)10.0 (3.0–11.5)
BMI (kg/m2)31.4 (28.0–37.0)32.4 (27.9–40.2)31.2 (28.2–44.5)35.0 (28.0–44.0)
Waist circumference (cm)105.3 (99.3–109.9)109.8 (96.4–119.3)99.1 (91.7–120.1)109.7 (98.5–122.5)
Fasting glucose (mmol/L)6.8 (5.9–8.0)8.2 (5.9–9.3)6.7 (5.7–7.7)8.8 (7.5–11.9)
A1c (%)6.5 (6.1–7.2)6.9 (6.4–7.5) †6.3 (5.9–7.7)7.5 (6.9–8.2) †
Systolic BP (mmHg)128 (114–134)130 (123–136)122 (114–139)125 (111–144)
Diastolic BP (mmHg)77 (71–78)78 (73–82)77 (74–79)80 (74–83)
VO2 peak (mL/kg/min)18.0 (15.5–20.6)17.8 (15.5–21.2)20.6 (15.3–21.8)16.9 (13.1–22.0)
Medication5.5 (4.0–8.5)6.0 (4.0–7.0)6.5 (4.0–9.8)6.5 (4.0–7.25)
Glucose lowering medication (n (%))
Metformin10 (71)10 (67)4 (66)4 (66)
Sulfonylurea2 (14)4 (27)1 (17)2 (33)
DPP-4 inhibitor6 (43)6 (40)2 (33)3 (50)
SGLT2 inhibitor2 (14)1 (7)0 (0)1 (17)
Thiazolidinediones1 (7)0 (0)0 (0)0 (0)
Hypotensive medication n (%)
Calcium channel blocker2 (14)4 (27)2 (33)2 (33)
ACE inhibitor11 (79)13 (87)5 (83)6 (100)
Diuretic7 (47)6 (43)4 (67)3 (50)
Beta blocker4 (29)2 (13)3 (50)2 (33)
Lipid lowering medication n (%)
Statin12 (86)10 (67)4 (66)5 (83)
Data are presented as median (interquartile range) and n (%) for the medication. HIIT = high-intensity interval training; MICT = moderate-intensity continuous training; BMI = body mass index; HIIT = high intensity interval training; MICT = moderate intensity continuous training; A1c = glycated hemoglobin; BP = blood pressure. No difference between HIIT and MICT in parametric and non-parametric procedures in the total sample, and no difference in CGM sample. † significant difference between MICT total sample vs. MICT CGM sample for A1c (p = 0.02).
Table 2. Metabolic profile before and after both exercise intervention.
Variables BeforeAfterTime Effect
p-value
Effect Size
(r)
A1c (%)HIIT6.5 (6.0–7.5)6.3 (5.8–7.4)0.4110.15
MICT7.0 (6.4–7.5)6.7 (5.9–7.2)0.0140.45
Fasting glucose (mmol/L)HIIT7.0 (5.8–8.2)7.1 (5.5–7.7)0.3730.16
MICT8.2 (5.9–9.5)6.7 (5.0–8.2)0.0010.59
Fasting insulin (pmol/L)HIIT81.0 (46.0–176.5)62.0 (43.5–197.5)0.3280.18
MICT95.0 (68.0–139.5)67.0 (47.5–116.0)0.1160.29
HOMA2-IRHIIT1.54 (0.91–1.96)1.28 (0.91–3.91)0.6950.07
MICT1.98 (1.21–2.37)1.40 (1.12–2.27)0.1160.29
Data are presented as median (interquartile range). HIIT= high-intensity interval training; MICT= moderate-intensity continuous training; A1c = glycated hemoglobin; HOMA2 = Homeostasis model assessment of insulin resistance 2; The pre-intervention values were removed if its counterpart in post-intervention were missing to allow statistical comparison (MICT n = 13; HIIT n = 12); Bold values denotes significant p-value.
Table 3. Body composition in response to the 12-week exercise intervention.
Variables BeforeAfterp-value
Time
p-value
Time x Group
Weight (kg)HIIT78.7 (69.4–90.7)74.9 (70.2–90.5)0.0250.403
MICT77.1 (66.2–97.5)74.8 (65.5–94.8)
BMI (kg/m2)HIIT31.4 (28.0–37.0)30.6 (27.5–36.9)0.0570.263
MICT32.4 (27.9–40.2)29.7 (27.7–39.7)
WC (cm)HIIT105.3 (99.3–109.9)101.0 (97.9–109.1)0.1500.431
MICT109.8 (96.4–119.3)109.5 (96.8–122.0)
Total FM (kg)HIIT32.1 (26.9–42.3)29.4 (26.1–41.0)0.0070.799
MICT33.6 (26.4–43.6)31.6 (26.2–44.0)
Visceral FM (kg)HIIT1.66 (1.38–2.04)1.49 (1.07–1.96)0.2990.686
MICT1.77 (1.42–2.29)1.55 (1.38–2.39)
Total LBM (kg)HIIT42.6 (38.0–45.2)42.4 (38.9–44.7)0.7560.886
MICT41.0 (36.6–45.2)41.3 (36.7–46.0)
App. LBM (kg)HIIT19.9 (18.1–21.3)20.0 (18.0–21.1)0.0350.510
MICT18.8 (16.4–21.4)19.1 (17.0–21.4)
Data are presented as median (interquartile range); BMI: body mass index; WC: waist circumference; FM = fat mass; LBM = Lean body mass; App. = Appendicular; Bold values denotes significant p-value.
Table 4. Acute effects of HIIT and MICT on CGM-derived parameters.
Week 1Week 12
MICTHIITMICTHIIT
Mean 24-h glucose (mmol/L)CONT (Day 1)8.7 (6.9–10.3)6.7 (6.2–9.2)8.1 (7.2–8.7)6.7 (6.4–11.2)
EX (Day 2)8.4 (7.4–9.5)6.6 (5.7–8.9)8.3 (7.2–9.0)6.6 (5.6–10.8) *
Post-EX (Day 3)8.6 (6.9–9.1)7.1 (5.3–9.3)8.4 (7.5–8.5)7.5 (5.8–11.5)
Peak glucose (mmol/L)CONT (Day 1)12.4 (9.7–15.9)9.6 (8.6–14.0)11.5 (9.6–12.6)9.8 (8.9–16.4)
EX (Day 2)11.6 (9.8–14.6)9.1 (8.3–14.1)11.3 (10.3–12.6)9.3 (7.9–16.1) *
Post-EX (Day 3)12.9 (10.5–14.1)10.3 (9.9–14.5)11.4 (10.0–11.9)10.0 (8.6–16.9)
Mild-Hyperglycemia
(> 8.3 mmol/L; min)
CONT (Day 1)813 (204–1237)143 (19–776)548 (244–749)125 (54–1432)
EX (Day 2)577 (368–980)68 (19–591)623 (325–859)70 (28–1168) *
Post-EX (Day 3)640 (187–911)490 (65–963)580 (394–859)305 (25–1358)
Hyperglycemia
(>10 mmol/L; min)
CONT (Day 1)225 (0–670)25 (0–545)160 (0–289)0 (0–1036)
EX (Day 2)170 (4–520)0 (0–428)173 (39–494)0 (0–888)
Post-EX (Day 3)235 (41–346)23 (0–441)95 (45–178)10 (0–973)
SD
(mmol/L)
CONT (Day 1)1.31 (0.98–2.08)1.16 (0.71–1.84)1.21 (0.79–1.77)1.07 (0.71–1.51)
EX (Day 2)1.31 (0.99–2.06)0.81 (0.57–1.76)1.39 (1.12–1.88)1.58 (0.78–2.51)
Post-EX (Day 3)1.35 (1.17–1.63)1.35 (0.93–1.93)1.05 (0.95–1.44)0.94 (0.75–2.14)
CONGA1
(mmol/L)
CONT (Day 1)8.02 (6.25–9.31)6.06 (5.41–8.81)7.50 (6.53–7.90)6.20 (5.88–10.16)
EX (Day 2)7.70 (6.66–8.81)6.18 (5.34–8.16)7.72 (6.70–8.18)6.14 (5.13–9.85)
Post-EX (Day 3)7.81 (6.17–8.20)6.50 (4.46–8.43)7.39 (6.69–7.55)6.79 (5.30–10.72)
Data are presented as median (interquartile range); SD = Standard deviation of glycemic variability; CONGA 1 = Continuous Overall Net Glycemic Action (1 h); CONT = Control day; EX = Exercise day; Post-EX = 48-h post-exercise. * p ≤ 0.05: significant difference between Control day and Exercise day; Bold values denotes significant p-value.
Publisher’s Note: MDPI stays neutral with regard to jurisdictional claims in published maps and institutional affiliations.

