
Physical and Biodegradation Properties of Graphene Derivatives/Thermoplastic Starch Composites


Programa de Pós-Graduação em Ciência de Alimentos, Instituto de Química, Universidade Federal do Rio de Janeiro, Avenida Moniz Aragão 360, Rio de Janeiro 21941-594, Brazil
*
Authors to whom correspondence should be addressed.
Polysaccharides 2021, 2(3), 582-593; https://0-doi-org.brum.beds.ac.uk/10.3390/polysaccharides2030035
Submission received: 1 June 2021
/
Revised: 25 June 2021
/
Accepted: 1 July 2021
/
Published: 6 July 2021
(This article belongs to the Special Issue Eco-friendly/Sustainable Approach to Polysaccharides as (nano) materials)
Abstract
:Development of biodegradable materials for packaging is an issue of the utmost importance. These materials are an alternative to petroleum-based polymers, which contribute to environment pollution after disposal. In this work, graphene oxide (GO) and glucose-reduced graphene oxide (rGO-g) were incorporated to thermoplastic starch (TPS) by melt extrusion. The TPS/GO and TPS/rGO-g composites had their physical properties and biodegradability compared. X-ray diffraction (XRD) showed that the type of graphene used led to different dispersion levels of graphene sheets, and to changes in the crystalline structure of TPS. Tensile tests carried out for the compression-molded composites indicated that TPS/rGO-g composites presented better mechanical performance. The Young’s modulus (E) increased from E = (28.6 ± 2.7) MPa, for TPS, to E = (110.6 ± 9.5) MPa and to (144.2 ± 11.2) MPa for TPS with rGO-g incorporated at 1.0 and 2.0 mass% content, respectively. The acid groups from graphene derivatives promoted glycosidic bond breakage of starch molecules and improved biodegradation of the composites. GO is well-dispersed in the TPS matrix, which contributes to biodegradation. For TPS/rGO-g materials, biodegradation was influenced by rGO-g dispersion level.

1. Introduction
Petroleum-based plastics are inexpensive, durable and lightweight materials, present in our daily lives. Concern on environmental pollution caused by plastic waste has motivated the development of environmentally friendly materials, which are mainly used as packaging [1]. In general, discarded plastics break down into smaller fragments, leading to microplastics. Microplastics are small pieces of synthetic materials, less than 5 mm in length, which have increasingly been found in the environment [1,2].
Starch-based plastics have emerged because of their relatively low cost, renewability and biodegradability in most environments [3,4]. Starch consists of two polysaccharides, amylose and amylopectin, both formed by d-glucose repeating units. To obtain thermoplastic starch (TPS), granular starch should be processed in the presence of plasticizers, such as water and polyols [5,6]. However, TPS has limited applications. This is because of its high hydrophilicity, which results in poor mechanical properties as it ages [7]. To solve this drawback, blending TPS with less hydrophilic polymers, or incorporating inorganic nanoparticles, has been addressed as alternatives to improve its physical properties [5,8]. Furthermore, the thermoformability and mechanical properties of TPS composites have been studied aiming to produce competitive biodegradable plastics for industrial scale manufacturing [9,10].
Graphene is the two-dimensional sheet-like material, consisting of sp2-hybridized carbon atoms. Graphene has attracted attention as a polymer nanofiller because of its high thermal, mechanical and conductive properties [11,12]. Graphene may be prepared in large scale from graphite, in two steps. In the first step, using oxidizing reagents, graphene oxide (GO) is obtained. GO is characterized by its hydrophilicity, resulting from the presence of alcohol, epoxide and carboxylic acid groups on its surface [13]. The second step consists of a reduction reaction, usually with hydrazine or sodium borohydride, which leads to reduced graphene oxide (rGO) [14,15]. The use of green approaches, to the large-scale production of rGO has been highlighted. For example, ascorbic acid was found suitable to reduce GO [16]. A facile nontoxic method to obtain rGO is based on reducing sugars and exfoliated GO [17,18].
Composites of starch and graphene derivatives have been developed and presented improvements in mechanical [7,19] and thermal [19,20] properties, as well as enhancements in electrical conductivity [20,21]. Favorable interactions and exfoliation of graphene sheets in the starch matrix explain these results. In general, solution casting is the methodology most frequently cited for the preparation of starch/graphene composites [19,20,21]. However, studies on more convenient methods to be applied in industrial processes, such as melt mixing [19] and extrusion [7], have shown that it is possible to obtain TPS/GO composites with well-dispersed graphene nanosheets.
Biodegradable polymers may be depolimerized into smaller chains resulting in carbon dioxide, water and methane by living organisms, e.g., bacteria, fungi, algae and insects at specific conditions of light, temperature and oxygen [22]. Studies on biodegradability of biocomposites have shown different biodegradation rates, which are associated to the type, content and dispersion of nanofiller [23]. Over the last few years, the biodegradation of aliphatic polyester/clays composites was related to a chemical hydrolytic degradation caused by functional groups in the organoclay surfactant [24]. The biodegradation of TPS with the incorporation of commercial clays and cellulose fillers was reported [25,26,27,28,29]. For TPS/clay composites, increasing biodegradation rates depend on the relative crystallinity of the starch matrix [25] and on the clay type [26]. For TPS/cellulose composites, the biodegradation rates are decreased because of reduction in hydrophilicity as well as the slower degradation of high crystalline cellulose filler [27,28].
Up to now, the role of graphene derivatives on the biodegradation of starch-based materials has been reported for TPS/poly(lactic acid) (PLA) blends. The incorporation of rGO modified the biodegradation rate as a function of microscopic structures formed by graphene sheets within the TPS/PLA/rGO composites at 70:30:5 mass% composition. In this case, the well-dispersed graphene sheets form fractal nanostructures, which favored water diffusion across the sample, accelerating the degradation process [29]. In contrast, for the composite at TPS/PLA/rGO at 30:70:5 mass% composition, the aggregation of graphene sheets forms a barrier that hinders the diffusion of water into the blend, retarding the biodegradation process [29]. In compost and inoculated vermiculite, graphene nanosheets at 0.1% and 1% mass content were shown to increase the biodegradation rate of the TPS phase in PLA/TPS reactive blends [30].
This work aimed to investigate the role of graphene derivatives, graphene oxide (GO) and glucose-reduced graphene oxide (rGO-g), on the physical properties and biodegradability of TPS. The extruded TPS/GO and TPS/rGO-g composites were compared as a function of dispersion and wettability of graphene sheets in the starch matrix. To the best of the authors’ knowledge, no study on this subject has already been reported in the literature.
2. Materials and Methods
2.1. Materials
Regular cornstarch (CS) was supplied by Ingredion Brasil—Ingredientes Industriais Ltd.a. (São Paulo, SP, Brazil). According to the producer, this material is composed of 26–30 mass% amylose and 74–70 mass% amylopectin, with less than 0.5 mass% gluten. The gravimetric method was used to determine the humidity content (12 mass%). Analytical grade glycerol was purchased from Vetec Química Fina (Rio de Janeiro, RJ, Brazil) and was used as received. d-glucose solution at 85% (m/v) concentration was purchased from Marvi® (Ourinhos, SP, Brazil) and used as received. Natural graphite flakes were purchased from Sigma Aldrich (São Paulo, SP, Brazil). All other reagents were P.A. and were purchased from Vetec Química Fina (Rio de Janeiro, RJ, Brazil) and were used as received. Purified water from a Millipore water purification system, model Direct Q-3 (São Paulo, SP, Brazil) was used in the experiments.
2.2. Preparation of Graphene Oxide (GO) and Glucose-Reduced Graphene Oxide (rGO-g)
Graphite oxide was prepared from graphite flakes, using a modified Hummer’s method [31]. Briefly, a 9:1 mixture of concentrated H2SO4/H3PO4 (400 mL) was added to a 1 L flask. The flask was adjusted to an ice-bath, and 3 g of graphite (1 mass eq.), and then 18 g of KMnO4 (6 mass eq.) were added to the mixture under stirring. Then, the reaction mixture was heated to 50 °C and stirred for 12 h. The product was poured into a 1 L becher filled with ice cubes/water and homogenized with 3 mL of 30% H2O2. The oxidized product was filtered and washed three times with water, 30% HCl aqueous solution and ethyl alcohol. The resulting yellow-brownish material was filtered under vacuum and dried in an oven at 60 °C for 48 h. GO was dispersed in water at 1 g/L concentration and submitted to sonication at 40% wave amplitude for 15 min, in a Sonics and Materials Inc. ultrasonic processor (Newton, CT, USA), equipped with a standard probe 13 mm in diameter. The GO dispersion was transferred to a 1 L flask under constant stirring. Then, 40 g of glucose, a reducing carbohydrate, was slowly added to the dispersion under stirring for 30 min. Afterwards, 1.0 mL of ammonia solution (20% w/v) was added to the reaction up to pH 9. The reaction mixture was maintained under reflux for 1 h [17]. Finally, the product (rGO-g powder) was dialyzed against water at room temperature for 48 h and dried at 70 °C for 24 h.
2.3. Processing of TPS/GO and TPS/rGO-g Composites
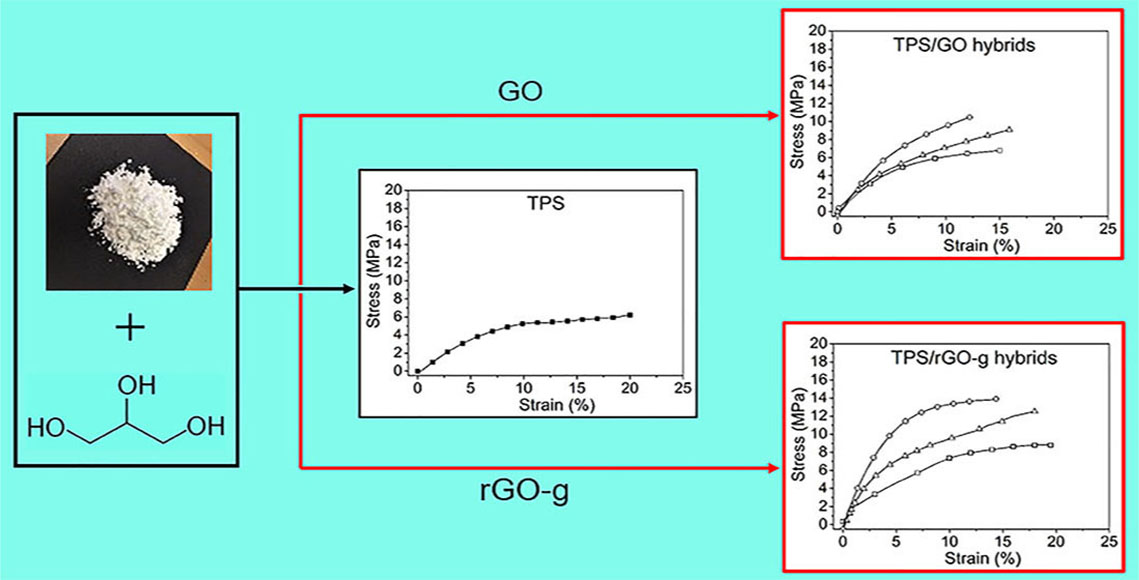
The mixture of CS and glycerol, added at 30 mass% based on starch dry mass, was homogenized in a conventional mixer (Ika Works, Wilmington, NC, USA). GO and rGO-g powder were previously dispersed in water. Then, the GO or rGO-g dispersions were added (separately), under mechanical stirring, to the CS/glycerol mixture. The resulting mixtures were dried in an oven at 60 °C for 48 h. The neat thermoplastic starch (TPS), TPS/GO and TPS/rGO-g composites were extruded in a Coperion ZSK 18 (Werner and Pfleiderer, Stuttgart, Germany) corotating extruder. The seven heating zones were maintained at 110, 110, 120, 120, 120, 110 and 110 °C and the screw speed was set at 200 rpm. The filler contents in the TPS/GO and TPS/rGO-g composites were 0.5, 1.0 and 2.0 mass%. The extruded materials were pelletized and compression-molded by heating at 120 °C under 68.9 MPa for 10 min and cooled for 5 min in a cold press.
2.4. Characterizations
Fourier transform infrared spectroscopy (FTIR): GO and rGO-g powders were analyzed as potassium bromide disks in a Varian spectrometer, model 3100 Excalibur Series (Melbourne, Victoria, Australia), from 4000 to 400 cm−1.
UV-vis spectroscopy: Aqueous dispersions (0.01 g/L) of GO and rGO-g were submitted to sonication for 15 min. The experiments were carried out in triplicate with a Cary 100 Conc spectrophotometer (Santa Clara, CA, USA) within the 200–900 nm range [32].
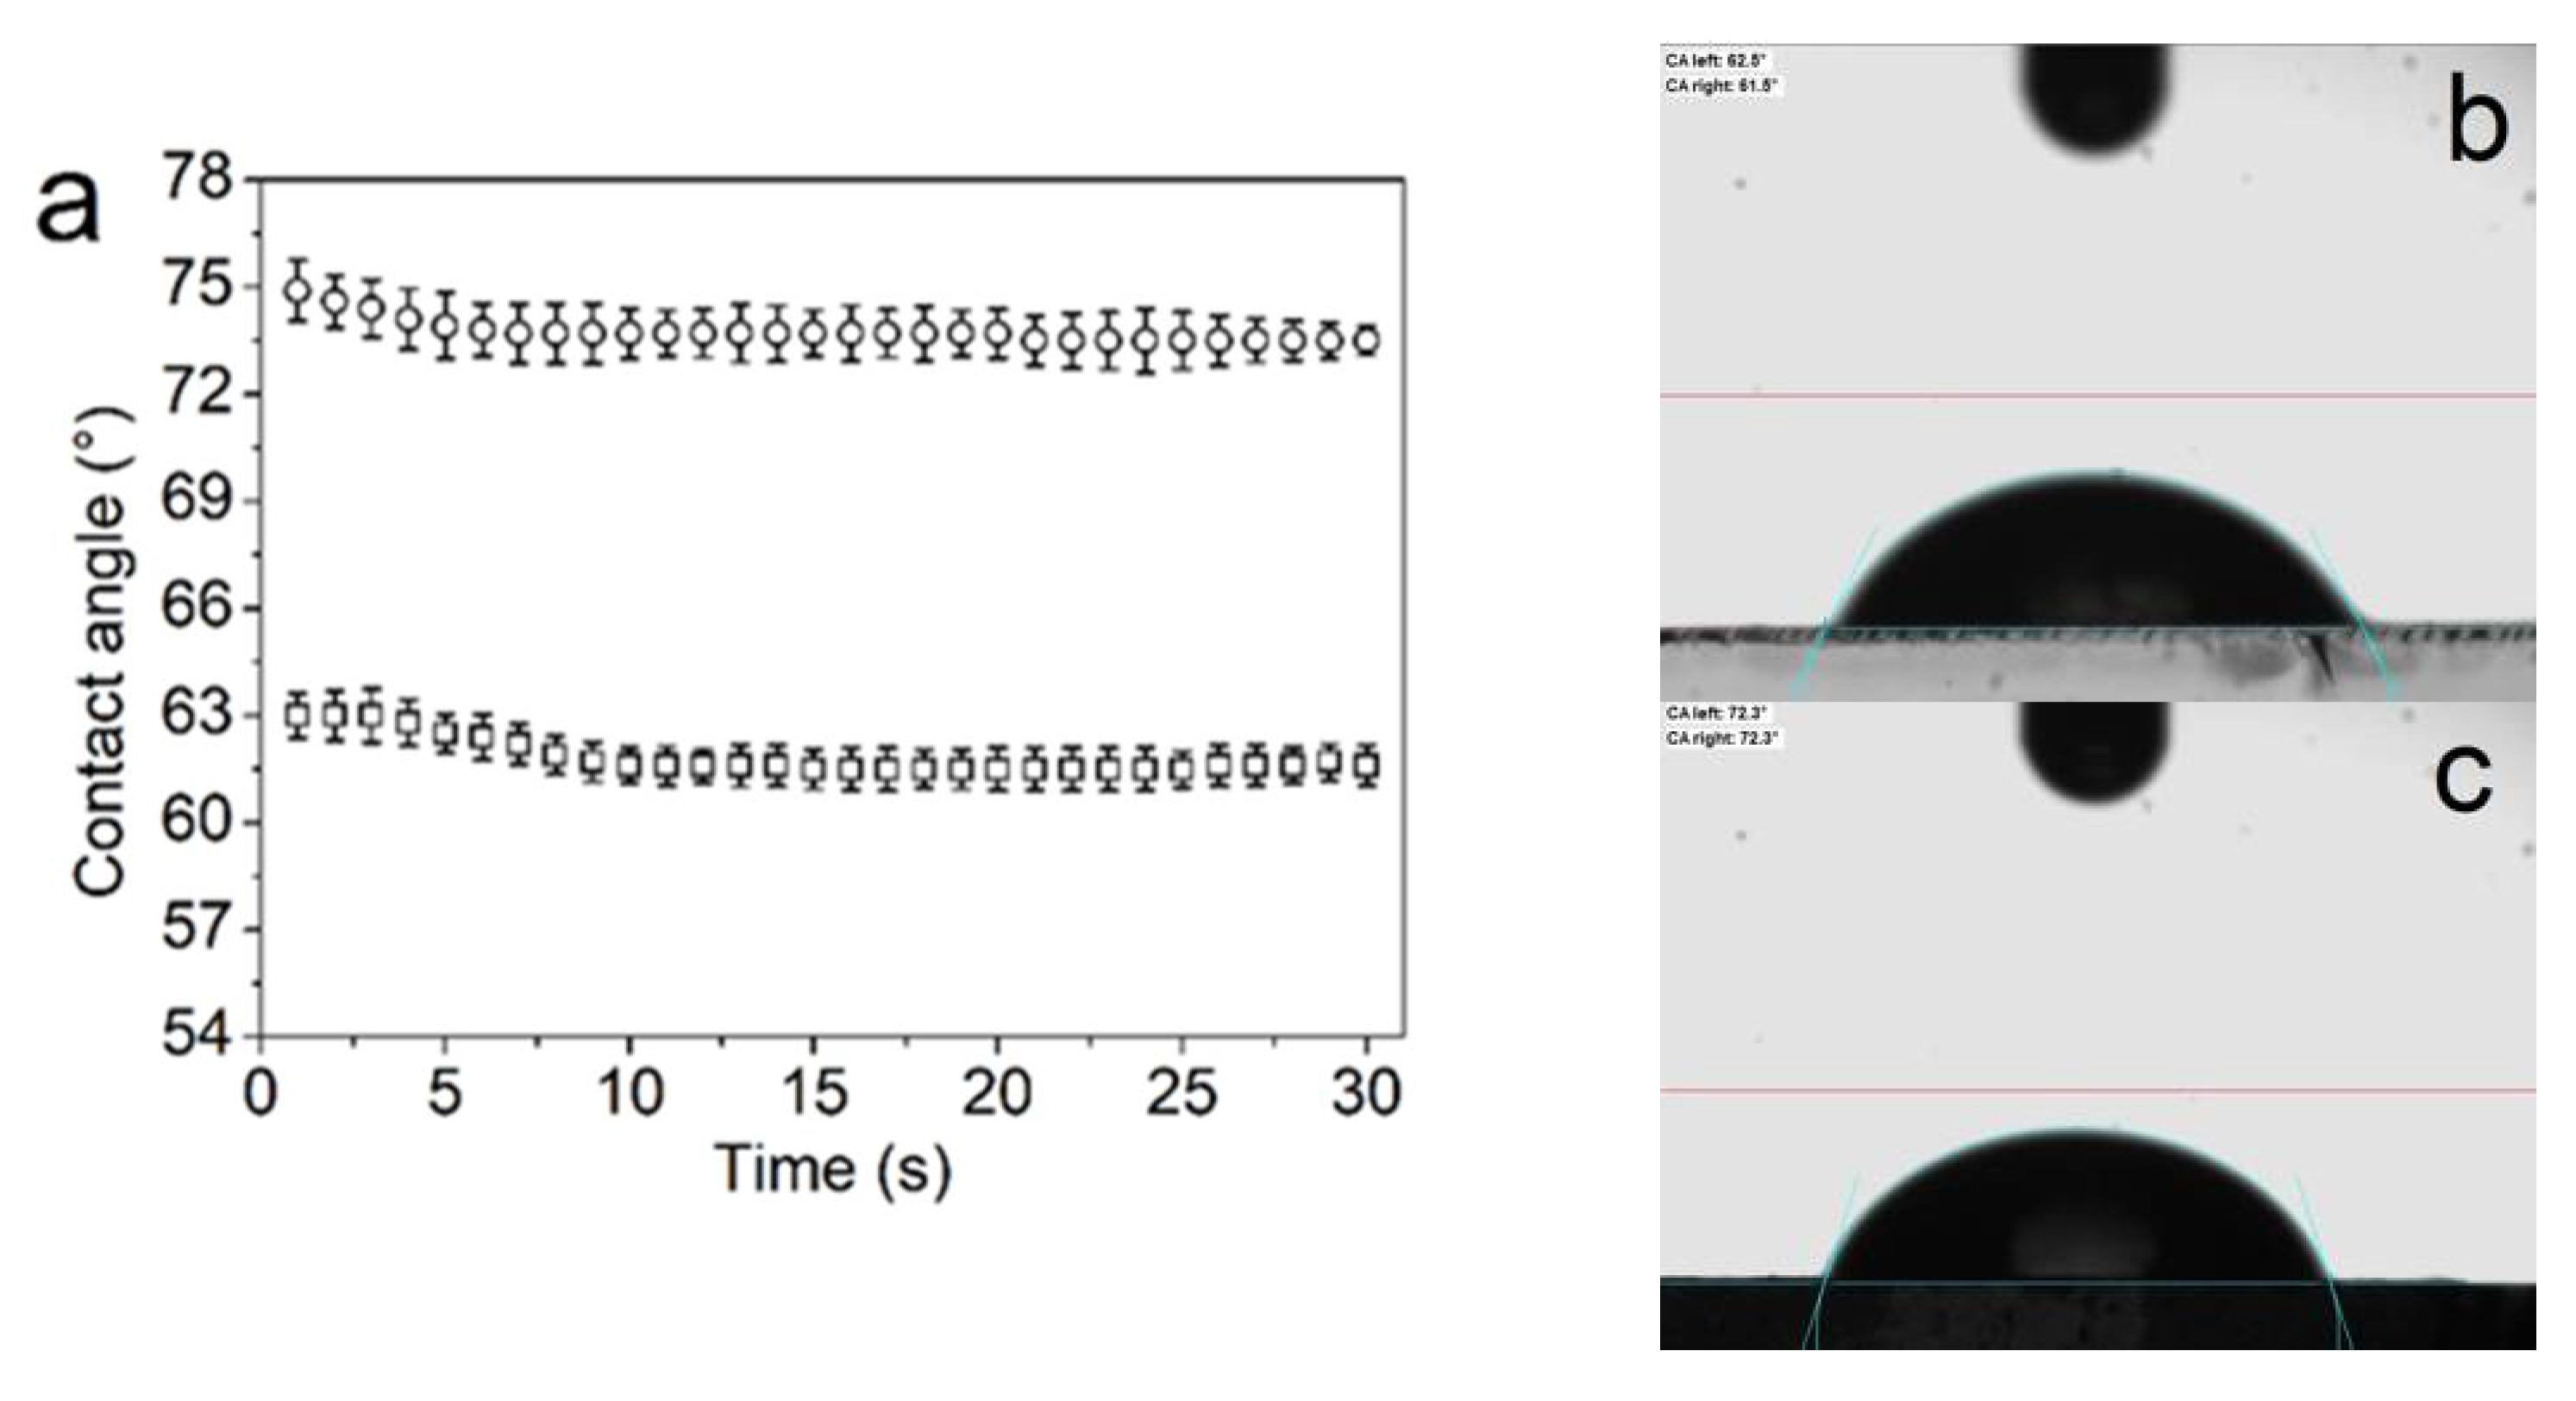
Contact angle measurements: Dispersions of GO and rGO-g at 1.0% (m/v) were poured onto glass plates and dried at 50 °C for 24 h resulting in thin films. Contact angles were measured with a Data Physics Goniometer, Model OCA 15Plus (Data Physics Instruments, Filderstadt, Germany) coupled to the software module SCA 20 to capture and process images. A 2 μL drop of distilled water was dripped on the surface of the films using a syringe. After stabilization of the droplet, the drop contact angle variation was registered during an interval of 30 s. The procedure was carried out in triplicate and the contact angle presented was the mean value of all the measurement [33].
X-ray diffraction (XRD): X-ray diffractograms were obtained in an Ultima IV diffractometer (Rigaku Corporation, Osaka, Japan) in the angular region 2.0 to 35° (2θ) at 0.01°/s, in reflection mode. The CuKα1 radiation with wavelength of 0.15418 nm was generated at 40 kV and 20 mA. The d001 values of the stacking order of GO were calculated by the Bragg’s law, nλ = 2 d sin θ, where n is an integer, λ is the wavelength of the incident wave (1.5418 Å), d is the spacing between any two atomic planes in the crystal lattice and θ is the angle of reflection [25].
Mechanical properties: Tensile tests were carried out at 21 °C in a Q-800 DMA equipment (TA Instruments, New Castle, DE, USA) according to the ISO 527-3 method, with rectangular compression-molded films (13 ± 0.2) mm × (6 ± 0.2) mm × (0.8 ± 0.1 mm) in dimensions, previously conditioned at 21 °C, and 50% relative humidity, for a period of at least 48 h. The average value from a total of five measurements was taken. The samples were placed between a fixed and a moveable clamp, and the experiments were performed in tensile mode.
Soil burial biodegradation test: This test was performed for TPS and TPS/GO composites [25]. Soil, purchased from Vide Verde Compostagem Ltd.a (Resende, RJ, Brazil), was put in a plastic container of 10 L capacity. Five replications of each squared sample were buried in soil and remained under laboratory conditions (average temperature 23 °C) for 120 days. The soil moisture was maintained at (18 ± 1.0)%. Every 15 days, the samples were taken out from the container, cleaned with a smooth brush, and weighted. The average mass was considered to evaluate biodegradation as a function of time (days). The soil pH was measured in triplicate every 30 days. About 2 g of soil were added to 50 mL of deionized water, maintained under stirring for 15 min and the pH of the liquid phase was measured with a pHmeter. The initial pH of soil was 6.5 ± 0.1.
Scanning electron microscopy: The surfaces of TPS and TPS/GO composites were analyzed after 90 days of biodegradation. A piece of each sample was cleaned with a smooth brush, their surfaces were vacuum-coated with gold and examined with a Jeol electron microscope, model JSM-6460LV (Akishima-shi, Japan) at the acceleration voltage of 20 kV.
Aerobic biodegradation test: This test was performed for TPS and TPS/rGO-g composites incorporated with rGO-g at 1.0 and 2.0 mass%, according to the ASTM D5988-03 (2003) standard test method. Compression-molded films were cut into pieces (2.5 × 2.5 × 1.0) cm3 in dimensions, weighed and exposed to a controlled aerobic composting process in conjunction with the inoculum. The tests were performed in triplicate at 60 °C and relative humidity (RH) of (60 ± 10)% for 183 days. The amount of carbon dioxide evolved, resulting from the degradation process, was trapped in potassium hydroxide solution and measured as a function of time. The soil pH was measured in triplicate before and after the test. The initial pH of soil was 6.5 ± 0.1.
3. Results and Discussion
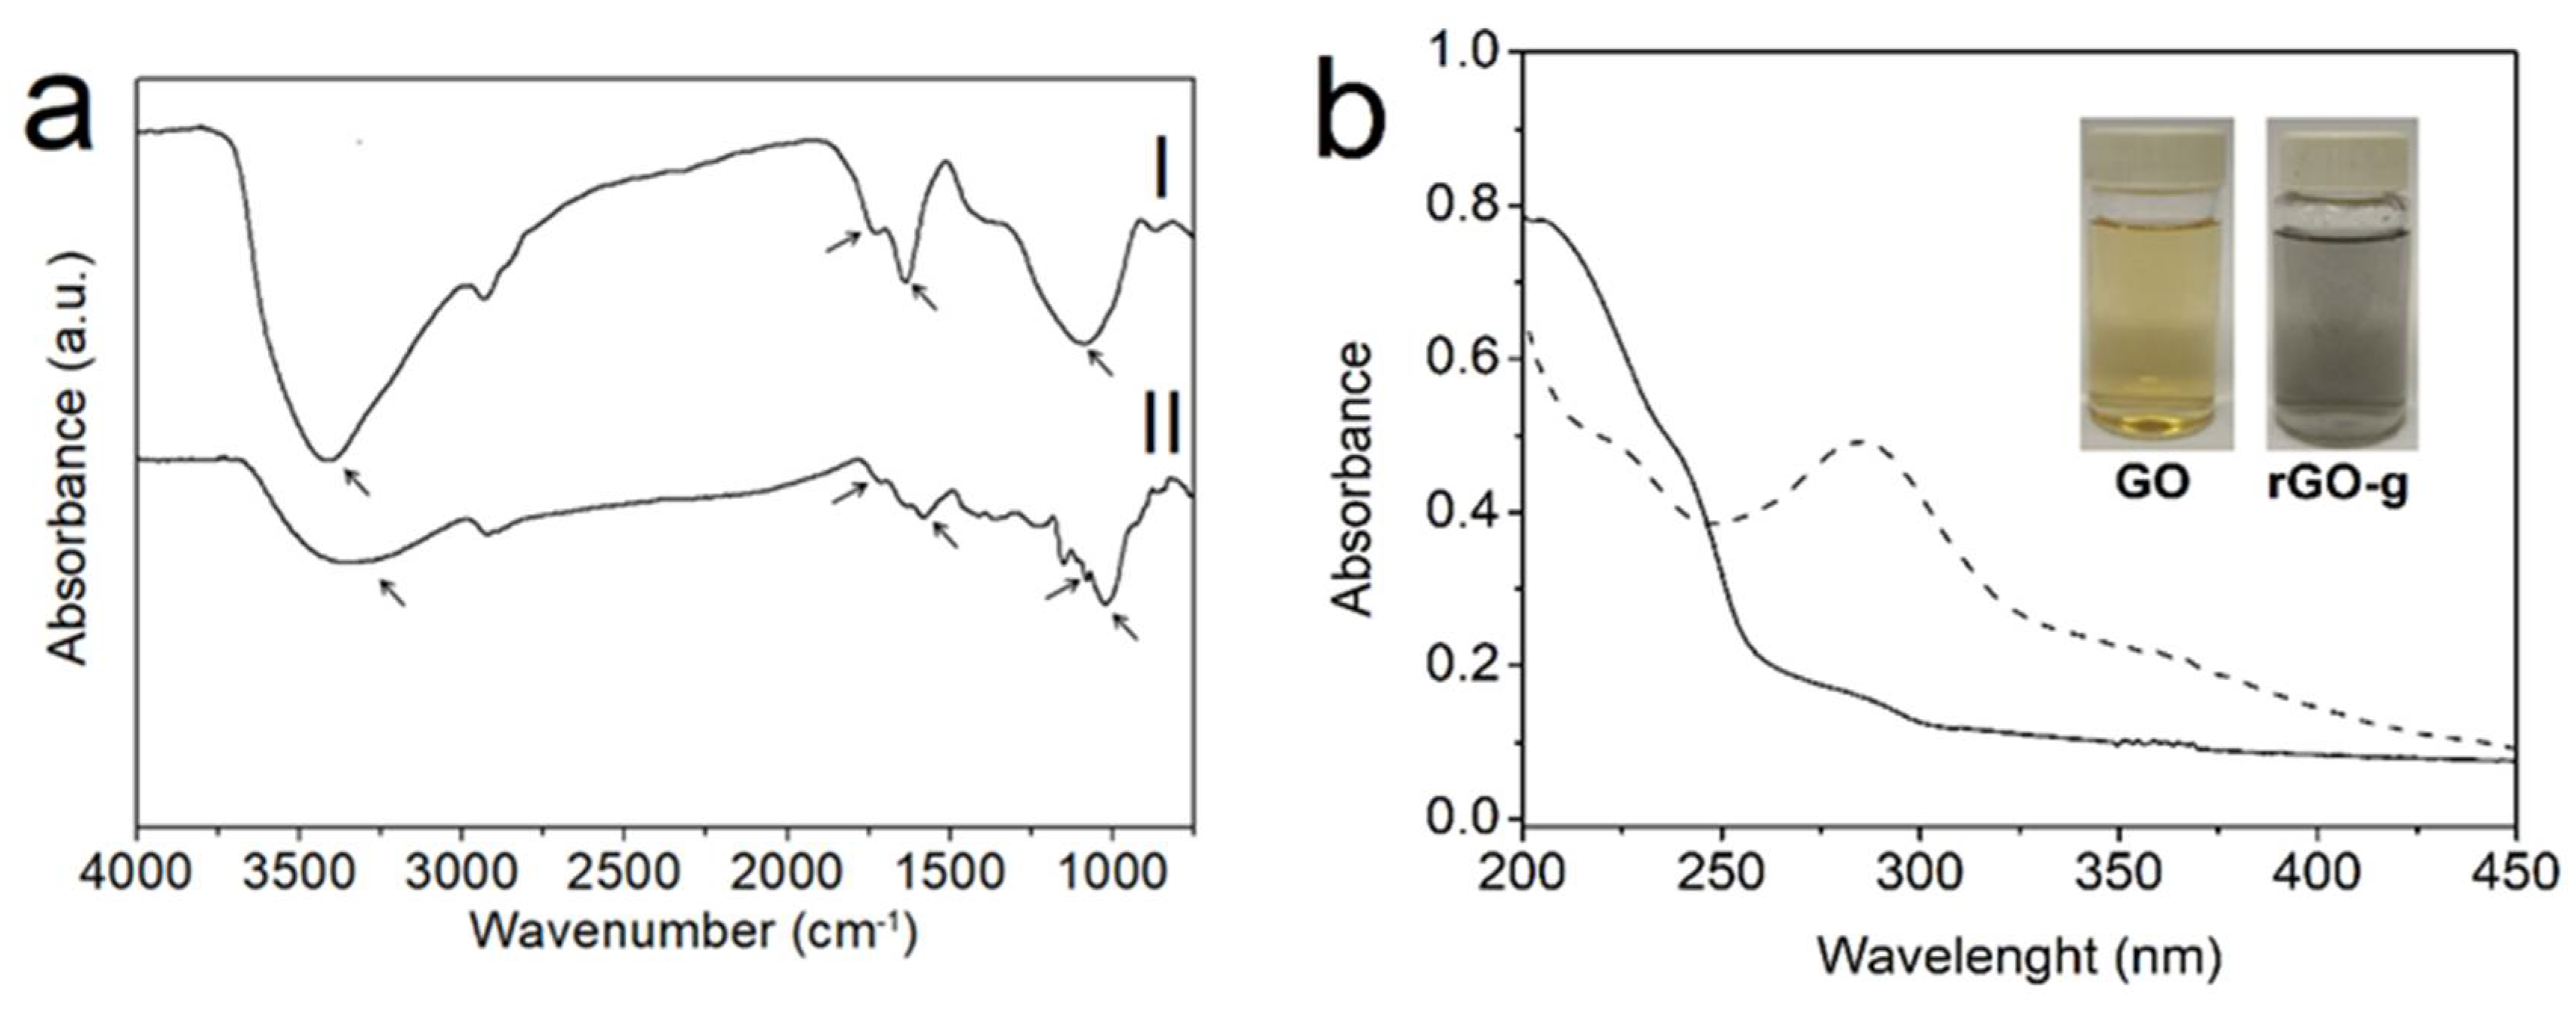
The use of reducing carbohydrates, such as glucose, may be considered an eco-friendly approach for GO reduction. The mechanism of GO reduction is attributed to the alkali conversion of glucose into fructose [17,18]. Infrared spectroscopy gives information on the functional groups of GO and rGO-g (Figure 1a). The absorptions at 3420 cm−1 and 1726 cm−1 were attributed to stretching vibrations of O–H and –C=O, respectively [17,31]. The absorption at 1625 cm−1 was attributed to stretching of C=C bonds of un-oxidized graphite [17]. However, this assignment remains under debate, because this band has been attributed to oxygenated groups (ether and –OH groups) or to the bending vibration of absorbed H2O molecules [34]. The absorptions at 1200 cm−1 and 1035 cm−1 were attributed to C–O (epoxy groups) and C–OH stretching vibrations, respectively [31,35]. For rGO-g, these characteristic absorptions had their intensities decreased, which indicated the partial deoxygenation of GO associated with glucose reduction. Figure 1b shows the UV-vis spectra for GO and rGO-g. For both materials, the typical absorption at 228 nm was related to π-π * electronic transitions (isolated ethylenic and aromatic chromophores). For rGO-g, the appearance of an intense absorption at 286 nm was attributed to the increased number of condensed aromatic rings and revealed that the electronic conjugation within the graphene sheets was restored upon reduction by glucose [17]. Additionally, the reduction reaction was indicated by the color change of the dispersions from brownish yellow (GO) to black (rGO-g), as shown in the insert of Figure 1b.
Contact angle measurements were used to evaluate the role of the reduction process on the polarity of graphene oxide (Figure 2a). GO and rGO-g presented ϴ < 90° and may be classified as hydrophilic materials [36], suitable to be dispersed in polar starch matrix. The experimental results indicated that the contact angle for GO and rGO-g were (62.2 ± 1.9)° and (73.7 ± 2.3)°, respectively. As already reported, this difference is related to the reduction of oxygen-containing groups on graphene sheets that decreases its hydrophilicity [33]. Furthermore, the rGO-g higher tendency to aggregation and, consequently, higher surface roughness, may have contributed to its higher contact angle [36]. Therefore, the GO surface is more wettable than the rGO-g surface, with a more flattened drop (Figure 2b,c). This behavior corroborates FTIR results, which showed that rGO-g had lower density of oxygen-containing groups, being less polar than GO.
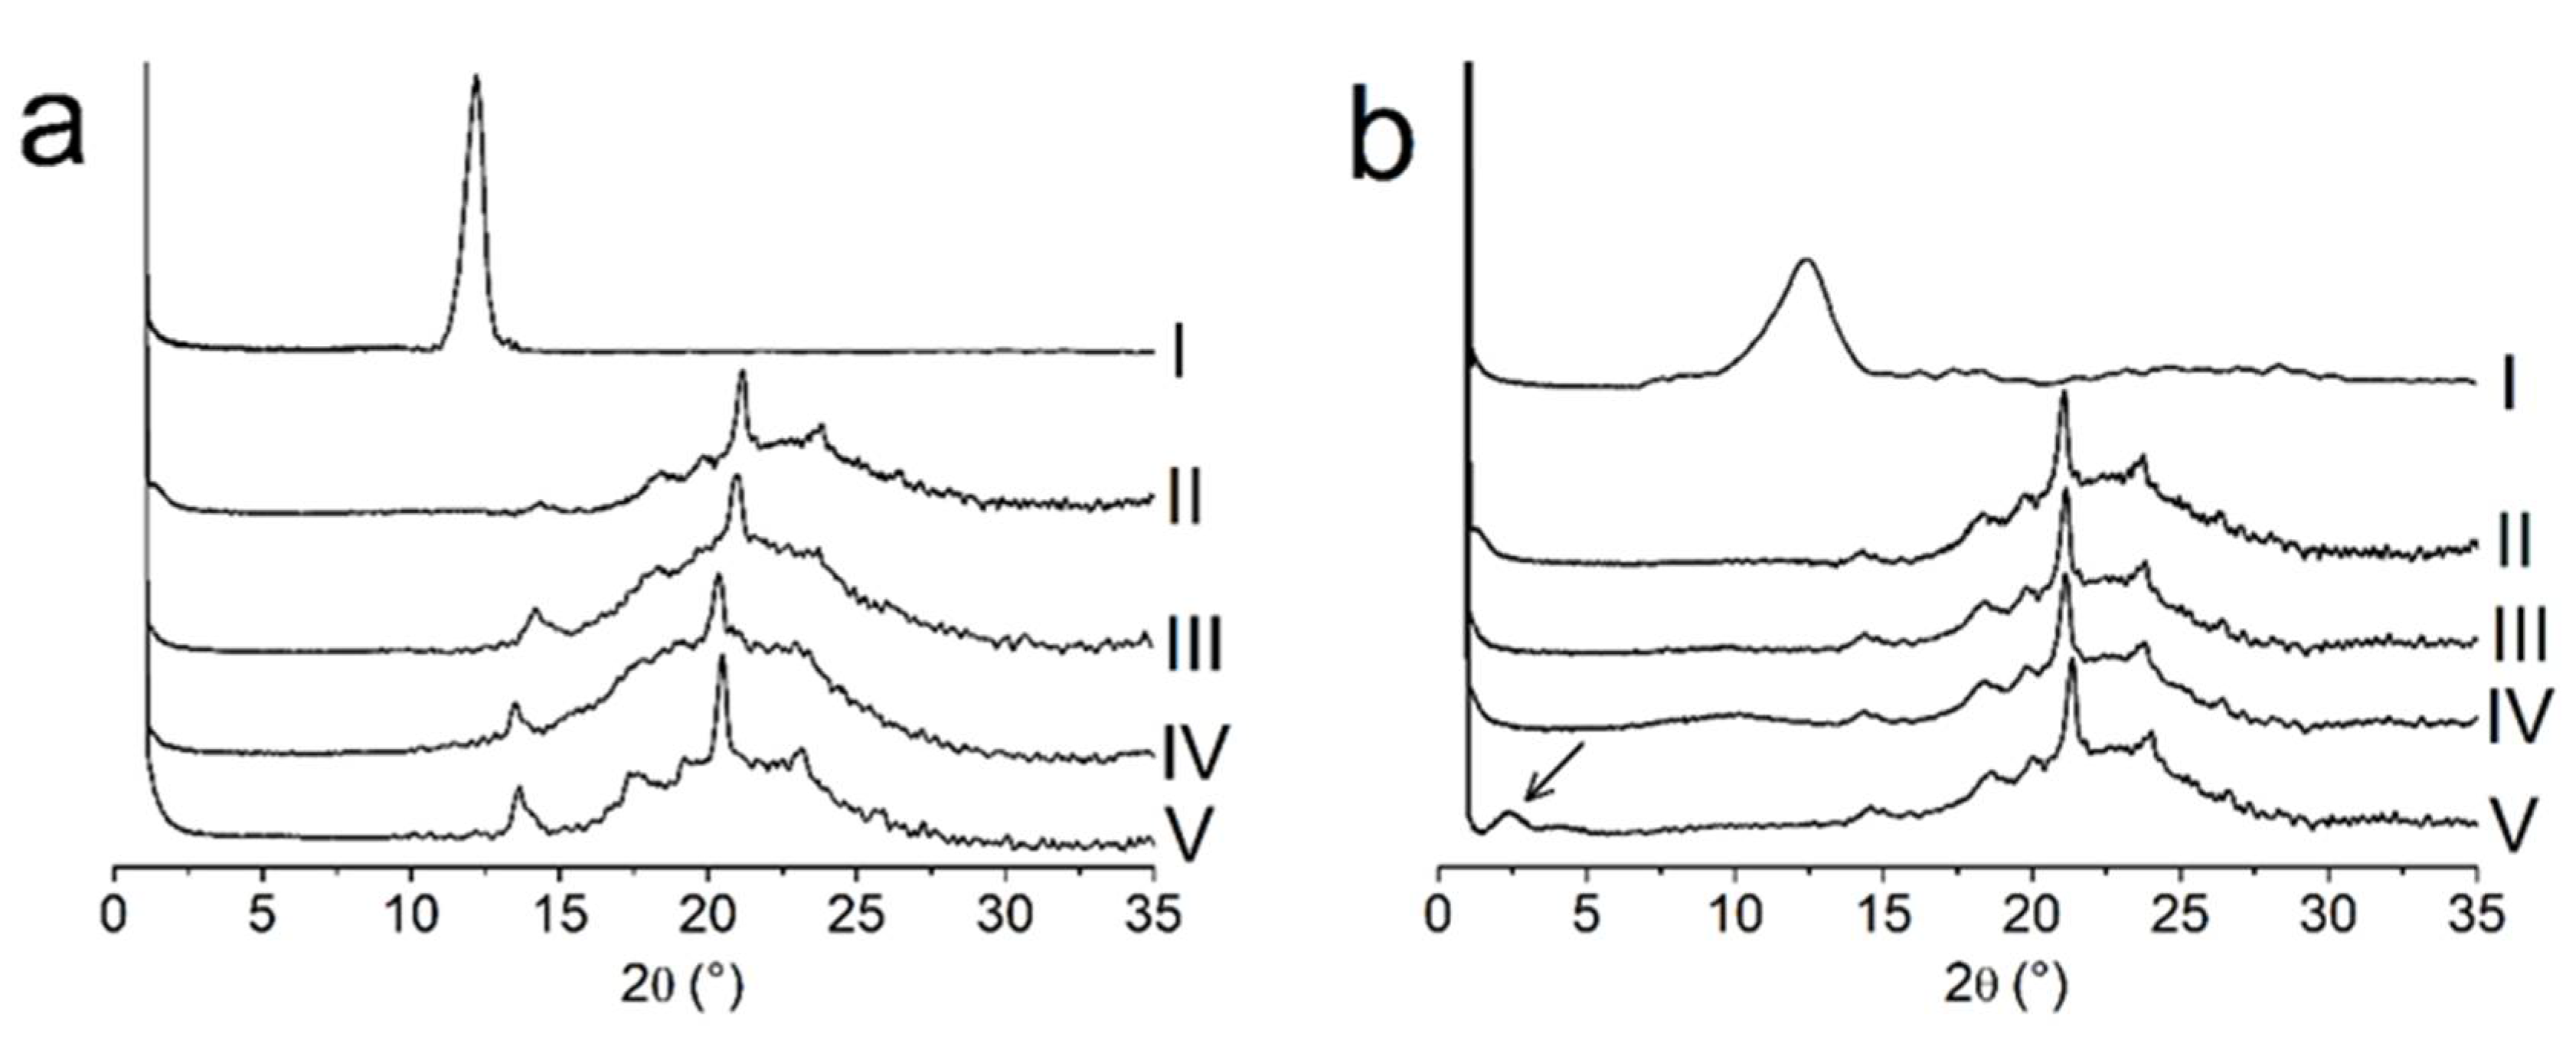
Figure 3 shows X-ray diffraction results, used to evaluate GO and rGO-g exfoliation within starch matrix and the role of these nanofillers on the crystallinity of TPS. For GO alone (Figure 3a, trace I), the reflection at 2θ = ~12.0° (d002 = 0.74 nm) is attributed to the 002 plane with expanded interlamellar d-spacing (d), caused by the introduction of oxygenated groups [17]. For rGO-g (Figure 3b, trace I), this reflection shifted to ~13.1° (2θ) (d002 = 0.68 nm). This result indicated a small reduction of the spacing between the graphene sheets by the partial removal of oxygen-containing groups promoted by glucose reduction. For all TPS/GO composites (Figure 3a, traces III-V), the reflection of GO was shifted to lower angles values, bellow 2θ = 0.9°. This result revealed the high dispersion of GO sheets within the starch matrix. For TPS/rGO-g composites with rGO-g incorporated at 0.5 and 1.0 mass%, the reflection of rGO-g was also not detected (Figure 3b, traces III and IV). Conversely, the diffractogram obtained for the composite with rGO-g incorporated at 2.0 mass% showed a shallow reflection around 2θ = 2.3° (d = 3.45 nm) (Figure 1b, trace V). This result indicated the coexistence of a small fraction of intercalated rGO-g sheets within the TPS matrix. The reduction in wettability of rGO-g in TPS does not favor exfoliation of graphene sheets for high filler contents.
For TPS (traces II), the reflections at 2θ = 13.0° and 21.3° were attributed to VA crystals, related to processing-induced crystallinity of single helical amylose, found in extruded and compression-molded TPS with less than 10% water [37]. As the content of GO was increased in TPS/GO composites, the reflection at 2θ = 13.0° presented increased intensity. The reflection at 2θ = 21.3° was slightly shifted to 2θ = ~ 20.2°for the composite with GO at 2.0 mass% content. This result suggests that some water was absorbed by starch spherulites [37]. Probably, this water was previously bonded to GO. In contrast, for the TPS/rGO-g composites, the VA reflections were shifted to higher angles. The shift of these reflections to higher 2θ values revealed less water absorbed. This result was mostly pronounced for the composite with rGO-g incorporated at 2.0 mass%, which presented reflections at 2θ = 14.5° and 2θ = 22.4°.
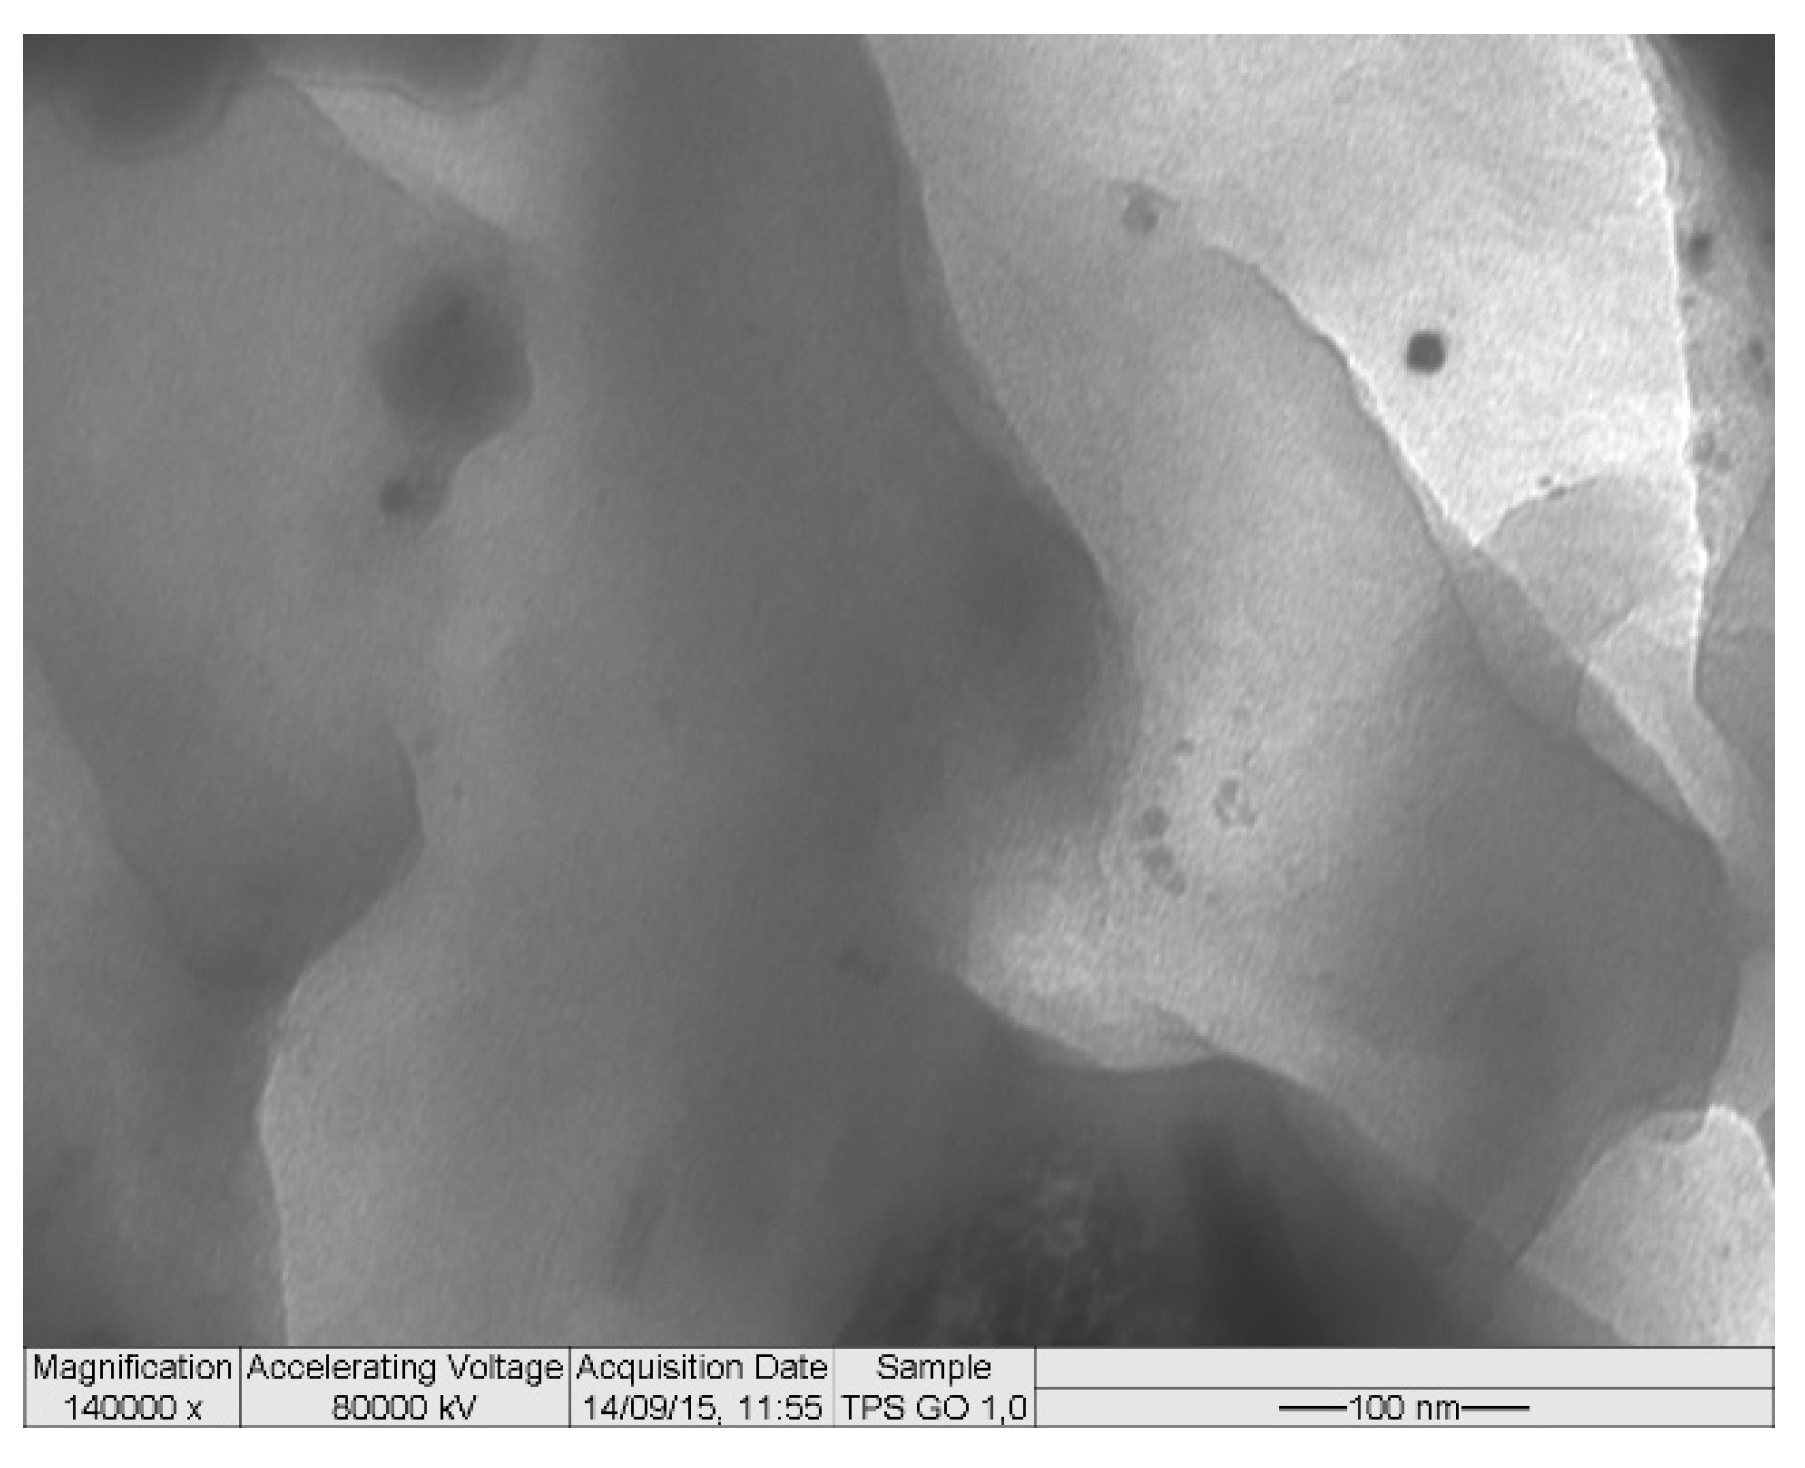
Figure 4 shows TEM image obtained for TPS with GO incorporated at 1.0 mass% content. Different dispersion levels of GO in the starch matrix were observed. GO sheets might be superimposed, but not stacked. Note that this interpretation is also consistent with XRD at lower angles, which indicated exfoliation of GO sheets. However, TEM images revealed different forms and sizes of GO sheets within the starch matrix.
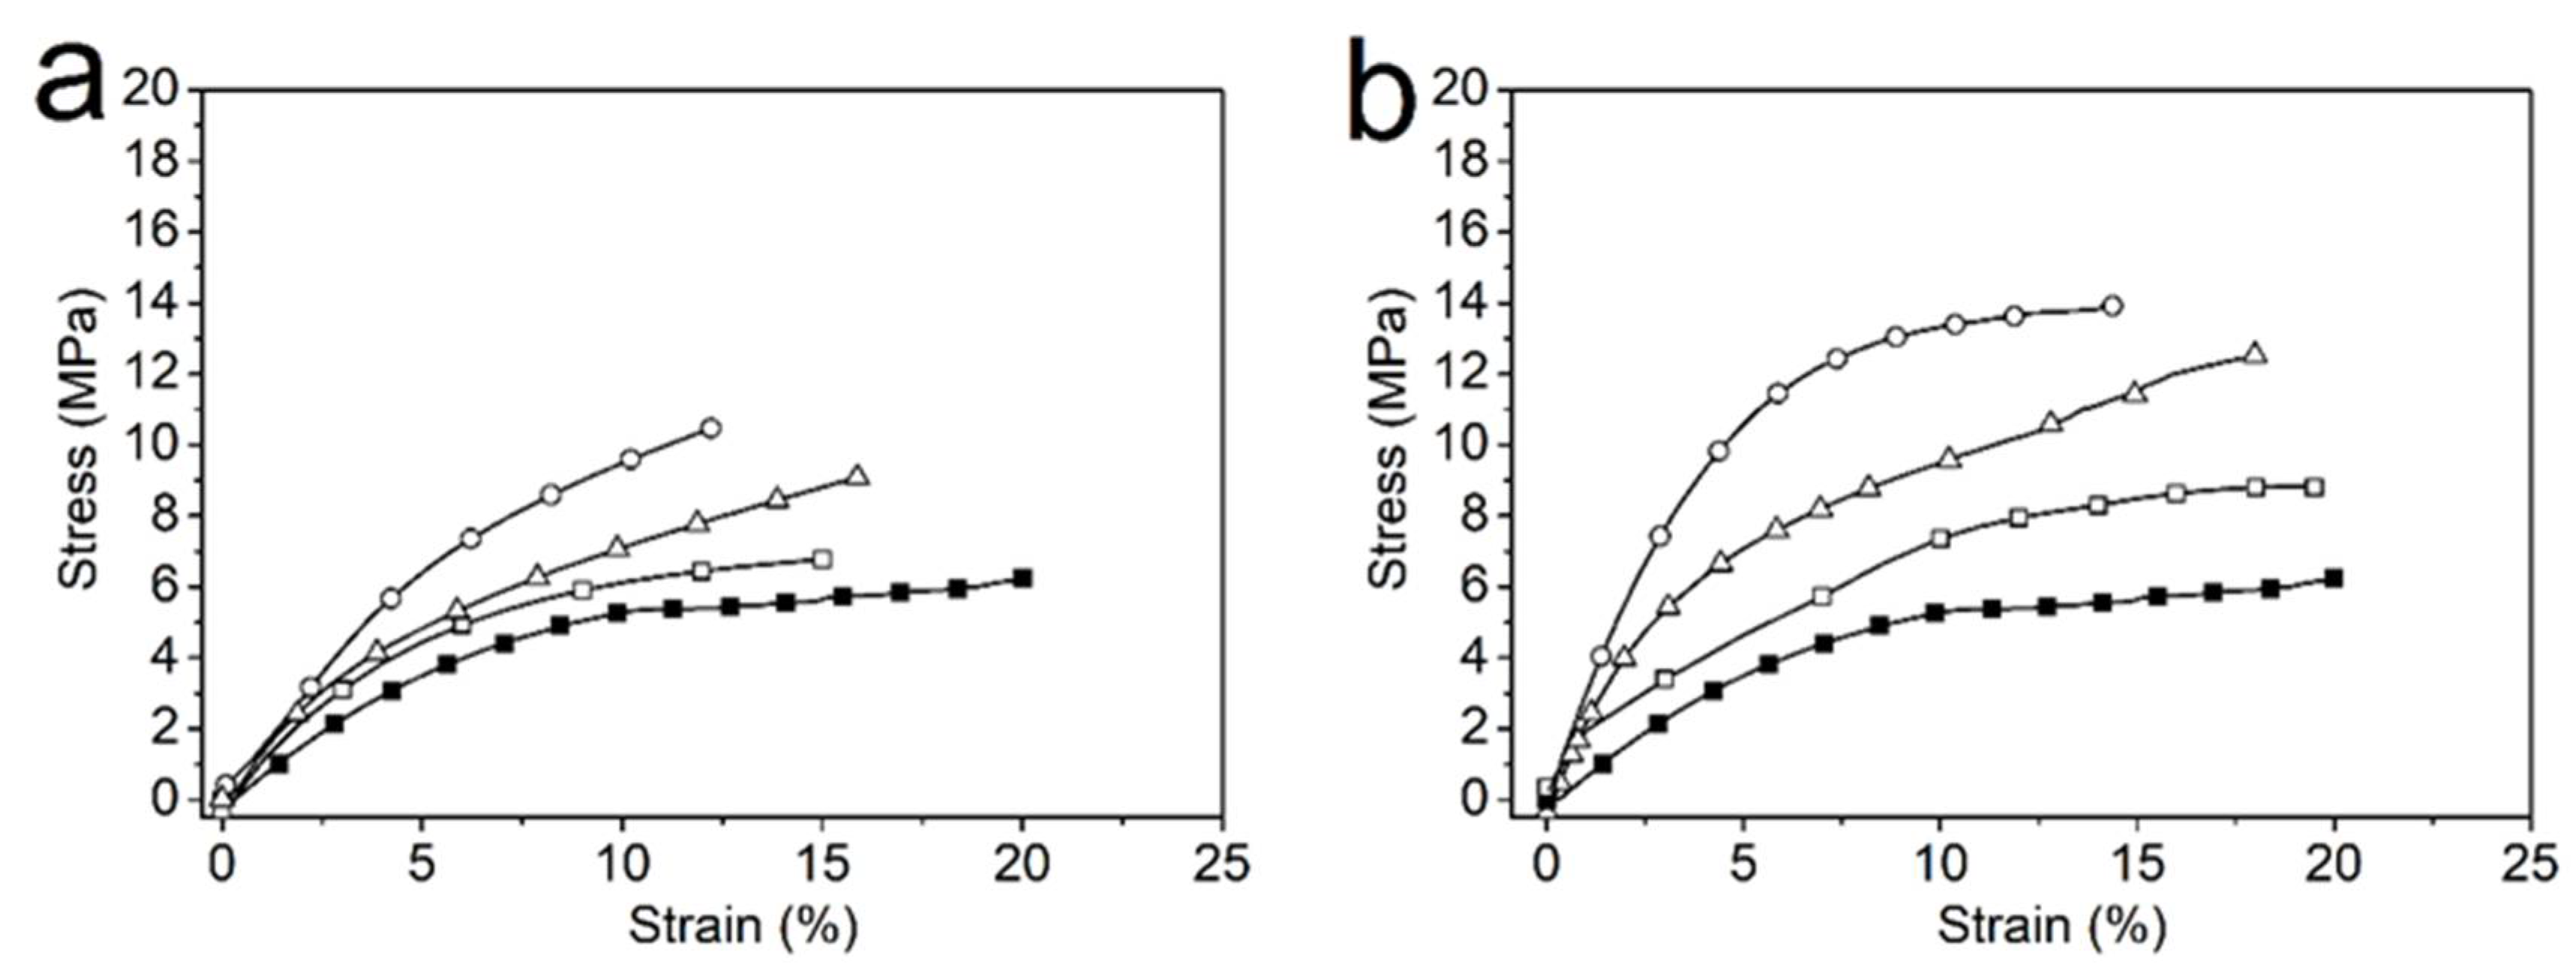
The mechanical properties of TPS, TPS/GO and TPS/rGO-g composites were investigated by tensile tests (Figure 5a,b) with the determination of Young’s modulus (E), stress at break (σmax) and elongation at break (εmax) values. As already reported, the role of graphene derivatives on the mechanical properties of TPS is related to the polarity of these fillers, which control their dispersion [20]. As a reference, neat TPS presented E = (28.6 ± 2.7) MPa, σmax = (5.8 ± 0.6) MPa and εmax = (20.2 ± 1.9)%. For TPS/GO, the E and σmax values increased considerably. For TPS/GO with GO incorporated at 0.5, 1.0 and 2.0 mass% contents, E values varied from E = (51.4 ± 4.8) MPa, (85.2 ± 8.1) MPa and (108.2 ± 10.3) MPa, respectively. For the same samples, σmax values were found to be σmax = (6.9 ± 0.7) MPa, (9.4 ± 0.8) MPa and (10.6 ± 1.1) MPa. The enhancements observed in relation to TPS are related to the good interfacial interaction of well-dispersed GO sheets within the starch matrix. However, the εmax values decreased to εmax = (15.6 ± 1.1)%, (16.1 ± 1.5)% and (12.3 ± 0.9)% with GO incorporated at 0.5, 1.0 and 2.0 mass% contents, respectively. This result indicated that the high content of the filler increased hydrogen bonding interaction between GO sheets and the TPS matrix, hindering the stretching of starch chains [38].
For TPS/rGO-g, E and σmax varied from E = (80.2 ± 5.3) MPa, (110.6 ± 9.5) MPa to (144.2 ± 11.2) MPa and from σmax = (8.9 ± 0.7) MPa, (12.9 ± 1.1) MPa to (14.5 ± 1.2) MPa with rGO-g incorporated at 0.5, 1.0 and 2.0 mass%, respectively. These improvements are related to the reinforcing effect of rGO-g. In addition, TPS/rGO-g composites presented εmax values similar to TPS alone, which were εmax = (19.6 ± 1.7)% and (18.1 ± 1.4)% for the compositions with rGO-g at 0.5 and 1.0 mass% contents. This result may be associated to the decrease in rGO-g polarity, as compared with GO, which results in a lower number of potential hydrogen bonding between RGO-g and the TPS matrix. The stretching of plasticized starch chains was not altered for those compositions. In contrast, for the composite with rGO-g incorporated at 2.0 mass%, the decrease in elongation (εmax = 14.1 ± 1.2)% was observed. Possibly, the presence of rGO-g intercalated sheets contributed to hinder stretching of starch chains.
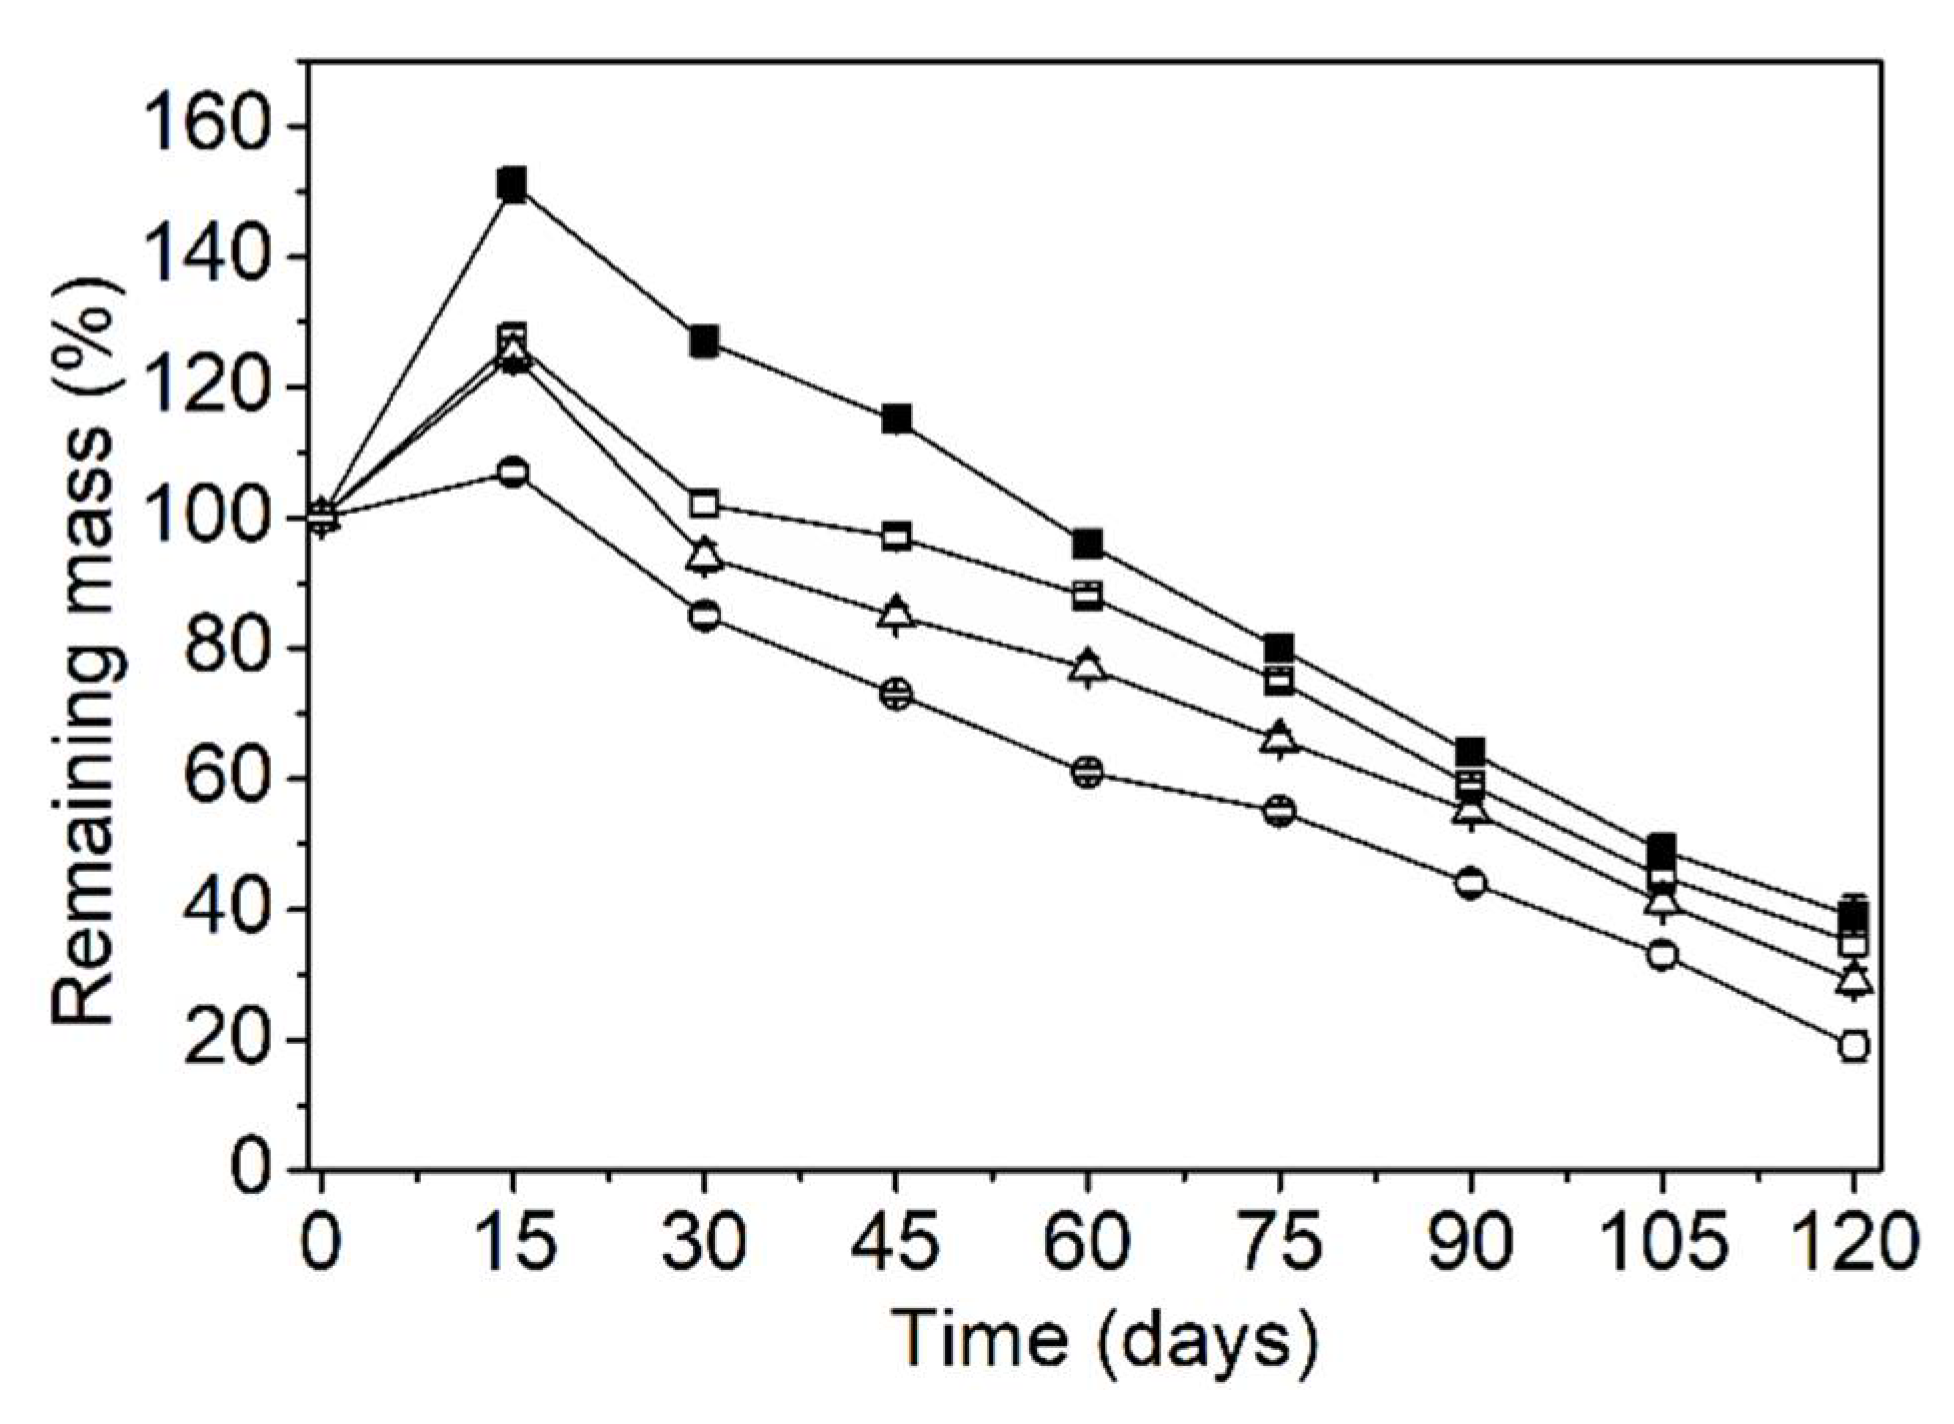
Biodegradation experiments are of fundamental importance for production of environmentally friendly materials. The glycosidic linkages, easily attacked by enzymes of microorganisms, make starch a biodegradable material [22]. For TPS and TPS/GO composites, soil burial tests were carried out at room temperature, and evaluated by weighing specimens regularly (Figure 6). In the first fifteen days, the samples absorbed some soil humidity. TPS absorbed a higher amount of water than the TPS/GO composites. As observed by X-ray diffraction, GO was well-dispersed within starch matrix and the exfoliated sheets acted as a barrier for water permeation in this first stage. For TPS, the primary degradation stage was associated with leaching of glycerol from the starch matrix [39]. Within 45 days of incubation, the TPS/GO composites already show mass loss, which was more pronounced with the increase in GO mass content. As already reported, GO has carboxyl groups linked to the sheet edges. These groups give acid character to GO [40,41]. Furthermore, these acid groups in GO may induce the breakage of glycosidic bonds in starch molecules, accelerate their depolymerization and facilitate the bioassimilation of resulting materials by microorganisms from soil.
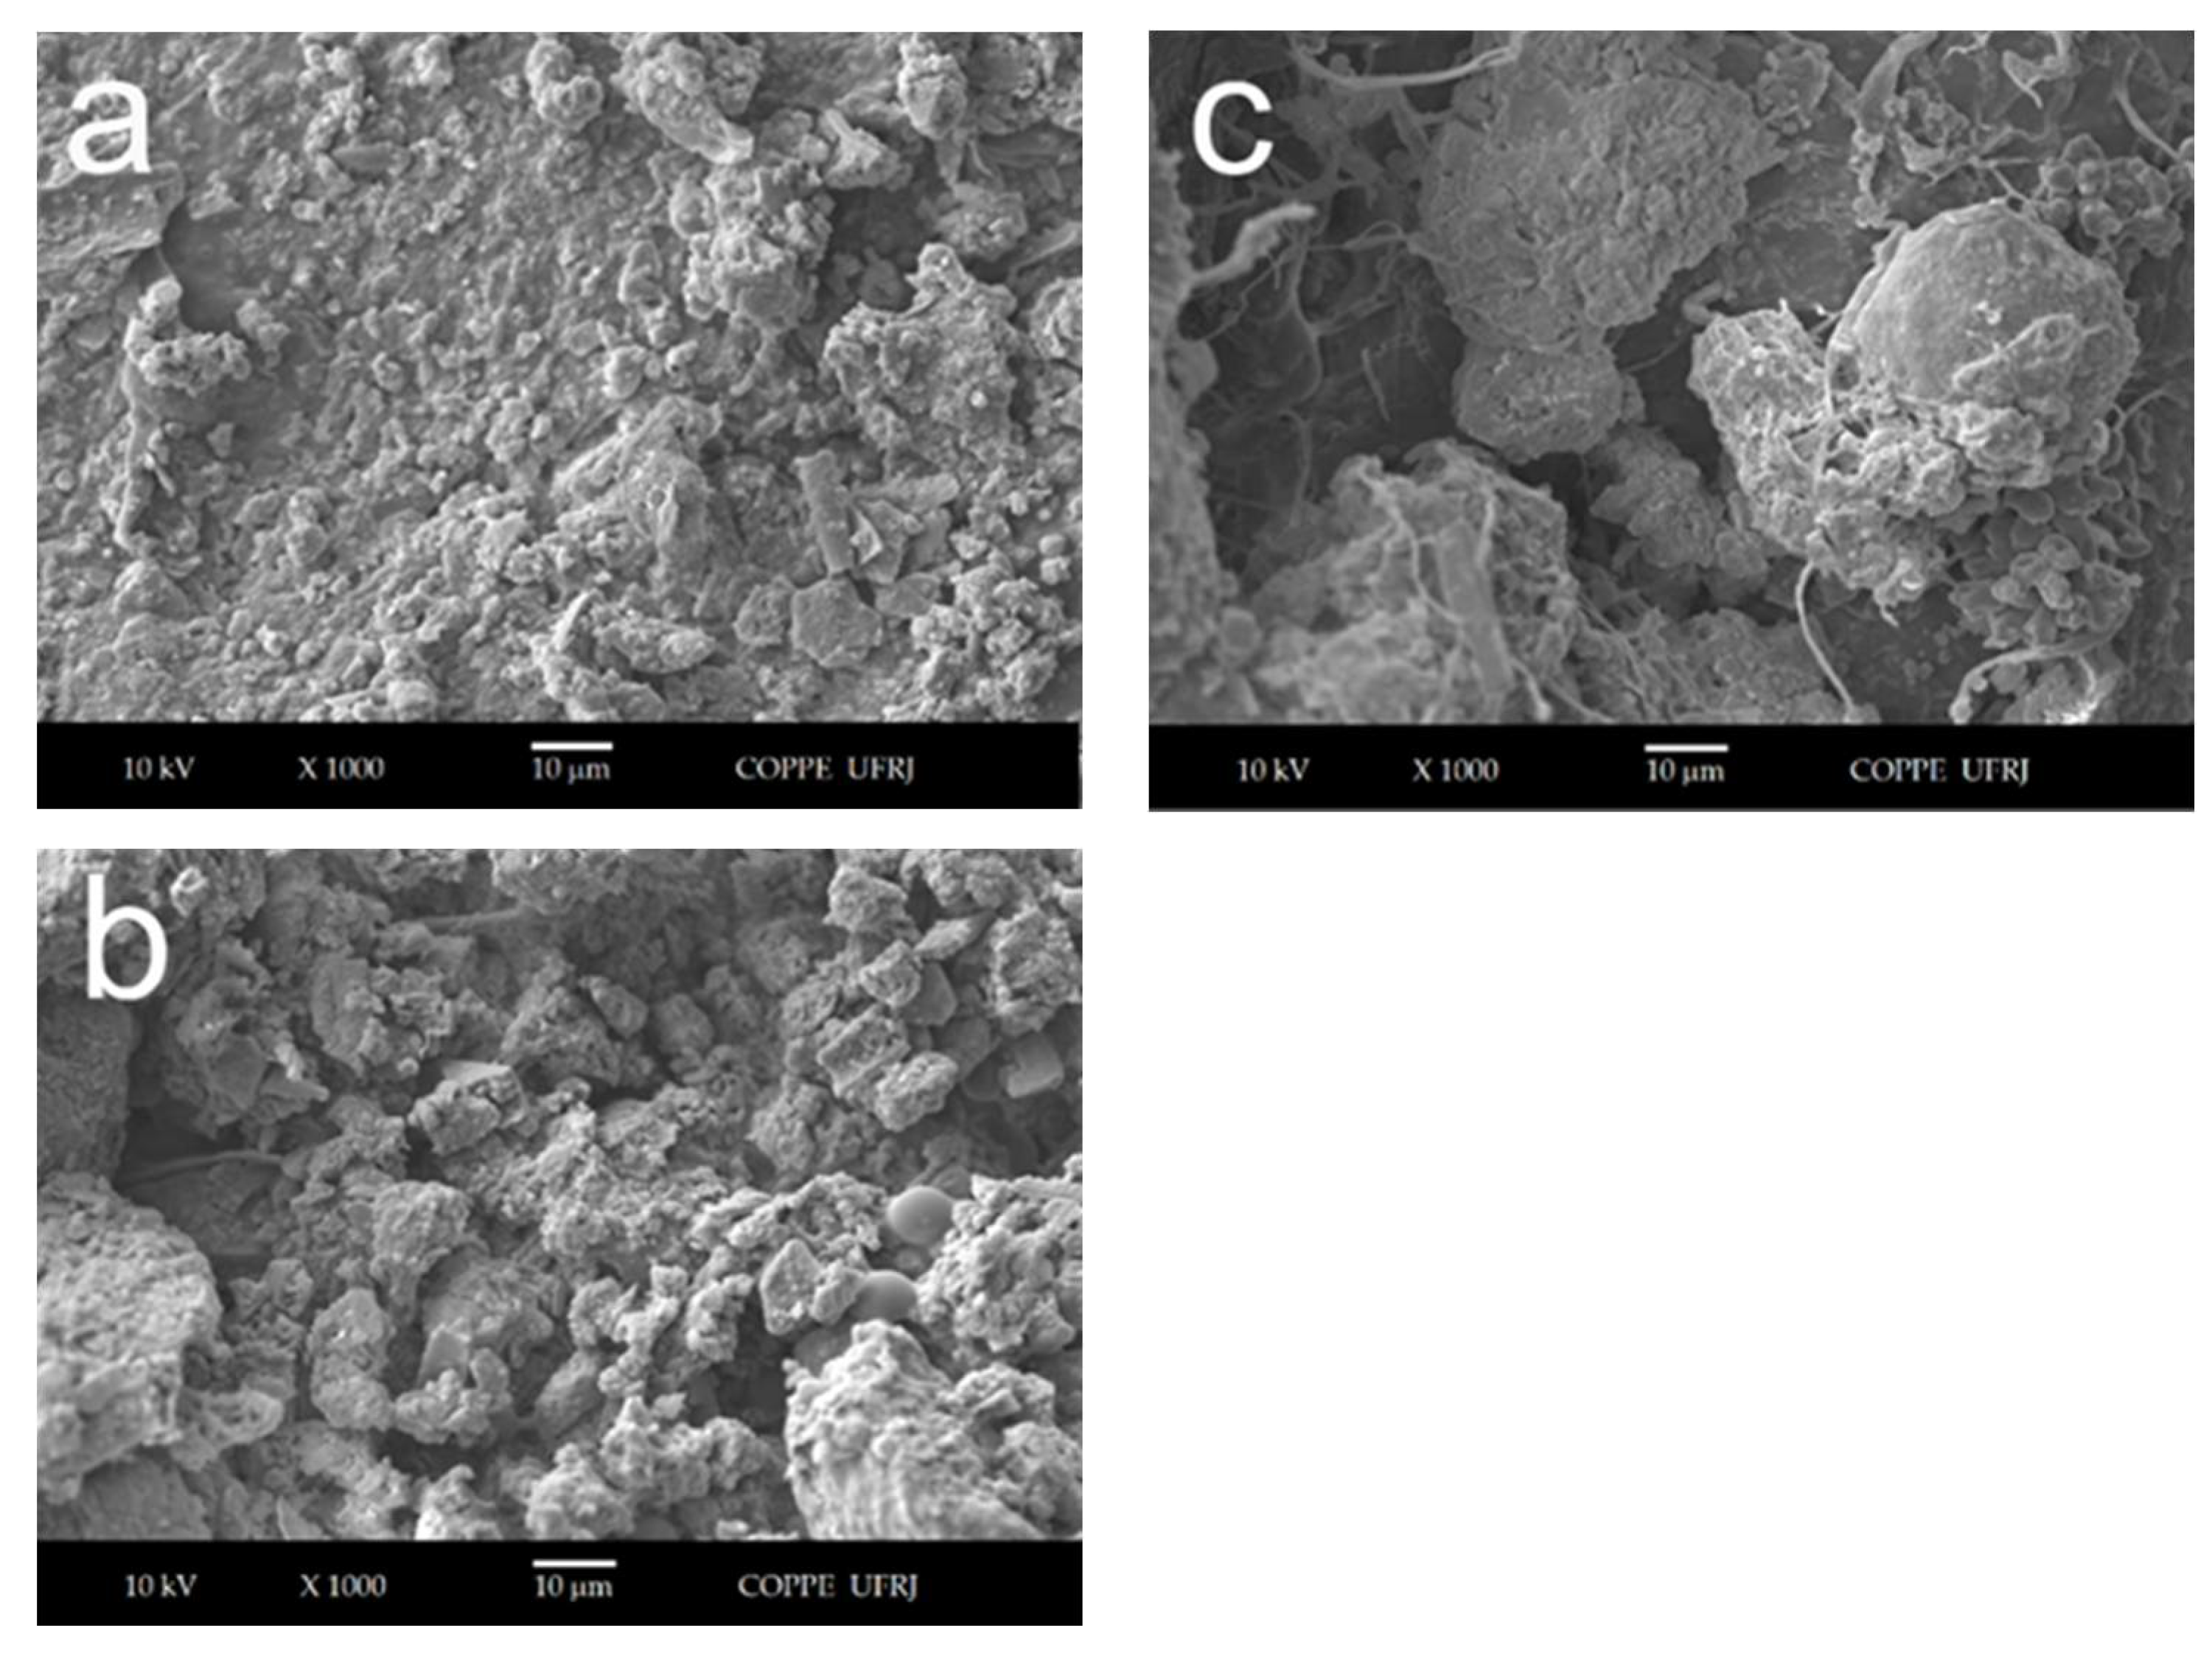
SEM was used to image samples at an advanced stage (90 days) of biodegradation (Figure 7a–c). With the increase in GO content, surface degradation was increased, with the presence of heterogeneous bacterial community (Figure 7c), characteristic of biodegradation in compost soil. In fact, these microorganisms generate enzymes with the ability of breaking starch molecules [39]. As a result of the biodegradation process, the pH of soil decreased from 6.5 ± 0.1, at the initial stage, to 5.9 ± 0.2 at the end of the test, which could also have contributed to deterioration of the starch matrix.
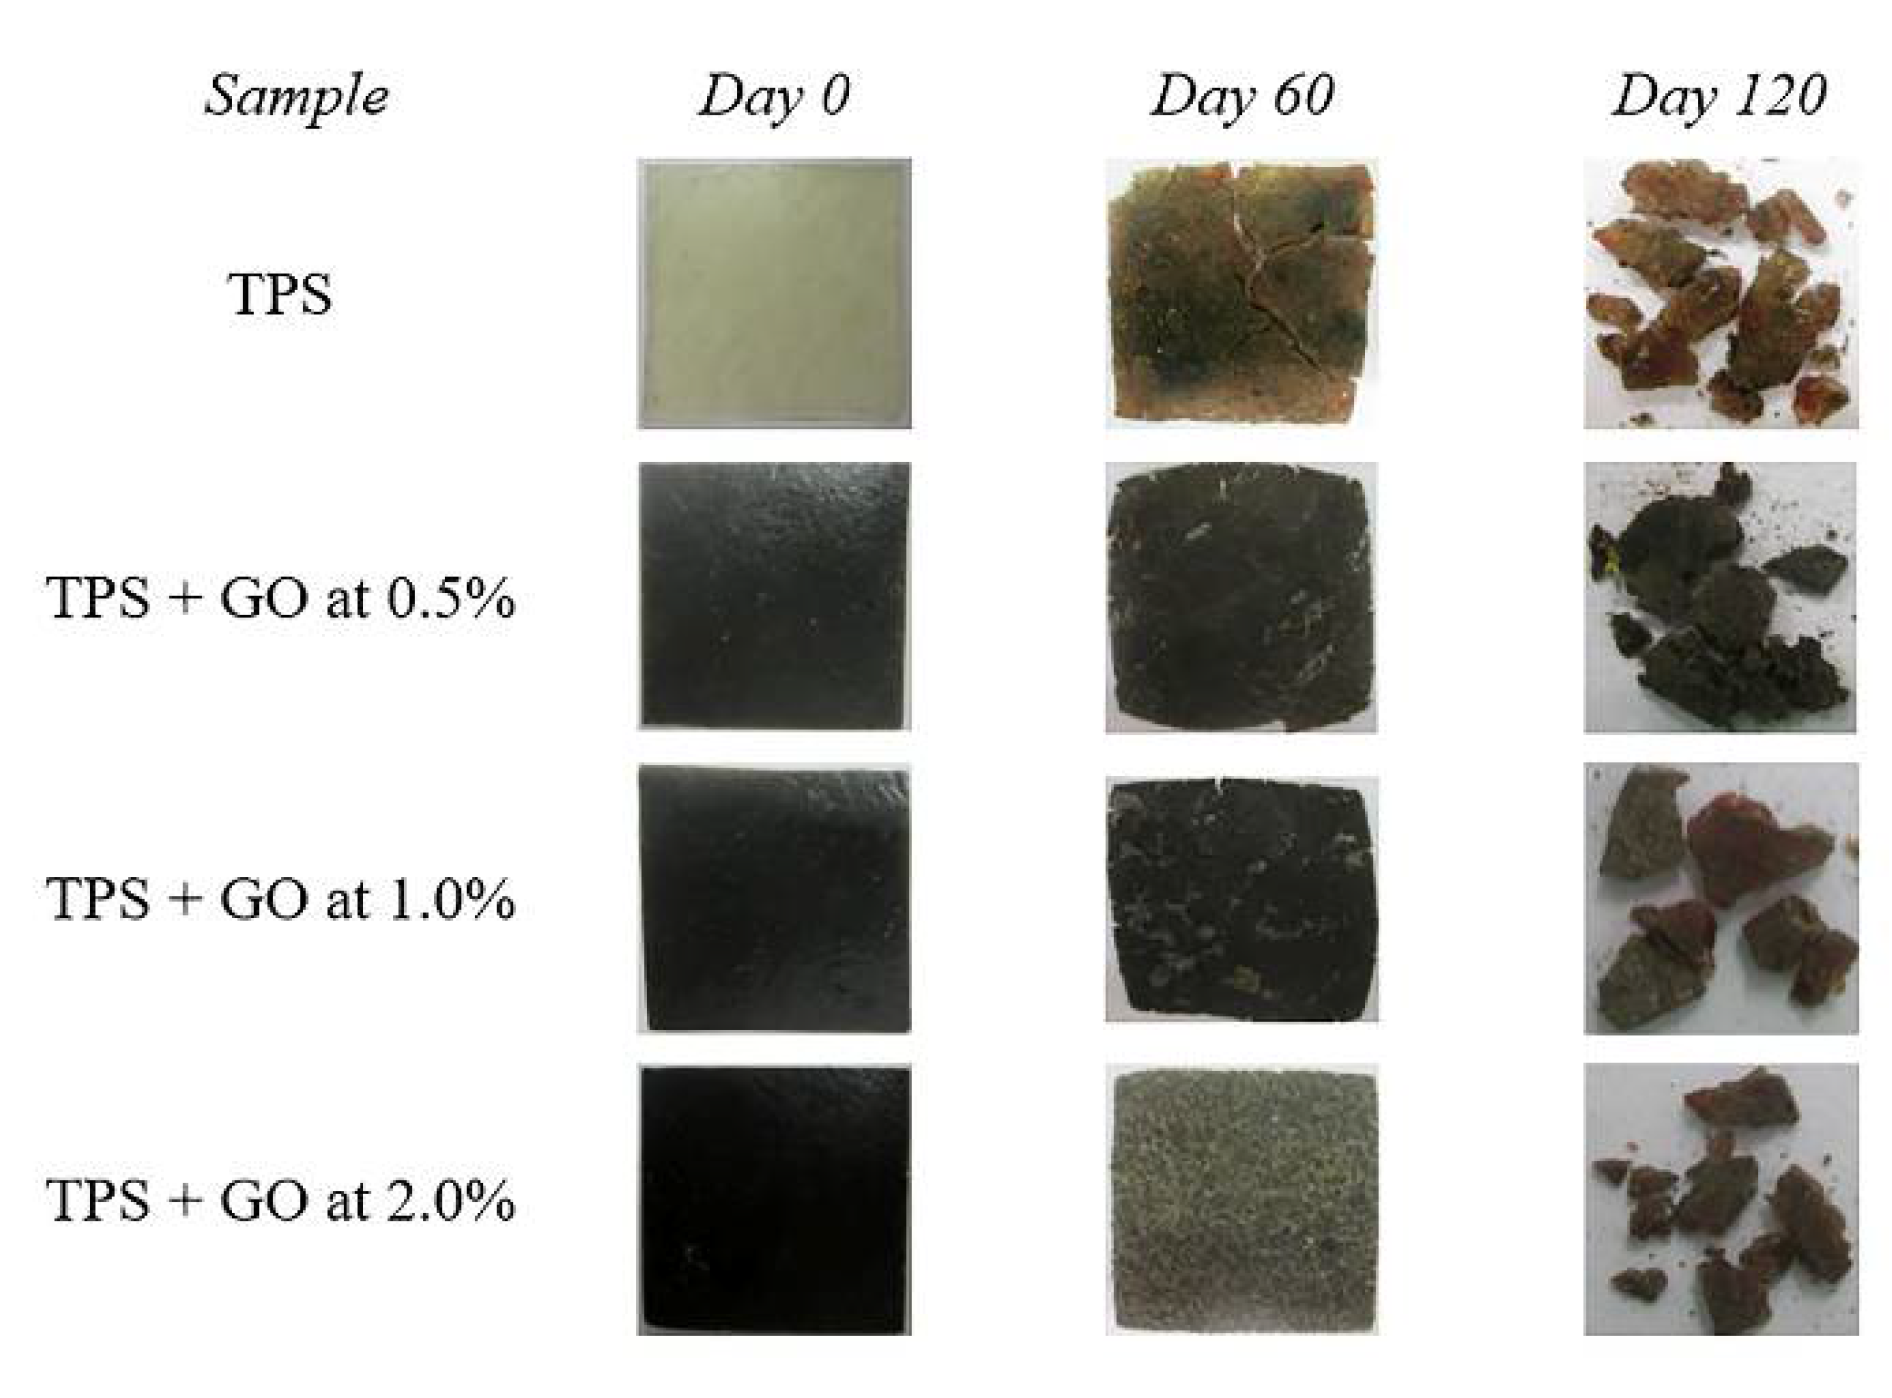
Figure 8 shows photographs taken for TPS and TPS/GO samples over the period of soil burial tests. On day 60, the image indicates mineralization, alteration in color, decrease in thickness and highly rough and eroded surface. On day 120, the specimens appeared as fragments, which were smaller as the GO content increased.
The biodegradation of TPS and TPS/rGO-g under anaerobic conditions was evaluated by cumulative CO2 produced by the specimens during the process (Figure 9). Differently from the soil burial test, in this test the high biodegradation and the remaining fragments after 183 days were smaller. Their mass could not be measured. As may be observed, in relation to neat TPS, the amount of cumulative CO2 increased with the presence of rGO-g. The profile of curves showed an increase in cumulative CO2 in the first 60 days. This result is an indication that the acid groups of rGO-g, as well as in GO, induced the breakage of glycosidic bonds of starch molecules, accelerating their degradation. This result may be explained by the reduction in pH after 183 days of test, which were 6.2 ± 0.1, 5.6 ± 0.1 and 5.8 ± 0.2 for TPS, and TPS with rGO-g incorporated at 1.0 and 2.0 mass%, respectively. Comparing the behavior of TPS/rGO-g composites as a function of filler content, different biodegradation rates were observed. For the sample with rGO-g incorporated at 1.0 mass%, the amount of cumulative CO2 was four times higher than the amount observed for TPS alone. In contrast, for the composite with rGO-g incorporated at 2.0 mass% content, the amount of cumulative CO2 corresponded to twice that determined for TPS. This result seems to indicate that the biodegradation of TPS/rGO-g composites is related to rGO-g dispersion. In the composite with well-exfoliated rGO-g sheets at 1.0 mass% content, the breakage of glycosidic bonds was enhanced. A larger amount of low molar mass starch derivatives was formed, with high hydrophilic character. Certainly, the increase in water absorption favored the action of soil living microorganisms. Conversely, as observed by XRD results, TPS with rGO-g incorporated at 2.0% mass content had a large fraction of intercalated sheets within the starch matrix. These aggregates slowed the biodegradation process. The effect of carbon nanoparticles on a similar environment was reported in the literature. Some authors found that multi-walled carbon nanotubes at high concentrations could decrease the microbial activity and biomass in soils [42]. In contrast, other authors reported that graphene altered the structure of soil bacterial communities by enriching some nitrogen fixing and dissimilatory iron reducing bacteria genus [43]. Comparing TPS/rGO-g composites, the increase in rGO-g mass% content caused a delaying in the biodegradation process. However, the biodegradation process was still faster than for TPS alone.
4. Conclusions
Two graphene derivatives were obtained and characterized. It was demonstrated that glucose was able to partially restore the graphitic structure and reduce the oxygen-containing groups of graphene oxide (GO). GO and glucose-reduced graphene oxide (rGO-g) were incorporated within glycerol-plasticized starch by melt extrusion, leading to TPS/GO and TPS/rGO-g composites. The different wettability of graphene derivatives in TPS was related to their polarity. The high polarity of GO led to higher exfoliation of graphene sheets even at a high mass content. In contrast, the less polar rGO-g led to the intercalation of graphene sheets when incorporated at a higher mass content. Both composites exhibited improvements in mechanical properties. However, TPS/rGO-g composites presented the best mechanical performance because of the good reinforcement effect of reduced graphene sheets. The incorporation of GO and rGO-g increased the biodegradability of the TPS matrix. The results were explained by the assisted breakage of glycosidic bonds of starch molecules by acid groups present in both graphene derivatives. The TPS/GO composites presented increases in biodegradation rate with increasing GO mass content. The TPS/rGO-g samples had the biodegradation rate affected by the dispersion level of rGO-g.
Author Contributions
W.H.F.: conceptualization, methodology, validation, formal analysis, investigation, data curation, writing—original draft preparation, visualization; C.T.A.: conceptualization, funding acquisition, methodology, project administration, resources, supervision, writing—review and editing. All authors have read and agreed to the published version of the manuscript.
Funding
This research was funded by Fundação de Amparo à Pesquisa do Estado do Rio de Janeiro (FAPERJ) (Grant N° E-26/010.000984/2019), Conselho Nacional de Desenvolvimento Científico e Tecnológico (CNPq) (Grant N° 306482/2019) and Coordenação de Aperfeiçoamento de Pessoal de Nível Superior—Brasil (CAPES), Finance Code 001.
Institutional Review Board Statement
Not applicable.
Informed Consent Statement
Not applicable.
Data Availability Statement
The data presented in this study are openly available in Mendeley Data, V1, http://0-dx-doi-org.brum.beds.ac.uk/10.17632/hch7wcchfp.1, accessed on 20 May 2021.
Acknowledgments
Not applicable.
Conflicts of Interest
The authors declare no conflict of interest.
References
- Lambert, S.; Wagner, M. Microplastics are contaminants of emerging concern in freshwater environments: An overview. In Freshwater Microplastics. The Handbook of Environmental Chemistry; Wagner, M., Lambert, S., Eds.; Springer: Cham, Switzerland, 2018; Volume 58, pp. 1–23. [Google Scholar]
- Campanale, C.; Massarelli, C.; Savino, I.; Locaputo, V.; Uricchio, V.F. A detailed review study on potential effects of microplastics and additives of concern on human health. Int. J. Environ. Res. Public Health 2020, 17, 1212–1238. [Google Scholar] [CrossRef] [PubMed] [Green Version]
- Prabhu, T.N.; Prashantha, K. A review on present status and future challenges of starch based polymer films and their composites in food packaging applications. Polym. Compos. 2018, 39, 2499–2522. [Google Scholar] [CrossRef]
- Jullanun, P.; Yoksan, R. Morphological characteristics and properties of TPS/PLA/cassava pulp biocomposites. Polym. Test. 2020, 88, 106522. [Google Scholar] [CrossRef]
- Zhang, Y.; Rempel, C.; Liu, Q. Thermoplastic starch processing and characteristics: A review. Crit. Rev. Food Sci. Nutr. 2014, 54, 1353–1370. [Google Scholar] [CrossRef]
- van Soest, J.J.G.; Benes, K.; de Wit, D. The influence of acid hydrolysis of potato starch on the stress-strain properties of thermoplastic starch. Starch 1996, 47, 429–434. [Google Scholar] [CrossRef]
- Ferreira, W.H.; Andrade, C.T. Characterization of glycerol-plasticized starch and graphene oxide extruded hybrids. Ind. Crop. Prod. 2015, 77, 684–690. [Google Scholar] [CrossRef]
- Ferreira, W.H.; Dahmouche, K.; Andrade, C.T. Tuning the mechanical and electrical conductivity properties of graphene-based thermoplastic starch/poly(lactic acid) hybrids. Polym. Compos. 2018, 40, E1131–E1142. [Google Scholar] [CrossRef]
- Diaz, C.A.; Shah, R.K.; Evans, T.; Trabold, T.A.; Draper, K. Thermoformed containers based on starch and starch/coffee waste biochar composites. Energies 2020, 13, 6034–6043. [Google Scholar] [CrossRef]
- Mohan, T.P.; Kanny, K. Thermoforming studies of corn starch-derived biopolymer film filled with nanoclays. J. Plast. Film Sheeting 2016, 32, 163–188. [Google Scholar] [CrossRef]
- Wang, Y.; Li, S.; Yang, H.; Luo, J. Progress in the functional modification of graphene/graphene oxide: A review. RSC Adv. 2020, 10, 15328–15345. [Google Scholar]
- Catania, F.; Marras, E.; Giorcelli, M.; Jagdale, P.; Lavagna, L.; Tagliaferro, A.; Bartoli, M. A review on recent advancements of graphene and graphene-related materials in biological applications. Appl. Sci. 2021, 11, 614. [Google Scholar] [CrossRef]
- Chen, J.; Zhang, Y.; Zhang, M.; Yao, B.; Li, Y.; Huang, L.; Li, C.; Shi, G. Water-enhanced oxidation of graphite to graphene oxide with controlled species of oxygenated group. Chem. Sci. 2016, 7, 1874–1881. [Google Scholar] [CrossRef] [PubMed] [Green Version]
- Shin, H.-J.; Kim, K.K.; Benayad, A.; Yoon, S.-M.; Park, H.K.; Jung, I.-S.; Jin, M.-H.; Jeong, H.K.; Kim, J.M.; Choi, J.-Y.; et al. Efficient reduction of graphite oxide by sodium borohydride and its effect on electrical conductance. Adv. Funct. Mater. 2009, 19, 1987–1992. [Google Scholar] [CrossRef]
- Compton, O.C.; Nguyen, S.T. Graphene Oxide, highly reduced graphene oxide, and graphene: Versatile building blocks for carbon-based materials. Small 2010, 6, 711–723. [Google Scholar] [CrossRef]
- De Silva, K.K.H.; Huang, H.-H.; Yoshimura, M. Progress of reduction of graphene oxide by ascorbic acid. Appl. Surf. Sci. 2018, 447, 338–346. [Google Scholar] [CrossRef]
- Zhu, C.; Guo, S.; Fang, Y.; Dong, S. Reducing sugar: New functional molecules for the green synthesis of graphene nanosheets. ACS Nano 2010, 4, 2429–2437. [Google Scholar] [CrossRef]
- Akhavan, O.; Ghaderi, E.; Aghayee, S.; Fereydooni, Y.; Talebi, S. The use of a glucose-reduced graphene oxide suspension for photothermal cancer therapy. J. Mater. Chem. 2012, 22, 13773–13781. [Google Scholar] [CrossRef]
- Avila-Orta, C.A.; Corral, F.S.; Fonseca-Florido, H.A.; Aguilar, F.I.E.; Rosales, S.G.S.; Padilla, J.M.; Morones, P.G.; Tavizon, S.F.; Hernandez, E.H. Starch-graphene oxide bionanocomposites prepared through melt mixing. J. Appl. Polym. Sci. 2017, 135, 46037–46045. [Google Scholar] [CrossRef]
- Ma, T.; Chang, P.R.; Zheng, P.; Ma, X. The composites based on plasticized starch and graphene oxide/reduced graphene oxide. Carbohydr. Polym. 2013, 94, 63–70. [Google Scholar] [CrossRef]
- Peregrino, P.P.; Sales, M.J.A.; Silva, M.F.P.; Soler, M.A.G.; Silva, L.F.L.; Moreira, S.G.C.; Paterno, L.G. Thermal and electrical properties of starch-graphene oxide nanocomposites improved by photochemical treatment. Carbohydr. Polym. 2014, 106, 305–311. [Google Scholar] [CrossRef]
- Luckachan, G.E.; Pillai, C.K.S. Biodegradable Polymers—A Review on recent trends and emerging perspectives. J. Polym. Environ. 2011, 19, 637–676. [Google Scholar] [CrossRef]
- Reddy, M.M.; Vivekanandhan, S.; Misra, M.; Bhatia, S.K.; Mohanty, A.K. Biobased plastics and bionanocomposites: Current status and future opportunities. Prog. Polym. Sci. 2013, 38, 1653–1689. [Google Scholar] [CrossRef]
- Fukushima, K.; Abbate, C.; Tabuani, D.; Gennari, M.; Camino, G. Biodegradation of poly(lactic acid) and its nanocomposites. Polym. Degrad. Stab. 2009, 94, 1646–1655. [Google Scholar] [CrossRef]
- Magalhães, N.F.; Andrade, C.T. Thermoplastic corn starch/clay hybrids: Effect of clay type and content on physical properties. Carbohydr. Polym. 2009, 75, 712–718. [Google Scholar] [CrossRef]
- Julinová, M.; Vaňharová, L.; Jurča, M.; Minařík, A.; Duchek, P.; Jana Kavečková, J.; Rouchalová, D.; Skácelík, P. Effect of different fillers on the biodegradation rate of thermoplastic starch in water and soil environments. J. Polym. Environ. 2020, 28, 566–583. [Google Scholar] [CrossRef]
- Dogossy, G.; Czigany, T. Thermoplastic starch composites reinforced by agricultural by-products: Properties, biodegradability, and application. J. Reinf. Plast. Comp. 2011, 30, 1819–1825. [Google Scholar] [CrossRef]
- Prachayawarakorn, J.; Ruttanabus, P.; Boonsom, P. Effect of cotton fiber contents and lengths on properties of thermoplastic starch composites prepared from rice and waxy rice starches. J. Polym. Environ. 2011, 19, 274–282. [Google Scholar] [CrossRef]
- Ferreira, W.H.; Dahmouche, K.; Andrade, C.T. Dispersion of reduced graphene oxide within thermoplastic starch/poly(lactic acid) blends investigated by small-angle X-ray scattering. Carbohydr. Polym. 2019, 208, 124–132. [Google Scholar] [CrossRef]
- Bher, A.; Unalan, I.U.; Auras, R.; Rubino, M.; Schvezov, C.E. Graphene modifies the biodegradation of poly(lactic acid)-thermoplastic cassava starch reactive blend films. Polym. Degrad. Stab. 2019, 164, 187–197. [Google Scholar] [CrossRef]
- Marcano, D.C.; Kosynkin, D.V.; Berlin, J.M.; Sinitskii, A.; Sun, Z.; Slesarev, A.; Alemany, L.B.; Lu, W.; Tour, J.M. Improved synthesis of graphene oxide. ACS Nano 2010, 4, 4806–4814. [Google Scholar] [CrossRef]
- Vatandost, E.; Ghorbani-HasanSaraei, A.; Chekin, F.; Raeisi, S.N.; Shahidi, S.-A. Green tea extract assisted green synthesis of reduced graphene oxide: Application for highly sensitive electrochemical detection of sunset yellow in food products. Food Chem. X 2020, 6, 100085. [Google Scholar] [CrossRef]
- Wang, S.; Zhang, Y.; Abidi, N.; Cabrales, L. Wettability and surface free energy of graphene films. Langmuir 2009, 25, 11078–11081. [Google Scholar] [CrossRef] [PubMed]
- Mei, X.; Ouyang, J. Ultrasonication-assisted ultrafast reduction of graphene oxide by zinc powder at room temperature. Carbon 2011, 49, 5389–5397. [Google Scholar] [CrossRef]
- Tien, H.N.; Luan, V.H.; Lee, T.K.; Kong, B.S.; Chung, J.S.; Kim, E.J.; Hur, S.H. Enhanced solvothermal reduction of graphene oxide in a mixed solution of sulfuric acid and organic solvent. Chem. Eng. J. 2012, 212, 97–103. [Google Scholar] [CrossRef]
- Ahamad, D.; van den Boogaert, I.; Miller, J.; Presswell, R.; Jouhara, H. Hydrophilic and hydrophobic materials and their applications. Energy Sources Part A 2018, 40, 2686–2725. [Google Scholar] [CrossRef]
- Van Soest, J.J.G.; Hulleman, S.H.D.; de Wit, D.; Vlieglenthart, J.F.G. Crystallinity in starch bioplastics. Ind. Crops Prod. 1996, 5, 11–22. [Google Scholar] [CrossRef] [Green Version]
- Li, R.; Liu, C.; Ma, J. Studies on the properties of graphene oxide reinforced starch biocomposites. Carbohydr. Polym. 2011, 84, 631–637. [Google Scholar] [CrossRef]
- Zain, A.H.M.; Ab Wahab, M.K.; Ismail, H. Biodegradation behaviour of thermoplastic starch: The roles of carboxylic acids on cassava starch. J. Polym. Environ. 2018, 26, 691–700. [Google Scholar] [CrossRef]
- Ebajo, V.D.; Santos, C.R.L.; Alea, G.V.; Lin, Y.A.; Chen, C.-H. Regenerable acidity of graphene oxide in promoting multicomponent organic synthesis. Sci. Rep. 2019, 9, 15579–15590. [Google Scholar] [CrossRef]
- Lerf, A.; He, H.; Forster, M.; Klinowski, J. Structure of graphite oxide revisited. J. Phys. Chem. B 2010, 102, 4477–4482. [Google Scholar] [CrossRef]
- Chung, H.; Son, Y.; Yoon, K.; Kim, S.; Kim, W. The effect of multi-walled carbon nanotubes on soil microbial activity. Ecotoxic. Environ. Saf. 2011, 74, 569–575. [Google Scholar] [CrossRef] [PubMed]
- Du, J.; Hu, X.; Zhou, Q. Graphene oxide regulates the bacterial community and exhibits property changes in soil. RSC Adv. 2015, 5, 27009–27017. [Google Scholar] [CrossRef]
Figure 1.
(a) FTIR spectra for GO (trace I) and rGO-g (trace II). (b) UV-vis absorption spectra for GO (continuous line) and rGO-g (dashed line) dispersions, photographs of GO and rGO-g sonicated solutions at 0.01 g/L.
Figure 1.
(a) FTIR spectra for GO (trace I) and rGO-g (trace II). (b) UV-vis absorption spectra for GO (continuous line) and rGO-g (dashed line) dispersions, photographs of GO and rGO-g sonicated solutions at 0.01 g/L.

Figure 2.
Contact angles of water as a function of contact time (a) for GO (squares) and rGO-g (circles) films; photograph of water droplet on GO (b) and rGO-g (c) films.
Figure 2.
Contact angles of water as a function of contact time (a) for GO (squares) and rGO-g (circles) films; photograph of water droplet on GO (b) and rGO-g (c) films.

Figure 3.
X-ray diffractograms in the 0.9° to 35.0° (2θ) range for (a) GO (trace I), TPS (trace II) and TPS with GO incorporated at 0.5 mass% (trace III), 1.0 mass% (trace IV) and 2.0 mass% (trace V) contents; (b) rGO-g (trace I), TPS (trace II) and TPS with rGO-g incorporated at 0.5 mass% (trace III), 1.0 mass% (trace IV) and 2.0 mass% (trace V) contents.

Figure 4.
TEM image for TPS with GO incorporated at 1.0 mass% content.

Figure 5.
Stress versus strain curves for (a) TPS (closed squares), and TPS with GO incorporated at 0.5 mass% (squares), 1.0 mass% (triangles) and 2.0 mass% (circles) contents; (b) TPS (full squares), TPS with rGO incorporated at 0.5 mass% (squares), 1.0 mass% (triangles) and 2.0 mass% (circles) contents.

Figure 6.
Remaining mass for TPS (closed squares), TPS with GO incorporated at 0.5 mass% (squares), 1.0 mass% (triangles) and 2.0 mass% (circles) during biodegradation in soil for 120 days.
Figure 6.
Remaining mass for TPS (closed squares), TPS with GO incorporated at 0.5 mass% (squares), 1.0 mass% (triangles) and 2.0 mass% (circles) during biodegradation in soil for 120 days.

Figure 7.
SEM images taken from surfaces of specimens after 90 days of incubation; TPS (a), TPS incorporated with GO at 1.0 (b) and 2.0 mass% (c) contents.
Figure 7.
SEM images taken from surfaces of specimens after 90 days of incubation; TPS (a), TPS incorporated with GO at 1.0 (b) and 2.0 mass% (c) contents.

Figure 8.
Photographs of TPS/GO samples submitted to soil burial biodegradation tests.

Figure 9.
Average cumulative carbon dioxide production from TPS (full squares), TPS incorporated with rGO-g at 1.0 mass% (triangles) and 2.0 mass% (circles) contents for 183 days.
Figure 9.
Average cumulative carbon dioxide production from TPS (full squares), TPS incorporated with rGO-g at 1.0 mass% (triangles) and 2.0 mass% (circles) contents for 183 days.

Publisher’s Note: MDPI stays neutral with regard to jurisdictional claims in published maps and institutional affiliations. |
© 2021 by the authors. Licensee MDPI, Basel, Switzerland. This article is an open access article distributed under the terms and conditions of the Creative Commons Attribution (CC BY) license (https://creativecommons.org/licenses/by/4.0/).
Share and Cite
MDPI and ACS Style
Ferreira, W.H.; Andrade, C.T. Physical and Biodegradation Properties of Graphene Derivatives/Thermoplastic Starch Composites. Polysaccharides 2021, 2, 582-593. https://0-doi-org.brum.beds.ac.uk/10.3390/polysaccharides2030035
AMA Style
Ferreira WH, Andrade CT. Physical and Biodegradation Properties of Graphene Derivatives/Thermoplastic Starch Composites. Polysaccharides. 2021; 2(3):582-593. https://0-doi-org.brum.beds.ac.uk/10.3390/polysaccharides2030035
Chicago/Turabian StyleFerreira, Willian Hermogenes, and Cristina Tristão Andrade. 2021. "Physical and Biodegradation Properties of Graphene Derivatives/Thermoplastic Starch Composites" Polysaccharides 2, no. 3: 582-593. https://0-doi-org.brum.beds.ac.uk/10.3390/polysaccharides2030035