
Debenzylation of Benzyl-Protected Methylcellulose
by
 , , and
Payam Hashemi
1,* ,
,
Saskia Wenderoth
1,
Andreas Koschella
2,
Thomas Heinze
2 and
Petra Mischnick
1,* 1
Institute of Food Chemistry, Technische Universität Braunschweig, Schleinitzstraße 20, 38106 Braunschweig, Germany
2
Institute of Organic Chemistry and Macromolecular Chemistry, Faculty of Chemistry and Earth Sciences, Friedrich Schiller University Jena, Humboldtstraße 10, 07743 Jena, Germany
*
Authors to whom correspondence should be addressed.
Polysaccharides 2022, 3(3), 458-479; https://0-doi-org.brum.beds.ac.uk/10.3390/polysaccharides3030028
Submission received: 3 April 2022
/
Revised: 6 June 2022
/
Accepted: 15 June 2022
/
Published: 22 June 2022
(This article belongs to the Special Issue Eco-friendly/Sustainable Approach to Polysaccharides as (nano) materials)
Abstract
:Methyl cellulose and its derivatives are widely used in the food industry, cosmetics, and as construction materials. The properties of methyl celluloses (MC) strongly depend on their degrees and positions of substitution. In order to generate MCs with uncommon blocky substitution, we apply fully protected O-benzyl-O-methyl celluloses (BnMC). Such complex polysaccharide derivatives could not be deprotected completely and without shift of the composition by methods usually applied to mono- and oligosaccharides. Therefore, a facile debenzylation method was developed based on photo-initiated free-radical bromination in the presence of hydrobromic acid scavengers followed by alkaline treatment. The reaction proceeds under homogeneous conditions and without the aid of any catalyst. There is no need for expensive equipment, materials, anhydrous reagents, or running the reaction under anhydrous conditions. Reaction parameters were investigated and optimized for successful debenzylation of completely protected BnMC with degrees of methyl substitution (DSMe) around 1.9 (and DSBn around 1.1). Side-product-free and almost complete debenzylation was achieved when 1,2-epoxybutane (0.5 eq./eq. N-bromosuccinimide) and 2,6-di-tert-butylpyridine (0.5 eq./eq. N-bromosuccinimide) were used in the reaction. Furthermore, ATR-IR and 1H NMR spectroscopy confirmed the successful removal of benzyl ether groups. The method was developed to monitor the transglycosylation reaction of the BnMC with permethylated cellulose, for which the deprotection of many small samples in parallel is required. This comprises the determination of the methyl pattern in the glucosyl units by gas-liquid chromatography (GLC), as well as oligosaccharide analysis by liquid chromatography mass spectrometry (LC-MS) after perdeuteromethylation and partial hydrolysis to determine the methyl pattern in the chains. The unavoidable partial chain degradation during debenzylation does not interfere with this analytical application, but, most importantly, the DS and the methyl pattern were almost congruent for the debenzylated product and the original MC, indicating the full success of this approach The presented method provides an unprecedented opportunity for high throughput and parallel debenzylation of complicated glucans, such as BnMC (as a model compound), for analytical purposes. For comparison, debenzylation using Na/NH3 was applied to BnMC and resulted in a completely debenzylated product with a remarkably high recovery yield of 99 mol% and is, thus, the method of choice for synthetic applications, e.g., for the transglycosylation product prepared under the selected conditions in a preparative scale.
1. Introduction
Benzyl ethers are widely used for the orthogonal protection of hydroxy groups in organic and especially carbohydrate chemistry mainly due to their base- and relative acid stability, and tolerance towards manipulation of many other protecting groups [1,2,3,4,5]. Amongst the numerous examples of benzylation and debenzylation strategies reported so far, etherification of the hydroxy groups with benzyl bromide (BnBr) in the presence of a strong base, such as NaH in N,N-dimethylformamide, is the most common method for protection in carbohydrate chemistry, whereas heterogeneous catalytic hydrogenation using a carbon-supported palladium catalyst (Pd/C) or treatment with sodium in liquid ammonia (Na/NH3(liq.)) is normally used for deprotection [6,7,8,9,10,11,12,13,14,15,16,17,18]. However, the application of a benzyl ether protection-deprotection strategy to polysaccharides, particularly β-glucans, is not as straightforward as for mono- and oligosaccharides. There have been improvements in the benzylation of β-glucans [19,20,21,22,23] and some examples of debenzylation of low molecular weight (Mw) synthetic cellulose (with a degree of polymerization (DP) around 20) [12,24,25,26,27], as well as of regioselectively synthesized cellulose derivatives [28,29,30] by heterogeneous catalytic hydrogenation. However, facile debenzylation of high Mw benzylated β-glucans remained an issue mainly due to their low solubility and the tendency of deprotected products to adsorb on the catalysts (which rendered the catalysts inefficient) in the case of hydrogenation in the presence of Pd/C [31,32]. In particular, the linear β-1,4-glucan cellulose is a critical example in this regard. In the case of treatment with Na/NH3(liq.), poor compatibility of certain reactants and products with the inorganic reagents has been reported [33].
For a better understanding of the background and our motivation for studying the alternative debenzylation method presented in this paper, the following experience of ours will first be briefly outlined. As part of a research project conducted in our lab, glucan ether multi-block-copolymers comprising of water-soluble blocks of methylcellulose (with a degree of substitution (DS) ~1.9, meaning that on average of about 1.9 of the available 3 substitution sites on each anhydroglucose unit are substituted with methyl groups), interrupted by hydrophobic blocks of permethylated anhydroglucose units (per-Me-AGU), were synthesized. This is performed by transglycosylation between Bn-protected MC (BnMC) and permethylated cellulose (per-MC) based on a similar strategy as introduced by Rother et al. [34] and further investigated by Hashemi and Mischnick [35]. It is of crucial importance to outline that such products are not uniform, but instead show dispersity with respect to average molecular weight (Mw), average block length (BL), and the distribution of blocks along the polymer chains. Additionally, all these structural features are important for their properties. Debenzylation of BnMC comprising randomly and fully O-methylated blocks generates the glucan ether block-copolymers with hydrophilic and hydrophobic blocks. For the monitoring and optimization of the transglycosylation reaction, many reactions were performed in parallel. Several samples were taken during each reaction for time-course studies [36] to analyze their methyl pattern and average block length by LCMS of oligosaccharide domains [35,37,38,39]. Accordingly, to handle a large number of samples in parallel and prepare them for further structural characterization by monomer analysis using GLC [40], and oligomer analysis using quantitative mass spectrometry, a reliable and facile debenzylation method was highly required that could be safely performed on a daily basis. Obviously, treatment of the samples with Na/NH3(liq.) at −78 °C could not meet those criteria since it requires the full-time attention of skilled operators and, thus, might not be suitable for day-to-day operations. On the other hand, the methyl distribution of the debenzylated products had to be representative of the material before debenzylation. Both initially used materials, BnMC and MC, have to be recovered in the product in the ratio applied. A reason for this was to preserve the physicochemical properties of the partially methylated blocks, e.g., water-solubility and thermogelation [41]. Consequently, any selective loss of the material had to be avoided during the debenzylation, work-up, and purification steps.
As mentioned above, neither of the tried common methods of debenzylation of polysaccharides (refer to the results and discussion Section 3) fulfilled such requirements (due to incomplete debenzylation, biased recovery of only certain substitution patterns, i.e., highly methylated domains, and severe degradation of the product that resulted in the complete loss of the product during the work-up procedures). Ultimately, the demand for a facile yet efficient debenzylation method motivated us to conduct comprehensive optimization of debenzylation by photo-initiated free-radical bromination and subsequent alkaline hydrolysis (Scheme 1).
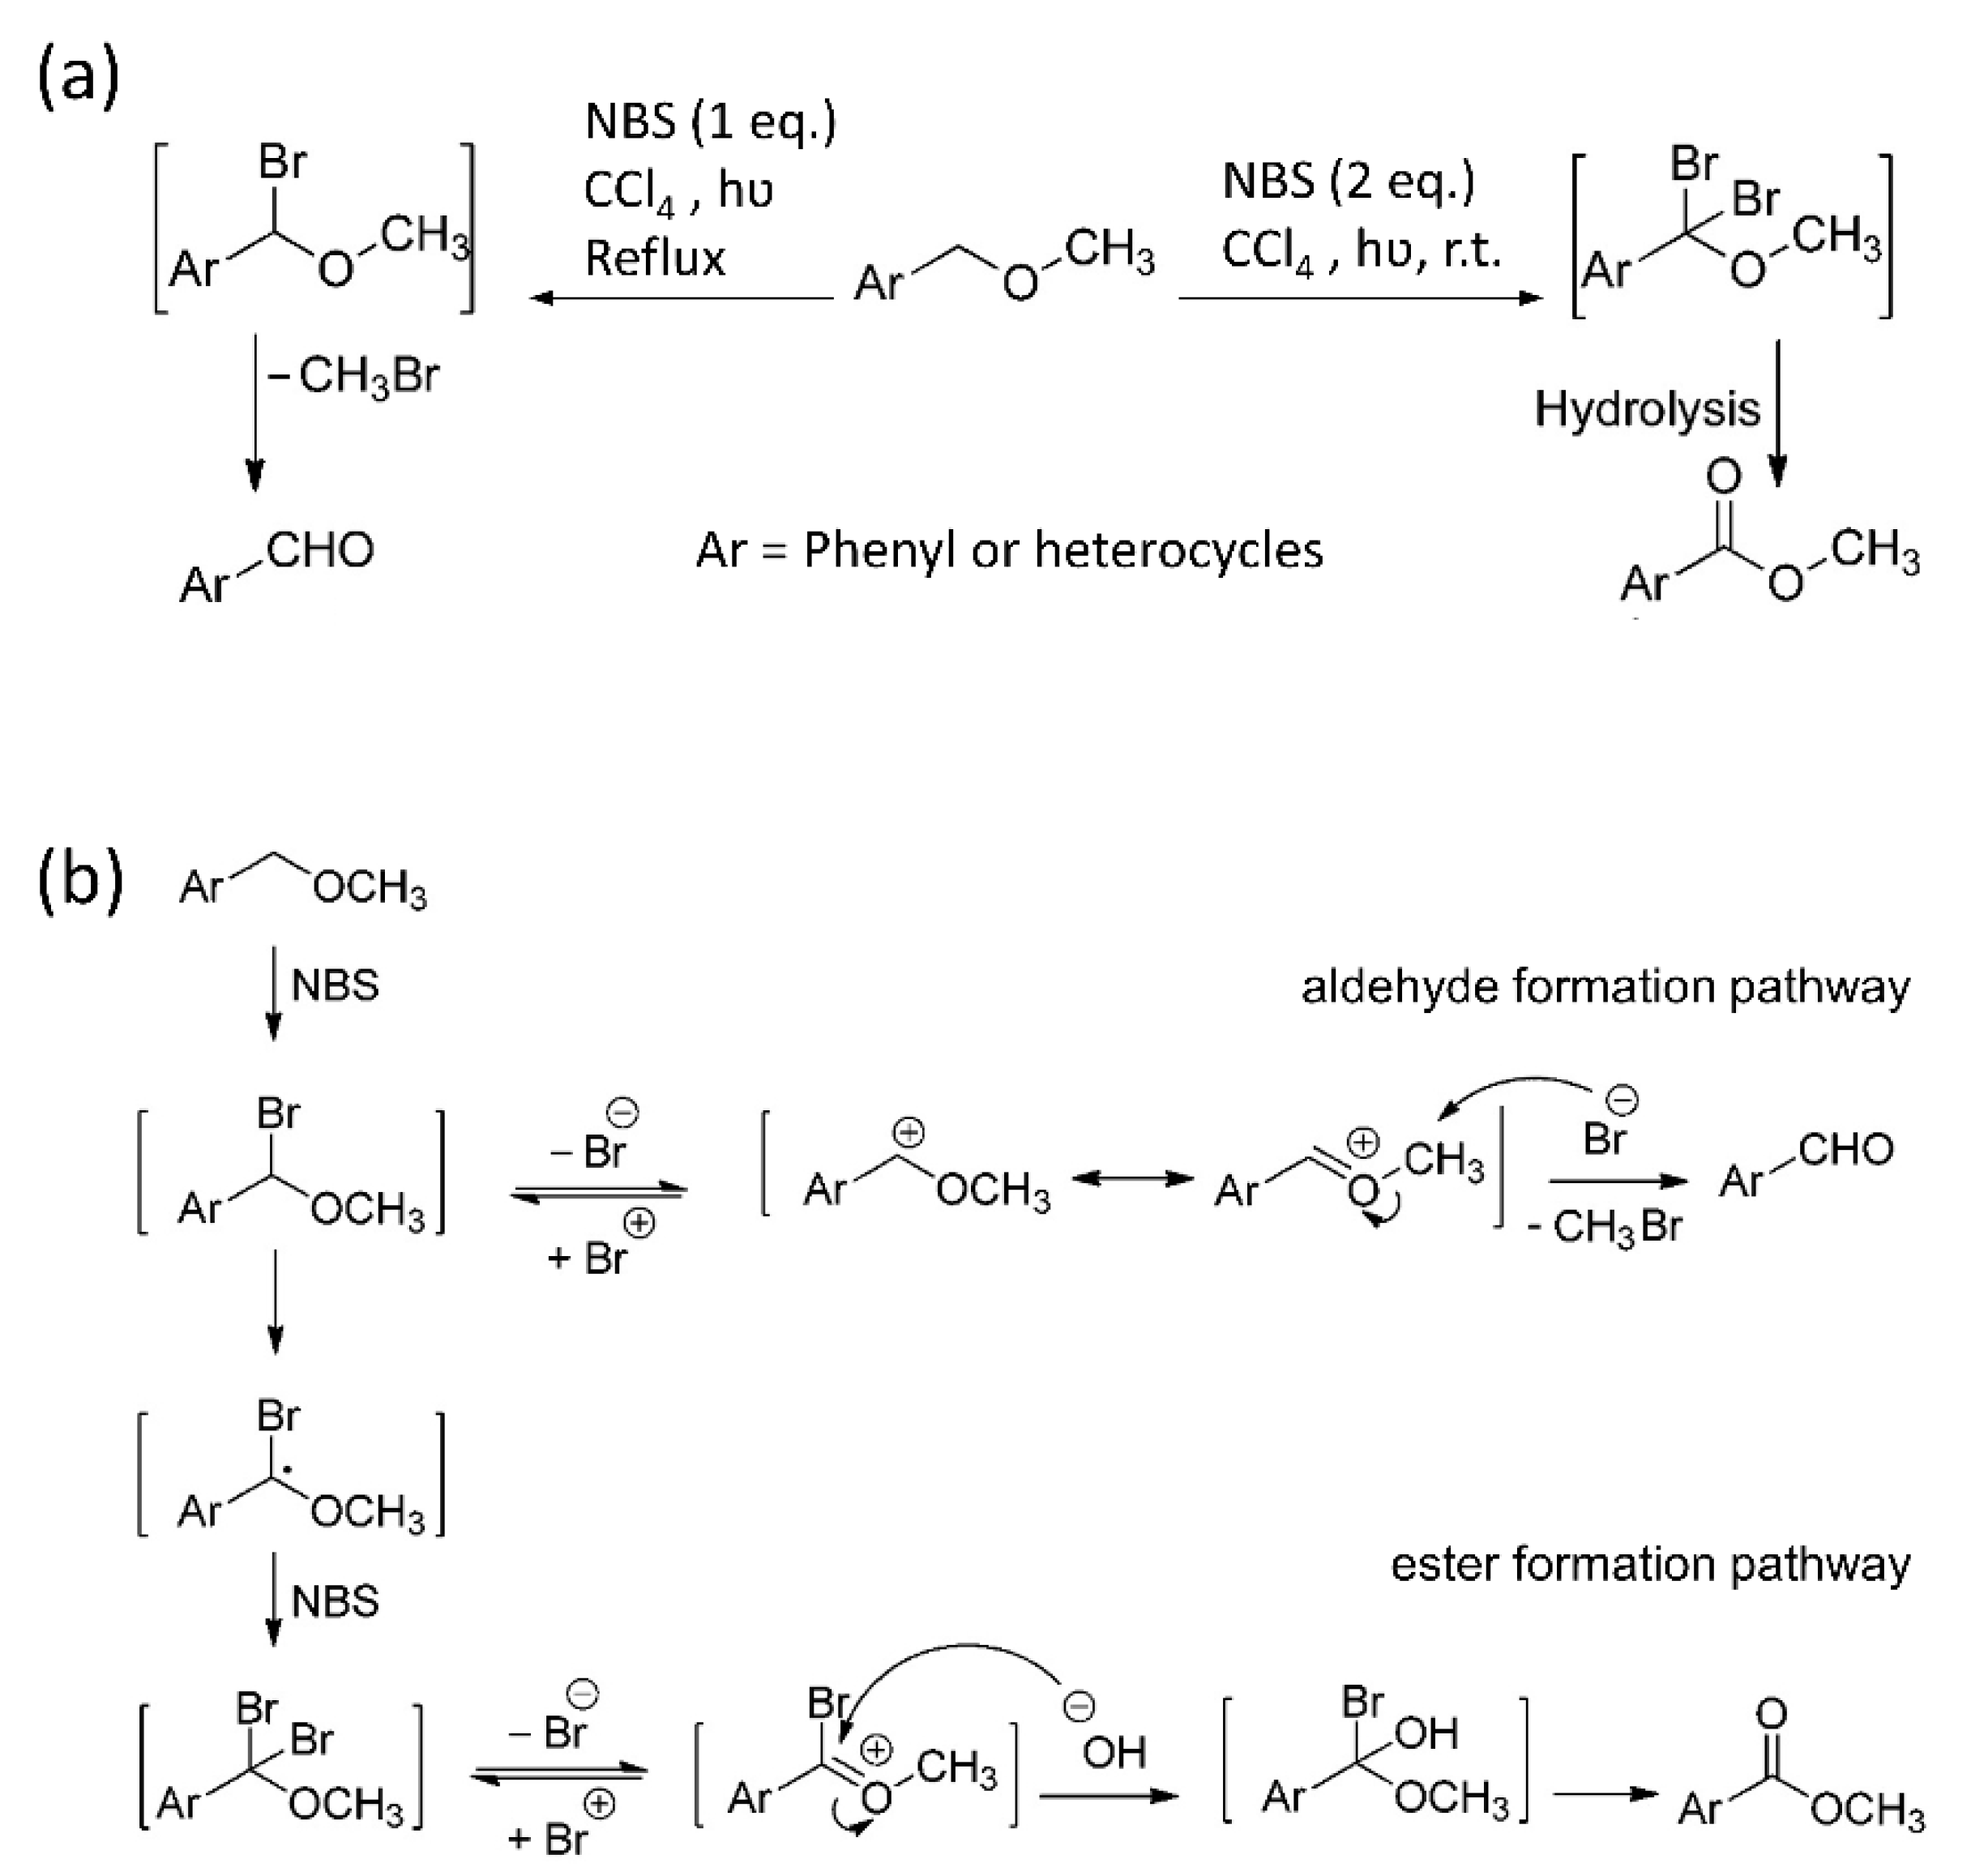
BeMiller et al. [32] reported this method using bromine in a non-polar solvent at 0–10 °C. The suggested mechanism for this reaction was the bromination of one of the benzylic hydrogens to form a stable α-bromobenzyl ether derivative in an apparently quantitative yield. Subsequent alkaline hydrolysis by saturated sodium carbonate or calcium hydroxide generated benzaldehyde and the corresponding carbohydrate. The method was tested for the debenzylation of several Bn-protected monosaccharides, a maltooligosaccharide derivative, and an amylose derivative (DP > 20), and backed up with more detailed mechanistic studies and, finally, a comparison of differences to non-carbohydrate benzyl ether analogs was outlined [42]. Four decades later, it was shown that the mechanism of oxidation of benzyl methyl ether with N-bromosuccinimide (NBS) depends on the amount of NBS and the reaction temperature (Scheme 2a) [43].
Accordingly, they proposed the mechanism shown in Scheme 2b for the formation of aromatic aldehydes or esters via mono- or dibrominated intermediates, respectively [43]. The pathway to aldehyde formation is not common in carbohydrate chemistry [44]. Alkaline treatment of the esters formed will be the last step of debenzylation. To suppress the local concentration of hydrobromic acid (HBr)—which is a side-product of free radical bromination and promotes hydrolysis of glycosidic linkages of the carbohydrates—Binkley et al. [31] performed debenzylation of several monosaccharide derivatives using NBS as a source of bromine radicals instead of elemental bromine, an incandescent lamp, and a vigorously stirred aqueous suspension of calcium carbonate in carbon tetrachloride to neutralize the formed HBr.
This research work showcases the concept of employing homogeneous HBr scavengers and additives, and the optimization of the reaction conditions and work-up procedure, toward a facile debenzylation of such challenging compounds as BnMC, which yields deprotected MC with maintained substitution pattern profiles.
For method development, MCs with a DS of 1.9, employed in the transglycosylation experiments [35], were benzylated to generate perbenzylated MCs (BnMC, DSMe ~1.9, DSBn ~1.1) as challenging model glucan ethers for debenzylation. Subsequently, the BnMCs were debenzylated and the conversion/success was checked by ATR-IR- and 1H NMR spectroscopy. The methyl pattern in the glucosyl unit and over the cellulose chains was checked by GLC of alditol acetates, and LC-MS of oligosaccharides obtained by partial hydrolysis of the products, respectively. The results were compared with those of the original materials. Moreover, the results of this optimized debenzylation method were also compared with those obtained from debenzylation of the same BnMC material using Na/NH3(liq.). Debenzylation of BnMC by Na/NH3(liq.) has not been reported before to the best of our knowledge.
2. Materials and Methods
2.1. Materials and Equipment
MC-1 and MC-3 refer to two separately-purchased bottles of the same methylcellulose product, Tokyo Chemical Industry, 7000–10,000 mPa·s 2% in water at 20 °C (in order to make a correct and precise conclusion, they are given different code names and treated as different materials in this manuscript). On the other hand, MC-2 refers to methylcellulose, Sigma-Aldrich, 400 mPa·s 2% in water at 20 °C (for detailed analytical data on MC 1–3 refer to Figures S2–S8). The following were also used: methyl lithium solution (MeLi), 1.6 M in diethyl ether, Aldrich, 0.732 g/mL at 25 °C; iodomethane-d3 (MeI-d3), Carl Roth, 99.5 Atom % D, stabilized with Cu; benzyl bromide (BnBr), synthesis grade, Merck; trifluoroacetic acid (TFA) 99.9%, Carl Roth; N-bromosuccinimide (NBS) 99%, Alfa Aesar; 1,2-epoxybutane, synthesis grade, Merck; 2,6-di-tert-butylpyridine (DTBP) 97%, Sigma-Aldrich; [Ir(dtbbpy)(ppy)2]PF6, Sigma-Aldrich; sulfolane, synthesis grade, Merck; dialysis membrane tube, molecular weight cutoff (MWCO) 3500 and 14,000, Carl Roth; ammonia, purity grade 3.8 W (99.98%), Linde; ammonium chloride, pure (Merck). All reagents and solvents were used as received without further purification. Ultraviolet (UV) radiation was carried out using commercially available ozone sterilizing UV lamps for household disinfection purposes, Brightinwd LED, 20 W. There was no specific wavelength range written on the lamp or its manual; however, according to its advertised intended application, it was expected to irradiate wavelengths in the range of 180–260 nm [45]. Reactions under UV irradiation were conducted in quartz vessels. Visible-light radiation was performed using a normal household incandescent light bulb 40 W, or a compact fluorescent lamp 20 W, as are mentioned in the reaction procedure.
2.2. Synthesis of BnMC
2.2.1. Preparation of Lithium Dimsyl (Li-dimsyl) Solution
To prepare 12 mL of 1.6 M Li-dimsyl solution, 12 mL MeLi 1.6 M in diethyl ether was added to 12 mL anhydrous dimethyl sulfoxide (DMSO) at room temperature (26 °C) while stirring and purging nitrogen for 30 min to remove the diethyl ether and the formed methane.
2.2.2. Benzylation
The MC-1 (1.00 g, 5.30 mmol AGU, DS 1.89, Mw ~ 189 g/mol per AGU, Figures S2, S5 and S8) was dissolved in anhydrous DMSO (30 mL). Freshly prepared Li-dimsyl solution (11 mL, 17.65 mmol, 3 eq./eq. OH) was added dropwise to the solution of MC-1 in DMSO at 50 °C. The BnBr (2.14 mL, 3.08 g, 17.65 mmol, 3 eq./eq. OH, Mw 171 g/mol, d 1.44 g/mL,) was added dropwise and the reaction mixture was stirred for 24 h. Benzylation was repeated with half the amounts of reagents and the solution was stirred for another 24 h. Thereafter, 4 mL MeOH was added and stirring continued for 20 min. The reaction mixture was transferred to a dialysis membrane tube (MWCO 14,000, previously immersed in DMSO to gain flexibility). The tube was placed in a Soxhlet apparatus and purified by refluxing THF for 48 h. The purified solution was concentrated on a rotary evaporator and checked by ATR-IR spectroscopy for completion of the reaction by monitoring the disappearance of the OH vibration at around 3300–3500 cm−1 on the ATR-IR spectrum. Benzylation and purification steps were repeated twice more to obtain a completely benzylated product, BnMC-1 (1.34 g, 4.64 mmol AGU, 87 mol%, Mw 289 g/mol per AGU, Figures S9 and S10). Reported molar yields of all the benzylated products in this manuscript are calculated under the premise of a complete benzylation.
In the same way as above, MC-2 (1.0 g, 5.31 mmol AGU, DS 1.87, Mw ~ 188 g/mol per AGU, Figures S3, S6 and S8), and MC-3 (2.00 g, 10.60 mmol AGU, DS 1.89, Mw ~ 189 g/mol per AGU, Figures S4, S7 and S8) were benzylated by Li-dimsyl solution (3 eq./eq. OH) and benzyl bromide (3 eq./eq. OH) to yield BnMC-2 (977 mg, 3.67 mmol AGU, 63 mol%, Mw 290 g/mol per AGU) and BnMC-3 (2.84 g, 9.85 mmol AGU, 93 mol%, Mw 289 g/mol per AGU), respectively (Figures S9 and S10).
2.3. Debenzylation
2.3.1. Method-1
Method-1 refers to one-pot debenzylation reactions, meaning that free-radical bromination and subsequent alkaline hydrolysis are carried out in the same reaction vessel without any work-up and purification in between the steps.
The BnMC-1 (162 mg, 0.566 mmol AGU, 0.631 mmol Bn, DSBn 1.115, DSMe 1.885, Mw 286 g/mol per AGU) or BnMC-2 (171 mg, 0.592 mmol AGU, 0.669 mmol Bn, DSBn 1.13, DSMe 1.87, Mw 290 g/mol per AGU) was dissolved in 20 mL degassed sulfolane (nitrogen was purged through it for 30 min) in a tall 50 mL quartz beaker. The NBS (8 eq./eq. Bn, Mw 178 g/mol; 0.9 g, 5.0 mmol for BnMC-1; 961 mg, 5.35 mmol for BnMC-2) and 1,2-epoxybutane (4 eq./eq. NBS, Mw 72 g/mol, d 0.83 g/mL; 1.757 mL, 1.458 g, 19.990 mmol for BnMC-1; 1.878 mL, 1.558 g, 21.408 mmol for BnMC-2) were added in 4 equal portions every 90 min. After each round of addition of reagents, the beaker-top was covered by aluminum foil, and the reaction mixture was illuminated by a UV lamp, positioned at 10 cm from the side of the beaker, for 90 min while being stirred at 30 °C. Thereafter, 2 mL methanolic NaOMe (30%) was added to the reaction mixture and stirred for 60 min at 30 °C. The reaction mixture was then transferred to a dialysis membrane tube (MWCO 3500) and dialyzed against THF/water, 1:1, v/v, and then water, and finally freeze-dried. For complete debenzylation, the whole procedure was repeated one more time with half the amounts of reagents to yield deBnMC-1 (97 mg, 0.52 mmol AGU, Mw 189 g/mol, 91 mol%) or deBnMC-2 (102 mg, 0.543 mmol AGU, Mw 188 g/mol, 92 mol%). Reported molar yields of all the debenzylated products in this manuscript are calculated under the premise of a complete debenzylation.
2.3.2. Method-2
Method-2 refers to debenzylation reactions comprising 2 separate steps, i.e., free-radical bromination and alkaline hydrolysis. The reaction work-up (dialysis and freeze-drying) is carried out after each step.
Method-2a
The BnMC-2 (146 mg, 0.504 mmol AGU, 0.570 mmol Bn, DSBn ~ 1.13, DSMe 1.87, Mw ~ 290 g/mol per AGU) underwent free-radical bromination by NBS (8 eq./eq. Bn, Mw 178 g/mol, 819 mg, 4.56 mmol) and 1,2-epoxybutane (4 eq./eq. NBS, Mw 72 g/mol, d 0.83 g/mL, 1.600 mL, 1.327 g, 18.22 mmol) in a similar way as described for Method-1. The reaction mixture was then transferred to a dialysis membrane tube (MWCO 3500) and dialyzed against DMSO, THF, and water, respectively. The freeze-dried product was dissolved in 15 mL DMSO at 30 °C and reacted with 2 mL methanolic NaOMe (30%) at 30 °C for 60 min. The reaction mixture was transferred to a dialysis membrane tube (MWCO 3500) and dialyzed against water, followed by freeze-drying. The whole procedure was repeated once more with half the amounts of reagents to yield a completely debenzylated fluffy white solid, deBnMC-2* (76 mg, 0.41 mmol AGU, Mw 189 g/mol, 81 mol%).
Method-2b
The BnMC-2 (146 mg, 0.504 mmol AGU, 0.570 mmol Bn, DSBn ~1.13, DSMe 1.87, Mw ~ 290 g/mol per AGU) reacted with NBS (8 eq./eq. Bn, Mw 178 g/mol, 818 mg, 4.556 mmol) and DTBP (1 eq./eq. NBS, Mw 191 g/mol, d 0.85 g/mL, 1.054 mL, 898 mg, 4.556 mmol) in a similar way as described for Method-2a. The reaction mixture was then transferred to a dialysis membrane tube (MWCO 3500) and dialyzed against DMSO, THF, and water, respectively. The freeze-dried product was dissolved in 15 mL DMSO at 30 °C and reacted with 2 mL methanolic NaOMe (30%) at 30 °C for 30 min. The reaction mixture was transferred to a dialysis membrane tube (MWCO 3500) and dialyzed against water. Subsequent freeze-drying resulted in the debenzylated product, deBnMC-2** (65 mg, 0.34 mmol AGU, Mw 189 g/mol, 69 mol%).
Method-2c
The BnMC-3 (160 mg, 0.504 mmol AGU, 0.564 mmol Bn, DSBn ~1.12, DSMe 1.89, Mw ~ 289 g/mol per AGU) reacted with NBS (2 eq./eq. Bn, Mw 178 g/mol, 215 mg, 1.207 mmol), 1,2-epoxybutane (0.5 eq./eq. NBS, Mw 72 g/mol, d 0.83 g/mL, 53 μL, 43 mg, 0.603 mmol), DTBP (0.5 eq./eq. NBS, Mw 191 g/mol, d 0.85 g/mL, 140 μL, 487 mg, 0.603 mmol), n-PrOH (0.5 eq./eq. epoxy, Mw 60 g/mol, d 0.80 g/mL, 22 μL, 1.23 mmol), and iso-PrOH (0.5 eq./eq. epoxy, Mw 60 g/mol, d 0.79 g/mL, 23 μL, 1.23 mmol) in a similar way as described for Method-2b. Reaction work-up and subsequent alkaline hydrolysis were also performed in the same way as described for Method-2b to give deBnMC-3 (72 mg, 0.38 mmol AGU, Mw 189 g/mol, 63 mol%).
2.3.3. Method-3 (Na/NH3)
The liquid ammonia required for this reaction was collected as follows. The ammonia inside a cylinder of liquid ammonia equipped with a needle valve was slowly condensed in a flask equipped with a condenser capable of holding a mixture of small particles of dry ice and iso-propanol (−78 °C). The flask was also placed (up to the flask neck) in a cooling bath filled with dry ice and iso-PrOH (Figure S1). During the whole reaction, dry ice was continuously added to the cooling bath and the condenser to maintain the reaction temperature at −78 °C and prevent the evaporation of ammonia. To prevent any probable pressure-build up, the outlet of the condenser was connected to an oil bubbler and kept open during the reaction.
A solution of 138 mg BnMC-3 (0.476 mmol AGU, 0.530 mmol Bn, DSBn 1.115, DSMe 1.885, Mw ~ 289 g/mol per AGU) in 5 mL anhydrous THF was added to a mixture of 1 g sodium (43.47 mmol, Mw 23 g/mol) in 30 mL liquid ammonia at −78 °C and stirred using a magnetic stirrer located under the cooling bath. Upon the addition of sodium, the color of the mixture turned dark with a shining mirror-like reddish surface. After 3 h, 0.5 g ammonium chloride (9.43 mmol, Mw 53 g/mol) was added and reacted for 10 min. Thereafter, 10 mL iso-propanol was added. After 5 min., the condenser was removed, the outlet of the flask was directly connected to the bubbler, and nitrogen was purged over the reaction mixture for 10 min. Thereafter, the flask was gradually taken out of the cooling bath by lowering the height of the lab jack underneath the magnetic stirrer. Purging nitrogen over the reaction mixture was continued constantly until the flask reached room temperature (~20 °C) and all the ammonia was evaporated. Ammonium chloride (2 g) was added to the flask in small portions using a spatula. A very dark blue color started to appear at this point, which later gradually turned to white. To facilitate stirring, 5 mL of iso-propanol was added. Glacial acetic acid was added dropwise until neutral pH was achieved, as indicated by the phenolphthalein indicator. Then, 10 mL of water was added and stirred for 30 min. The reaction mixture was concentrated on a rotary evaporator and transferred into a dialysis membrane tube (MWCO 3500), where it was dialyzed against water. Subsequent freeze-drying resulted in the debenzylated product as a fluffy white solid, deBnMC-3* (Na/NH3) (89 mg, 0.47 mmol AGU, Mw 189 g/mol, 99 mol%).
2.4. ATR-IR Spectroscopy
Attenuated total reflection Fourier transform infrared spectroscopy (ATR-IR) was carried out using a Bruker single reflection Platinum-ATR Alpha instrument. Spectra were recorded using 24 scans at the scan range 400–4000 cm–1 and processed using OPUS 7.0 software.
2.5. H NMR Spectroscopy
The 1H NMR spectra were recorded at 20 °C on a Bruker FT 300 (300 MHz) or Bruker Avance II 600 (600 MHz). In the case of methylcellulose or debenzylated products, approximately 10 mg of sample was dissolved in 0.6 mL DMSO-d6 (99.9% D) containing 0.03% (v/v) SiMe4 (TMS) as the internal standard (Sigma-Aldrich, St. Louis, MO, USA). In the case of benzylated methylcellulose derivatives, nearly 10 mg was dissolved in chloroform-d (99.8% D) with 0.03 % (v/v) TMS (Deutero GmbH, Kastellaun, Germany). Proton shifts (δ) are reported in part per million (ppm) downfield from TMS. Spectra were processed using TopSpin NMR software, Bruker.
2.6. Monomer Analysis by GLC
Monomer analysis, i.e., determination of molar portions of different partially-methylated glucose units, was performed according to the well-established procedure developed in our lab [40,46]. Two to five samples were taken from the compound of interest (depending on its availability) and added to separate V-vials for further sample preparation and analysis. All the sample preparation steps, namely, total hydrolysis, reduction, and formation of alditol acetates, were performed for each of these two to five V-vials independent of other vials; hence, in the figure captions throughout this article, these samples are referred to as “independently-prepared samples”.
After total hydrolysis, reduction, and subsequent formation of alditol acetates by acetylation under alkaline conditions, GC-FID analysis was performed at least three times for each of the independent samples mentioned above. After correction of the peak areas according to the molar effective carbon response (ECR) in FID [40,47,48,49], the molar content of each monomer, i.e., of un-, mono-, di-, and tri-substituted monomers, partial DS at each position, and the total DS were evaluated as described by Voiges et al. [40]. Corresponding average values and standard deviations were calculated for each of the independent samples. To report a final value for the sample in question, the calculated average values for each independent sample were averaged again, and their standard deviations were combined using the “pooled standard deviation” concept [50,51,52,53,54], which is the method of choice in chemistry and quality control laboratories for monitoring the reproducibility of measurements when different samples are prepared for the analysis, and each of them is measured repeatedly. This is shown in the following Equation (1):
spooled: pooled standard deviation
k: number of samples
s1, s2, etc. within sample standard deviations
n1, n2, etc. numbers of measurements made for different samples
2.6.1. Gas-Liquid Chromatography
Subsequently, GLC analyses were performed on a Shimadzu GC 2010, equipped with a flame ionization detector (FID), a Phenomenex Zebron ZB-5HT Inferno column (length 28.7 m, internal diameter 0.25 mm, film thickness 0.25 μm), and a retention gap (methyl deactivated, 1.5 cm). Analysis conditions were as follows: H2 as carrier gas with a flow rate of 40 cm/s (linear velocity mode), injection volume 1 μL, splitless injection at 250 °C. The temperature program for analysis of the samples prepared from ethylated MC-1 started at 60 °C for 1 min, heating 10 °C/min up to 100 °C, 1°C/min to 140 °C, 0.5 °C/min to 150 °C, and then remained constant for 15 min, 20 °C/min to 310 °C, and then remained constant for 10 min. The temperature program for analysis of all other methylated glucans reported in this article started at 60 °C for 1 min, heating 20 °C/min up to 200 °C, 4 °C/min to 250 °C, 20 °C/min to 310 °C, and then remained constant for 10 min. The FID detector operated with hydrogen (40 mL/min), synthetic air (400 mL/min), and nitrogen (make-up-gas 30 mL/min). Sample solutions (in dichloromethane) were filtered through PTFE membrane syringe filters with a pore size of 0.45 μm. Peak areas were corrected according to the molar effective carbon response (ECR) in FID [40,47,48,49]. Data evaluation was performed using GC solution software 2.41.00 (Shimadzu).
Experimental details of GLC-FID of deBnMC-1 are as follows: Sample MC-1 was ethylated first, thereafter, from the ethylated MC-1, three separate samples were taken and prepared independently of each other (independent total hydrolysis, reduction, and alkaline acetylation, as described in the Materials and Methods Section 2.6). Each independently-prepared sample was measured 3 times using GLC, and the data were averaged as explained above. Likewise, from deBnMC-1, two separate samples were taken as such (i.e., without prior ethylation) and prepared independently of each other (independent total hydrolysis, reduction, alkaline acetylation). Each independently-prepared sample was measured four times by GLC, and the data were averaged as explained above.
Experimental details of GLC-FID of deBnMC-2, deBnMC-2*, and deBnMC-2** are as follows: to produce the presented data, from deBnMC-2, two separate samples were taken and prepared independently of each other (independent total hydrolysis, reduction, and alkaline acetylation, as described in the Materials and Methods Section 2.6). Each independently-prepared sample was measured four times by GLC, and the data were averaged. Likewise, from deBnMC-2*, three separate samples were taken and prepared independently of each other. Each independently-prepared sample was measured four times. From deBnMC-2**, three separate samples were taken and prepared independently of each other. Each independently-prepared sample was measured five times. From MC-2, four separate samples were taken and prepared independently of each other. Each independently prepared sample was measured three times, and the data were averaged.
Experimental details of GLC-FID of deBnMC-3 and deBnMC-3*are as follows: three separate samples were taken from the deBnMC-3 and prepared independently of each other (independent total hydrolysis, reduction, and alkaline acetylation). Each independently-prepared sample was measured three times. From deBnMC-3* (Na/NH3), two separate samples were taken and prepared independently of each other. Each independently-prepared sample was measured three times. From MC-3, five separate samples were taken and prepared independently of each other. Each independently-prepared sample was measured three times. Evaluated results were averaged as explained above.
2.7. Oligomer Analysis by LC-MS
For quantitative analysis of the methyl pattern by LC-MS [35,37,55], products were first perdeuteromethylated. From the perdeuteromethylated sample, two–four samples were taken (depending on its availability) and added to separate vials for further sample preparation, namely, partial acid hydrolysis, labeling with m- aminobenzoic acid (m-ABA) by reductive amination in MeOH, and filtration. Hence, in the figure captions throughout this article, these samples are referred to as “independently-prepared samples”.
2.7.1. LC-ESI-MS
For liquid chromatography-mass spectrometry of m-ABA labeled samples in negative ion mode, the electrospray ionization ion trap mass spectrometer (ESI-IT-MS), HCT Ultra ETDII (Bruker Daltonics, Bremen, Germany), was coupled to an Agilent LC system equipped with a binary pump (1100 Series) and a diode array detector (DAD) (G1315B). Chromatography was performed using a reversed-phase RP-18 column (Phenomenex, Kinetex, 2.6 μm, 100 mm × 2.1 mm) with the mobile phases H2O/HOAc (99:1, v/v; A) and ACN/HOAc (99:1, v/v; B) in a linear gradient system (0 min, 80 vol % A and 45 min, 10 vol % A) at a flow rate of 0.2 mL min−1. The following instrumental parameters were applied: injection volume 10 μL, nitrogen as dry gas (10 L min−1, 365 °C) and as nebulizer gas (50 psi), capillary voltage 4500 V, endplate offset voltage—500 V, capillary exit—280 V, smart ICC target 100000, compound stability 1000%, trap drive level 100%, target mass 1000, scan mode standard-enhanced (8100 (m/z)/s), mass range 500–1700 m/z, negative ion mode. Mass spectra were evaluated using the data analysis 4.0 software (Bruker Daltonics, Bremen, Germany). For quantification, peak intensities were corrected for background noise and overlapping peaks of 13C isotopes. Averaging and calculation of measurement uncertainties were performed in the same way as explained for GLC analysis.
Experimental details of oligomer analysis of deBnMC-2* by LC-ESI-MS: From the deuteromethylated deBnMC-2*, four separate samples were taken and prepared independent of each other (independent partial hydrolysis and labeling). Each independently prepared sample was measured three times by LC-ESI-MS in negative ion mode. Likewise, from the deuteromethylated MC-2, three separate samples were taken and prepared independently of each other. Each independently-prepared sample was measured four times. The evaluated Me-profiles and DS values for each sample were averaged.
3. Results and Discussion
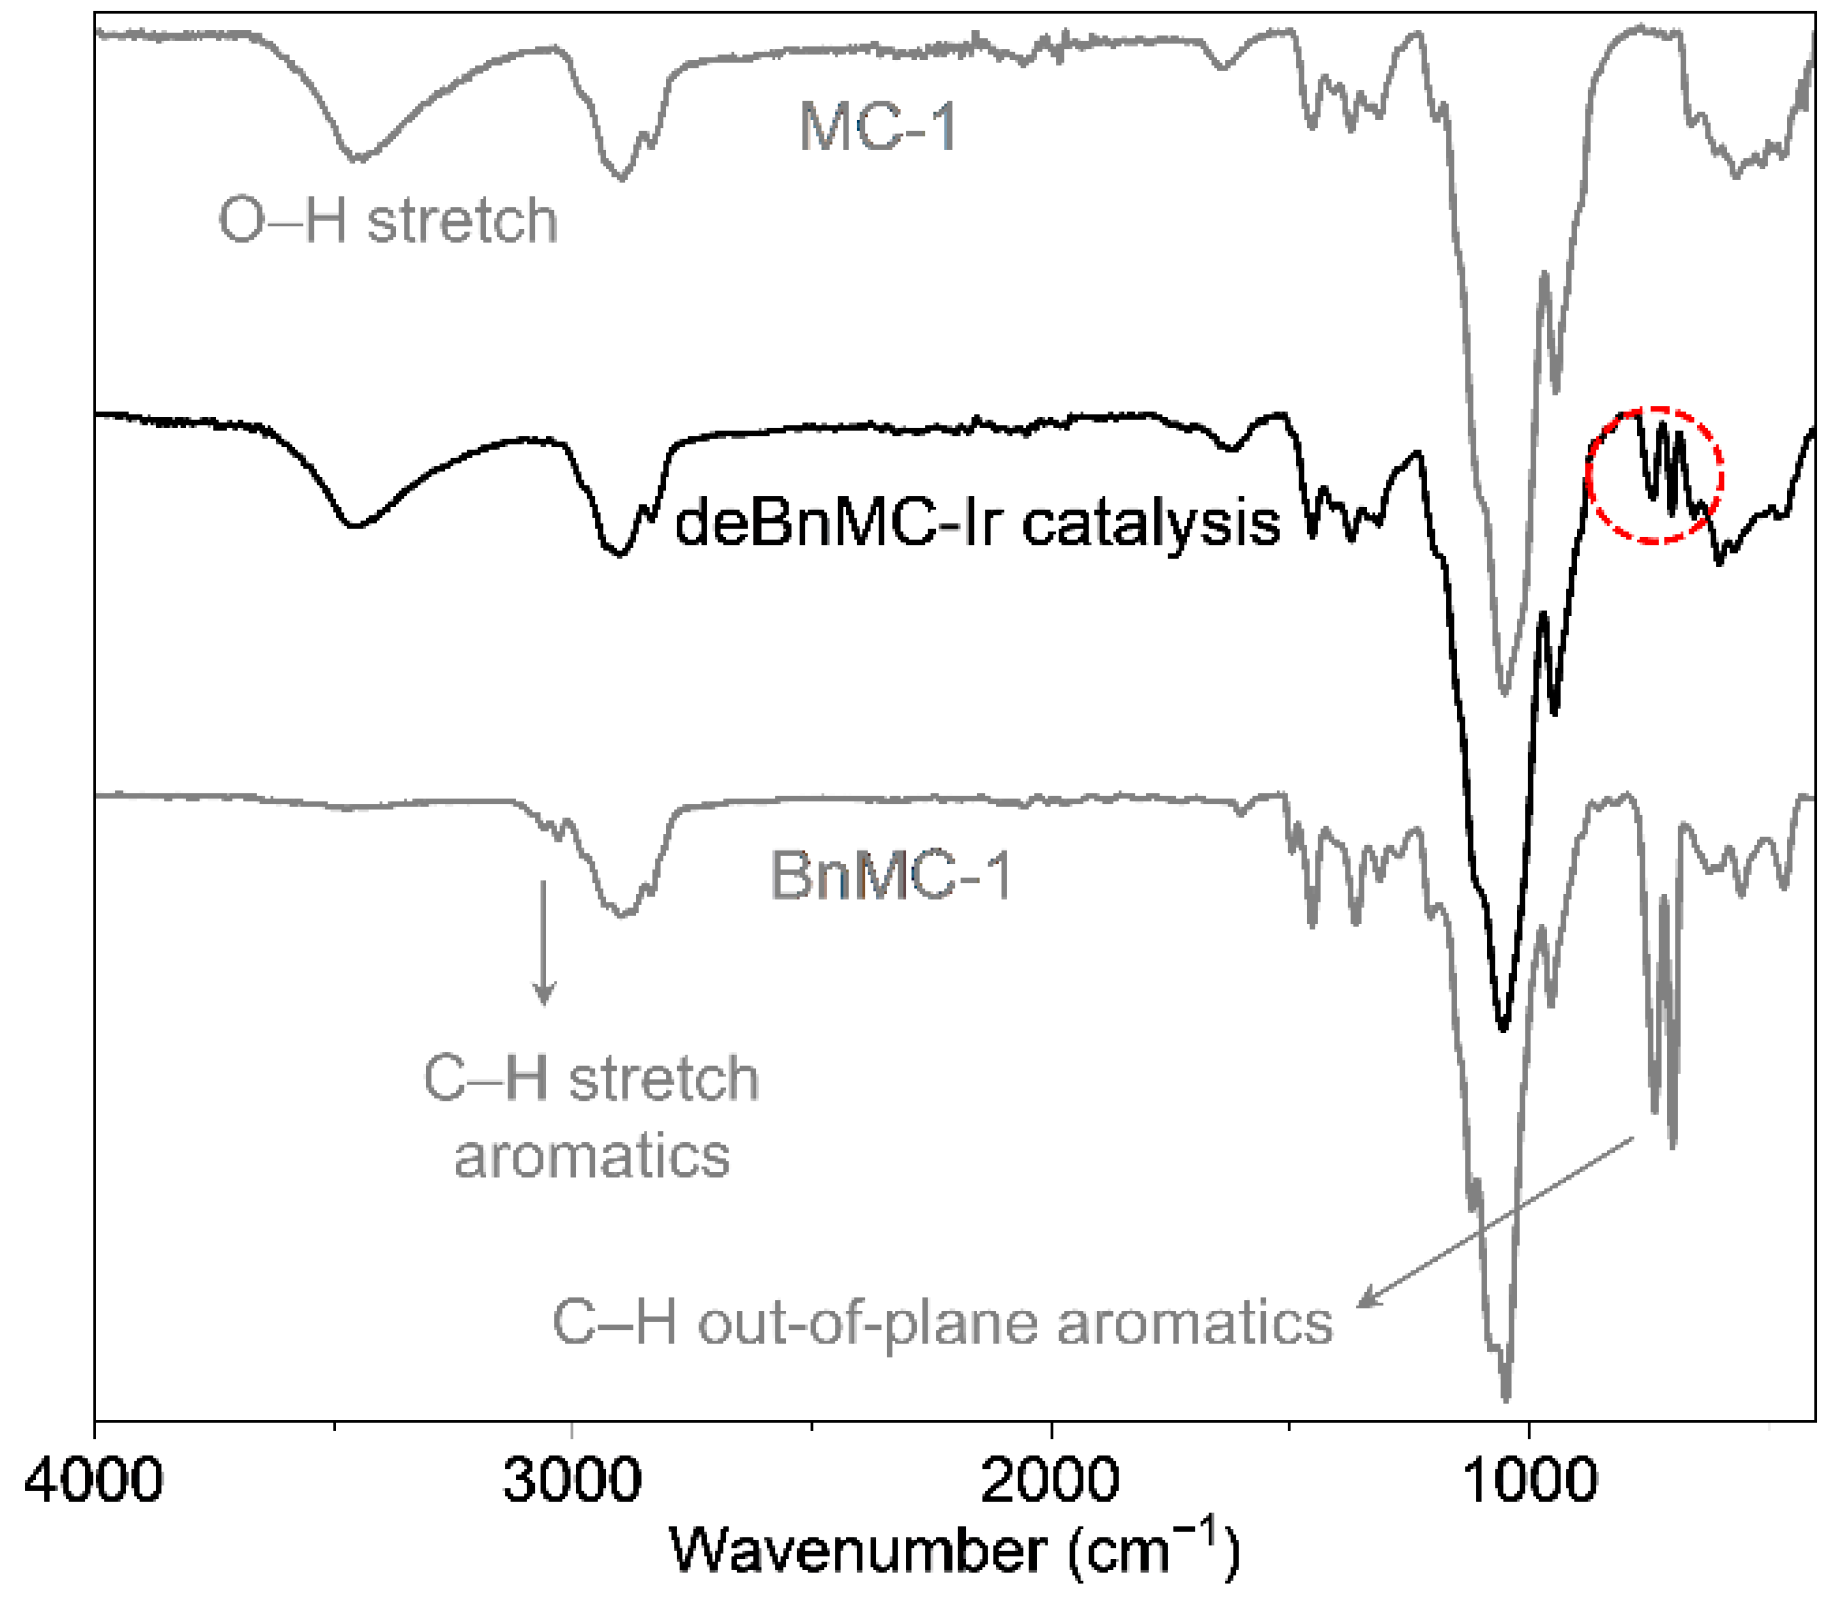
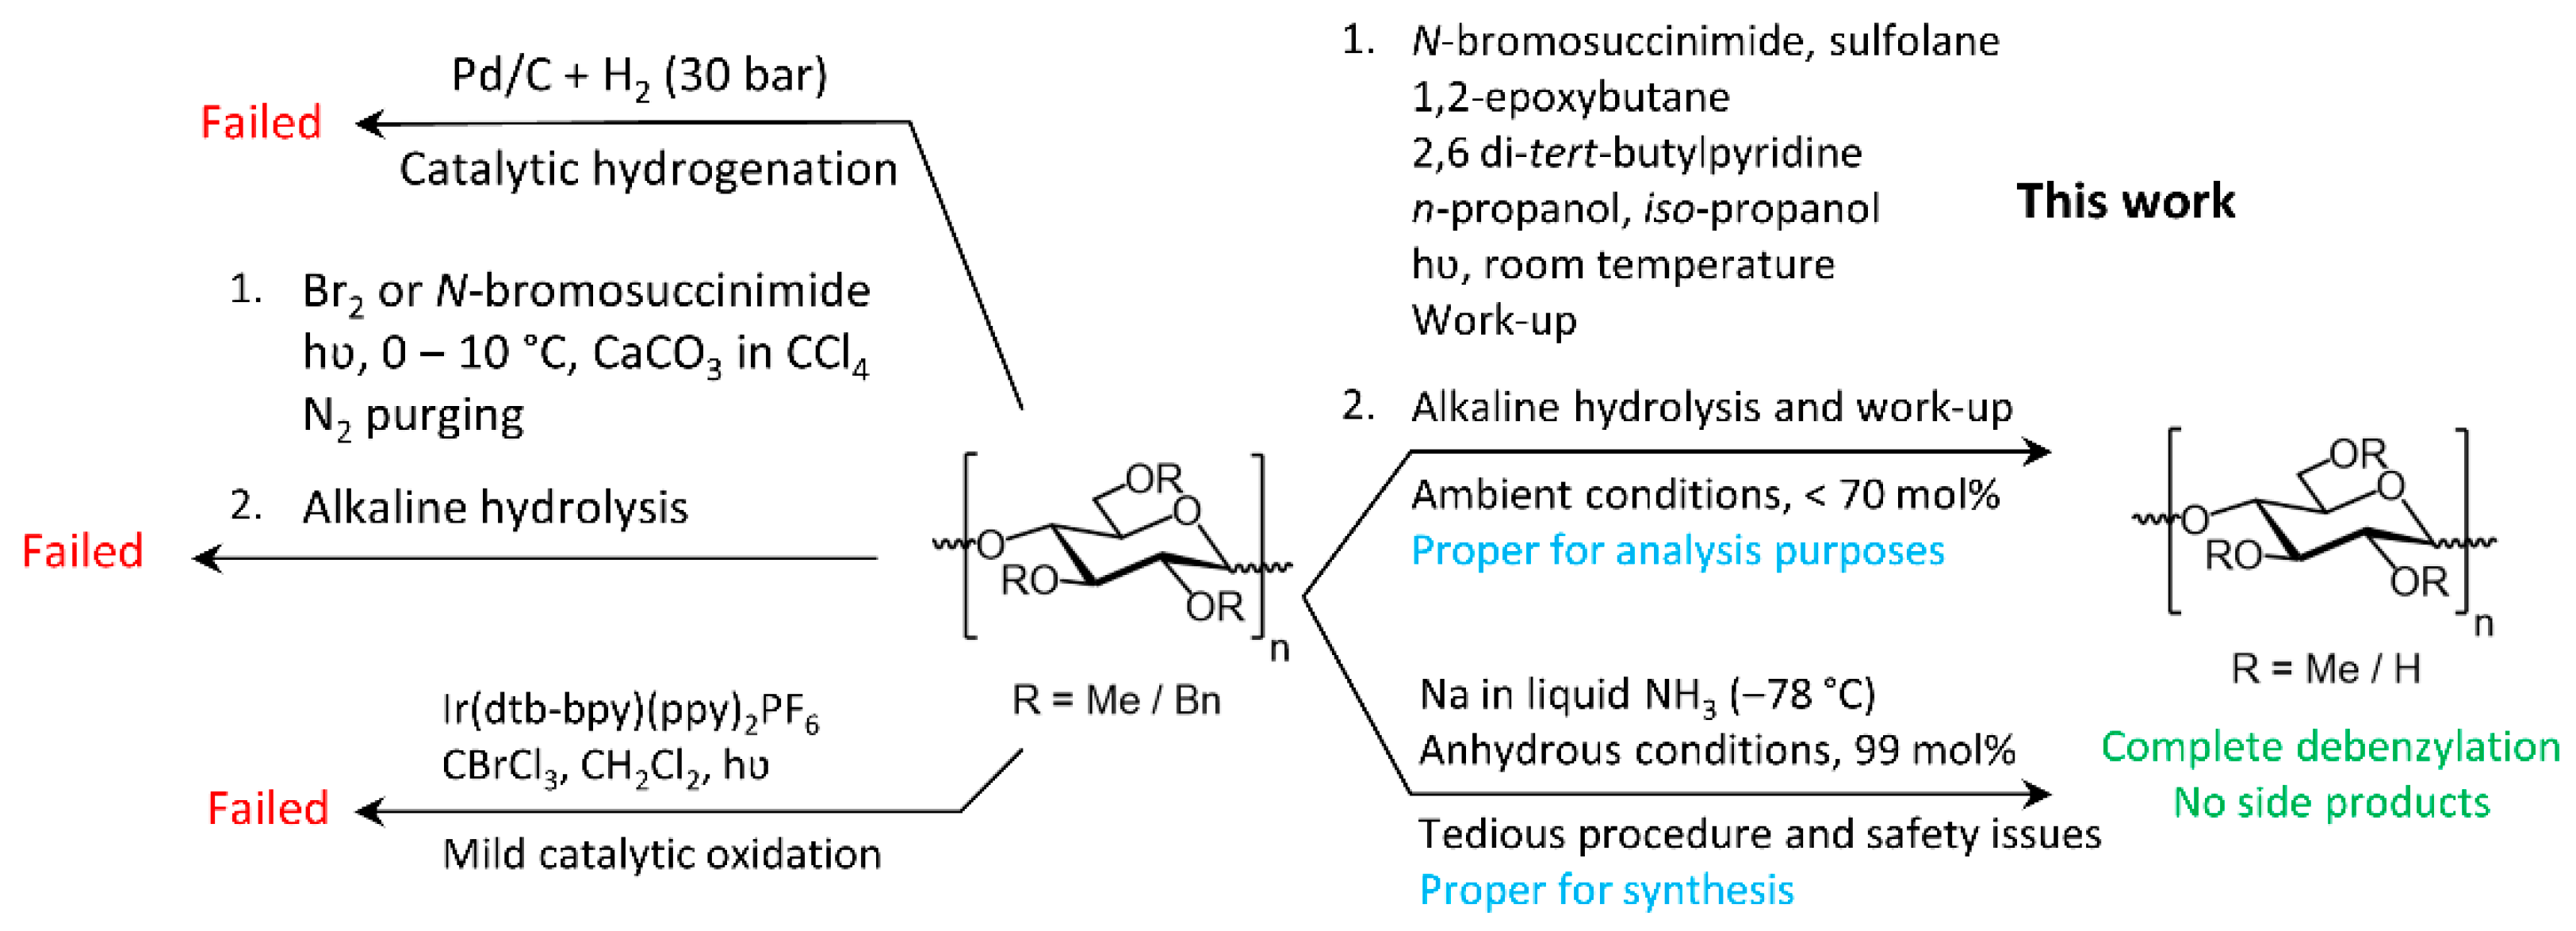
The applicability of several well-known debenzylation methods in carbohydrate chemistry, namely, heterogeneous catalytic hydrogenation over Pd/C, free-radical bromination followed by hydrolysis [31,32], and treatment with Na/NH3(liq.), was examined on benzylated methylcellulose derivatives (BnMC) with DSMe ~1.9 and DSBn ~1.1 as model compounds. Moreover, amongst the various methods reported for the catalytic activation of the benzylic hydrogen [56] or vanadium-catalyzed oxidative debenzylation of non-carbohydrate compounds under harsh acidic conditions [57], the potential of an acid-free visible-light-promoted debenzylation of the above-mentioned BnMC material in the presence of a homogeneous iridium-catalyst [58] was investigated (Scheme 1), which sadly resulted in only partial debenzylation of such benzylated methylcellulose derivatives (Figure 1).
Debenzylation of BnMC by catalytic hydrogenation over Pd/C was not successful due to the strong adsorption of the polysaccharide on the catalyst. Our attempts to extract the debenzylated products from the Pd/C catalyst using various solvents, such as DMSO, EtOH, THF, and DCM, in the order of extraction, as well as heating (up to the boiling point of the solvents, except for DMSO) resulted in a slightly better recovery at the expense of severe contamination due to catalyst leaching. The catalyst contamination could not be removed by filtration through PTFE membrane syringe filters with a pore size of 0.45 μm. Moreover, due to the polymeric nature of the products the filters were quickly blocked. Solid-phase treatments with a Celite® bed, solid-phase extraction cartridges, or liquid-liquid extraction for removing the catalyst contamination were not successful due to the amphiphilicity of the debenzylated products and their high tendency to adsorption on solid surfaces.
Another approach to recover the debenzylated products from the catalyst was the acetylation or deuteromethylation of the reaction mixture (including the debenzylated products and the catalyst) immediately after the catalytic hydrogenation. Derivatization of the products was expected to facilitate their extraction from the catalyst. Subsequent treatment of the extracted acetylated products with methanolic NaOMe was expected to regenerate the desired MC with deprotected hydroxy groups, whereas deuteromethylation of the samples was expected to produce deuterated derivatives (Me-d3-MC), which could be later used for structural analysis by mass spectrometry. Neither of these modifications were successful.
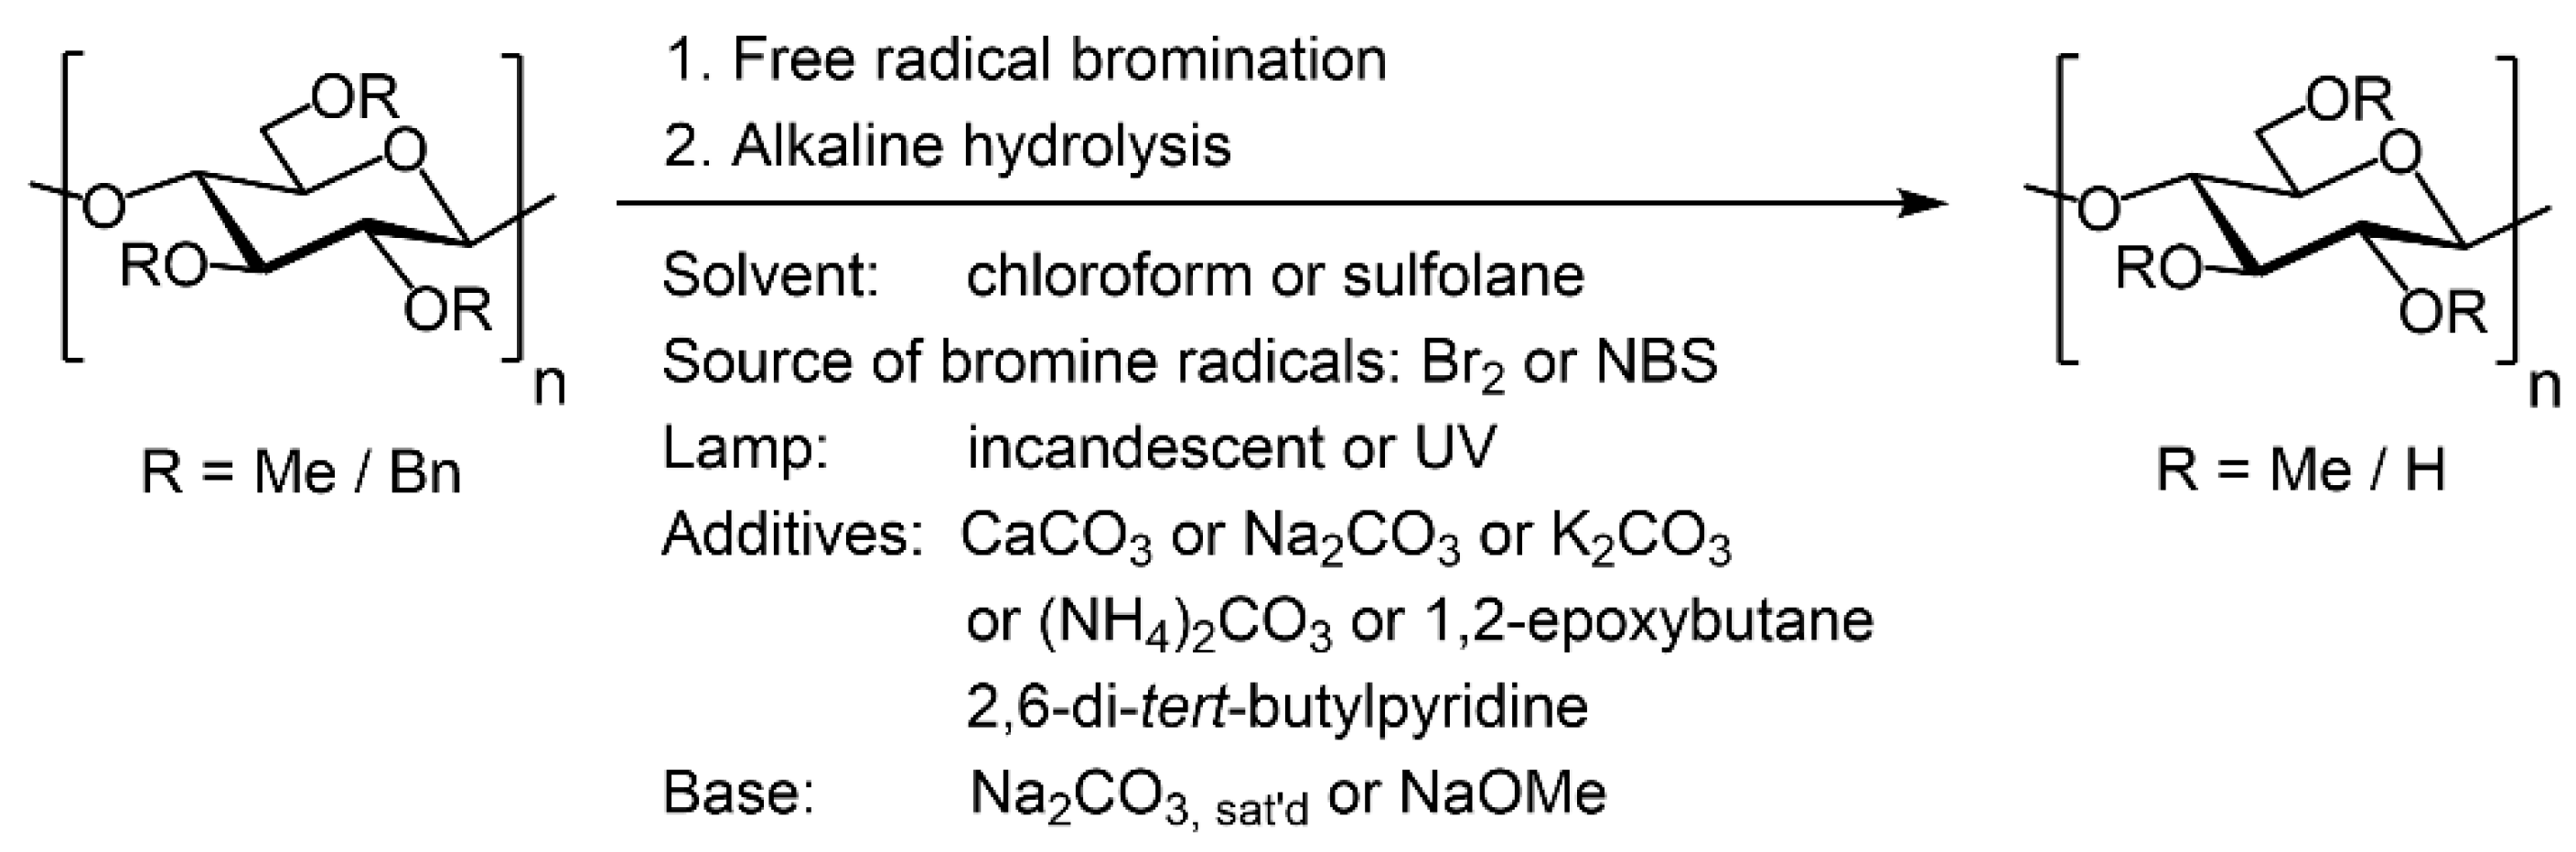
Debenzylation of BnMC by free radical bromination with Br2 in chloroform or sulfolane under radiation by an incandescent lamp, as described by BeMiller et al. [32,42], resulted in only partial debenzylation and severe chain degradation to the extent that no product was recovered after dialysis by a membrane tube with MWCO 3500. Further optimization of the debenzylation reaction by free-radical bromination and subsequent hydrolysis was performed as shown in Scheme 3.
Due to the significant switching of polarity of BnMC after deprotection, application of non-polar organic solvents, such as chloroform, for debenzylation by free-radical bromination resulted in the formation of crude solid assemblies that trapped the rest of the polymer chains and prevented them from further deprotection. Ultimately, sulfolane was used as the solvent because of its inertness to the reaction condition—as a consequence of its oxidation state—and also because of its impressive solubility power for the protected starting material (hydrophobic), the reagents used for debenzylation, and also the unprotected hydrophilic product, and finally its much less critical state with respect to toxicity.
To reduce the local concentration of HBr which, in any case, is a side-product of radical bromination, Br2 was replaced by NBS on account of the fact that upon exposure to UV, NBS gradually generates bromine radicals which are immediately consumed in the reaction. Additionally, CaCO3, either as solid powder or aqueous suspension, was added to chloroform or sulfolane as an additive to capture the produced HBr while nitrogen was constantly purging through the reaction mixture to remove the liberated CO2 and to drive the HBr neutralization equilibrium forward. Only partial debenzylation occurred, and chain degradation was very strong, to the extent that only 21 mol% of the product was recovered after purification by a dialysis tube MWCO 3500. No debenzylation occurred when CaCO3 was replaced with Na2CO3, K2CO3, or a soluble analog, (NH4)2CO3.
3.1. Debenzylation Method-1 (One-Pot Experiments)
As an alternative to acid neutralization by solid or soluble bases, 1,2-epoxybutane was used to trap the HBr by ring-opening addition to the epoxy ring. There was no need to continuously degas the reaction mixture, which is a bothersome issue when the debenzylated product has foam stabilizing properties, such as MC in this case. 1,2-Epoxybutane was used in an excess amount in order to enhance the suppression of acid hydrolysis of the polymer by HBr (Table 1). The NBS has strong absorption below 330 nm [59]. Therefore, in the beginning, radiation was performed using an inexpensive ozone sterilizing UV lamp for household disinfection purposes (20 W) located at 10 cm from the side of the reaction vessel made of quartz. Since the reaction medium was purged for 30 min with nitrogen in order to remove the dissolved oxygen, the risk of oxygen-promoted oxidative degradation of glucans was expected to be low at such weak radiation intensities and in the presence of a strong UV absorbent such as NBS and benzyl groups. Additionally, high power gamma-irradiation was used for partial degradation of β-glucans [60], as we could not find any literature reporting the degradation of 1,4-β-glucans by irradiation in the UV range. To achieve complete debenzylation, 8 eq. of NBS per eq. of Bn groups was required, and the reaction was performed twice (91 mol%).
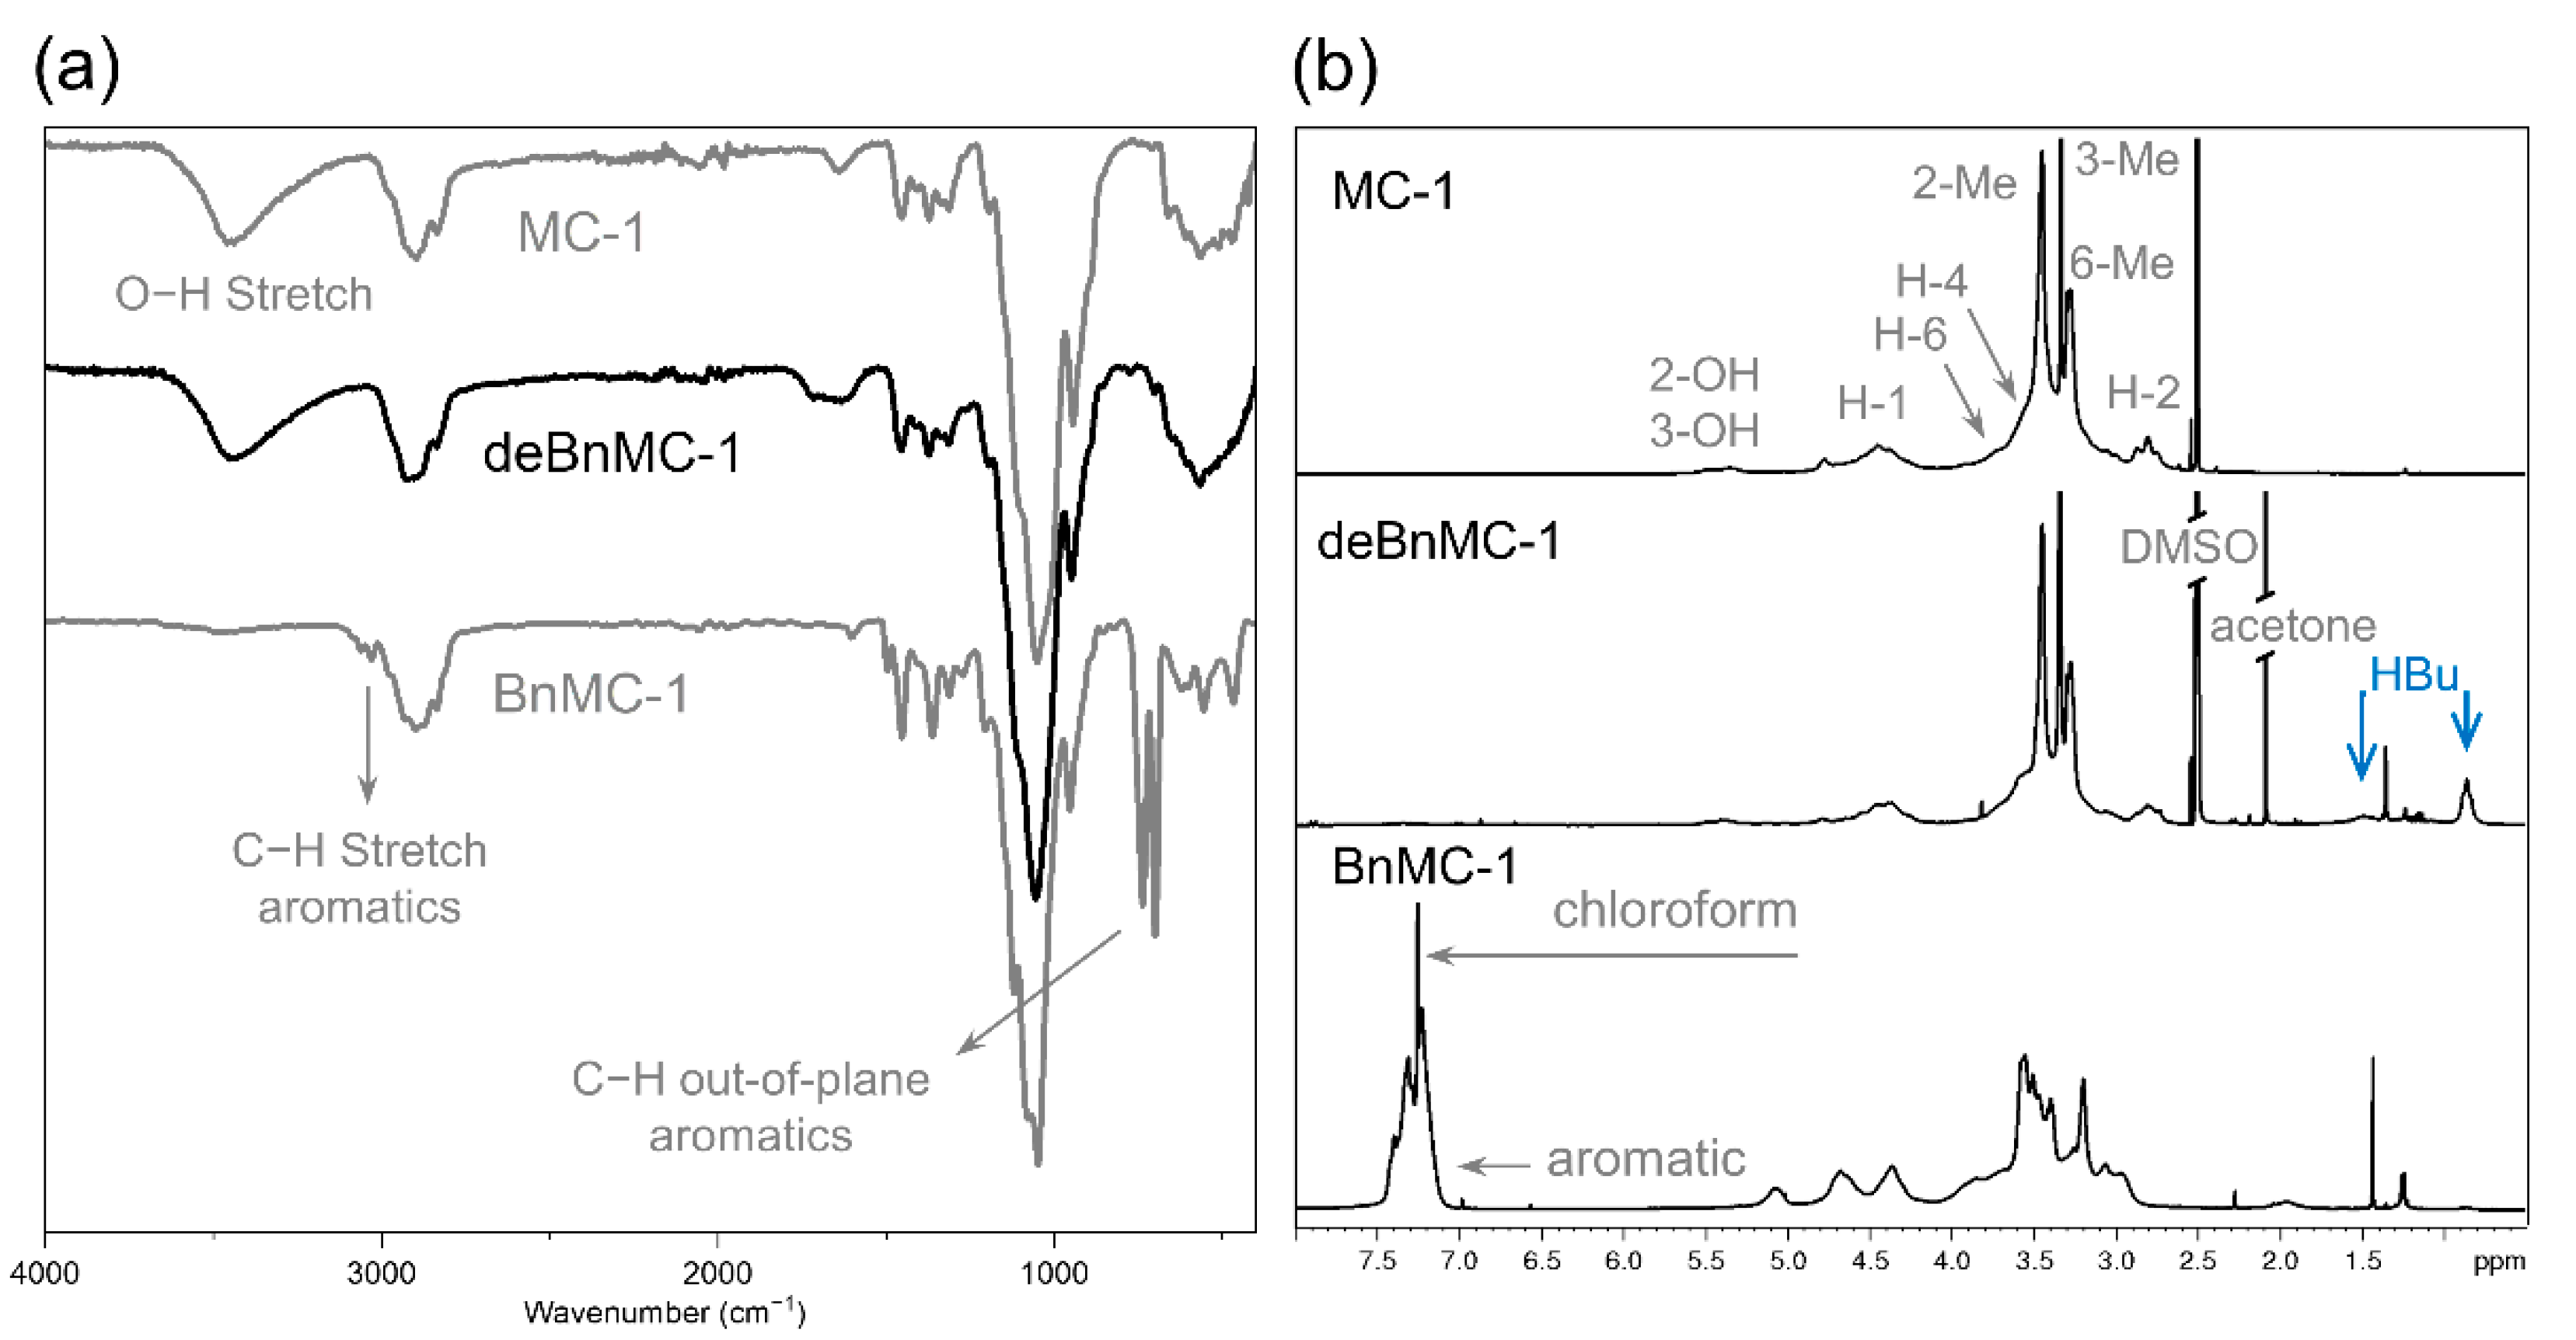
The ATR-IR- (Figure 2a) and 1H NMR spectra (Figure 2b) of deprotected BnMC-1 (deBnMC-1, Method-1, Table 1) did not show any sign of aromatic benzyl groups and were in good agreement with the spectra from the original MC-1, and, thus, confirmed the successful removal of benzyl groups. The signals at 0.86 ppm and 1.49 ppm, in the 1H NMR spectrum of deBnMC-1 in Figure 2b, were assigned to the terminal methyl and its adjacent methylene group of the hydroxybutyl substituted side-products (HBu) resulting from the addition of some of the hydroxy groups of the MC to the oxirane. These side-products were further investigated and quantified by GLC and LC-MS analyses and estimated to be in total around 8 mol% (for details refer to the Supplementary Material, page 11).
To study whether he DS and methyl substitution pattern has been changed by any DS-dependent bias of the procedure, the amount and distribution of methyl groups of MC-1 and deBnMC-1 were investigated by GLC-FID after total hydrolysis and subsequent preparation of alditol acetates. A comparison of relative molar portions of the eight monomer constituents showed that the methyl pattern was well-maintained (Figure 3). Considering all analyses performed, slight deviations do not show a preference for any position, and, thus, seem to be acceptable non-systematic changes.
To investigate whether the methyl substitution profile over the chains of debenzylated MC was preserved after the entire procedure of debenzylation, MC-1 and deBnMC-1 were further analyzed by LC-ESI-MS according to our well-established procedure, comprising perdeuteromethylation of hydroxy groups, partial hydrolysis, and finally labeling with m-ABA (Figure S11) [35,37,55]. Mass spectra of deBnMC-1, as well as zoomed-in views of DP-2 and DP-3 for deBnMC-1 (m-ABA labeled) and MC-1 (deuteromethylated and m-ABA labeled), are illustrated in Figure S12.
The experiment was repeated with another BnMC-2 (DSMe 1.87, DSBn 1.13), under the same conditions as before (Method-1), and 92 mol% of the completely debenzylated product (deBnMC-2) was collected. The mass spectrum was in good agreement with that of deBnMC-1 in Figure S12 (Figure 4a). Profiles with Δ m/z − 17 show incomplete deuteromethylation (-Me-d3), whereas those with Δ m/z + 17 have one additional deuteromethyl group at O-4 of the non-reducing end of the oligomer as a result of chain degradation before or during deuteromethylation. The relative abundance of Δ m/z + 17 profiles of each DP also depends on the degree of hydrolysis, since chain ends are degraded faster than internal parts of the macromolecule. Thus, it is not a measure to quantify degradation.
Although nitrogen was purged over the reaction mixture before alkaline treatment in order to evaporate the 1,2-epoxybutane residue (b.p. 63 °C) and prevent its ring-opening side reaction with the hydroxy groups of the polysaccharide, mono-, di-, and tri-hydroxybutyl substituted side-products (+1 HBu, +2 HBu, and +3 HBu/oligosaccharide, respectively) were observed with decreasing abundance. Additional profiles with Δ m/z + n∙72 (n = 1, 2), as shown in Figure 4a and Figure S12, are attributed to these side-products. As determined by GLC (Figure 3, and page 11 of the Supplementary Material), the average molar ratio of these side-products was estimated to be around 8 mol%, mainly with one and traces with two substituents per AGU. Looking at the mass spectra, however, their exaggerated ion intensities might be misleading. Methoxy alkyl ethers and longer alkyl ethers as well are known to markedly enhance the ion yield in mass spectrometry [61]. On account of their different chemistry and, thus, surface activity, the intensities of these additional profiles (Δ m/z ± 17, +n∙72) are not representative of their molar ratio.
3.2. Debenzylation Method-2 (2-Separate-Step Experiments)
The ring-opening reaction of 1,2-epoxybutane with the hydroxy groups of the glucan occurs in the acidic medium of the free-radical bromination step (because of the produced HBr side-product), and during the alkaline conditions of the subsequent hydrolysis step as well (Scheme 2b, ester pathway). To circumvent the latter, instead of a one-pot reaction, debenzylation of BnMC-2 was performed in two separate steps (Method-2a, Table 1). After free-radical bromination, the reaction mixture was dialyzed to remove all the impurities, particularly the residual 1,2-epoxybutane and NBS, and then it was freeze-dried. Removal of NBS before the alkaline hydrolysis step had the added advantage of eliminating NBS-promoted oxidation under alkaline conditions [62]. The purified product was dissolved in DMSO and treated with NaOMe in MeOH, then isolated and purified by dialysis and finally freeze-dried to yield 81 mol% completely debenzylated product (deBnMC-2*).
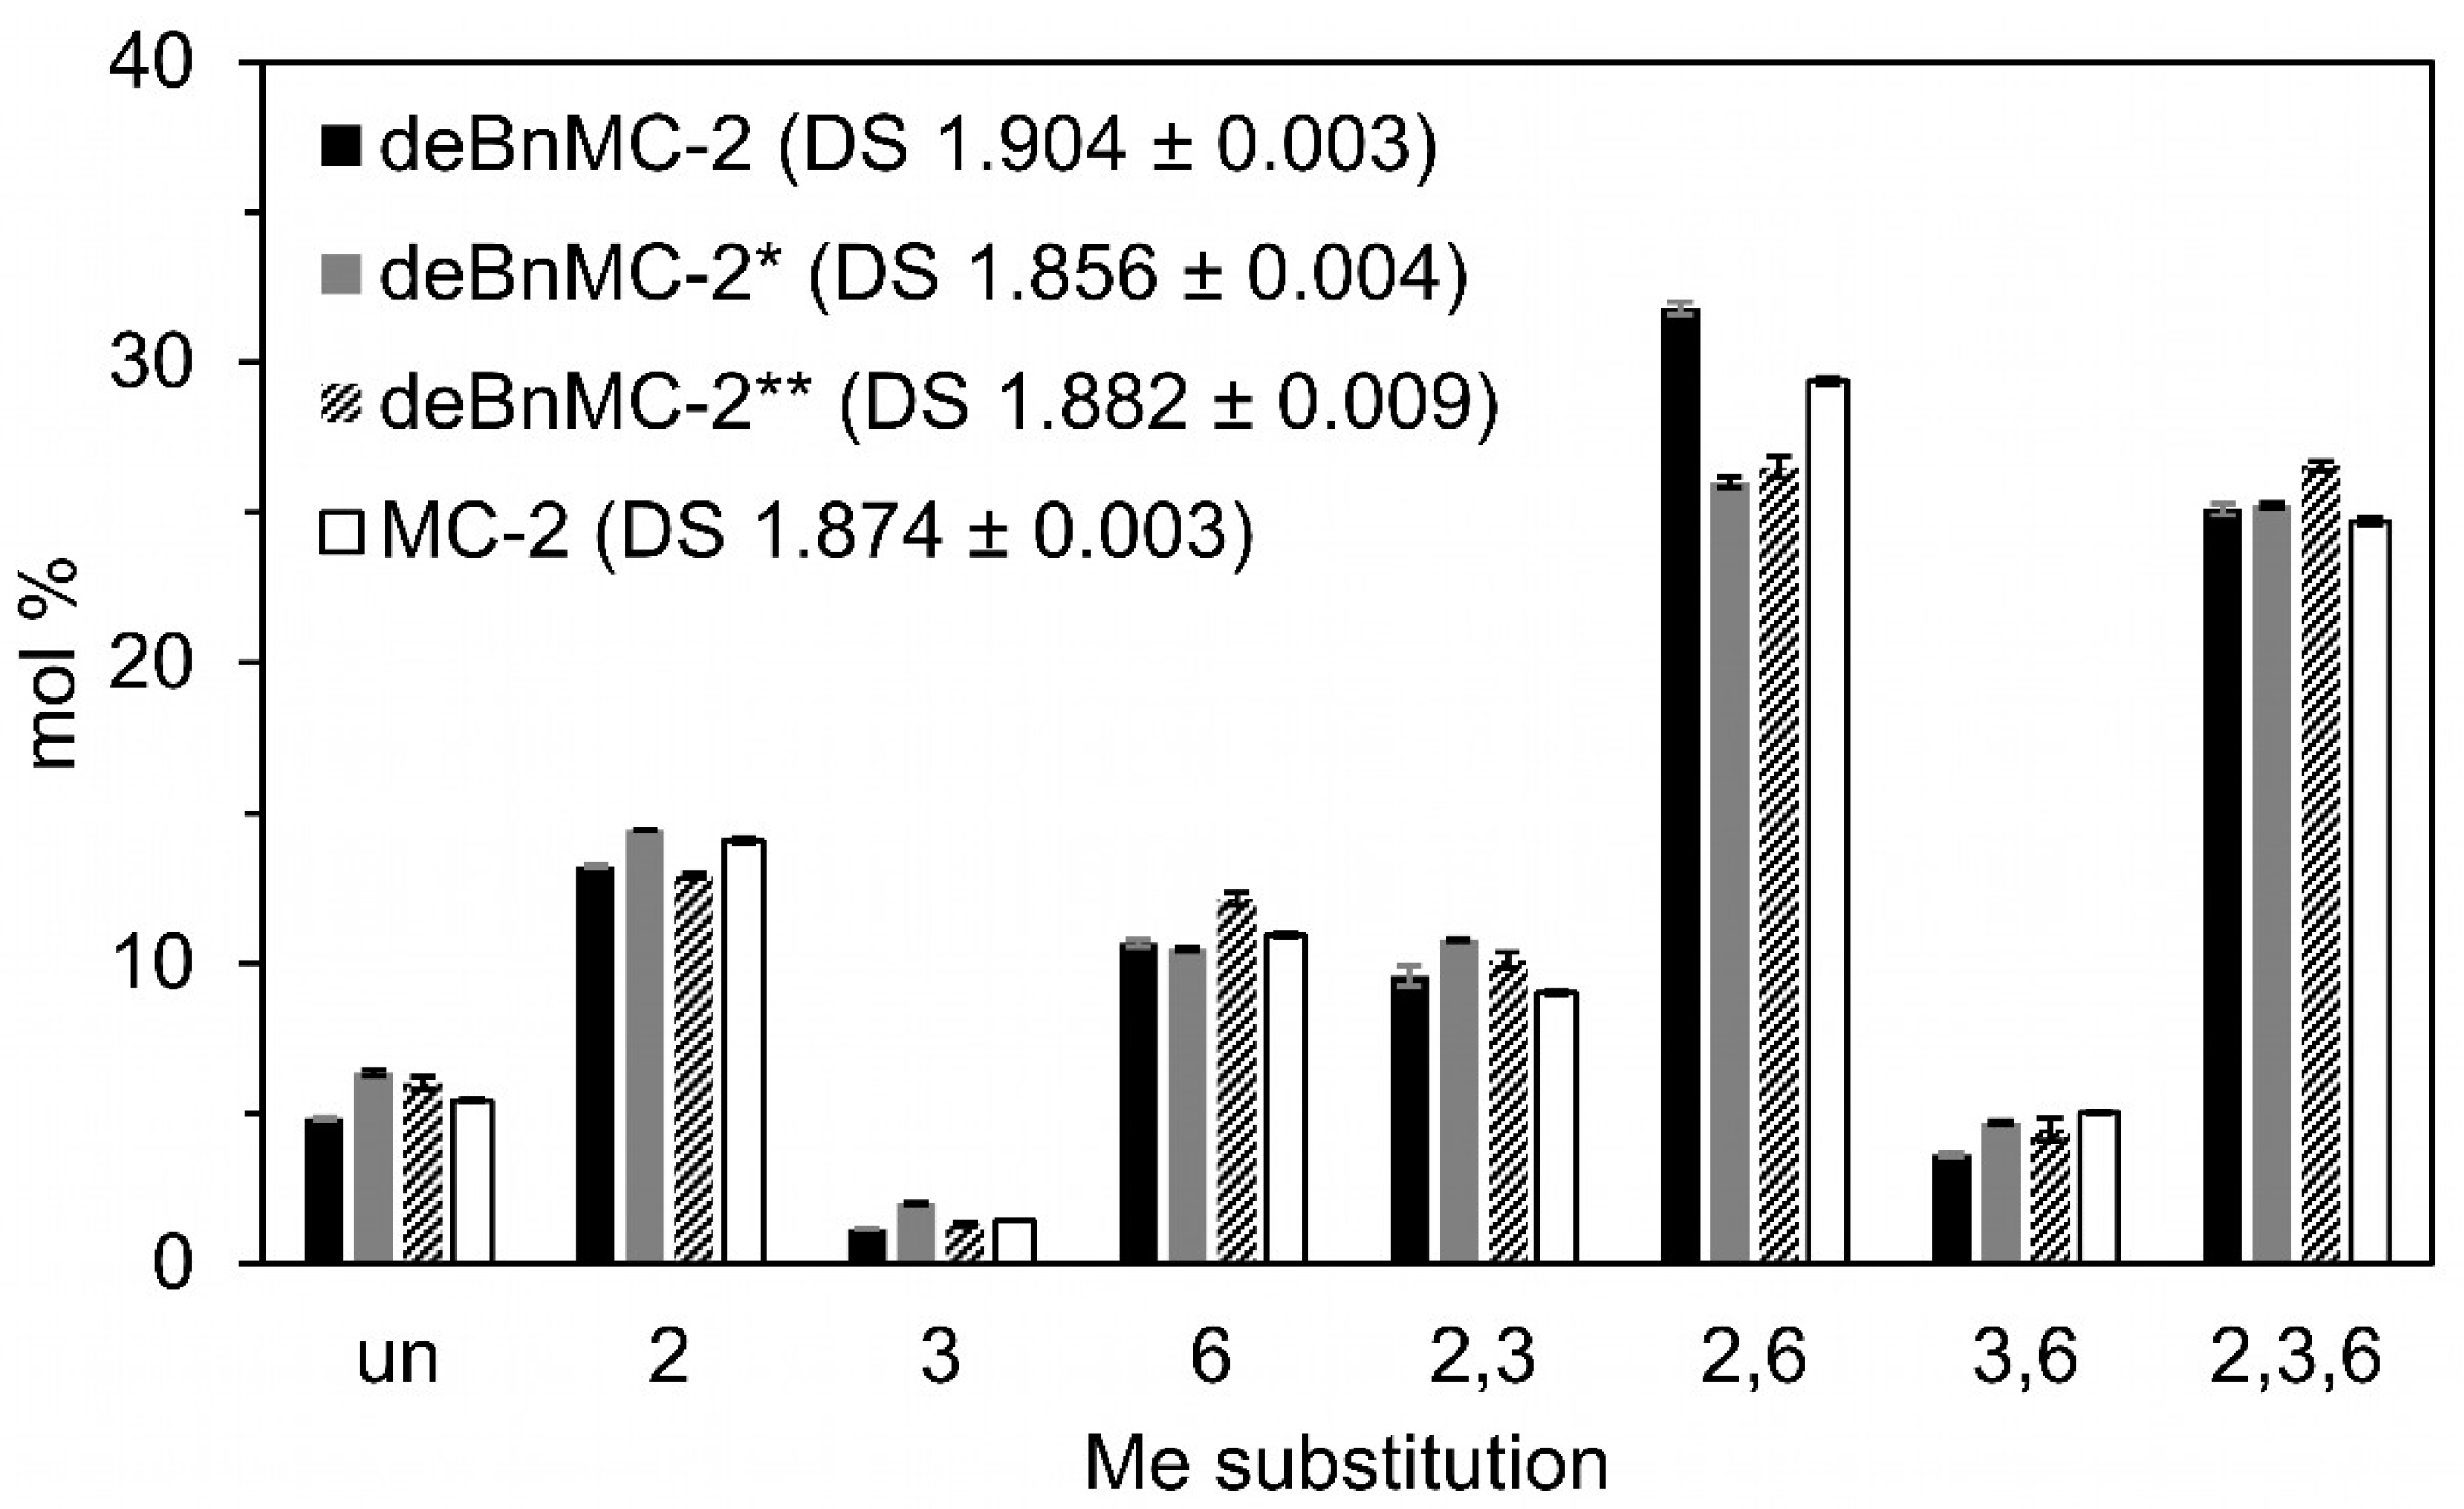
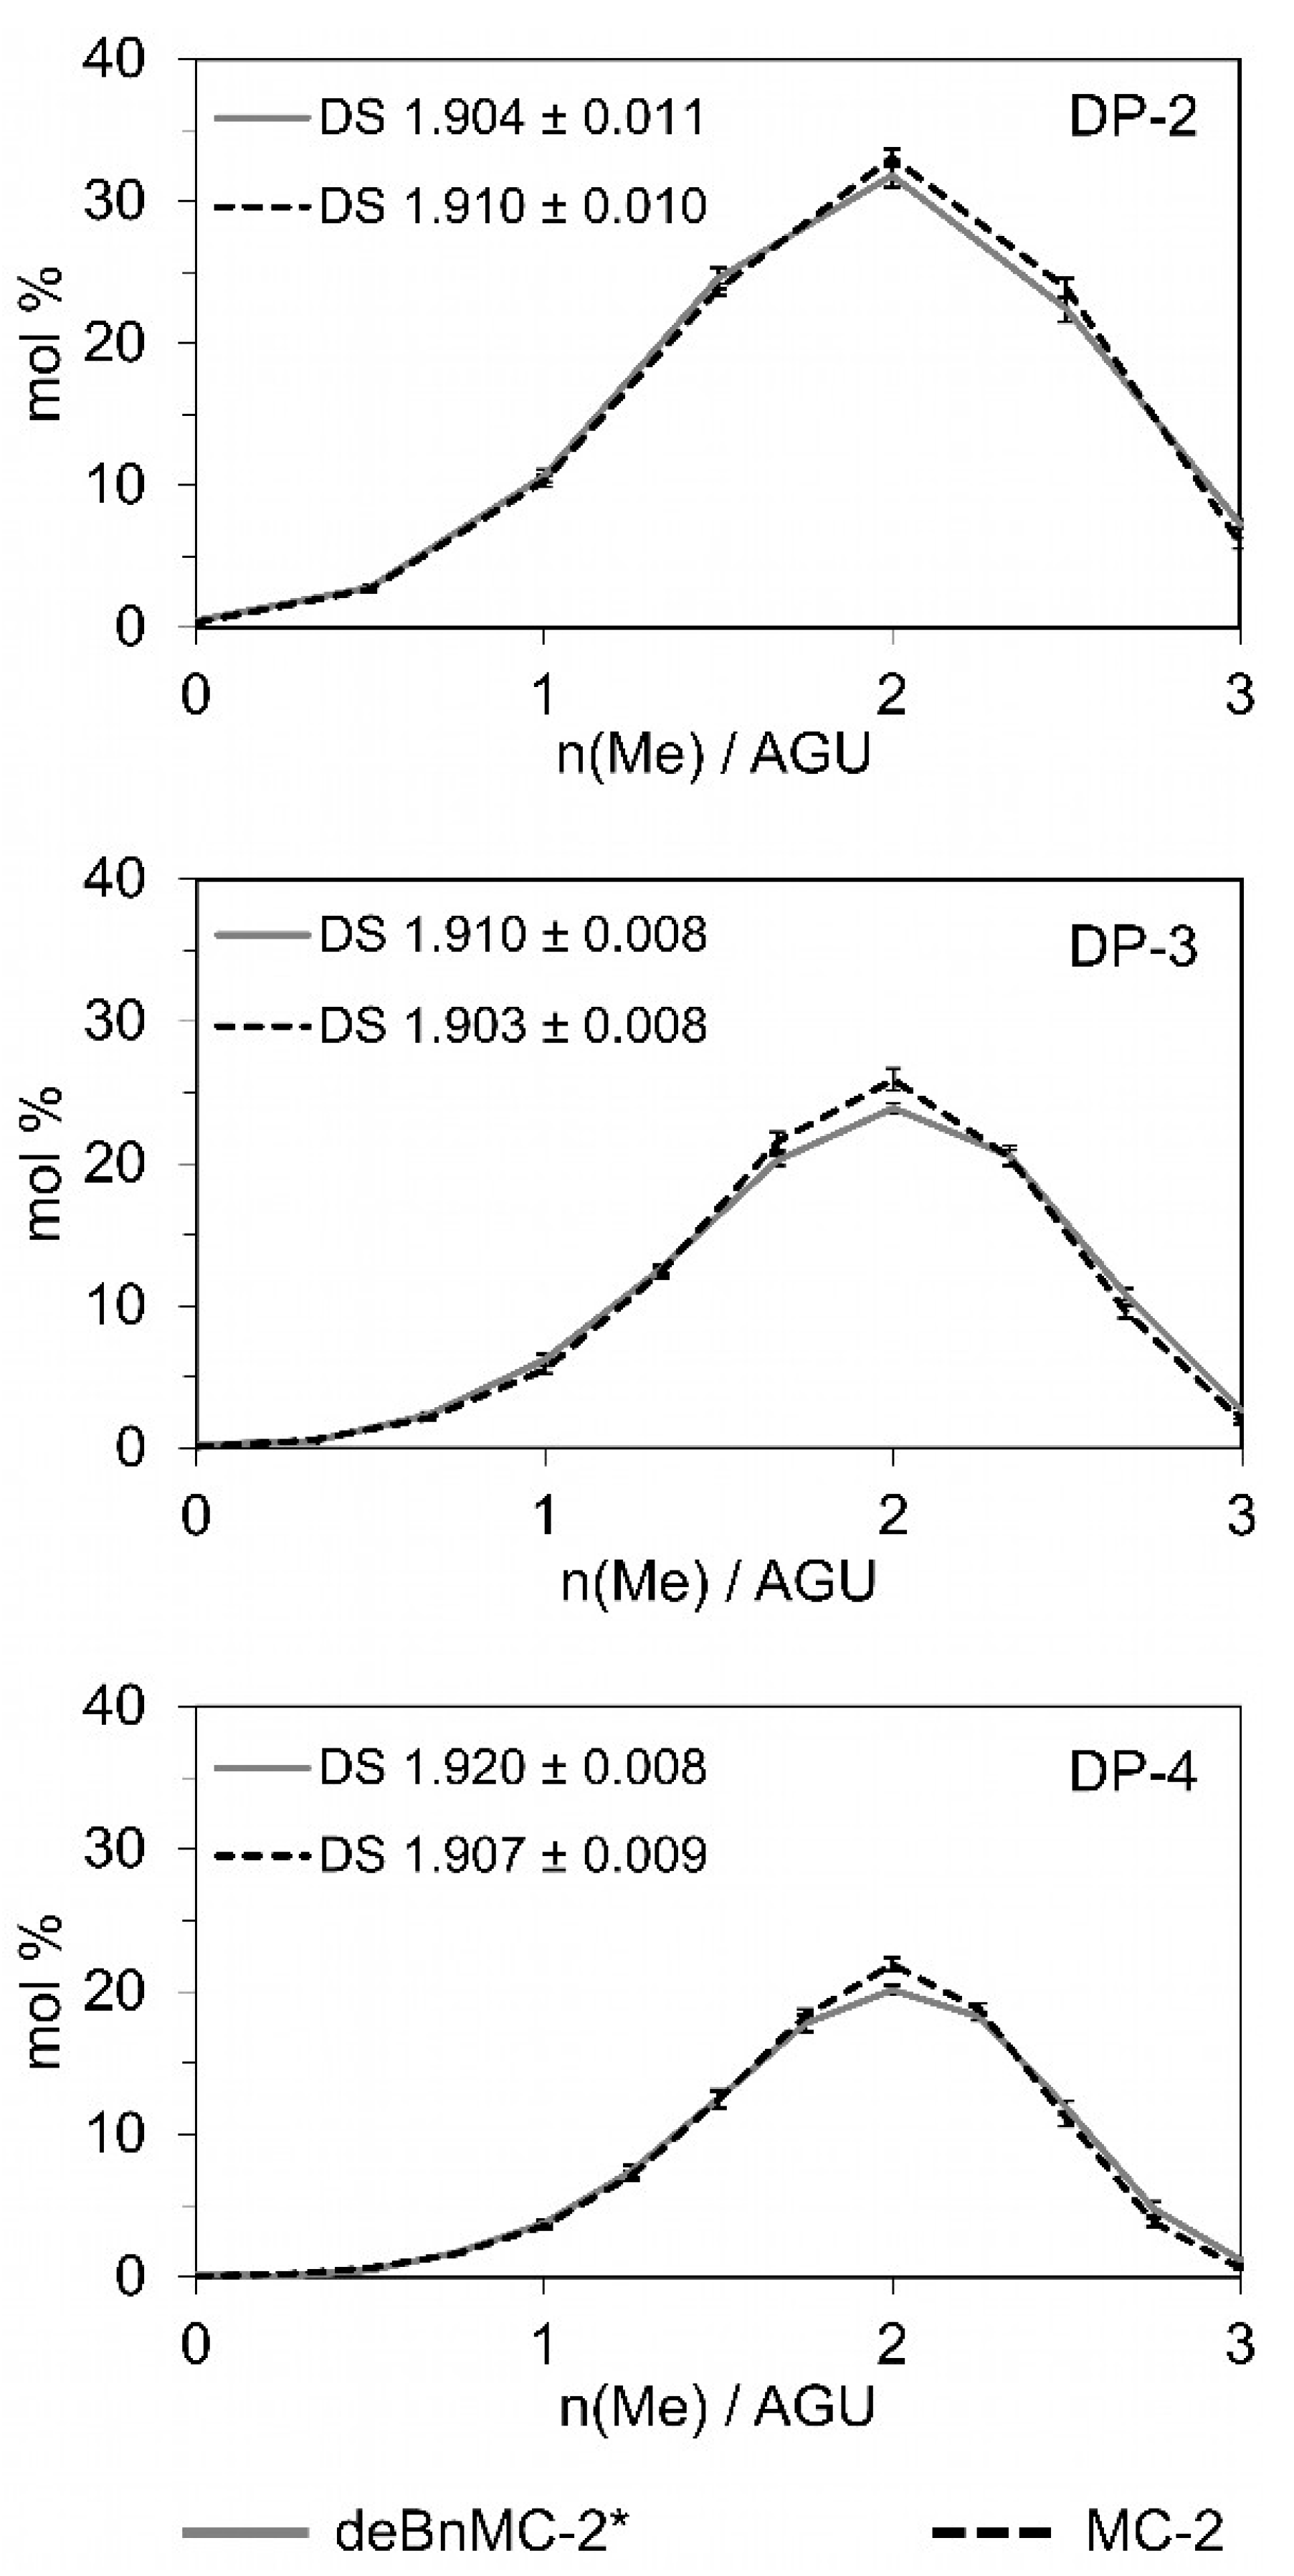
Consequently, as shown in Figure 4b, +2 HBu profiles were significantly reduced in the LC-MS spectrum, and the +1 HBu profiles shrank to 5–6 mol% in total, as determined by GLC-FID (Figure S13). Methyl patterns for DP-2 of deBnMC-2* and MC-2 are demonstrated by the zoomed-in insets on the corresponding spectra in Figure 4b,c, and are in good agreement with each other. Monomer analysis by GLC-FID also showed congruent DS values of deBnMC-2* (~1.86, Figure 5) and MC-2 (~1.87, Figure S3). Oligomer analysis was performed by quantitative LC-MS. Evaluated methyl substitution profiles and DS values for DP 2–4 of deBnMC-2* and MC-2 were in good agreement with each other (Figure 6).
Since attempts to run SEC of the debenzylated MCs failed, end-group analysis was applied in order to estimate the average degree of polymerization (Figure S13a). From the molar portion of tetra-O-methyl-glucitols (4.8 mol%), the average degree of polymerization of 20 (corresponding to Mn of 3700) was estimated (Figure S13b), which, due to the peralkylation step required, is systematically too low. It should be pointed out that even one break per chain might reduce the average Mw down to 50%.
Figure 4b proves that the removal of excess oxirane before alkaline treatment helps to reduce the amount of hydroxybutyl side-products. However, some part of this side-product was already formed during the slightly acidic conditions of the first step of debenzylation, i.e., free-radical bromination. To completely avoid this side-product, various strategies were examined as follows.
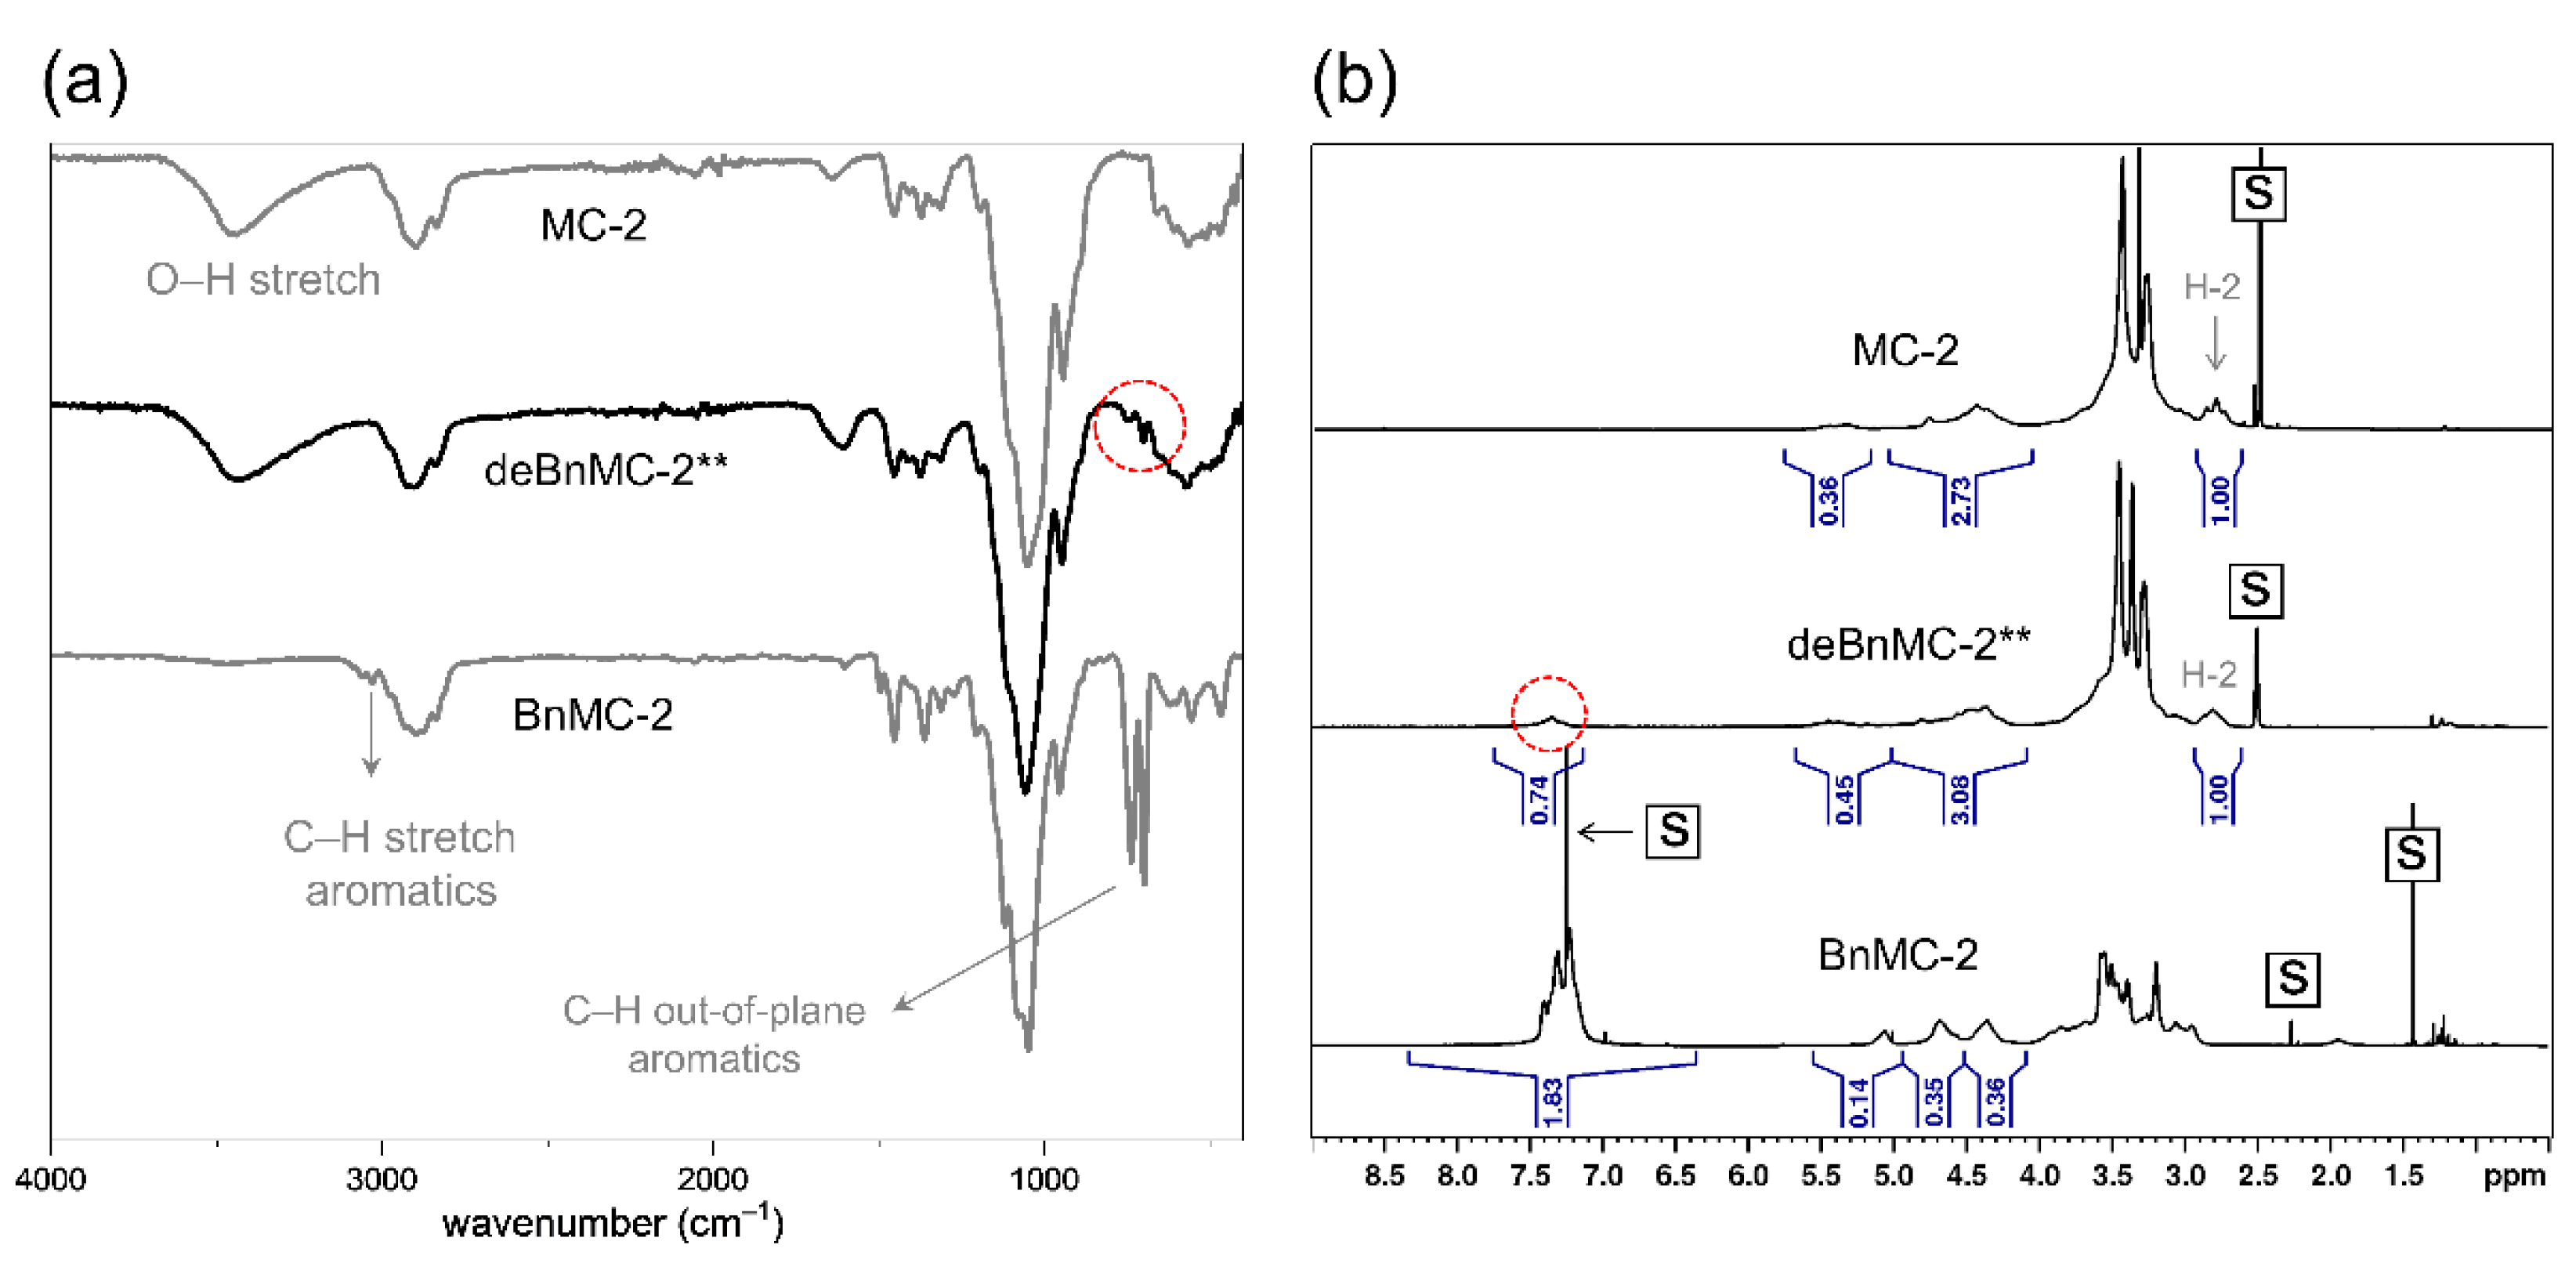
Our early experiments (Scheme 3) showed that bromination did not proceed under alkaline conditions. This meant that simply adding a base to neutralize the reaction medium was not an effective strategy. Alternatively, a non-nucleophilic weak base, DTBP [63,64] (1 eq./eq. NBS), was added to the reaction shown in Table 1, Method-2b as a replacement for 1,2-epoxybutane in Method-2a. The molar yield of the isolated products was not reproducible and spanned from 51 mol% to the highest value of 69 mol%, which is much lower than those of deBnMC-2* (81 mol%). The ATR-IR spectra (Figure 7a) and 1H NMR (Figure 7b) showed that a considerable number of aromatic groups were left, which could not be quantified due to the many weak and broad signals involved.
Another strategy was the addition of n-propanol (0.25–0.5 eq./eq. epoxy) and iso-propanol (0.25–0.5 eq./eq. epoxy) to the reaction mixture so that they could perhaps react with epoxy rings (under either nucleophilic substitution or radical driven mechanisms) instead of the hydroxy groups of the glucan. Lighter alcohols, such as MeOH or EtOH, were not soluble in the reaction medium and caused turbidity, even in very small quantities. Alcohols can react with NBS and result in its decomposition. Therefore, they were added in small quantities. The results, however, were not satisfying because of the incomplete debenzylation, and, in some cases, the formation of some side-products.
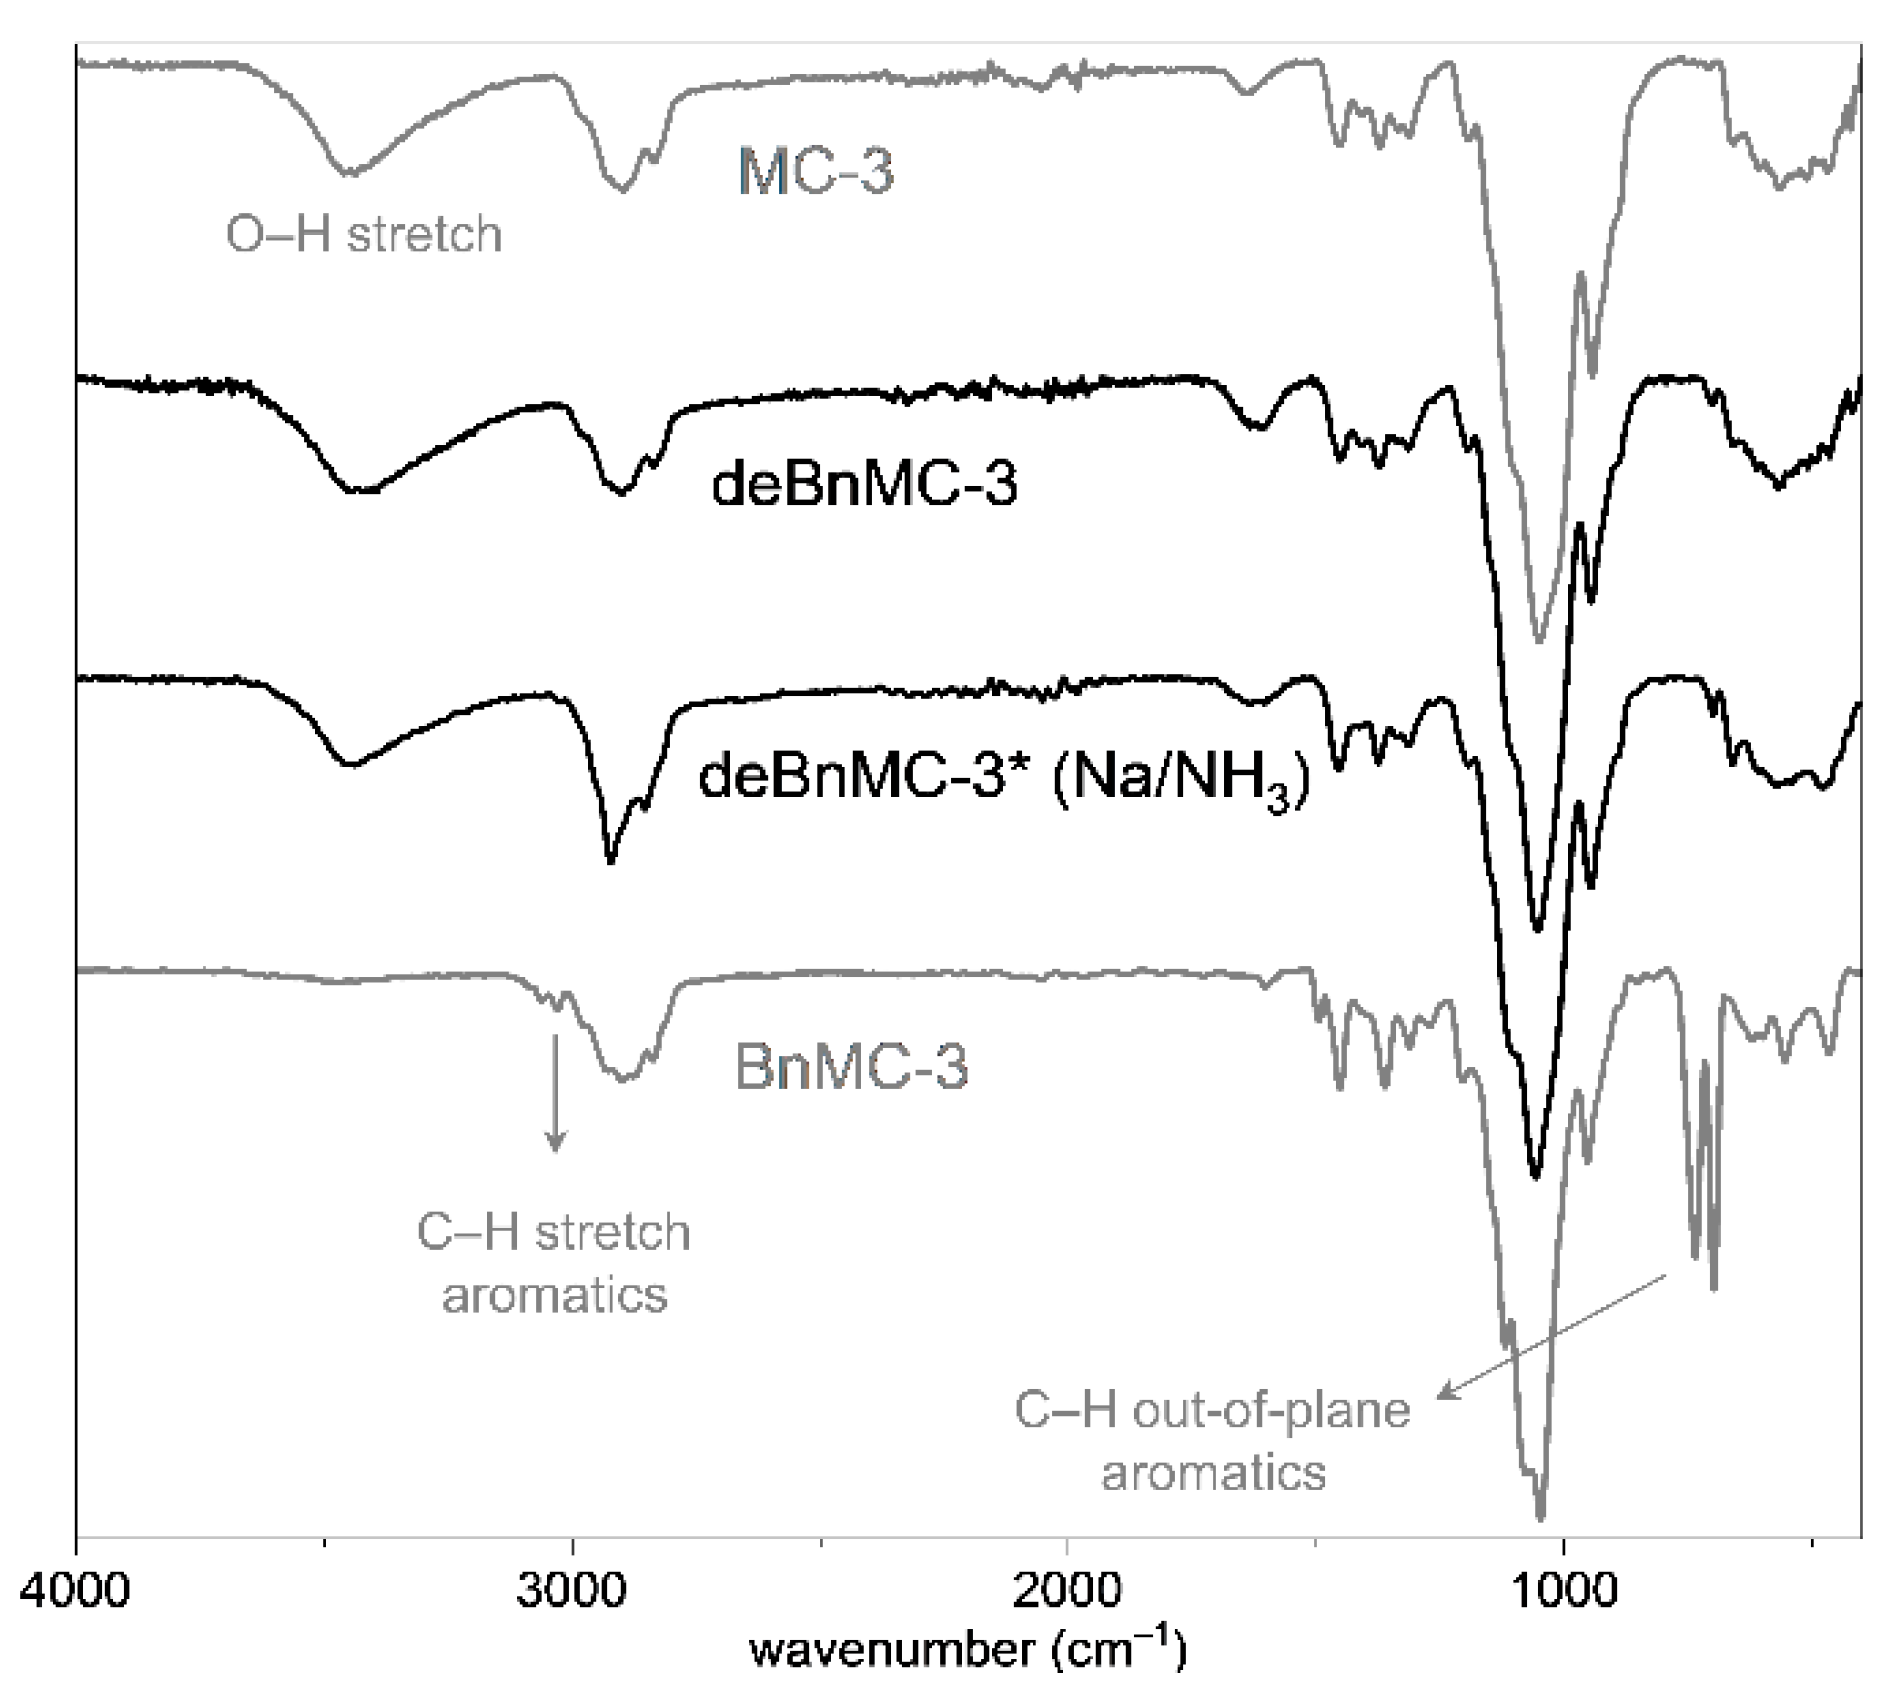
Ultimately, in order to reduce the formation of side-products, BnMC-3 (DSMe 1.89) was reacted with fewer equivalents of NBS (2 eq./eq. Bn), 1,2-epoxybutane (0.5 eq./eq. NBS), and DTBP (0.5 eq./eq. NBS), as well as n-propanol and iso-propanol (each 0.5 eq./eq. 1,2-epoxybutane) under UV-Vis radiation at 25 °C, followed by dialysis and subsequent treatment with methanolic NaOMe. The reaction was repeated one more time to obtain 63 mol% completely debenzylated product (deBnMC-3, Table 1, Method-2c), as judged by ATR-IR spectroscopy (Figure 8).
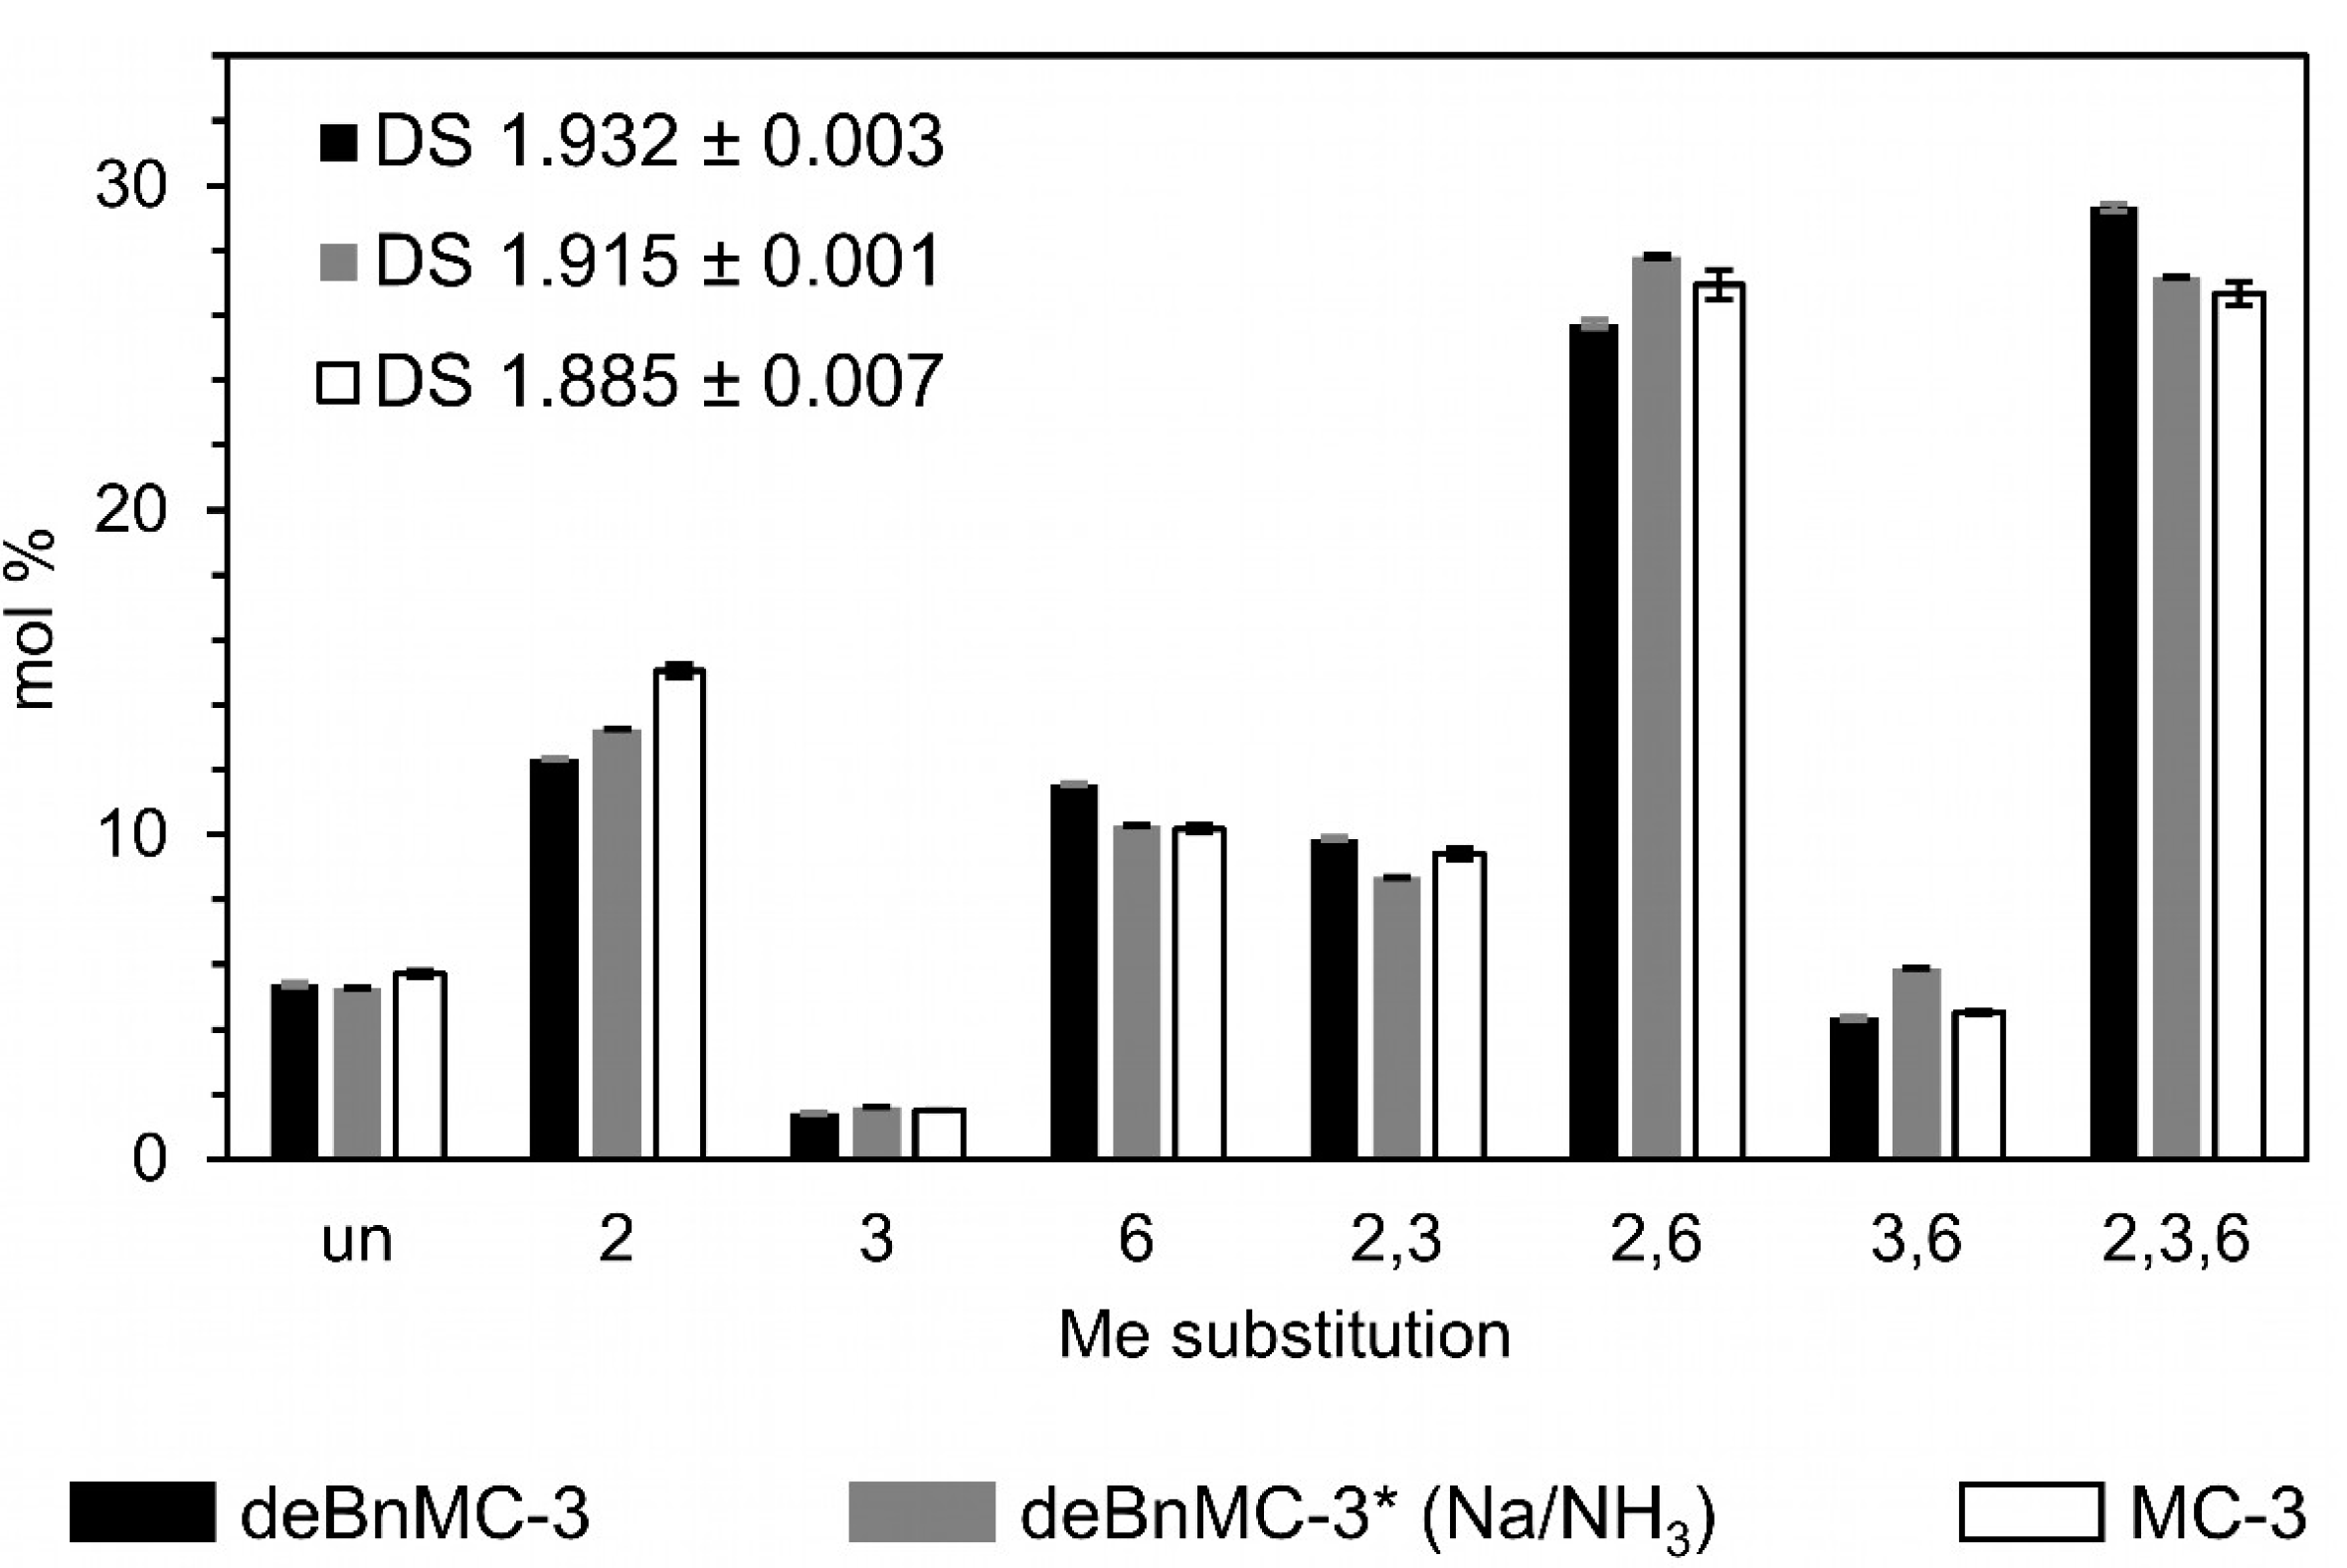
Despite the low product recovery yield, monomer and oligomer analysis data were in good agreement with those of the original MC, which means that the loss of material during the reaction work-up was not biased toward constituents with certain methyl substitution. As a result, Method-2c is a promising debenzylation method, particularly for the high throughput structural analysis of glucans. The analytical data are shown in Figure 8, Figure 9 and Figure 10 and are compared with those of debenzylation using Na/NH3(liq.) (Method-3, Table 1), which is described below.
3.3. Debenzylation Method-3 (Na/NH3)
To investigate the applicability of debenzylation of BnMC using Na/NH3(liq.) and also to provide a reference for comparison with the debenzylation Method-c, BnMC-3 was debenzylated by Na/NH3(liq.) as shown in Table 1, Method-3. For isolation of the debenzylated product after quenching, the reaction mixture was transferred to a dialysis membrane tube (MWCO 3500) and dialyzed against water. After freeze-drying, a completely debenzylated pure product, deBnMC-3* (Na/NH3), with a 99 mol% recovery yield was obtained.
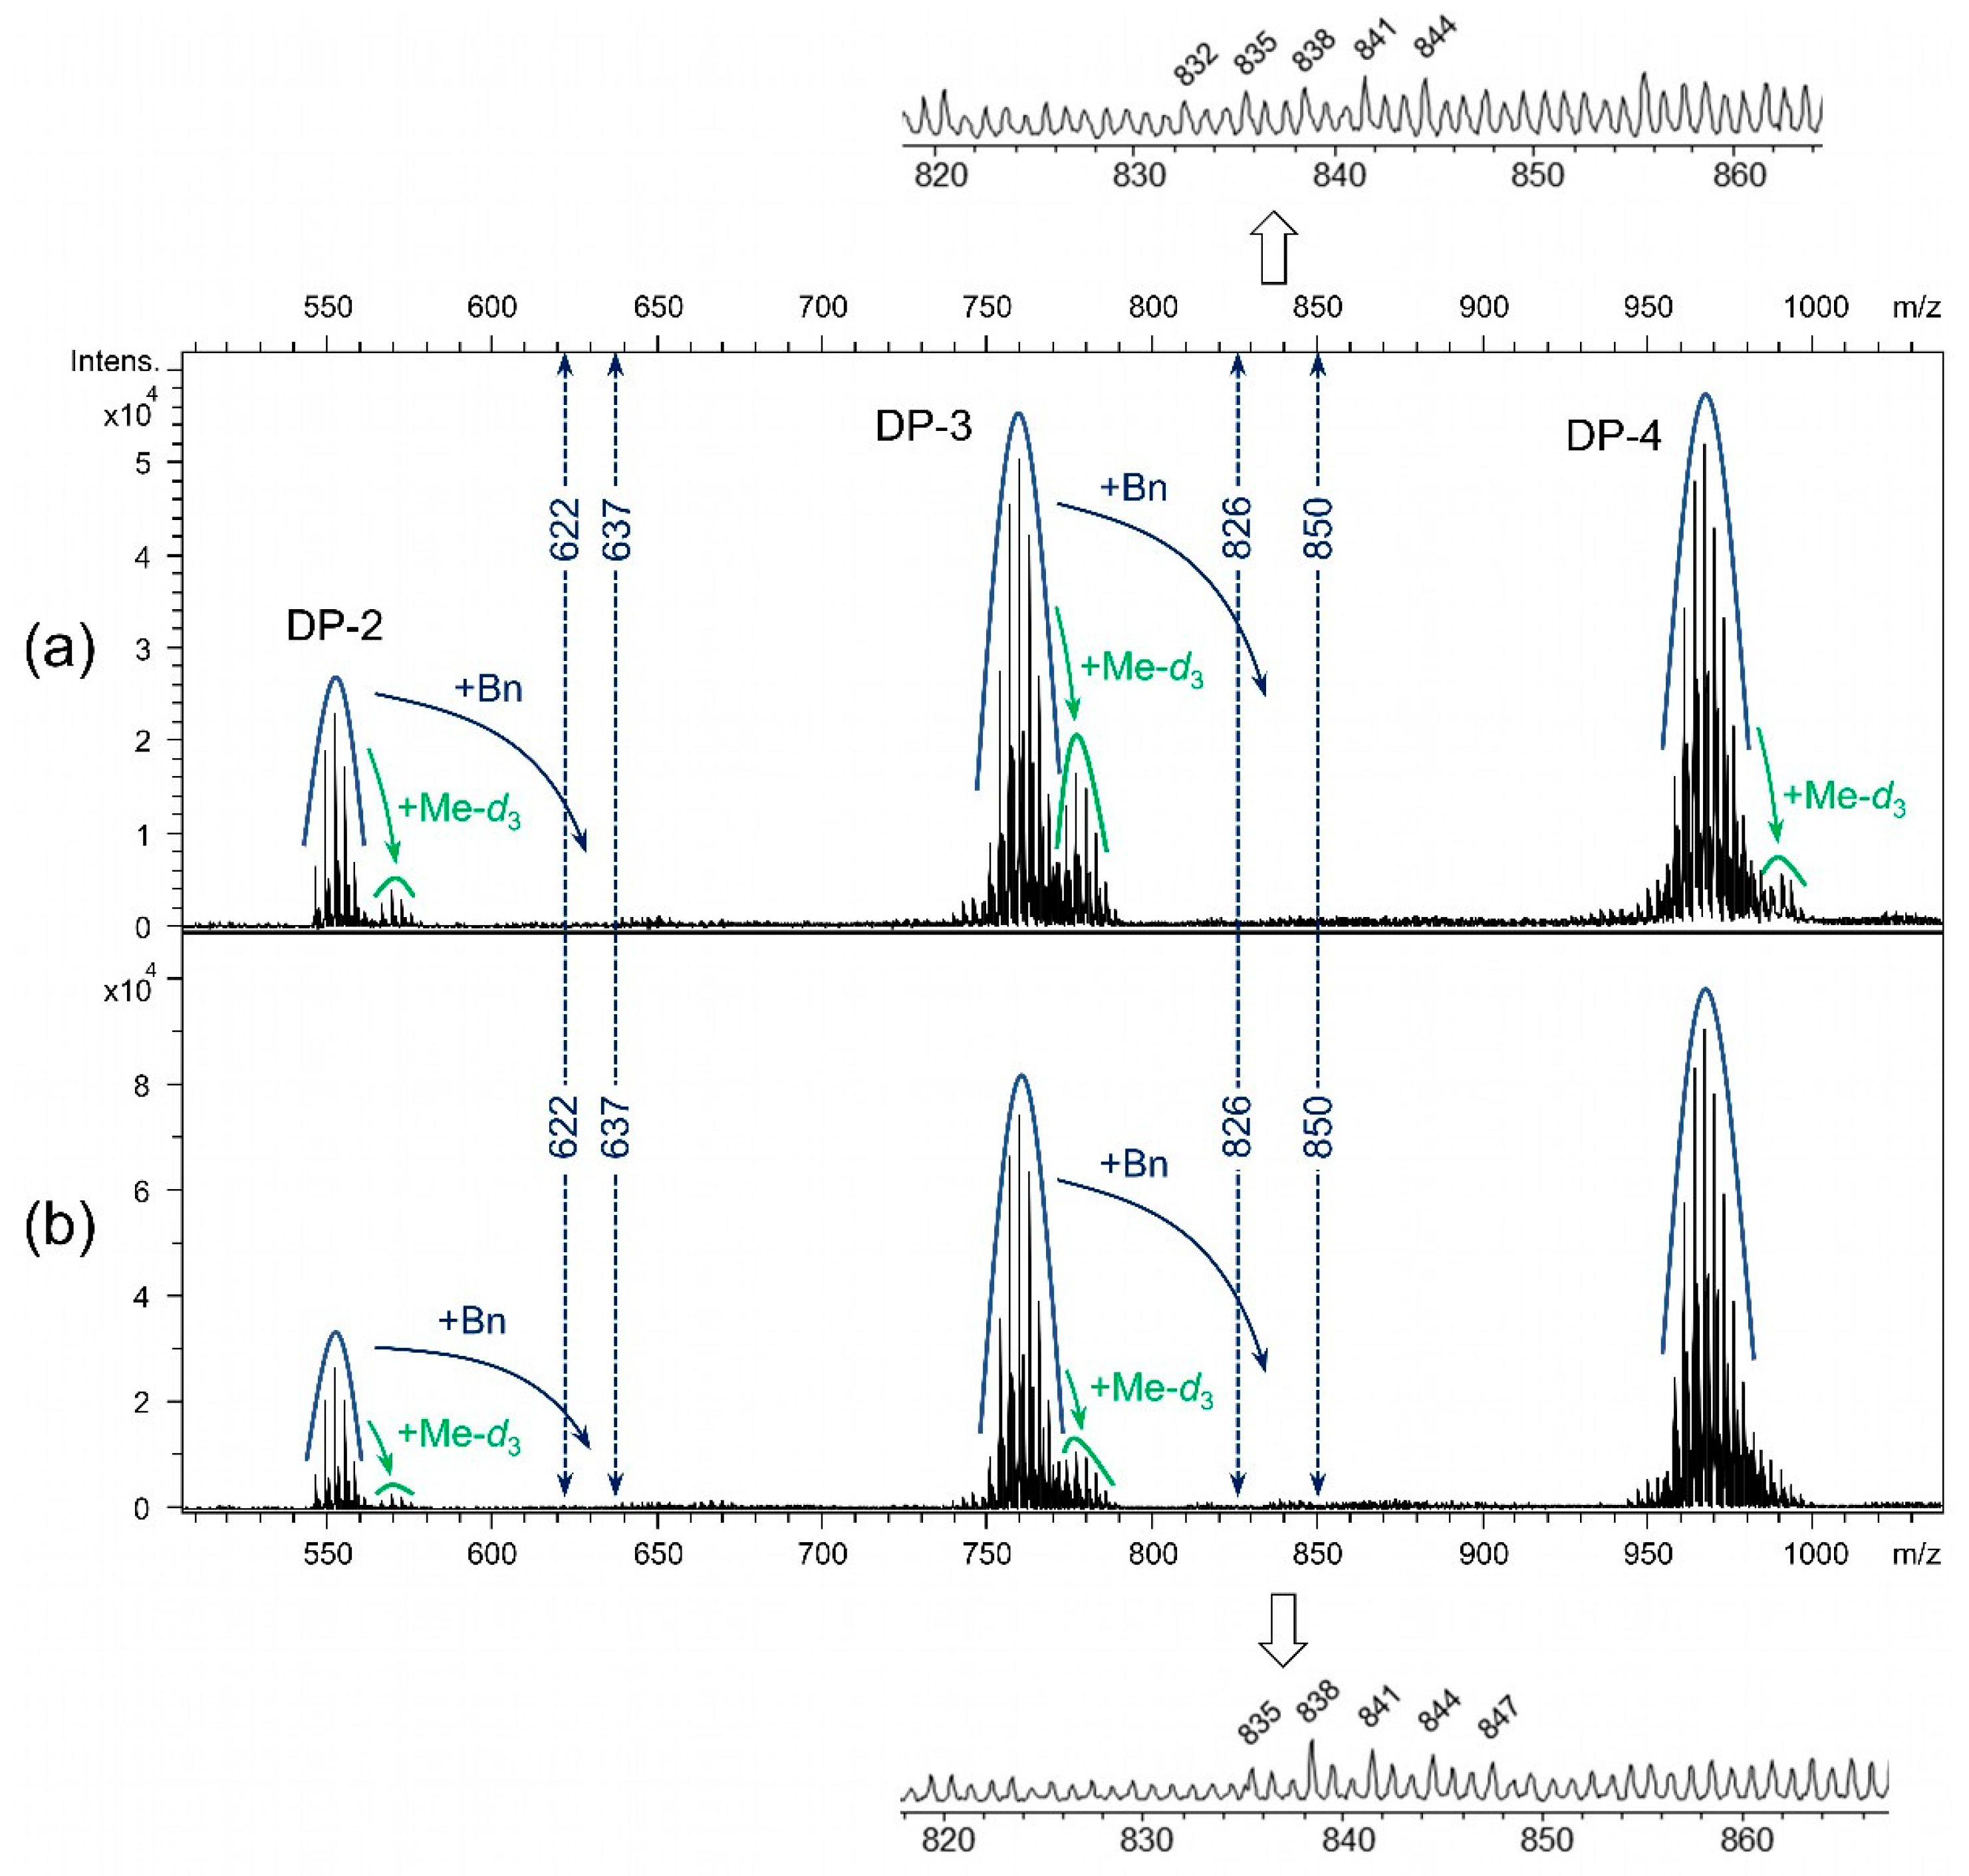
Mass spectra of deBnMC-3 and deBnMC-3* (Na/NH3), after deuteromethylation, partial hydrolysis, and labeling with m-ABA, showed negligible amounts of residual benzyl groups (Figure 9). Profiles marked with “+ Me-d3” belong to degraded chain ends produced during debenzylation and/or deuteromethylation (which are alkylated at the terminal 4-OH). The dashed lines indicate the m/z range where the DP-2 and DP-3 profiles containing residual benzyl groups (m/z + 73) appear. The m/z peaks of “DP-3 + Bn” (which are hardly visible above the background noise) are shown on the enlarged views of the “DP-3 + Bn” region. For instance, m/z 832 indicates a DP-3 with 6 Me, 2 Me-d3, and 1 Bn substituent.
From the end-group analysis, as outlined earlier, the average DPs of deBnMC-3 and deBnMC-3* (Na/NH3) were estimated to be 25 and 44, corresponding to Mn of 4700 and 8300, respectively. Due to chain degradation during permethylation, these average DP are too low, and may be used only for relative comparison. Monomer analysis data are illustrated in Figure 10. The ATR-IR spectra of deBnMC-3 (Method-2c, Table 1), deBnMC-3* (Na/NH3, Method-3, Table 1), and MC-3 (for comparison) are presented in Figure 8.
4. Conclusions
This study has shown that debenzylation by photo-initiated free-radical bromination and subsequent alkaline treatment is very sensitive to the choice of HBr scavengers and the work-up procedure. The development of homogeneous deprotection of BnMC (DSMe ~1.9, DSBn ~1.1) was carried out in a stepwise manner. Side-product-free and almost complete debenzylation was achieved when 1,2-epoxybutane and DTBP were used (as HBr scavengers) in the reaction, and the bromination product was purified by dialysis before the alkaline hydrolysis of the formed ester. The methyl patterns in the glucosyl unit and over the polymer chains for the recovered MC were not fully identical but were in sufficiently good agreement with those of the starting materials. Despite the measures taken to neutralize HBr and prevent chain degradation, a reduction in chain length was observed. However, this does not interfere with the application of this debenzylation method in the context of the analytical characterization of products comprising further depolymerization. Therefore, this method is, for instance, well suited for monitoring our transglycosylation studies of permethylated cellulose and BnMC, requiring deprotection steps for a larger number of samples in parallel in order to check the methyl pattern and average block length by LCMS. More laborious debenzylation using Na/NH3 resulted in a completely debenzylated product with a remarkably high recovery yield of 99 mol% and is, thus, the method of choice for synthetic applications.
Supplementary Materials
The following supporting information can be downloaded at: https://0-www-mdpi-com.brum.beds.ac.uk/article/10.3390/polysaccharides3030028/s1, Figure S1: Reaction setup for debenzylation by Method-3 (Na/NH3); Figure S2: Methyl pattern of MC-1 before benzylation; Figure S3: Methyl pattern of MC-2 before benzylation; Figure S4: Methyl pattern of MC-3 before benzylation; Figure S5: Me-profiles and DS values of MC-1 based on the oligomer analysis by LC-MS; Figure S6: Me-profiles and DS values of MC-2 based on the oligomer analysis by LC-MS; Figure S7: Me-profiles and DS values of MC-3 based on the oligomer analysis by LC-MS; Figure S8: Overlay of the Me-profiles of MC 1–3 based on the oligomer analysis by LC-MS; Figure S9: ATR-IR spectra of BnMC-1, BnMC-2, BnMC-3; Figure S10: 1H NMR spectra of BnMC-1, BnMC-2, BnMC-3; Figure S11: Sample preparation procedure for quantitative LC-MS analysis of MC and deBnMC; Figure S12: LC-ESI-MS spectrum-cuout of deBnMC-1; Figure S13: Estimation of the average degree of polymerization by end-group analysis using GLC.
Author Contributions
Conceptualization, P.H.; Formal analysis, P.H. and S.W.; Investigation, P.H., S.W. and A.K.; Methodology, P.H. and P.M.; Project administration, P.H., P.M., T.H. and A.K.; Supervision, P.M. and T.H.; Validation, all authors; Visualization, P.H.; Writing—original draft, P.H. and P.M. All authors have read and agreed to the published version of the manuscript.
Funding
This research project has received funding from Deutsche Forschungsgemeinschaft (DFG) Research Training Group GrK 1952/1 (Project number 232645976), Metrology for Complex Nanosystems (NanoMet).
Institutional Review Board Statement
Not applicable.
Informed Consent Statement
Not applicable.
Data Availability Statement
Not applicable.
Acknowledgments
The authors are grateful to Recep Gök and Gerold Jerz for performing the 1H NMR (300 MHz) spectroscopy of the samples. P.H. and P.M. gratefully acknowledge the support of the Deutsche Forschungsgemeinschaft (DFG) Research Training Group GrK 1952/1, Metrology for Complex Nanosystems (NanoMet), and the Braunschweig International Graduate School of Metrology (B IGSM).
Conflicts of Interest
The authors declare no conflict of interest.
References
- Kosma, P.; Wrodnigg, T.M.; Stütz, A.E. (Eds.) Carbohydrate Chemistry: Proven Synthetic Methods, 1st ed.; CRC Press: Boca Raton, FL, USA, 2020; Volume 5, ISBN 9781351256070. [Google Scholar]
- Ágoston, K.; Streicher, H.; Fügedi, P. Orthogonal protecting group strategies in carbohydrate chemistry. Tetrahedron Asymmetry 2016, 27, 707–728. [Google Scholar] [CrossRef]
- Das, R.; Mukhopadhyay, B. Chemical O-Glycosylations: An Overview. Chem. Open 2016, 5, 401–433. [Google Scholar] [CrossRef] [PubMed] [Green Version]
- Lipták, A.; Borbás, A.; Bajza, I. Protecting Group Manipulations in Carbohydrate Synthesis. In Comprehensive Glycoscience; Kamerling, H., Ed.; Elsevier: Oxford, UK, 2007; pp. 203–259. ISBN 978-0-444-51967-2. [Google Scholar]
- Wang, T.; Demchenko, A.V. Synthesis of carbohydrate building blocks via regioselective uniform protection/deprotection strategies. Org. Biomol. Chem. 2019, 17, 4934–4950. [Google Scholar] [CrossRef] [PubMed]
- Xiao, R.; Grinstaff, M.W. Chemical synthesis of polysaccharides and polysaccharide mimetics. Prog. Polym. Sci. 2017, 74, 78–116. [Google Scholar] [CrossRef]
- Wuts, P.G.M. Protection for the hydroxyl group, including 1,2- and 1,3-diols. In Greene’s Protective Groups in Organic Synthesis; John Wiley & Sons, Inc.: Hoboken, NJ, USA, 2014; pp. 17–471. ISBN 9781118905074. [Google Scholar]
- Werz, D.B. Chemical Synthesis of Carbohydrates and Their Surface Immobilization: A Brief Introduction. Methods Mol. Biol. 2012, 808, 13–29. [Google Scholar] [CrossRef] [PubMed]
- Dane, E.L.; Grinstaff, M.W. Poly-amido-saccharides: Synthesis via Anionic Polymerization of a β-Lactam Sugar Monomer. J. Am. Chem. Soc. 2012, 134, 16255–16264. [Google Scholar] [CrossRef] [PubMed] [Green Version]
- Seeberger, P.H. Automated oligosaccharide synthesis. Chem. Soc. Rev. 2008, 37, 19–28. [Google Scholar] [CrossRef]
- Iserloh, U.; Dudkin, V.; Wang, Z.-G.; Danishefsky, S.J. Reducing oligosaccharides via glycal assembly: On the remarkable stability of anomeric hydroxyl groups to global deprotection with sodium in liquid ammonia. Tetrahedron Lett. 2002, 43, 7027–7030. [Google Scholar] [CrossRef]
- Nakatsubo, F.; Kamitakahara, H.; Hori, M. Cationic Ring-Opening Polymerization of 3,6-Di-O-benzyl-α-d-glucose 1,2,4-Orthopivalate and the First Chemical Synthesis of Cellulose. J. Am. Chem. Soc. 1996, 118, 1677–1681. [Google Scholar] [CrossRef]
- Birch, A.J. The Birch reduction in organic synthesis. Pure Appl. Chem. 1996, 68, 553–556. [Google Scholar] [CrossRef]
- Micheel, F.; Brodde, O.-E.; Reinking, K. Versuche zur Polykondensation von 2,3,6-Tri-O-benzyl-D-glucopyranose und Polymerisation von 1,4-Anhydro-2,3,6-tri-O-benzyl-α-D-glucopyranose. Justus Liebigs Ann. Chem. 1974, 1974, 124–136. [Google Scholar] [CrossRef]
- Schuerch, C. Systematic approaches to the chemical synthesis of polysaccharides. Accounts Chem. Res. 1973, 6, 184–191. [Google Scholar] [CrossRef]
- Uryu, T.; Schuerch, C. Preparation of High Molecular Weight 2,3,4-Tri-O-benzyl-[1→6]-α-d-gluco-and-galactopyranan and [1→6]-α-D-Glucopyranan. Macromolecules 1971, 4, 342–345. [Google Scholar] [CrossRef]
- Ruckel, E.R.; Schuerch, C. Chemical synthesis of a dextran model, poly-α-(1→6)-anhydro-d-glucopyranose. Biopolymers 1967, 5, 515–523. [Google Scholar] [CrossRef]
- Ruckel, E.R.; Schuerch, C. Chemical Synthesis of a Stereoregular Linear Polysaccharide. J. Am. Chem. Soc. 1966, 88, 2605–2606. [Google Scholar] [CrossRef]
- Abe, M.; Sugimura, K.; Nishiyama, Y.; Nishio, Y. Rapid Benzylation of Cellulose in Tetra-n-butylphosphonium Hydroxide Aqueous Solution at Room Temperature. ACS Sustain. Chem. Eng. 2017, 5, 4505–4510. [Google Scholar] [CrossRef] [Green Version]
- Sundman, O.; Gillgern, T.; Broström, M. Homogenous benzylation of cellulose—Impact of different methods on product properties. Cellul. Chem. Technol. 2015, 49, 745–755. [Google Scholar]
- Rohleder, E.; Heinze, T. Comparison of Benzyl Celluloses Synthesized in Aqueous NaOH and Dimethyl Sulfoxide/Tetrabutylammonium Fluoride. Macromol. Symp. 2010, 294, 107–116. [Google Scholar] [CrossRef]
- Ge, W.; Shuai, J.; Wang, Y.; Zhou, Y.; Wang, X. Progress on chemical modification of cellulose in “green” solvents. Polym. Chem. 2022, 13, 359–372. [Google Scholar] [CrossRef]
- Heinze, T.; El Seoud, O.A.; Koschella, A. (Eds.) Cellulose Derivatives: Synthesis, Structure, and Properties; Springer: Cham, Switzerland, 2018; ISBN 978-3-319-73167-4. [Google Scholar]
- Kamitakahara, H.; Hori, M.; Nakatsubo, F. Substituent Effect on Ring-Opening Polymerization of Regioselectively Acylated α-d-Glucopyranose 1,2,4-Orthopivalate Derivatives. Macromolecules 1996, 29, 6126–6131. [Google Scholar] [CrossRef]
- Ikegami, W.; Kamitakahara, H.; Teramoto, Y.; Takano, T. Synthesis of optically inactive cellulose via cationic ring-opening polymerization. Cellulose 2021, 28, 6125–6132. [Google Scholar] [CrossRef]
- Adelwöhrer, C.; Takano, T.; Nakatsubo, F.; Rosenau, T. Synthesis of 13C-Perlabeled Cellulose with more than 99% Isotopic Enrichment by a Cationic Ring-Opening Polymerization Approach. Biomacromolecules 2009, 10, 2817–2822. [Google Scholar] [CrossRef] [PubMed]
- Heinze, T.; El Seoud, O.A.; Koschella, A. (Eds.) Principles of Cellulose Derivatization. In Cellulose Derivatives: Synthesis, Structure, and Properties; Springer: Cham, Switzerland, 2018; pp. 259–292. [Google Scholar]
- Kamitakahara, H.; Koschella, A.; Mikawa, Y.; Nakatsubo, F.; Heinze, T.; Klemm, D. Syntheses and Comparison of 2,6-Di-O-methyl Celluloses from Natural and Synthetic Celluloses. Macromol. Biosci. 2008, 8, 690–700. [Google Scholar] [CrossRef] [PubMed]
- Fox, S.C.; Li, B.; Xu, D.; Edgar, K.J. Regioselective Esterification and Etherification of Cellulose: A Review. Biomacromolecules 2011, 12, 1956–1972. [Google Scholar] [CrossRef] [PubMed]
- Kamitakahara, H.; Funakoshi, T.; Takano, T.; Nakatsubo, F. Syntheses of 2,6-O-alkyl celluloses: Influence of methyl and ethyl groups regioselectively introduced at O-2 and O-6 positions on their solubility. Cellulose 2009, 16, 1167–1178. [Google Scholar] [CrossRef]
- Binkley, R.W.; Hehemann, D.G. A light-initiated process for rapid debenzylation of carbohydrates. J. Org. Chem. 1990, 55, 378–380. [Google Scholar] [CrossRef]
- BeMiller, J.N.; Wing, R.E.; Meyers, C.Y. Specific debenzylation of alkylated carbohydrates via bromination-hydrolysis. J. Org. Chem. 1968, 33, 4292–4294. [Google Scholar] [CrossRef]
- Kobayashi, K.; Ichikawa, H.; Sumitomo, H. Regioselectively modified stereoregular polysaccharides. 11. Synthesis of (1→6)-α-D-glucopyranans having one long hydrocarbon chain in position 3 in each repeating unit. Macromolecules 1990, 23, 3708–3710. [Google Scholar] [CrossRef]
- Rother, M.; Radke, W.; Mischnick, P. Block-Structured 1,4-d-Glucans by Transglycosidation of Cellulose Ethers. Macromol. Chem. Phys. 2016, 217, 889–900. [Google Scholar] [CrossRef]
- Hashemi, P.; Mischnick, P. 1,4-D-Glucan block copolymers: Synthesis and comprehensive structural characterization. Anal. Bioanal. Chem. 2020, 412, 1597–1610. [Google Scholar] [CrossRef] [Green Version]
- Hashemi, P. Nano-Structuring of Glucan Ether Block-Copolymers and Structural Analysis by Quantitative Mass Spectrometry. In Dissertation; Technische Universität Braunschweig: Braunschweig, Germany, 2020. [Google Scholar]
- Cuers, J.; Unterieser, I.; Burchard, W.; Adden, R.; Rinken, M.; Mischnick, P. Simultaneous determination of substituent patterns in partially acid hydrolyzed O-Me/O-Me-d3-cellulose and quantification of the obtained oligomers by HPLC-ESI-MS. Carbohydr. Res. 2012, 348, 55–63. [Google Scholar] [CrossRef] [PubMed]
- Mischnick, P.; Heinrich, J.; Gohdes, M.; Wilke, O.; Rogmann, N. Structure analysis of 1,4-glucan derivatives. Macromol. Chem. Phys. 2000, 201, 1985–1995. [Google Scholar] [CrossRef]
- Mischnick, P.; Voiges, K.; Cuers-Dammann, J.; Unterieser, I.; Sudwischer, P.; Wubben, A.; Hashemi, P. Analysis of the Heterogeneities of First and Second Order of Cellulose Derivatives: A Complex Challenge. Polysaccharides 2021, 2, 843–865. [Google Scholar] [CrossRef]
- Voiges, K.; Adden, R.; Rinken, M.; Mischnick, P. Critical re-investigation of the alditol acetate method for analysis of substituent distribution in methyl cellulose. Cellulose 2012, 19, 993–1004. [Google Scholar] [CrossRef]
- Nakagawa, A.; Fenn, D.; Koschella, A.; Heinze, T.; Kamitakahara, H. Physical properties of diblock methylcellulose derivatives with regioselective functionalization patterns: First direct evidence that a sequence of 2,3,6-tri-O-methyl-glucopyranosyl units causes thermoreversible gelation of methylcellulose. J. Polym. Sci. B. Polym. Phys. 2011, 49, 1539–1546. [Google Scholar] [CrossRef]
- BeMiller, J.N.; Muenchow, H.L. Debenzylation of carbohydrate benzyl ethers and benzyl glycosides via free-radical bromination. Carbohydr. Res. 1973, 28, 253–262. [Google Scholar] [CrossRef]
- Mayhoub, A.; Talukdar, A.; Cushman, M. An Oxidation of Benzyl Methyl Ethers with NBS that Selectively Affords Either Aromatic Aldehydes or Aromatic Methyl Esters. J. Org. Chem. 2010, 75, 3507–3510. [Google Scholar] [CrossRef] [Green Version]
- Hou, D.; Lowary, T. Recent advances in the synthesis of 2-deoxy-glycosides. Carbohydr. Res. 2009, 344, 1911–1940. [Google Scholar] [CrossRef]
- Summerfelt, S.T. Ozonation and UV irradiation—An introduction and examples of current applications. Aquac. Eng. 2003, 28, 21–36. [Google Scholar] [CrossRef] [Green Version]
- Lämmerhardt, N.; Hashemi, P.; Mischnick, P. Comprehensive structural analysis of a set of various branched glucans by standard methylation analysis, 1H NMR spectroscopy, ESI-mass spectrometry, and capillary electrophoresis. Carbohydr. Res. 2020, 489, 107933. [Google Scholar] [CrossRef]
- Jorgensen, A.D.; Picel, K.C.; Stamoudis, V.C. Prediction of gas chromatography flame ionization detector response factors from molecular structures. Anal. Chem. 2012, 62, 683–689. [Google Scholar] [CrossRef]
- Scanlon, J.T.; Willis, D.E. Calculation of Flame Ionization Detector Relative Response Factors Using the Effective Carbon Number Concept. J. Chromatogr. Sci. 1985, 23, 333–340. [Google Scholar] [CrossRef]
- Sweet, D.P.; Shapiro, R.H.; Albersheim, P. Quantitative analysis by various g.l.c. response-factor theories for partially methylated and partially ethylated alditol acetates. Carbohydr. Res. 1975, 40, 217–225. [Google Scholar] [CrossRef]
- Ellison, S.L.; Williams, A. Eurachem/CITAC Guide: Quantifying Uncertainty in Analytical Measurement. Available online: https://eurachem.org/index.php/publications/guides/quam (accessed on 18 June 2022).
- Leito, I.; Helm, I.; Jalukse, L. Using MOOCs for teaching analytical chemistry: Experience at University of Tartu. Anal. Bioanal. Chem. 2015, 407, 1277–1281. [Google Scholar] [CrossRef] [PubMed] [Green Version]
- Leito, I. Estimation of Measurement Uncertainties in Chemical Analysis: 6. Random and Systematic Effects Revisited. Available online: https://sisu.ut.ee/measurement/6-random-and-systematic-effects-revisited (accessed on 18 June 2022).
- Magnusson, B.; Näykki, T.; Hovind, H.; Krysell, M. Handbook for Calculation of Measurement Uncertainty in Environmental Laboratories, 3.1th ed.Nordtest: Oslo, Norway, 2012. [Google Scholar]
- Majcen, N.; Gegevičius, V. (Eds.) Analytical Measurement: Measurement Uncertainty and Statistics; Publications Office: Luxembourg, 2012; ISBN 978-92-79-23071-4. [Google Scholar]
- Hashemi, P.; Luckau, L.; Mischnick, P.; Schmidt, S.; Stosch, R.; Wünsch, B. Biomacromolecules as tools and objects in nanometrology—Current challenges and perspectives. Anal. Bioanal. Chem. 2017, 409, 5901–5909. [Google Scholar] [CrossRef] [PubMed] [Green Version]
- Revathi, L.; Ravindar, L.; Fang, W.-Y.; Rakesh, K.P.; Qin, H.-L. Visible Light-Induced C-H Bond Functionalization: A Critical Review. Adv. Synth. Catal. 2018, 360, 4652–4698. [Google Scholar] [CrossRef]
- Urgoitia, G.; Sanmartin, R.; Herrero, M.T.; Domínguez, E.; Faces, R.S.M. Vanadium-Catalyzed Oxidative Debenzylation of O-Benzyl Ethers at ppm Level. Adv. Synth. Catal. 2016, 358, 3307–3312. [Google Scholar] [CrossRef]
- Lu, P.; Hou, T.; Gu, X.; Li, P. Visible-Light-Promoted Conversion of Alkyl Benzyl Ether to Alkyl Ester or Alcohol via O-α-sp3 C–H Cleavage. Org. Lett. 2015, 17, 1954–1957. [Google Scholar] [CrossRef]
- Chow, Y.L.; Zhao, D.C. Photodecomposition of N-bromosuccinimide. Radical chain carriers and their interrelations. J. Org. Chem. 1987, 52, 1931–1939. [Google Scholar] [CrossRef]
- Byun, E.-H.; Kim, J.-H.; Sung, N.-Y.; Choi, J.-I.; Lim, S.-T.; Kim, K.-H.; Yook, H.-S.; Byun, M.-W.; Lee, J.-W. Effects of gamma irradiation on the physical and structural properties of β-glucan. Radiat. Phys. Chem. 2008, 77, 781–786. [Google Scholar] [CrossRef]
- Cuers, J.; Rinken, M.; Adden, R.; Mischnick, P. Critical investigation of the substituent distribution in the polymer chains of hydroxypropyl methylcelluloses by (LC-)ESI-MS. Anal. Bioanal. Chem. 2013, 405, 9021–9032. [Google Scholar] [CrossRef] [PubMed]
- Senanayake, C.H.; Fredenburgh, L.E.; Reamer, R.A.; Larsen, R.D.; Verhoeven, T.R.; Reider, P.J. Nature of N-Bromosuccinimide in Basic Media: The True Oxidizing Species in the Hofmann Rearrangement. J. Am. Chem. Soc. 1994, 116, 7947–7948. [Google Scholar] [CrossRef]
- Kostikov, R.R.; Francisco, S.-S.; Garranzo, M.; Murcia, M.C. 2,6-Di-t-butylpyridine. In Encyclopedia of Reagents for Organic Synthesis; Paquette, L.A., Ed.; Wiley: Chichester, NY, USA, 1995; ISBN 0471936235. [Google Scholar]
- Benoit, R.L.; Fréchette, M.; Lefebvre, D. 2,6-Di-tert-butylpyridine: An unusually weak base in dimethylsulfoxide. Can. J. Chem. 1988, 66, 1159–1162. [Google Scholar] [CrossRef] [Green Version]
Scheme 1.
Debenzylation of BnMC using the conventional debenzylation methods in carbohydrate and organic chemistry, and the method reported in this manuscript.
Scheme 1.
Debenzylation of BnMC using the conventional debenzylation methods in carbohydrate and organic chemistry, and the method reported in this manuscript.

Scheme 2.
(a) Possible pathways of oxidation of benzyl methyl ethers with NBS (b) Oxidation reactions of benzyl methyl ether. Adapted with permission from Ref. [43]. 2010 copyright American Chemical Society.
Scheme 2.
(a) Possible pathways of oxidation of benzyl methyl ethers with NBS (b) Oxidation reactions of benzyl methyl ether. Adapted with permission from Ref. [43]. 2010 copyright American Chemical Society.

Figure 1.
The ATR-IR spectrum of debenzylated BnMC-1 by homogeneous catalytic conversion in the presence of the Ir-catalyst (Scheme 1). Spectra of MC-1 and BnMC-1 are shown for comparison. The dashed-line circle shows peaks of the remaining aromatic groups.
Figure 1.
The ATR-IR spectrum of debenzylated BnMC-1 by homogeneous catalytic conversion in the presence of the Ir-catalyst (Scheme 1). Spectra of MC-1 and BnMC-1 are shown for comparison. The dashed-line circle shows peaks of the remaining aromatic groups.

Scheme 3.
Summary of investigated reaction parameters for debenzylation of BnMC.

Figure 2.
(a) ATR-IR spectrum of deBnMC-1 (Method-1, Table 1). Spectra of MC-1 and BnMC-1 are shown for comparison. (b) 1H NMR spectra of MC-1 (600 MHz, DMSO-d6), deBnMC-1 (300 MHz, DMSO-d6), and BnMC-1 (300 MHz, CDCl3).
Figure 2.
(a) ATR-IR spectrum of deBnMC-1 (Method-1, Table 1). Spectra of MC-1 and BnMC-1 are shown for comparison. (b) 1H NMR spectra of MC-1 (600 MHz, DMSO-d6), deBnMC-1 (300 MHz, DMSO-d6), and BnMC-1 (300 MHz, CDCl3).

Figure 3.
(a) The GLC-FID chromatogram of deBnMC-1 (Method-1, Table 1). Numbers on the peaks show the methyl substitution position on AGU; (b) Evaluated methyl substitution pattern of deBnMC-1 and MC-1 based on monomer analysis of alditol acetates by GLC-FID. The MC-1 was analyzed after perethylation, while MC-1 after benzylation and debenzylation was analyzed without perethylation. For details, refer to the Materials and Methods Section 2.6.1.

Figure 4.
(a) Cutouts of LC-MS spectra of deBnMC-2 (Method-1, Table 1) showing DP-2 and its additional side-products when debenzylation is performed in one-pot (peaks of DP-2 + 3 HBu overlap with the peaks of DP-3 and are not shown) versus (b) when the reaction mixture is purified before alkaline hydrolysis (deBnMC-2*, Method-2a, Table 1). Only trivial amounts of DP-2 + 3 HBu (at the background noise level of LC-MS) were detected by LC-MS; (c) a cutout of the LC-MS spectrum of MC-2 is displayed for comparison. Insets exhibit zoomed-in views of the main methyl substitution profiles of corresponding spectra. Samples are deuteromethylated, partially hydrolyzed, and labeled with m-ABA. For details refer to the Materials and Methods Section 2.7.

Figure 5.
Methyl substitution pattern of deBnMC-2 (Method-1, Table 1), deBnMC-2* (Method-2a, Table 1), deBnMC-2** (Method-2b, Table 1), and MC-2 (for comparison) evaluated based on monomer analysis of alditol acetates by GLC-FID. For details refer to the Materials and Methods Section 2.6.1.
Figure 5.
Methyl substitution pattern of deBnMC-2 (Method-1, Table 1), deBnMC-2* (Method-2a, Table 1), deBnMC-2** (Method-2b, Table 1), and MC-2 (for comparison) evaluated based on monomer analysis of alditol acetates by GLC-FID. For details refer to the Materials and Methods Section 2.6.1.

Figure 6.
Evaluated methyl substitution profile and DS values of deBnMC-2* (Method-2a, Table 1) and MC-2 (for comparison) based on the oligomer analysis acquired by quantitative LC-ESI-MS of m-ABA-labeled oligosaccharides. For details refer to the Materials and Methods Section 2.7.1.
Figure 6.
Evaluated methyl substitution profile and DS values of deBnMC-2* (Method-2a, Table 1) and MC-2 (for comparison) based on the oligomer analysis acquired by quantitative LC-ESI-MS of m-ABA-labeled oligosaccharides. For details refer to the Materials and Methods Section 2.7.1.

Figure 7.
(a) The ATR-IR spectra of deBnMC-2** (Table 1, Method-2b), MC-2, and BnMC-2. (b) The 1H NMR spectra of MC-2 (600 MHz, DMSO-d6), deBnMC-2** (300 MHz, DMSO-d6), BnMC-2 (600 MHz, CDCl3). S-labeled squares indicate residual solvents peaks. The peak of the residual aromatic groups is shown by the dashed-line circle.

Figure 8.
The ATR-IR spectra of deBnMC-3 (Method 2c, Table 1) and deBnMC-3* (Na/NH3, Table 1, Method-3). Spectra of MC-3 and BnMC-3 are shown for comparison. The small deviation of the peak shape of deBnMC-3* (Na/NH3) in the C-H region at 2921 cm–1 might be due to impurity.

Figure 9.
A cutout of the LC-MS spectra (negative ion mode) of (a) deBnMC-3 (Method-2c, Table 1) and (b) deBnMC-3* (Na/NH3, Method-3, Table 1), after deuteromethylation, partial hydrolysis, and labeling with m-ABA. For details refer to the Materials and Methods Section 2.7.
Figure 9.
A cutout of the LC-MS spectra (negative ion mode) of (a) deBnMC-3 (Method-2c, Table 1) and (b) deBnMC-3* (Na/NH3, Method-3, Table 1), after deuteromethylation, partial hydrolysis, and labeling with m-ABA. For details refer to the Materials and Methods Section 2.7.

Figure 10.
Methyl substitution patterns of deBnMC-3 (Method-2c, Table 1), deBnMC-3* (Na/NH3, Method-3, Table 1), and MC-3 (for comparison), evaluated based on the monomer analysis of alditol acetates by GLC-FID. For details refer to the Materials and Methods Section 2.6.1.
Figure 10.
Methyl substitution patterns of deBnMC-3 (Method-2c, Table 1), deBnMC-3* (Na/NH3, Method-3, Table 1), and MC-3 (for comparison), evaluated based on the monomer analysis of alditol acetates by GLC-FID. For details refer to the Materials and Methods Section 2.6.1.


Table 1.
Debenzylation Methods, reaction conditions and additives. Products’ names are shown in bold and the stars are part of the products’ names, such as deBnMC-3*.
Table 1.
Debenzylation Methods, reaction conditions and additives. Products’ names are shown in bold and the stars are part of the products’ names, such as deBnMC-3*.

| Method | Additives and Reaction Conditions | Comments | |
|---|---|---|---|
| Method 1 Without dialysis before alkaline treatment |
 |
| |
| Method 2 With dialysis before alkaline treatment | a |
|
|
| b |
 2,6-di-tert-butylpyridine (DTBP) |
| |
| c |
|
| |
| Method 3 | Na/liquid NH3 − 78 °C, 3 h |
| |
Products’ names are shown in bold and the stars are part of the products’ names, such as deBnMC-3*.
Publisher’s Note: MDPI stays neutral with regard to jurisdictional claims in published maps and institutional affiliations. |
© 2022 by the authors. Licensee MDPI, Basel, Switzerland. This article is an open access article distributed under the terms and conditions of the Creative Commons Attribution (CC BY) license (https://creativecommons.org/licenses/by/4.0/).
Share and Cite
MDPI and ACS Style
Hashemi, P.; Wenderoth, S.; Koschella, A.; Heinze, T.; Mischnick, P. Debenzylation of Benzyl-Protected Methylcellulose. Polysaccharides 2022, 3, 458-479. https://0-doi-org.brum.beds.ac.uk/10.3390/polysaccharides3030028
AMA Style
Hashemi P, Wenderoth S, Koschella A, Heinze T, Mischnick P. Debenzylation of Benzyl-Protected Methylcellulose. Polysaccharides. 2022; 3(3):458-479. https://0-doi-org.brum.beds.ac.uk/10.3390/polysaccharides3030028
Chicago/Turabian StyleHashemi, Payam, Saskia Wenderoth, Andreas Koschella, Thomas Heinze, and Petra Mischnick. 2022. "Debenzylation of Benzyl-Protected Methylcellulose" Polysaccharides 3, no. 3: 458-479. https://0-doi-org.brum.beds.ac.uk/10.3390/polysaccharides3030028