Article

Detection of Sub-Aroma Threshold Concentrations of Wine Methoxypyrazines by Multidimensional GCMS

1
Department of Wine, Food, & Molecular Biosciences, Lincoln University, Lincoln 7647, New Zealand
2
Department of Soil and Physical Sciences, Lincoln University, Lincoln 7647, New Zealand
3
Department of Viticulture and Oenology, Nelson Marlborough Institute of Technology, Blenheim 7201, New Zealand
*
Authors to whom correspondence should be addressed.
Current Affiliation: Chemistry Department, Colorado State University—Pueblo, Pueblo, CO 81001, USA.
Submission received: 9 November 2020 / Revised: 24 November 2020 / Accepted: 2 December 2020 / Published: 2 January 2021

Abstract

:
Complex matrices, such as wine, provide a challenge in the quantification of compounds. There exists a high likelihood of co-elution in these matrices, thereby artificially increasing the observed concentration. This can often lead to confusing data where compounds are above aroma detection thresholds, but are not detected by olfactory analysis. Additionally, the lack of sensitivity in assays can lead to the non-detection of sub-aroma threshold concentrations and contrasting data when olfactory analysis detects these aromas. To eliminate these pitfalls and gain a better understanding of the role that methoxypyrazines impart green character to wine, a quantitative method using headspace solid-phase microextraction coupled to heart-cutting multidimensional gas chromatography mass spectrometry was developed. The method can quantitate the three common methoxypyrazines found in wine at the picogram per liter level while resolving co-eluting compounds. The proposed method was validated using model wine and wine solutions and was ultimately used for the comparative analysis of white, rosé, and red wines.

Graphical Abstract

1. Introduction

Methoxypyrazines (MPs) are naturally occurring aromatic compounds found in many plants and several insects. MPs have low odor thresholds, 2–16 ng/L in wine, and therefore can be viewed as undesirable when present in high concentration. Trace amounts, because of the low perception threshold, can impart aromas of green, vegetal, herbaceous, and earthy to foods and beverages. 3-Isobutyl-2-methoxypyrazine (IBMP) is the most abundant of the three methoxypyrazines found in wine and imparts the aroma of green bell pepper. 3-Isopropyl-2-methoxypyrazine (IPMP) and 3-sec-butyl-2-methoxypyrazine (SBMP) is also found, but is rarely above the detection threshold in grape berry, however, it contributes to the overall aroma attributes [1]. While the concentration of methoxypyrazines found in wine is quite low, 5–30 ng/L (IBMP); <10 ng/L (IPMP); and <10 ng/L (SBMP), they are considerably higher in other foods: green capsicum, 50,000 ng/L (IBMP); beetroot, 5600 ng/L (SBMP); and green peas, 3500 ng/L (IPMP) [2]. The methoxypyrazine quantities found in wine are quite low when at their highest, but impart their distinctive aromas. These trace quantities cause difficulties in analysis when in complex matrices. There is a chance of co-elution and an inability to detect from decreased sensitivity resulting from nearby compounds in larger quantities, for example in wines with higher alcohol content the range is from 100 to 500 mg/L [3].
Complex matrices create additional difficulties in the analysis of volatile compounds with multiple physicochemical factors influencing their release from the matrix and effectiveness of sampling [4]. As such, multiple methods of extraction have been employed over the years. Many of these systems involve the use of organic solvents that not only increase costs, but also impact the environment. Solid-phase microextraction (SPME) is able to eliminate the use of solvents by sampling in either the headspace or direct-immersion mode. SPME requires minimal sampling and the fiber coating can be selected to adsorb compound classes of interest [5]. In the case of the volatile MPs, headspace-SPME (HS-SPME) is ideal for being able to effectively sample and to utilize as a first level of MPs isolation from the other aromatics present [6].
Peak capacity and sensitivity issues hinder one-dimensional analysis [7]. To overcome these issues multidimensional gas chromatography (MDGC) was employed, in which it is commonplace for chromatographic separation to occur on two columns, with differing stationary phases, in tandem utilizing a single GC system [8]. Technological advances have led to greater sensitivity in the detectors, MS/MS for example, and separation capacity, GC × GC using cryotraps and heart-cutting. These technologies have improved the resolution and detection abilities, however compounds remain in complex matrices where detection remains difficult. Additionally, some of the modern technologies are not practical due to complexity of the system or analysis of the resulting data [9]. Ultimately, to determine trace quantities of compounds effective molecular separation is required and for the application to be practical the methodology must be simple.
The complexity of wine and juice combined with the low abundance of MPs and other analytes creates the ideal situation to utilize multidimensional techniques. As such, a need always exists to further develop and refine methods to enhance sensitivity, identification, and ease of analysis [9]. To effectively analyze these compounds in wine this research focused on developing a simple, sensitive method for MPs. To achieve this goal a heart-cut MDGC-MS system was utilized. The advantages afforded by this system combined with optimization of critical steps allows for easy detection of MPs in the fraction of a ng/L concentration in wines. The method was then employed in the analysis of MPs in three wine styles: white, Rosé, and red. The proposed method and MPs presence in wine samples are presented.

2. Materials and Methods

2.1. Reagents and Standards

Absolute ethanol [HPLC Grade (ACS ISO UV-VIS)] was purchased from Scharlau (Bio- Strategy, Auckland, New Zealand), sodium hydroxide and sodium chloride, AR grade, from Ajax FineChem (Thermo-Fisher Scientific, Auckland, New Zealand) and L-(+) tartaric acid, 99.5%, and alkane standard solution C8–C20 from Sigma-Aldrich (Merck, Macquarie Park, Australia). Deionized water was obtained each day from a Suez Select Neptune Lab Pure Water Deionization Unit (Total Lab Systems, Auckland, New Zealand).
Methoxypyrazine standards 2-Isobutyl-3-methoxypyrazine (IBMP, 99%), 2-Isopropyl-3-methoxypyrazine (IPMP, 97%), and 2-sec-Butyl-3-methoxypyrazine (SBMP, 99%) were purchased from Sigma-Aldrich (St. Louis, MO, USA). Deuterated 2-Isopropyl-3-methoxy-d3-pyrazine (d3-IPMP) was purchased from CDN Isotopes (Hornsby, Australia). Deuterated 2-Isobutyl-3-methoxy-d3-pyrazine (d3-IBMP) was made in-house at Lincoln University, New Zealand [10].
Standards of each MP were individually made up in 100% ethanol, diluted to secondary standards in 10% ethanol in deionized water, and then combined into a composite mix also made up in 10% ethanol. Deuterated analogues making up the internal standard composite were made using the same process as the standards. The composite mixes were aliquoted into 4 mL glass vials and stored at −20 °C.
Working standards were prepared each day from the composite mix in 5 g/L tartaric acid buffer in 14% ethanol at pH 3.5. Serial dilutions (in the tartaric acid buffer) were performed to produce six standards in duplicate for calibration curve generation. In 20 mL amber solid-phase micro-extraction (SPME) vials (Supelco, Merck, Macquarie Park, Australia) each standard dilution was added to 4.85 mL of chilled deionized water in SPME vials, followed by 150 µL of the deuterated internal standard composite, 1 mL of 4 M sodium hydroxide and 4.5 g of sodium chloride. Vials were sealed with a magnetic cap utilizing a PTFE/Silicon gas tight seal (MicroAnalytix, Auckland, New Zealand).
Model wine consisted of 5.0 g/L tartaric acid in 14% ethanol in water with pH adjusted to 3.5. Wines were made using standardized wine making protocols from the varieties Sauvignon blanc, Merlot (Rosé), and Pinot noir.

2.2. Sample Preparation

Wine samples were stored frozen at −20 °C in sealed 15 mL glass vials prior to analysis. Upon thawing, 3 mL of wine was added to 4.85 mL of chilled deionized water in a 20 mL amber SPME vial, followed by 150 µL of internal standard composite. To this 1 mL of 4 M sodium hydroxide and 4.5 g of sodium chloride were added prior to being sealed with a magnetic screw cap (PTFLE/Silicon septa). The total liquid volume in the vial was 9 mL that equated to a 3-fold dilution of the wine samples. Samples were analyzed using the method specified in Section 2.4.

2.3. Method Optimization

2.3.1. SPME Extraction
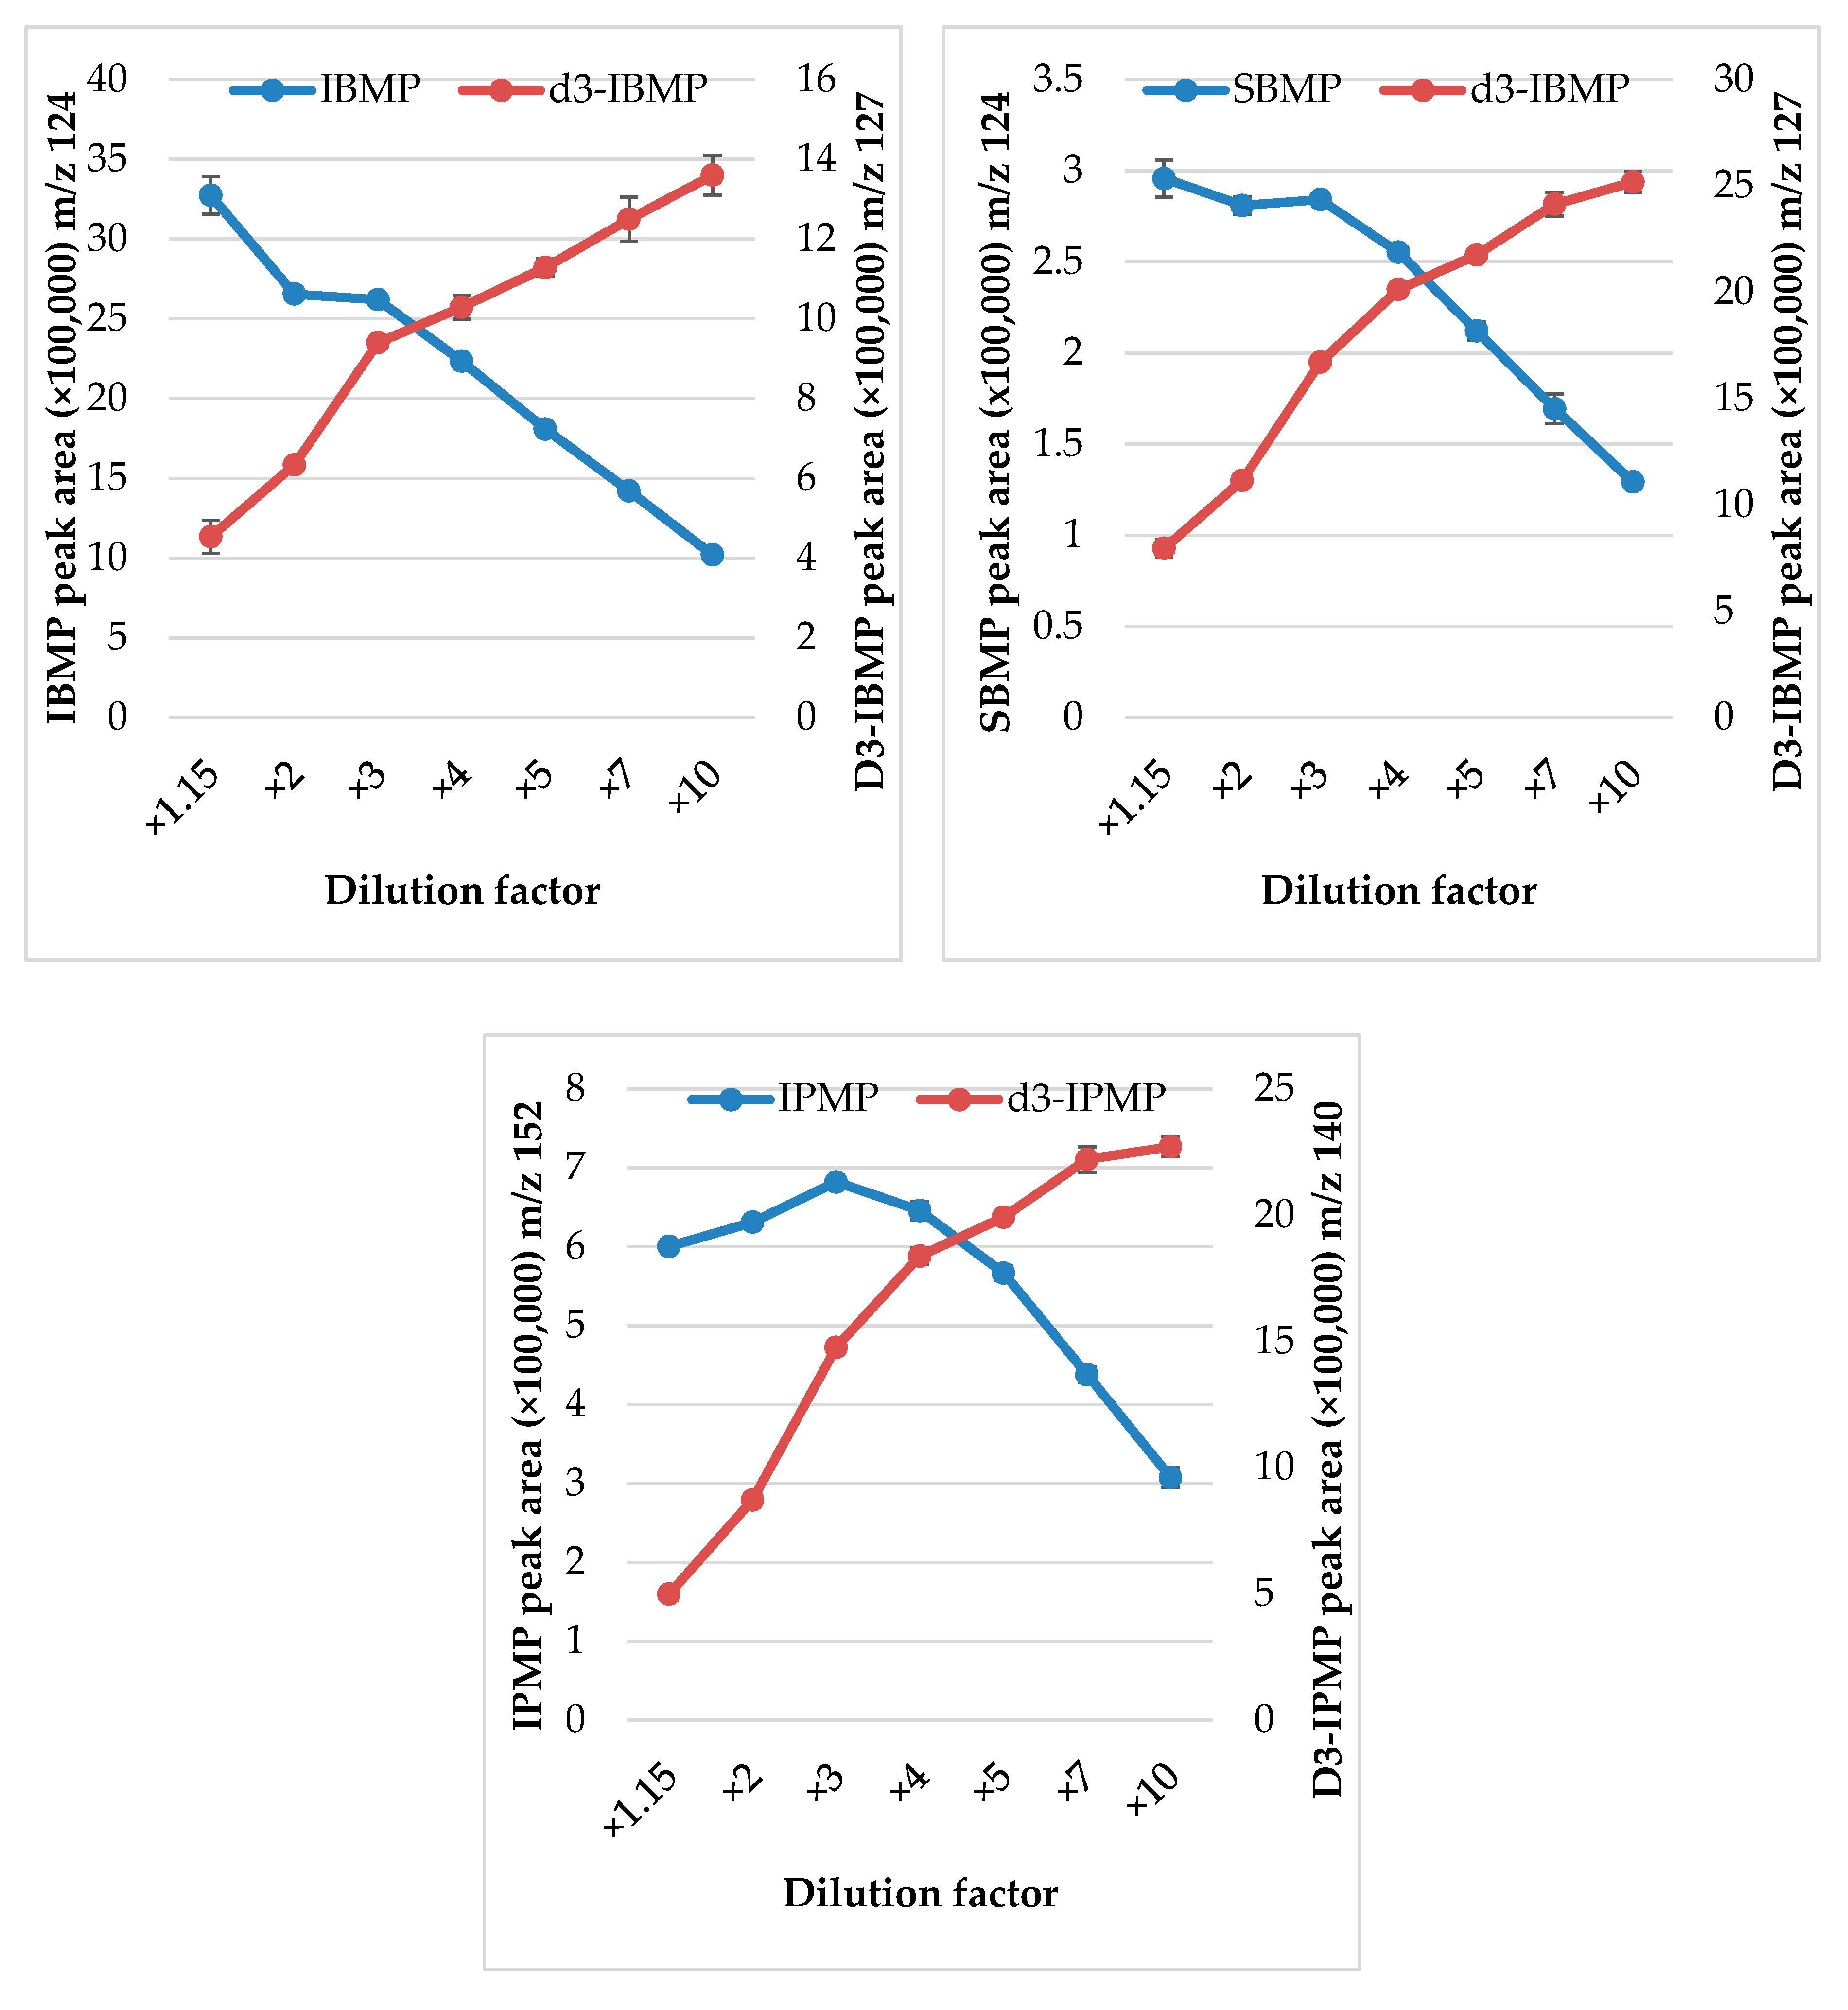
Hartmann et al. [8] optimized extraction for HS-SPME in alcoholic mixtures for temperature, time and solution pH. The use of the 2 cm DVB/CAR/PDMS Stableflex SPME fiber (Supelco, Merck, Macquarie Park, Australia) used in this study was a departure from the one used in Parr et al. [10]. This change in fiber was to increase adsorption capacity over the 1 cm fiber that was used by the authors in Parr et al. [10].

2.3.2. Dilution

Hartmann et al. [11] reported that there was a significant negative effect on the extraction sensitivity with the presence of increasing ethanol content (0–20%). To determine the optimal sample dilution factor for the 2 cm DVB/CAR/PDMS SPME fiber used in the current study, a composite working standard was made in pH 3.5, 5 g/L tartaric acid buffer, 14% ethanol and serially diluted with deionized water. The seven dilution ratios (1.15, 2, 3, 4, 5, 7 and 10-fold) were prepared in triplicate as described in Section 2.1 for working standards; the internal standard amount (150 µL), 4 M sodium hydroxide (1 mL) and sodium chloride salt (4.5 g) were added to each vial to maintain a total solution volume of 9 mL. Solutions were analyzed using the method outlined in Section 2.4.

2.3.3. Single Dimension GC-FID (Flame Ionization Detector) Analysis

To optimize the first dimension and establish the heart-cutting regions a SH-Rtx-wax (polyethylene glycol) 60 m × 0.25 mm ID × 0.25µm film thickness (Shimadzu NZ Ltd., Auckland, New Zealand) installed in a Shimadzu 2010 GC-FID (Shimadzu NZ, Ltd. Auckland, New Zealand) was used to separate the MPs: IPMP, SBMP and IBMP. Sample vials were stirred and incubated at 50 °C for 10 min prior to static sampling with the SPME fiber at the same temperature for 40 min. The SPME fiber was desorbed in the GC injection port fitted with a 0.75 mm I.D. SPME liner (SGE Analytical Science Pty. Ltd., Ringwood, Vic, Australia) set to a temperature of 270 °C for 5 min in splitless mode at an initial flow rate (helium carrier gas, BOC Gas, Christchurch, New Zealand) of 1.46 mL/min, and a linear velocity of 19.9 cm/s. The column oven was initially held at 35 °C for 3 min and then ramped up to 101 °C at 7.33 °C/min, gradually increased to 148 °C at 1.50 °C/min before increasing to 250 °C at 40 °C/min and held for 16.11 min for a total runtime of 62 min. During the oven ramp the column flow rate was controlled using a pressure program where the pressure was increased from an initial pressure of 218.7 kPa to a final pressure of 328.1 kPa. This pressure program was the total pressure of the system and controlled not only the column flow in the first dimension column, but the resulting column flow in the second dimension column (GCMS) and the switching valve pressure whose optimization was needed to ensure 100% of the first dimension column outflow could be heart-cut onto the second dimension column. The end of the first dimension GC column was connected to a Dean’s style switch (Shimadzu NZ, Ltd. Auckland, New Zealand) in the GC oven and, when closed, was connected to the FID detector held at a constant temperature of 250 °C. The three MPs eluted at 31.14 min (IPMP), 35.66 min (SBMP) and 37.20 min (IBMP), respectively. The two deuterated internal standards eluted at 31.08 min (d3-IPMP) and 37.14 min (d3-IBMP).

2.3.4. Second Dimension Heart-Cutting MDGC-MS

The second dimension separation utilized the work of Parr et al. [10] for the target flow rates and column selection. An Rtx-5 ms (5% diphenyl 95% dimethyl polysiloxane) 30 m × 0.25 mm ID × 0.25 µm film thickness (Restek, Bellefonte, PA, USA) was connected to the outflow of the Dean’s style switch in the first dimension GC oven via a short transfer line held at 62 °C extending into the oven of a Shimadzu QP2010 Ultra GCMS (Shimadzu NZ, Ltd. Auckland, New Zealand), where it was connected to the mass spectrometer detector. The ion source and transfer line in the mass spectrometer were held at 200 °C and 250 °C, respectively. The column oven was programmed to increase the initial temperature of 35 °C (30 min hold) to 90 °C at 3 °C/min and hold for 4.67 min before a final increase to 250 °C at 50 °C/min with a final hold time of 5.8 min for a total run time of 62 min. The column flow rate in the second dimension was initially 1.69 mL/min, however as the pressure increased this slowed to a rate of 1.3 mL/min at 25 min and was maintained at this flow rate throughout the remaining run time. The pressure applied to the Dean’s style switch was also programmed to ensure 100% of the column outflow could be cut to the second dimension at any time. This was therefore increased from an initial pressure of 92 kPa to a final pressure of 163 kPa. There were two heart-cuts made for the three MPs, the first occurred at 30.50–32.00 min and the second at 35.25–38.40 min. The MS was operated in SCAN mode to elucidate the retention times of the desired compounds and to ensure that no interfering peaks were present, prior to switching to selective ion monitoring (SIM) mode for the final proposed methodology (Table 1). The second dimension elution times for the three MPs were 43.78 min (IPMP), 47.74 min (SBMP) and 48.38 min (IBMP), respectively. The two deuterated internal standards eluted at 43.69 min (d3-IPMP) and 48.29 min (d3 IBMP).

2.4. Proposed Method

Capped sample vials containing standards or samples were placed in a chilled auto-sampler tray set to 8 °C prior to sampling by a PAL LHX-xt robotic auto-sampler (CTC Analytics AG, Zwingen, Switzerland). The 2 cm DVB/CAR/PDMS Stableflex SPME fiber was conditioned at 270 °C for 10 min prior to each sample vial incubation. Sample vials were stirred and incubated at 50 °C for 10 min prior to static sampling with the SPME fiber at the same temperature for 40 min. The SPME fiber was desorbed in the GC injection port fitted with a 0.75 mm I.D. SPME liner at a temperature of 270 °C for 5 min in splitless mode with an initial flow rate of 1.46 mL/min, and a linear velocity of 19.9 cm/s. Outflow was to a SH-Rtx-wax column, 60 m × 0.25 mm ID × 0.25 µm film thickness, installed in a Shimadzu 2010 GC-FID. The column oven was initially held at 35 °C for 3 min and then increased to 101 °C at a rate of 7.33 °C/min followed by an increase to 148 °C at 1.50 °C/min before rising to 250 °C at 40 °C/min and held for 16.11 min for a total runtime of 62 min. During the oven ramp the column flow rate was controlled using a pressure program where the pressure was increased from an initial pressure of 218.7 kPa to a final pressure of 328.1 kPa. Two heart-cuts were made to transfer the three MPs to the second dimension, the first occurred at 30.50–32.00 min and the second at 35.25–38.40 min.
The heart-cut flowed onto a Rtx-5 ms (5% diphenyl 95% dimethyl polysiloxane), 30 m × 0.25 mm ID × 0.25 µm film thickness, column connected to the outflow of the Dean’s style switch in the first dimension GC oven via a short transfer line held at 62 °C, which extended into the oven of a Shimadzu QP2010 Ultra GCMS where it was connected to the mass spectrometer detector. The ion source and transfer line in the mass spectrometer were held at 200 and 250 °C, respectively. The column oven was programmed to increase the initial temperature of 35 °C (30 min hold) to 90 °C at 3 °C/min and held for 4.67 min before a final increase to 250 °C at 50 °C/min with a final hold time of 5.8 min for a total run time of 62 min. The column flow rate in the second dimension was initially 1.69 mL/min, however as the pressure increased this slowed to a rate of 1.3 mL/min at 25 min and was maintained at this flow rate throughout the remaining run time. The mass spectrometer was operated in selective ion monitoring (SIM) mode and monitored two selected ions for each MP standard (Table 1). The ratio of the quantifying ions of each MP to their respective deuterated internal standard ion was used to determine the IPMP, SBMP and IBMP wine concentrations.

2.5. Method Validation

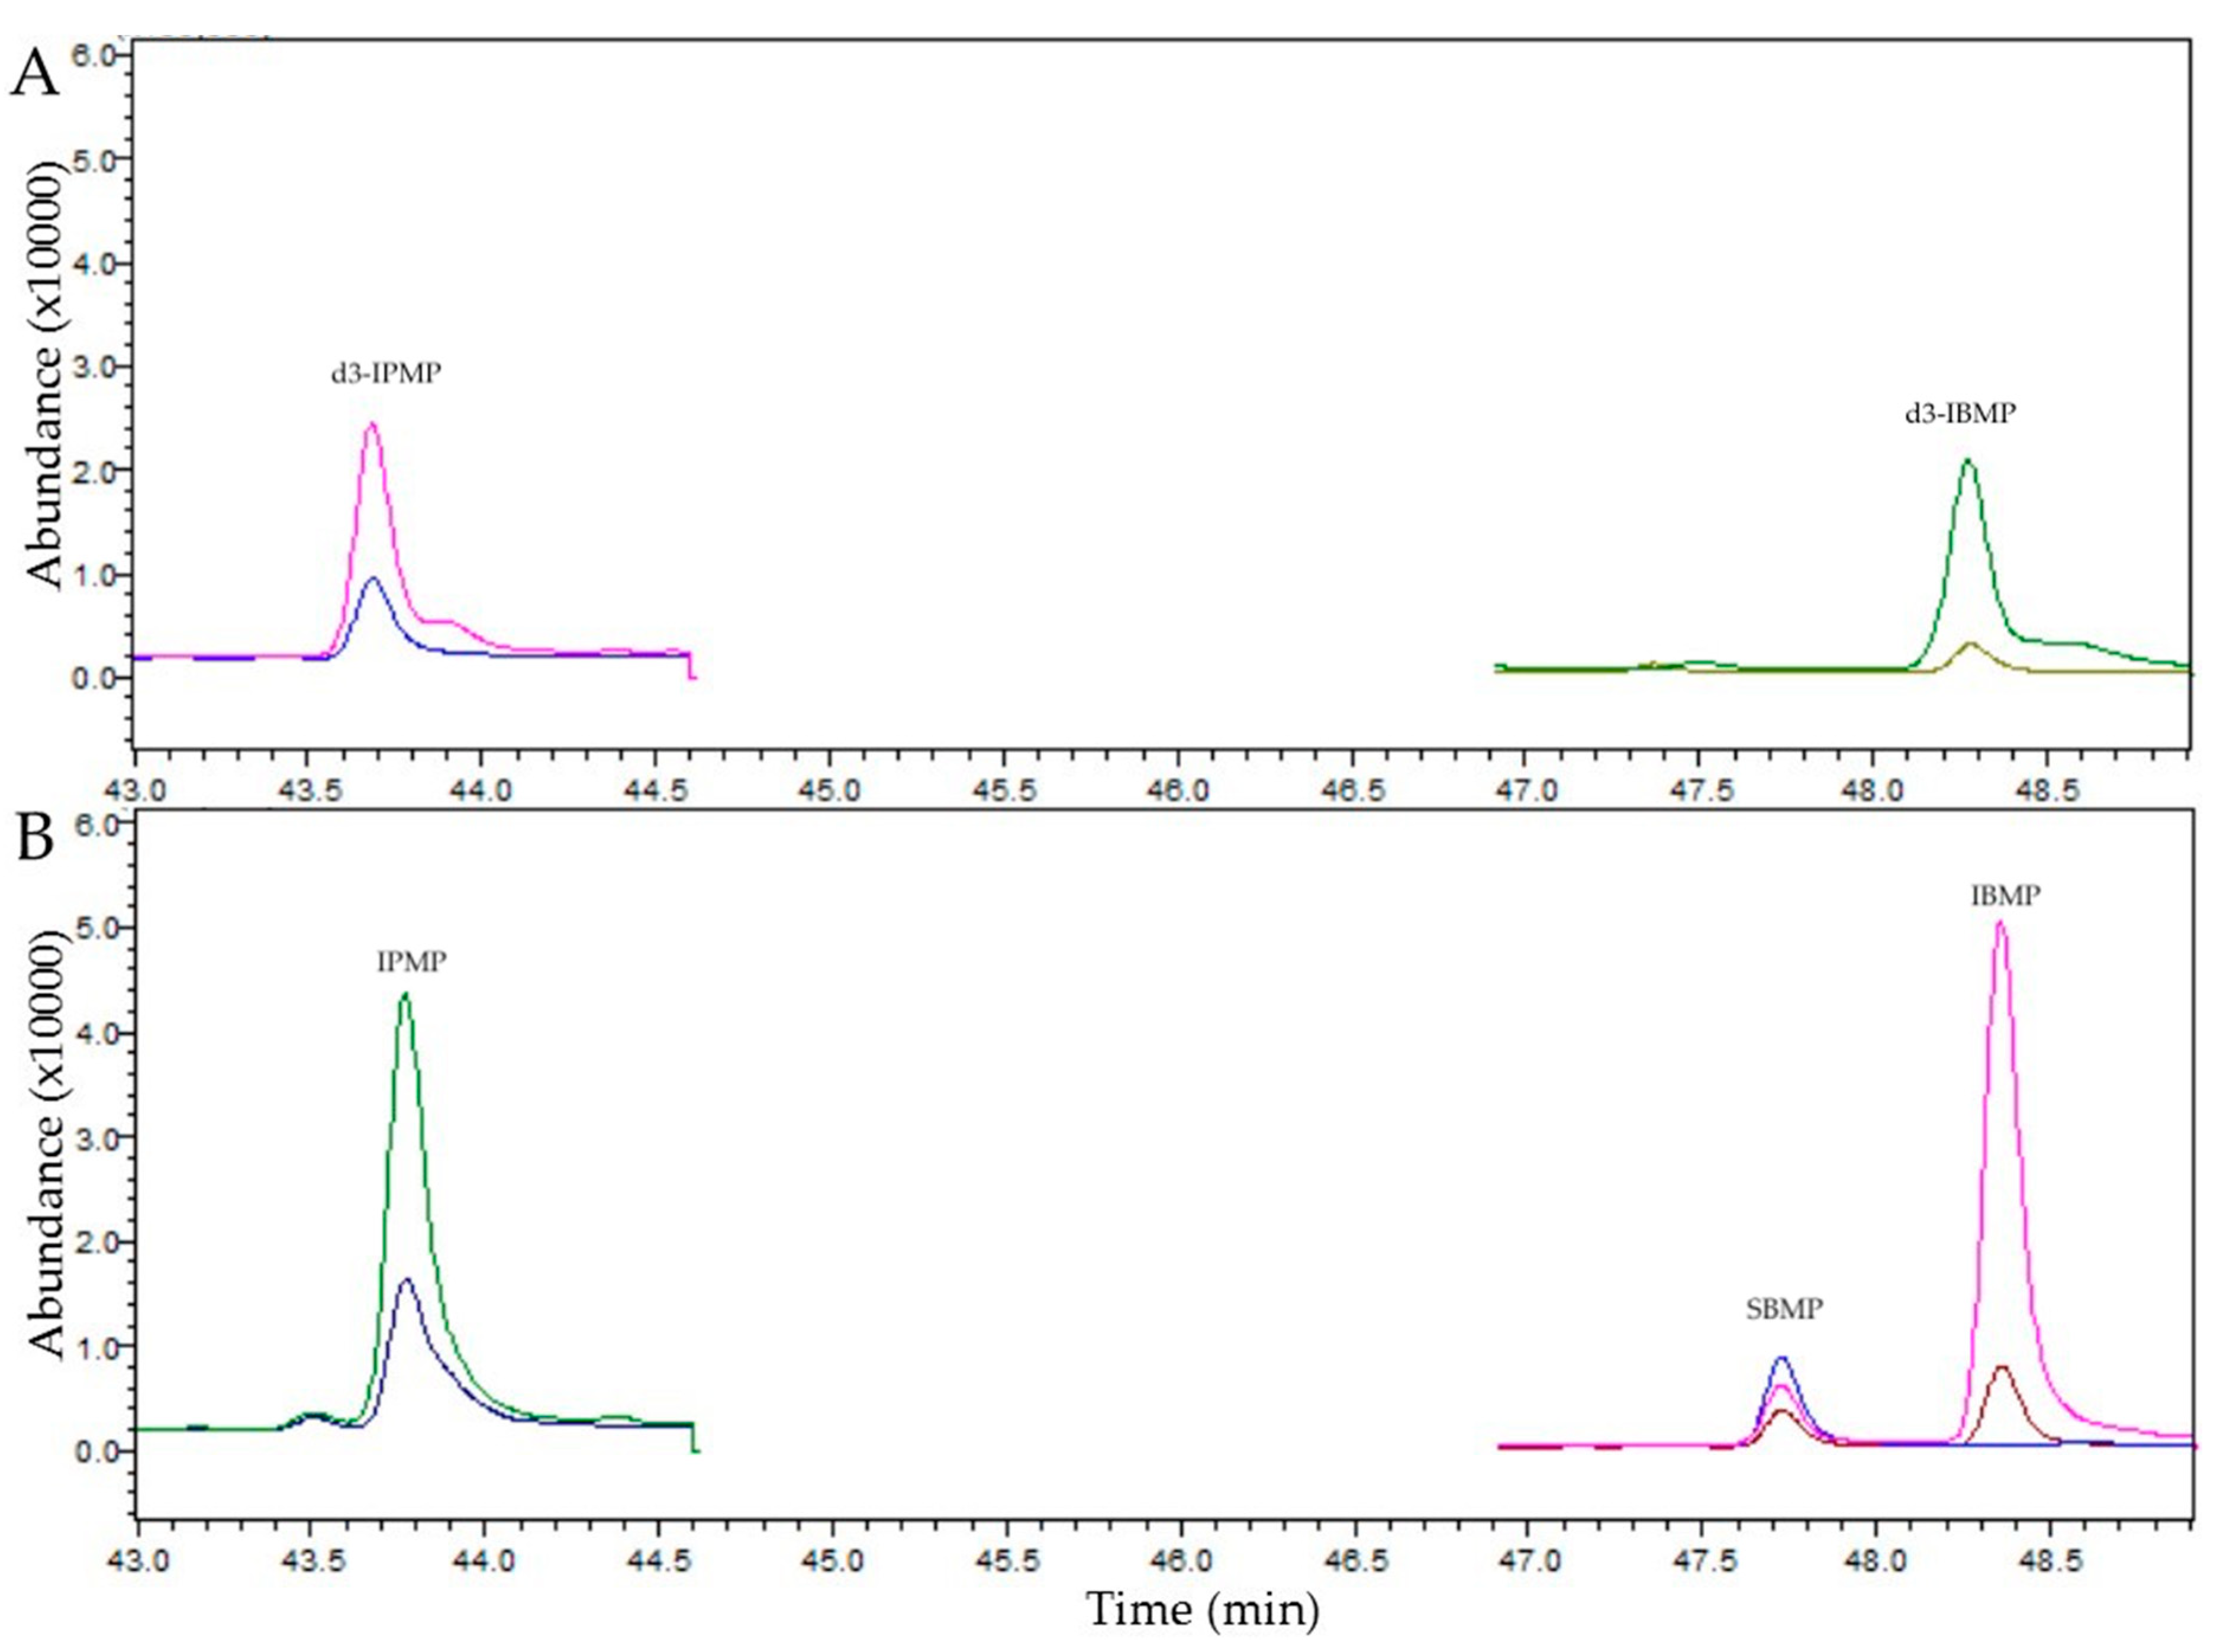
2.5.1. Peak Identification

The identification of IPMP, SBMP and IBMP at the previously mentioned retention times was confirmed by running each MP standard individually at a concentration of 0.1 mg/L. Additionally, an alkane standard solution (C8–C20) was run to establish retention index (RI) values for each MP on the first dimension Rtx-wax column (Table 1). The retention index values were comparable to those found in the literature, namely IPMP [12], SBMP [13] and IBMP [14]. Retention index values were also determined for the two deuterated internal standards. Furthermore, each MP was heart-cut using the 0.1 mg/L concentration to enact identification in the second dimension. The heart-cut standards were confirmed using scan mode and a similarity search of mass spectral libraries NIST/EPA/NIH Mass Spectral Library, NIST 11 (National Institute of Standards and Technology, Gaithersburg, MD, USA, Shimadzu release 1.00) and the Wiley Registry 10th edition (John Wiley and Sons, Inc., Hoboken, NJ, USA, edition 10). Similarity search values for IPMP, SBMP, and IBMP were 97, 97, and 98%, respectively.

2.5.2. Linearity

Three calibration curves containing six levels were run in duplicate on different days. A master calibration curve containing six data points at each level was constructed for each MP. The peak area ratios of the quantifying ions with their respective internal standard ions were plotted against the concentration of the working standards at each level.

2.5.3. Recovery

Spike recovery tests were undertaken to determine the validity of the proposed method for wine analysis of MPs to test both for the linearity of the method and its applicability to different wine varieties. Three wine varieties (Pinot noir, Rosé and Sauvignon blanc) and nine different wine samples were spiked at three concentrations on the calibration curve. The spikes were performed the same as per the working standards where a small aliquot of the composite working standard was added to the wine samples, these were then vortexed and diluted with deionized water in 20 mL amber vials as detailed in the sample preparation above. Spiked samples results were compared to unspiked measurements of the same wines to determine a difference in concentration that was then compared to what had been added to give a percentage recovery.

2.5.4. Limit of Blank, Limit of Detection, Limit of Quantitation, Accuracy, and Precision

The limit of blank (LOB), limit of detection (LOD) and the limit of quantitation (LOQ) were determined using two techniques. A total of 19 blank samples were analyzed alongside three standard curves on three different days with the LOB, LOD and LOQ determined using Formulas (1), (2), and (3), respectively.
LOB   =   ( blank   mean )   + 1.645   ×   ( blank   standard   deviation )
LOD   =   LOB   + 1.645   ×   ( low   concentration   sample   standard   deviation )
LOQ   = 10   × ( blank   standard   deviation )
The LOQ was also determined by serially diluting a working standard (level 3) in triplicate to find the point at which the standard error of the replicates (precision) exceeded 5% and the quantitative value determined (accuracy) also exceeded 5%. A total of six dilution steps were employed with the lowest concentration step set at 0.022 ng/L for IPMP and SBMP and with 0.089 ng/L for IBMP. Once the lowest point was found it was multiplied by a factor of three, the equivalent of an undiluted wine sample, and reported as the LOQ.

2.6. Data Analysis

Chromatograms were acquired and analyzed using MDGC solution version 1.02, GCsolution version 2.44 and GCMSsolution version 4.45 (Shimadzu, NZ Ltd.,Auckland, NZ). Data was processed using Excel, Microsoft Office Profession Plus 2013 (Microsoft, Redmond, WA, USA).

3. Results and Discussion

3.1. Extraction Optimization

The goal of the method development was to determine the concentration of MPs in wines below the ng/L level and thus some parameters needed further optimization for the heart-cut multidimensional GC-MS method. Much research already exists for the selection of SPME fibers and pH of the samples, therefore these parameters were considered fixed for this study as they have been established in this laboratory and others [10,11,15]. Consequently, a DVB-CAR-PDMS fiber was selected due to its ability to absorb a wide range of volatile organic compounds, rapid equilibrium, and reproducibility of injection [16]. Likewise, Hartmann, et al. [11] established that the optimum pH for the volatilization of MPs is greater than pH 12, which also suppressed the volatile acids.
While dilutions have been examined in the past, it was reevaluated due to the low analytical concentrations sought. The analytes were diluted for a factor of: 1.15, 2, 3, 4, 5, 7, and 10. Results for each MP are displayed in Figure 1. While the IBMP and SMBP had an initial drop and then plateaued for dilution factors 2 and 3 in the response, the IPMP increased over the same range before all three declined. The corresponding deuterated internal standards increased in response across all dilutions. Consequently, a dilution factor of three was chosen since the analytes were at the upper range of their linear response and the internal standards were within the mid-range of their response.
At the SPME fiber compounds compete for the adsorption sites, therefore it is vital to increase the amount of the target analytes in the headspace. The pH adjustment provided optimum conditions for the MPs to be volatilized; however it was expected that high concentration compounds, such as ethanol, could still volatilize in sufficient concentration to out compete the target molecules. Dilution of these compounds would allow for decreased competition and increased adsorption of the target molecules given that the samples were optimized for MPs volatilization. Kalua and Boss [17] investigated the partition coefficients of volatile compounds in wines and grapes. In their study they were able to identify compounds that were more easily detected in wines upon dilution. The study demonstrates the complex nature of the sample-headspace-fiber equilibrium. Kalua and Boss [17] demonstrated the importance of the equilibrium between the three phases and how it impacts compound detection. Onuki et al. [18] further demonstrated this principle of dilution increasing the adsorption onto SPME fibers in their study of volatile by-products in industrial ethanol. Their study showed that ethanol concentrations between 10 and 40% showed increases in the other volatile compounds, low molecular weight, and that higher molecular weight compounds were not detected at concentrations above 20% ethanol. The importance of understanding the volatile equilibrium in HS-SPME for the target analytes is demonstrated in these two studies and they further highlight the limitations associated with dilution to maximize response. In the current study, focusing on three similar compounds, there was minimal impact, as any reduction in other compounds was not examined in the assay; in this way we achieved obtaining a true representation of the MPs present in wine.
Heart-cuts were established to optimize the number of peaks being sent to the second dimension (Figure 2). Two heart-cut regions were established. The analyte standards and internal standards were run in the first dimension using an FID and compared to the literature for retention indices (RIs) (Table 1). The RI values accurately matched the literature, instilling confidence that the peaks were the desired analytes. While retention time and RIs were used to define the heart-cut and establish the presence of the desired analytes, further separation on the second dimension and the overall mass spectral fragmentation pattern matches using the mass spectrophotometer detector confirmed the separation and identification of the analytes (Figure 3). These methods of identification ensured that the chromatography was isolating the desired peaks for quantification.
The addition of heart-cutting for analytical analysis has provided multiple opportunities to further elucidate peaks in complex mixtures such as wine. The ability to send a portion of the sample to a second phase for further separation has allowed for the identification and quantitation of analytes that were previously confounded by co-eluting peaks [19]. Schmarr, Slabizki, and Legrum [20] demonstrated the ability of multidimensional analysis in the analysis of galbanum oil. Their study demonstrated the ability to achieve separation of co-eluting compounds by heart-cutting the first phase. Their study further demonstrated the power of this technique by evaluating the time of the heart-cut in order to achieve separation on the second phase. Similarly, the current study used the retention time to establish the appropriate heart-cut regions thereby minimizing the chances of co-eluting peaks on the second phase. Table 2 exhibits the similar and identical retention indices of compounds commonly found in wine that are present in the first dimension heart-cut windows and highlights the potential for co-elution when using a single dimension. The retention times of these compounds in the second dimension show the separation achievable and the isolation of the MPs.

3.2. Method Validation

Following optimization a validation procedure occurred taking into account: linearity, repeatability, detection and quantitation limits in model wine solutions, while recoveries were performed in spiked model wines and wine.
The analytes were analyzed over the range of 0.260—9.96 ng/L (IPMP), 0.130—9.99 ng/L (SBMP), and 0.267—41.16 ng/L (IBMP). Each was found to be linear (R2 > 0.99), however a quadratic fit the datapoints, providing better accuracy over the examined range without requiring multiple analyses (Table 3). The quadratic regression coefficients for each analyte were greater than 0.999. Additionally, the residuals for the lower concentrations were smaller for the quadratic regression, thereby validating its use [21].
The limits of blank, detection, and quantitation were established over multiple injections with the findings reported in Table 3. The LOQ is reported as the low concentration in the concentration range, 0.260 (IPMP), 0.130 (SBMP), and 0.267 ng/L (IBMP). The upper end of the concentration was established as the highest concentration run in the standard curve, as to not over saturate the mass spectral detector. Higher concentrations could be obtained, but this would need to be verified by running the appropriate standards. In this study it was also unnecessary to examine a concentration maximum given the low levels commonly found in wines and the pursuit of a low detection limit to determine concentrations that have the potential to contribute to the aromatic profile of a wine. The coefficient of variation was established for each analyte at a concentration of 0.66 (IPMP), 0.66 (SBMP), and 2.73 ng/L (IBMP), and found to be extremely low: 1.4, 2.8, and 3.5%, respectively. These values are well below the accepted “functional sensitivity” level and demonstrate the precision of sample analysis at the low concentrations that were obtained [22].
Recovery was performed in multiple solutions (Sauvignon blanc, Rosé, Pinot noir, and Model wine) with Sauvignon blanc and Model wine being spiked at two concentrations (Table 4). Recoveries ranged from 95 to 102% (IPMP), 94.3 to 101.3% (SBMP), and 95.7 to 106.3% (IBMP). Additionally, these spikes were evaluated over three weeks to establish the method reproducibility. The samples had a %CV of 0.30 to 5.47% (IPMP), 1.15 to 5.21% (SBMP) and 0.57 to 6.57% (IBMP), which can be considered satisfactory for the low concentrations examined in this study.

3.3. Wine Analysis

The method was applied to three research wines: Sauvignon blanc, Rosé, and Pinot noir. Each wine was analyzed for its concentrations of MPs (Table 5). Each wine was a control experimental wine, therefore each wine varietal result is the average of three individual ferments. While the Sauvignon blanc and Pinot noir were harvested immediately prior to commercial harvest the Rosé was harvested at a controlled soluble solids of 18 °Brix. The IPMP was detected in all wines, except Pinot noir, but only quantifiable in the Sauvignon blanc at 0.259 ± 0.031 ng/L. However, the Rosé when calculated had a mean value just below the LOQ of 0.248 ± 0.026 ng/L with several of the analyses being in the quantifiable range. The SMBP and IBMP were quantified in all three wines.
The detected levels of the individual MPs were below the accepted values for aroma thresholds except for IBMP in the Rosé wine. The observed value was greater than the 1 ng/L perception threshold typically associated with a white wine, but lower than the 10 ng/L values associated with a red wine [23,24]. The increased value is most likely associated with the early harvest of this grape for involvement in the trial. There are several factors that can alter the MPs concentration in wine. Conditions that promote a decrease in the MPs concentration are: grape ripeness, ripening temperature, bunch exposure, and viticultural practices, to name just a few [24,25,26].
The obtained values of IPMP and IBMP were within the ranges observed by Wen et al. [6] using a stir bar sorptive extraction in white, Rosé, and red wines. Interestingly, while the method employed by Wen was able to detect the compounds in pg/L levels, no SBMP was detected in the wines in their study. While other studies have examined MPs in wine, there are few studies that have been performed at these low concentrations [27,28]. Therefore, when comparing to these studies the values obtained in the current study would fall below the previously reported level of quantification.
Not all compounds contribute equally to the aroma profile of a wine. Some compounds directly impart definable aromas, as these compounds exceed the perception threshold. The compounds this method is intended to study are those below the perception threshold. These compounds contribute to an aromatic group, in this instance green aromas, and can act additively, as enhancers, and/or as inhibitors [29]. Consequently, being able to detect compounds at trace levels has become necessary to begin to understand the interactions that aromatic compounds have with each other and how they correlate to sensory profiles, thereby being able to define key odorants [30].

4. Conclusions

The proposed method not only has the benefit of being able to resolve co-eluting peaks for a better quantification of MPs concentration in wine, but also has an LOQ below the ng/L level. The sensitivity and reproducibility of the method allows for the accurate determination of MPs content in complex matrices, such as wine. Being able to detect sub-nanogram quantities accurately will allow future studies to begin elucidating the contributed influence of sub-aroma threshold compounds on perceived aromas.

Author Contributions

J.B.: investigation, validation, writing (original draft methods, review and editing); S.K.F.: conceptualization, resources, wine preparation, writing (review and editing); P.M.W.: wine preparation, writing (review and editing); B.T.: writing (review and editing); K.J.O.: conceptualization, formal analysis, writing (original draft, review and editing), project coordination. All authors have read and agreed to the published version of the manuscript.

Funding

The authors would like to thank the Nelson Marlborough Institute of Technology and Lincoln University for contributing funding for this project.

Acknowledgments

The authors wish to thank Richard Hider for his technical support on this project.

Conflicts of Interest

The authors declare no conflict of interest.

References

  1. Lin, J.; Massonnet, M.; Cantu, D. The genetic basis of grape and wine aroma. Hortic. Res. 2019, 6, 81. [Google Scholar] [CrossRef] [Green Version]
  2. Lei, Y.; Xie, S.; Guan, X.; Song, C.; Zhang, Z.; Meng, J. Methoxypyrazines biosynthesis and metabolism in grape: A review. Food Chem. 2018, 245, 1141–1147. [Google Scholar] [CrossRef]
  3. Boulton, R.B.; Singleton, V.L.; Bisson, L.F.; Kunkee, R.E. Principle and Practices of Winemaking; Chapman & Hall: New York, NY, USA, 1996; pp. 150–166. [Google Scholar]
  4. Castro, R.; Natera, R.; Durán, E.; García-Barroso, C. Application of solid phase extraction techniques to analyse volatile compounds in wines and other enological products. Eur. Food Res. Technol. 2008, 228, 1–18. [Google Scholar] [CrossRef]
  5. Torrens, J.; Riu-Aumatell, M.; López-Tamames, E.; Buxaderas, S. Volatile compounds of red and white wines by headspace-solid-phase microextraction using different fibers. J. Chromatogr. Sci. 2004, 42, 310–316. [Google Scholar] [CrossRef] [Green Version]
  6. Hjelmeland, A.K.; Wylie, P.L.; Ebeler, S.E. A comparison of sorptive extraction techniques coupled to a new quantitative, sensitive, high throughput GC–MS/MS method for methoxypyrazine analysis in wine. Talanta 2016, 148, 336–345. [Google Scholar] [CrossRef]
  7. Blumberg, L.M.; Frank, D.; Klee, M.S.; Sandra, P. Comparison of one-dimensional and comprehensive two-dimensional separations by gas chromatography. J. Chromatogr. A 2008, 1188, 2–16. [Google Scholar] [CrossRef]
  8. Amaral, M.S.S.; Marriott, P.J. The blossoming of technology for the analysis of complex aroma bouquets—A review on flavour and odorant multidimensional and comprehensive gas chromatography applications. Molecules 2019, 24, 2080. [Google Scholar] [CrossRef] [Green Version]
  9. Wen, Y.; Ontañon, I.; Ferreira, V.; Lopez, R. Determination of ppq-levels of alkylmethoxypyrazines in wine by stirbar sorptive extraction combined with multidimensional gas chromatography-mass spectrometry. Food Chem. 2018, 255, 235–241. [Google Scholar] [CrossRef]
  10. Parr, W.V.; Green, J.A.; White, K.G.; Sherlock, R.R. The distinctive flavour of New Zealand Sauvignon blanc: Sensory characterisation by wine professionals. Food Qual. Prefer. 2007, 18, 849–861. [Google Scholar] [CrossRef]
  11. Hartmann, P.J.; McNair, H.M.; Zoecklein, B.W. Measurement of 3-alkyl-2-methoxypyrazine by headspace solid-phase microextraction in spiked model wines. Am. J. Enol. Vitic. 2002, 53, 285. [Google Scholar]
  12. Shimizu, Y.; Imayoshi, Y.; Kato, M.; Maeda, K.; Iwabuchi, H.; Shimomura, K. Volatiles from leaves of field-grown plants and shoot cultures of Gynura bicolor DC. Flavour Frag. J. 2009, 24, 251–258. [Google Scholar] [CrossRef]
  13. Jakobsen, H.B.; Hansen, M.; Christensen, M.R.; Brockhoff, P.B.; Olsen, C.E. Aroma volatiles of blanched green peas (Pisum sativum L.). J. Agric. Food Chem. 1998, 46, 3727–3734. [Google Scholar] [CrossRef]
  14. Lee, K.-G.; Shibamoto, T. Analysis of volatile components isolated from Hawaiian green coffee beans (Coffea arabica L.). Flavour Frag. J. 2002, 17, 349–351. [Google Scholar] [CrossRef]
  15. Schmarr, H.-G.; Ganß, S.; Koschinski, S.; Fischer, U.; Riehle, C.; Kinnart, J.; Potouridis, T.; Kutyrev, M. Pitfalls encountered during quantitative determination of 3-alkyl-2-methoxypyrazines in grape must and wine using gas chromatography–mass spectrometry with stable isotope dilution analysis. Comprehensive two-dimensional gas chromatography–mass spectrometry and on-line liquid chromatography-multidimensional gas chromatography–mass spectrometry as potential loopholes. J. Chromatogr. A 2010, 1217, 6769–6777. [Google Scholar]
  16. Machiels, D.; Istasse, L. Evaluation of two commercial solid-phase microextraction fibres for the analysis of target aroma compounds in cooked beef meat. Talanta 2003, 61, 529–537. [Google Scholar] [CrossRef]
  17. Kalua, C.M.; Boss, P.K. Sample preparation optimization in wine and grapes: Dilution and sample/headspace volume equilibrium theory for headspace solid-phase microextraction. J. Chromatogr. A 2008, 1192, 25–35. [Google Scholar] [CrossRef]
  18. Onuki, S.; Koziel, J.A.; Jenks, W.S.; Cai, L.; Rice, S.; van Leeuwen, J. Optimization of extraction parameters for quantification of fermentation volatile by-products in industrial ethanol with solid-phase microextraction and gas chromatography. J. Inst. Brew. 2016, 122, 102–109. [Google Scholar] [CrossRef] [Green Version]
  19. Chin, S.-T.; Eyres, G.T.; Marriott, P.J. System design for integrated comprehensive and multidimensional gas chromatography with mass spectrometry and olfactometry. Anal. Chem. 2012, 84, 9154–9162. [Google Scholar] [CrossRef]
  20. Schmarr, H.-G.; Slabizki, P.; Legrum, C. Optimization in multidimensional gas chromatography applying quantitative analysis via a stable isotope dilution assay. Anal. Bioanal. Chem. 2013, 405, 6589–6593. [Google Scholar] [CrossRef]
  21. Stauffer, M. Calibration and Validation of Analytical Methods: A Sampling of Current Approaches; IntechOpen: London, UK, 2018. [Google Scholar] [CrossRef]
  22. Armbruster, D.A.; Pry, T. Limit of blank, limit of detection and limit of quantitation. Clin. Biochem. Rev. 2008, 29, S49–S52. [Google Scholar]
  23. Roujou de Boubée, D.; van Leeuwen, C.; Dubourdieu, D. Organoleptic impact of 2-methoxy-3-isobutylpyrazine on red Bordeaux and Loire wines. Effect of environmental conditions on concentrations in grapes during ripening. J. Agric. Food Chem. 2000, 48, 4830–4834. [Google Scholar] [CrossRef] [PubMed]
  24. Zhao, X.; Ju, Y.; Wei, X.; Dong, S.; Sun, X.; Fang, Y. Significance and transformation of 3-alkyl-2-methoxypyrazines through grapes to wine: Olfactory properties, metabolism, biochemical regulation, and the HP-MP cycle. Molecules 2019, 24, 4598. [Google Scholar] [CrossRef] [PubMed] [Green Version]
  25. Sidhu, D.; Lund, J.; Kotseridis, Y.; Saucier, C. Methoxypyrazine analysis and influence of viticultural and enological procedures on their levels in grapes, musts, and wines. Crit. Rev. Food Sci. 2015, 55, 485–502. [Google Scholar] [CrossRef] [PubMed]
  26. Hashizume, K.; Samuta, T. Grape maturity and light exposure affect berry methoxypyrazine concentration. Am. J. Enol. Vitic. 1999, 50, 194. [Google Scholar]
  27. Legrum, C.; Gracia-Moreno, E.; Lopez, R.; Potouridis, T.; Langen, J.; Slabizki, P.; Weiand, J.; Schmarr, H.-G. Quantitative analysis of 3-alkyl-2-methoxypyrazines in German Sauvignon blanc wines by MDGC–MS or MDGC–MS/MS for viticultural and enological studies. Eur. Food Res. Technol. 2014, 239, 549–558. [Google Scholar] [CrossRef]
  28. Botezatu, A.; Pickering, G.J.; Kotseridis, Y. Development of a rapid method for the quantitative analysis of four methoxypyrazines in white and red wine using multi-dimensional Gas Chromatography—Mass Spectrometry. Food Chem. 2014, 160, 141–147. [Google Scholar] [CrossRef]
  29. Ishii, A.; Roudnitzky, N.; Béno, N.; Bensafi, M.; Hummel, T.; Rouby, C.; Thomas-Danguin, T. Synergy and masking of odor mixtures: An electrophysiological study of orthonasal vs. retronasal perception. Chem. Senses 2008, 33, 553–561. [Google Scholar] [CrossRef] [Green Version]
  30. Ilc, T.; Werck-Reichhart, D.; Navrot, N. Meta-analysis of the core aroma components of grape and wine aroma. Front. Plant. Sci. 2016. [Google Scholar] [CrossRef] [Green Version]
Figure 1. Effect of the dilution factor on methoxypyrazine recovery. IBMP—2-Isobutyl-3-methoxypyrazine, d3-IBMP—deuterated 2-Isobutyl-3-methoxypyrazine, IPMP—2-Isopropyl-3-methoxypyrazine, d3-IPMP—deuterated 2-Isopropyl-3-methoxypyrazine, and SBMP—2-sec-Butyl-3-methoxypyrazine.
Analytica 02 00001 g001
Figure 2. First dimension chromatograph of wine captured on FID. Shaded areas are the heart-cut regions sent to the second dimension.
Analytica 02 00001 g002
Figure 3. Second dimension selective ion monitoring (SIM) chromatographs of (A) deuterated internal standards and (B) methoxypyrazines run in SIM mode.
Analytica 02 00001 g003
Table 1. Retention times and indices of the methoxypyrazines and the corresponding deuterated internal standards.
AnalyteMolecular WeightRetention Time (min)Retention IndicesMonitored Ions (m/z) *
Dimension 1Dimension 2CalculatedLiterature
IBMP166.2237.2048.3815171516124, 151
IPMP152.1931.1443.7814221423152, 137
SBMP166.2235.6647.7414941494124, 138
d3-IBMP169.2437.1448.291515N/A127, 154
d3-IPMP155.2131.0843.691421N/A140, 155
N/A—Not available, * Bolded ion is the target ion, IBMP—2-Isobutyl-3-methoxypyrazine, d3-IBMP—deuterated 2-Isobutyl-3-methoxypyrazine, IPMP—2-Isopropyl-3-methoxypyrazine, d3-IPMP—deuterated 2-Isopropyl-3-methoxypyrazine, SBMP—2-sec-Butyl-3-methoxypyrazine.
Table 2. Compounds detected in the first dimension heart-cut regions of the chromatographs sent to the second dimension.
Retention Time
(2nd Dimension)
CompoundRetention Indices Literature (1st dimension)% MS Match
37.41(1H)-Pyrrole149995
39.012,3-Butanediol152398
39.321-Octen-3-ol142396
40.56cis-Hept-4-enol150288
40.696-Hepten-1-oln/a90
41.40Benzaldehyde152598
43.48p-Cymene142680
43.78IPMP1423
43.96Siloxane (system peak)n/a
45.152-Nonanol152195
45.67β- Linalool153797
47.74SBMP1494
48.38IBMP1516
49.10Decanal151294
50.502-Bornene151989
51.96Unknown
53.26Vitispirane152794
53.97Unknown
Table 3. Compound concentration range, limit of blank, limit of detection, and limit of quantitation a for the optimized assay conditions.
CompoundConcentration Range (ng/L)LOB (ng/L)LOD (ng/L)%CV bEquationR2 c
IPMP0.260–9.960.1590.1921.4y = −0.9383x 2 + 5.401x + 0.03340.9993
SBMP0.130–9.990.0160.0612.8y = −0.1479x2 + 13.188x − 0.02160.9998
IBMP0.267–41.160.1100.1753.5y = −0.0615x2 + 3.533x − 0.02380.9996
a LOQ is determined as the lowest concentration of the concentration range. b Data was measured in wine spiked at 0.66, 0.66, and 2.73 ng/L levels for IPMP, SBMP, and IBMP, respectively. c Measurements were made in deionized water. IBMP—2-Isobutyl-3-methoxypyrazine, d3-IBMP—deuterated 2-Isobutyl-3-methoxypyrazine, IPMP—2-Isopropyl-3-methoxypyrazine, d3-IPMP—deuterated 2-Isopropyl-3-methoxypyrazine, SBMP—2-sec-Butyl-3-methoxypyrazine, LOB—limit of blank, LOD—limit of detection, LOQ—limit of quantitation.
Table 4. Percent recovery and coefficient of variation (%CV) of methoxypyrazines spiked in three distinct wine styles and a model wine solution.
WineIPMPSBMPIBMP
Spike Concentration (ng/L)% Recovery% CVSpike Concentration (ng/L)% Recovery% CVSpike Concentration (ng/L)% Recovery% CV
Sauvignon blanc0.6695.15.470.6697.12.952.73106.32.30
Sauvignon blanc2.26102.01.412.21101.21.159.14101.80.57
Model wine (mid-range)0.6698.02.270.6697.02.812.73100.33.04
Model wine (high-range)3.32100.81.343.33101.32.6213.72100.12.82
Rosé0.6697.73.430.6694.95.212.7399.66.57
Pinot noir0.66100.50.300.6694.34.682.7395.73.88
IBMP—2-Isobutyl-3-methoxypyrazine, d3-IBMP—deuterated 2-Isobutyl-3-methoxypyrazine, IPMP—2-Isopropyl-3-methoxypyrazine, d3-IPMP—deuterated 2-Isopropyl-3-methoxypyrazine, SBMP—2-sec-Butyl-3-methoxypyrazine.
Table 5. Methoxypyrazine concentrations found in three different wine styles.
WineIPMP (ng/L)SMBP (ng/L)IBMP (ng/L)
Sauvignon blanc0.259 ± 0.0310.191 ± 0.0610.470 ± 0.164
RoséDetected (0.248 ± 0.026)0.192 ± 0.0585.80 ± 0.42
Pinot noirNot Detected0.330 ± 0.3700.360 ± 0.070
IBMP—2-Isobutyl-3-methoxypyrazine, d3-IBMP—deuterated 2-Isobutyl-3-methoxypyrazine, IPMP—2-Isopropyl-3-methoxypyrazine, d3-IPMP—deuterated 2-Isopropyl-3-methoxypyrazine, SBMP—2-sec-Butyl-3-methoxypyrazine, Detected—above the limit of detection, but below the limit of quantitation.
Publisher’s Note: MDPI stays neutral with regard to jurisdictional claims in published maps and institutional affiliations.

