Relationships between Soluble Solids and Dry Matter in the Flesh of Stone Fruit at Harvest


1
Tatura SmartFarm, Agriculture Victoria, 255 Ferguson Rd, Tatura, VIC 3616, Australia
2
Centre for Agricultural Innovation, The University of Melbourne, Melbourne, VIC 3010, Australia
*
Author to whom correspondence should be addressed.
Analytica 2021, 2(1), 14-24; https://0-doi-org.brum.beds.ac.uk/10.3390/analytica2010002
Submission received: 11 January 2021
/
Revised: 25 January 2021
/
Accepted: 26 January 2021
/
Published: 2 February 2021
Abstract
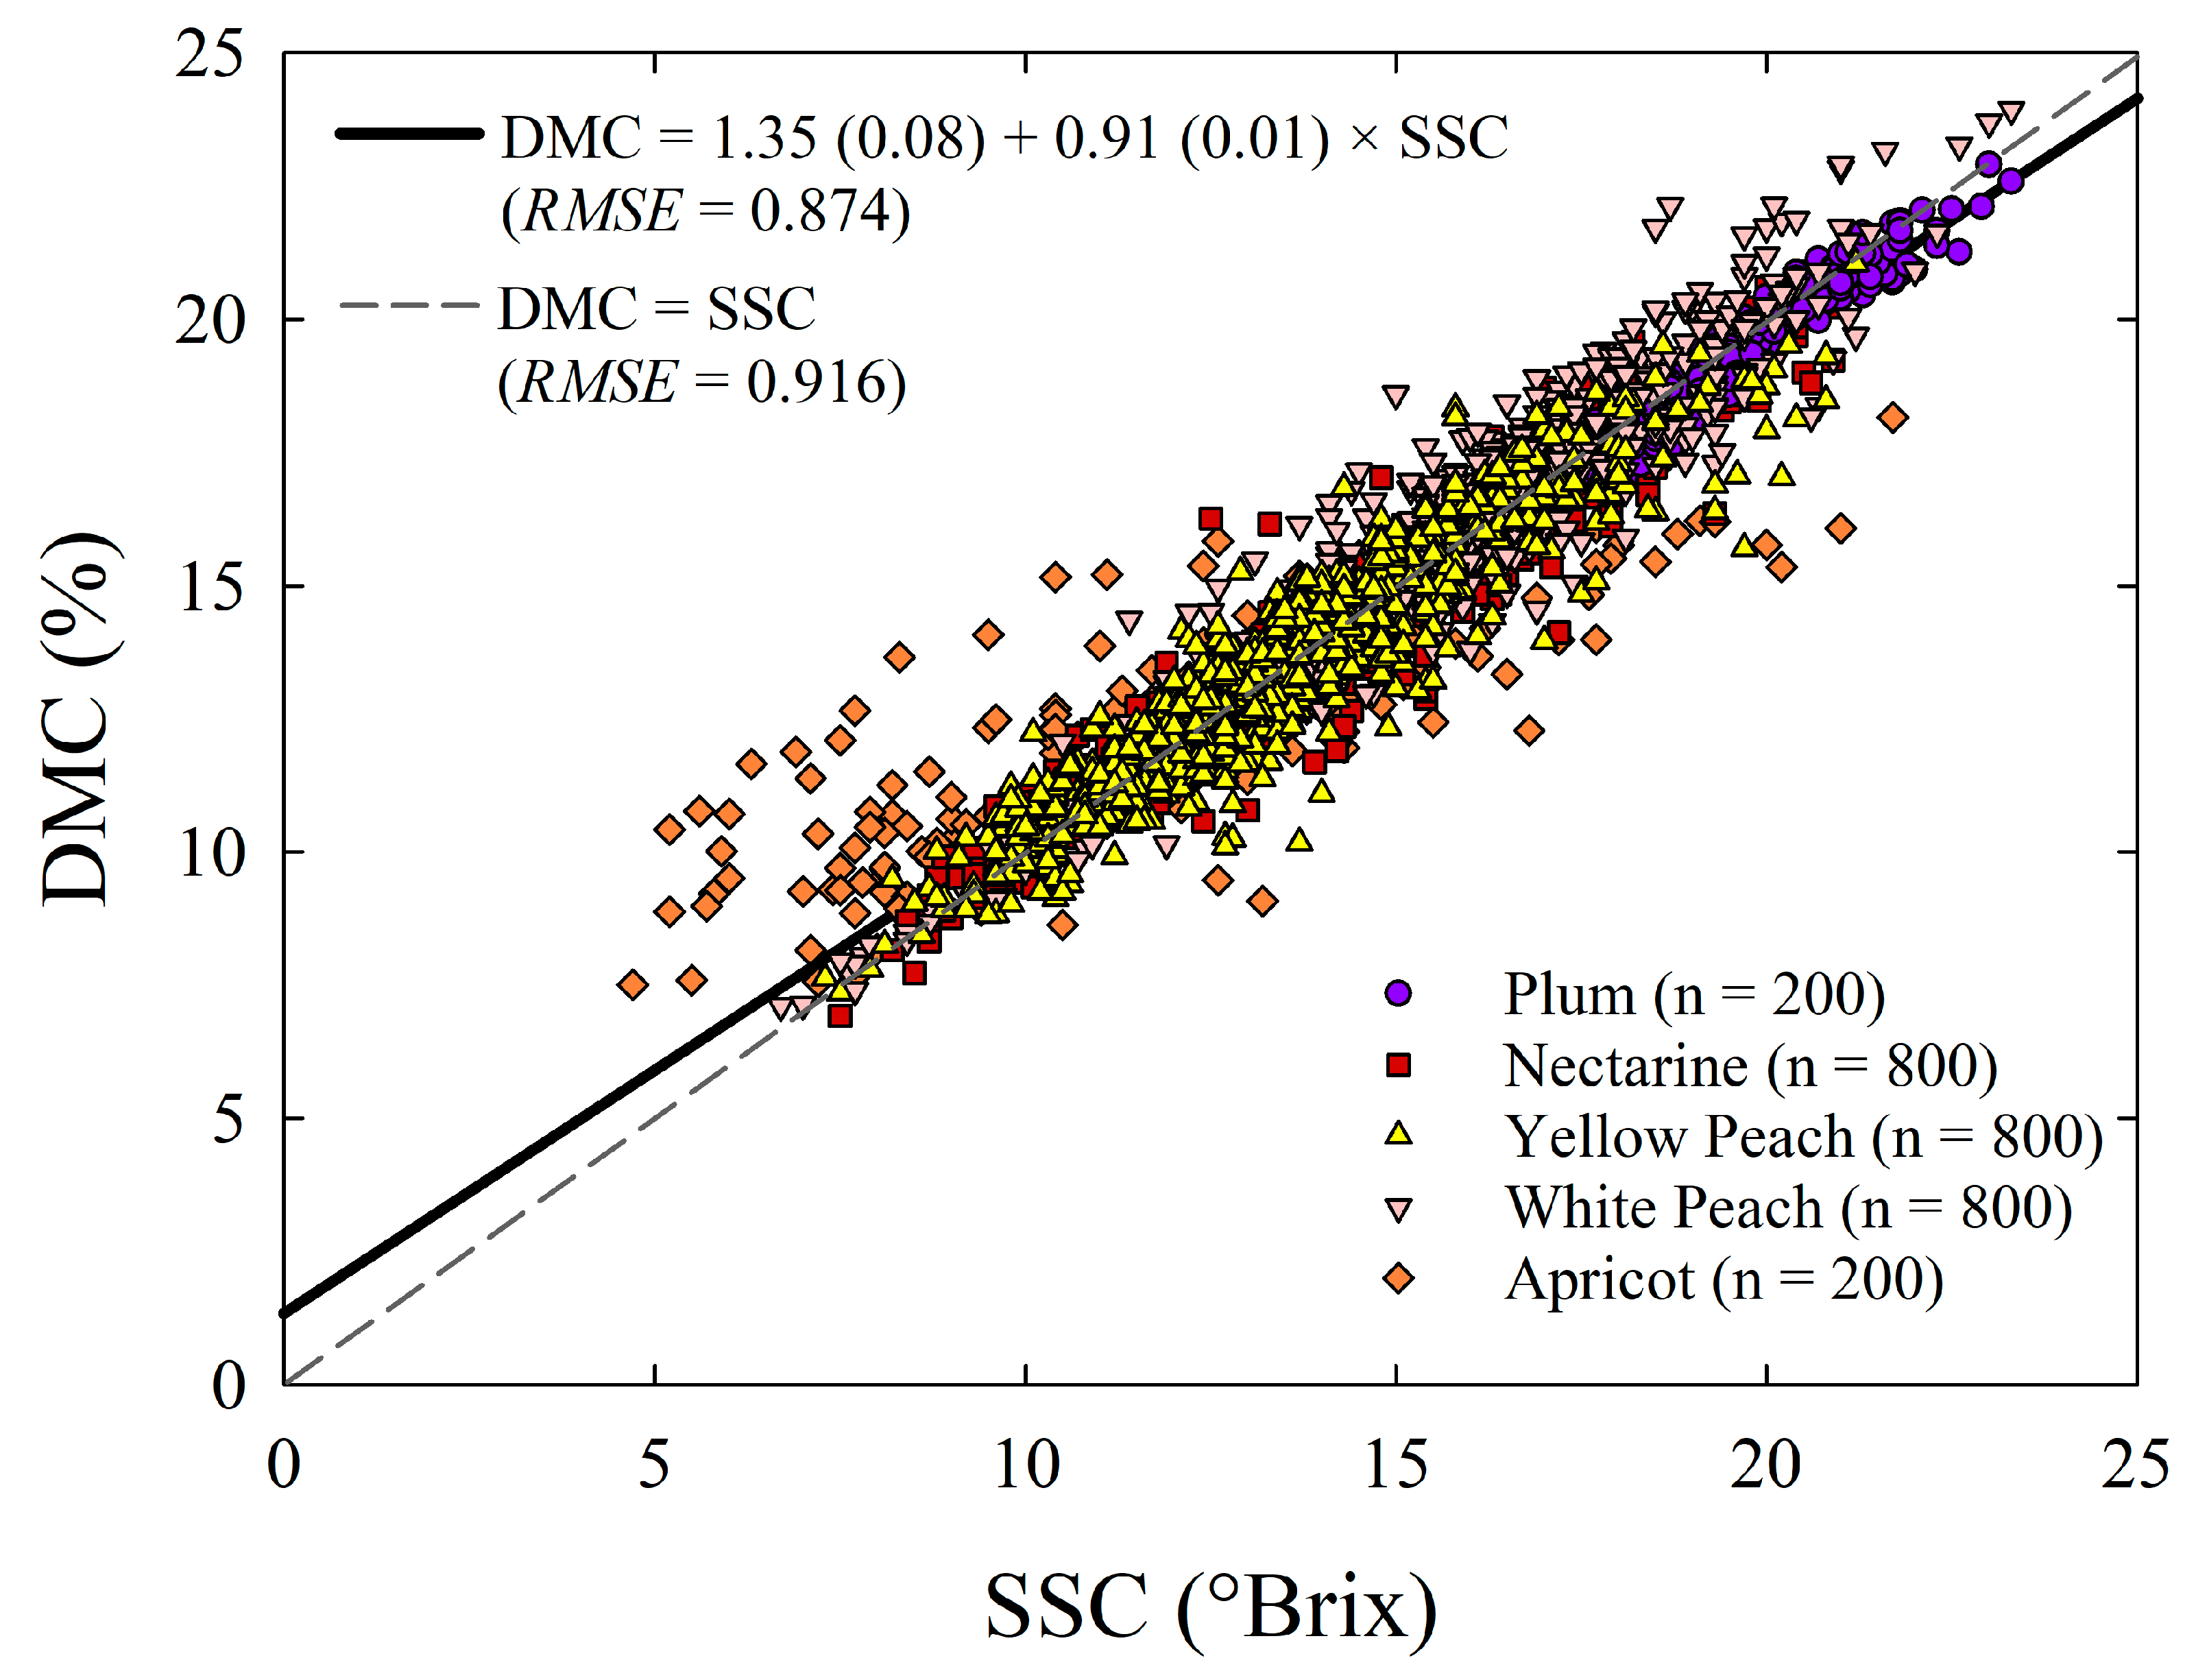
:Soluble solids concentration (SSC) is a reference index that is typically used to quantify soluble sugars, the most abundant constituents of stone fruit flesh dry matter when approaching maturity. Dry matter concentration (DMC) is another parameter that has been often associated with fruit quality. This study investigated the relationship of SSC and DMC in fourteen stone fruit cultivars at harvest. SSC and DMC were measured at physiological maturity in peach, nectarine, plum and apricot. SSC and DMC data had similar symmetrical patterns (range, means and variability) for most of the cultivars. Mean SSC ranged between 11.6 and 19.7 °Brix, and DMC between 11.6% and 19.4% w/w across all fruit studied. High variability in SSC was observed in apricot, with an interquartile range = 5.7 °Brix. A generic linear regression model that included peach, nectarine and plum cultivars revealed a robust association between DMC and SSC (p < 0.001, R2 = 0.914, n = 2800) with a DMC prediction error (RMSE) equal to 0.874% w/w. However, when a simplified DMC = SSC was used for DMC estimation, the RMSE only slightly increased and was still lower than 1.00% w/w. Similar results were observed when linear regression models were assessed in each cultivar independently, with R2 > 0.75 and RMSE generated by the simplified DMC = SSC model lower than 1.00% w/w in thirteen out of fourteen stone fruit cultivars, with the exception of the apricot cultivar. These results provide empirical evidence that SSC and DMC are highly correlated fruit quality indicators in plum, peach and nectarine at harvest.
Keywords:
apricot; biochemistry; Brix; concentration; fruit quality; nectarine; peach; plum; pulp; sugars
1. Introduction
Stone fruit of the genus Prunus are among the most economically important crops in temperate regions. Distinguishing fruit quality is important to inform orchard management strategies, maximise production outcomes and meet consumer satisfaction. Stone fruit sweetness is a key driver of consumer preferences [1,2,3] and is usually measured on extracted juice using a calibrated refractometer and expressed as soluble solids concentration (SSC) in units of °Brix, where 1 °Brix = 1 g sucrose equivalents per 100 g solution. Fruit internal composition at harvest is affected by several biochemical changes that are in turn influenced by ripening stage, orchard management, and by genetic and environmental factors. Fruit maturation impacts quality, storage and handling requirements. Some of the fruit constituents that mutate across maturation have been extensively used as quality parameters and maturity indices to better manage harvest, storage and shelf-life in tree fruit crops. In stone fruit, SSC increases during maturation [2,4] and represents one of the most characteristic fruit biochemical changes that occur prior to harvest. Various environmental and physiological factors drive the within-tree variability in fruit SSC [5,6]. During postharvest storage, peach total sugar content remains relatively stable, although individual sugars (e.g., sucrose, sorbitol, glucose and fructose) may decrease or increase based on storage conditions and cultivar [2,7]. Borsani et al. [7] observed that sorbitol is consumed early in the ripening process, followed by partial sucrose degradation accompanied by fructose and glucose increases. SSC is one of the most used fruit maturity indices in nectarine, peach, apricot and plum [8].
Fruit dry matter concentration (DMC) is commonly used as an indicator of maturity and quality among fruit crops such as mango [9], avocado [10], kiwifruit [11], apple [12,13] and pear [14] but has not been traditionally used in the stone fruit industry. Dry matter in fruit flesh consists of all biochemical components other than water, and DMC simply represents dry mass as a percentage of fresh mass. Fruit DMC mainly accounts for soluble sugars, starch, lignin, cellulose, fibre, fats, proteins, organic acids, minerals, vitamins, secondary metabolites (e.g., carotenoids and phenolic compounds), and other minor constituents, although relative quantities will vary among crops. Nectarine DMC remains stable in the four weeks prior to harvest if trees are fully irrigated, whereas if deficit irrigation occurs, fruit DMC increases as water content is reduced [15].
Typically, in stone fruit cultivars at harvest, water represents approximately 80–90% w/w of unpeeled, pitted stone fruit fresh mass [16,17,18], and slightly more in peeled fruit [19], as skin holds less moisture than flesh. Most of the remaining dry matter (i.e., 10–20% w/w) is composed of soluble sugars (e.g., fructose, glucose, sucrose, sorbitol) and more complex soluble and insoluble polysaccharides such as cellulose and lignin [2,17,20]. Starch is not found in mature stone fruit, while protein, fat and ash make up less than two percent of total fruit mass [16,17]. The type of organic acids vary among stone fruit cultivars but they are mostly present in the form of malic, citric, quinic and oxalic acid that account for 0.1 to 2.7% of fresh mass, with lowest total acidity found in white peaches and nectarines [4,16,21]. On average, the total of sucrose, glucose and fructose accounts for approximately 7%, 8%, 6% and 7% of fresh mass in apricot, nectarine, peach and plum cultivars, respectively [16]. Sorbitol is present in lower concentrations in fully ripe stone fruit [4,22].
Given that soluble sugars are the main constituent of dry matter in ripe peach, nectarine, plum and apricot, questions arise about the relationship between SSC and DMC when measured at harvest, as measuring the two indices is time-consuming and potentially redundant if they are tightly associated. In addition, although SSC and DMC values represent concentrations obtained with different measurement techniques, their values at harvest are conveniently in the same scale—typically in the 5–25 °Brix or % w/w range, respectively (personal observations). This study investigated the association between SSC and DMC in fourteen stone fruit cultivars at harvest and assessed whether these two parameters provide similar information for fruit quality monitoring. Furthermore, the study aimed to explore the potential of using DMC and SSC interchangeably, regardless of measurement technique, for practical measurement purposes.
2. Materials and Methods
The study was conducted at the Tatura SmartFarm, Agriculture Victoria, Tatura, Australia (36°26′7″ S and 145°16′8″ E, 113 m a.s.l.). Fruits of four yellow nectarines (Prunus persica L. Batsch: ‘August Bright’, ‘Autumn Bright’, ‘Rose Bright’ and ‘September Bright’), four yellow peaches (P. persica L. Batsch: ‘August Flame’, ‘O’Henry’, ‘Redhaven’ and ‘September Sun’), four white peaches (P. persica L. Batsch: ‘Ice Princess’, ‘Snow Fall’, ‘Snow Flame 23’ and ‘Snow Flame 25’), one apricot (P. armeniaca L.: ‘Golden May’) and one dark-purple Japanese plum (P. salicina L.: ‘Angeleno’) were harvested in summer 2019/20 from a stone fruit experimental orchard. For each cultivar, samples were composed of 200 fruit that included specimens with various sizes and colours to maximise the range of SSC and DMC values within each sample. Fruit were handpicked in the early morning and transferred to the laboratory at ambient temperature for determination of size, SSC and DMC.
Fruit equatorial diameter (FD) was measured with a digital calliper from cheek to cheek, avoiding fruit suture, and it was used as a reference of fruit size. At harvest, SSC is constant along the FD of peach fruit [23]. Subsequently, fruit skin was removed from an area of about 7–8 cm2—on one cheek along the FD—using a peeler and 2 to 3 drops of juice per fruit were extracted onto a digital refractometer (PR-1; ATAGO CO., LTD., Saitama, Japan) for SSC (°Brix) determination. Next, a corer was used to excise a portion of the pulp (Ø ≈ 30 mm, h ≈ 15 mm) from the same area where juice was extracted. Flesh portions were immediately weighed to determine fresh mass, placed in silicone trays and dried in an oven at a constant temperature of 55 °C for 72–96 h to obtain dry mass. DMC was calculated as the ratio of dry to fresh mass and expressed as percentage.
Analysis of variance followed by Tukey’s pairwise comparison was carried out to compare FD among cultivars and means and standard deviations (SD) were shown. SSC and DMC were presented in interquartile range (IQR) box plots with whiskers for each cultivar. Student’s t-tests and Levene’s tests were used to test whether differences between SSC and DMC means were significant and to test the equality of their variances, respectively. Linear regression analyses were conducted to determine the relationship between SSC and DMC in the generic stone fruit population and in each cultivar individually and the models’ goodness of fit was assessed using the coefficient of determination (R2)—i.e., robust associations between DMC and SSC for R2 > 0.75. Comparisons between best-fit regression models and a simple reference model where DMC = SSC (intercept = 0 and slope = 1) were carried out as the two models’ linear fits appeared graphically similar and their values had similar range scales (i.e., 5–25 ° Brix or % w/w). Analysis of variance (ANOVA) was carried out to test significant differences between intercepts and slopes in the two models. Root mean square errors (RMSE) were calculated to quantify the practical errors for the prediction of DMC using the best-fit and the reference DMC = SSC models, with errors considered acceptable for RMSE < 1.00. The difference between the RMSE of best-fit models and RMSE of the DMC = SSC model (ΔRMSE) was calculated to identify the surplus error derived from simplifying the prediction of DMC by using a more practical DMC = SSC instead of the best-fit model. Data were analysed using Minitab® Statistical Software (Minitab, LL v.19, State College, PA, USA) and graphs were generated with SigmaPlot 12.5 (Systat software Inc., Chicago, IL, USA).
3. Results
In the cultivars under study commercial maturity occurred between December 2019 and March 2020. The apricot ‘Golden May’ was the first to reach maturity at the beginning of December, followed by the nectarine ‘Rose Bright and the white peach ‘Snow Flame 23’. The two white peaches ‘Snow Flame 25’ and ‘Ice Princess’ and the yellow peach ‘Redhaven’ were harvested in January, whilst the nectarines ‘Autumn Bright’ and ‘August Bright’ and the yellow peaches ‘August Flame’ and ‘O’Henry’ were harvested in February. The late nectarine and peach ‘September Bright’, ‘September Sun’ and ‘Snow Fall’, and the ‘Angeleno’ plum were harvested in March, with the latter being the last cultivar to reach maturity.
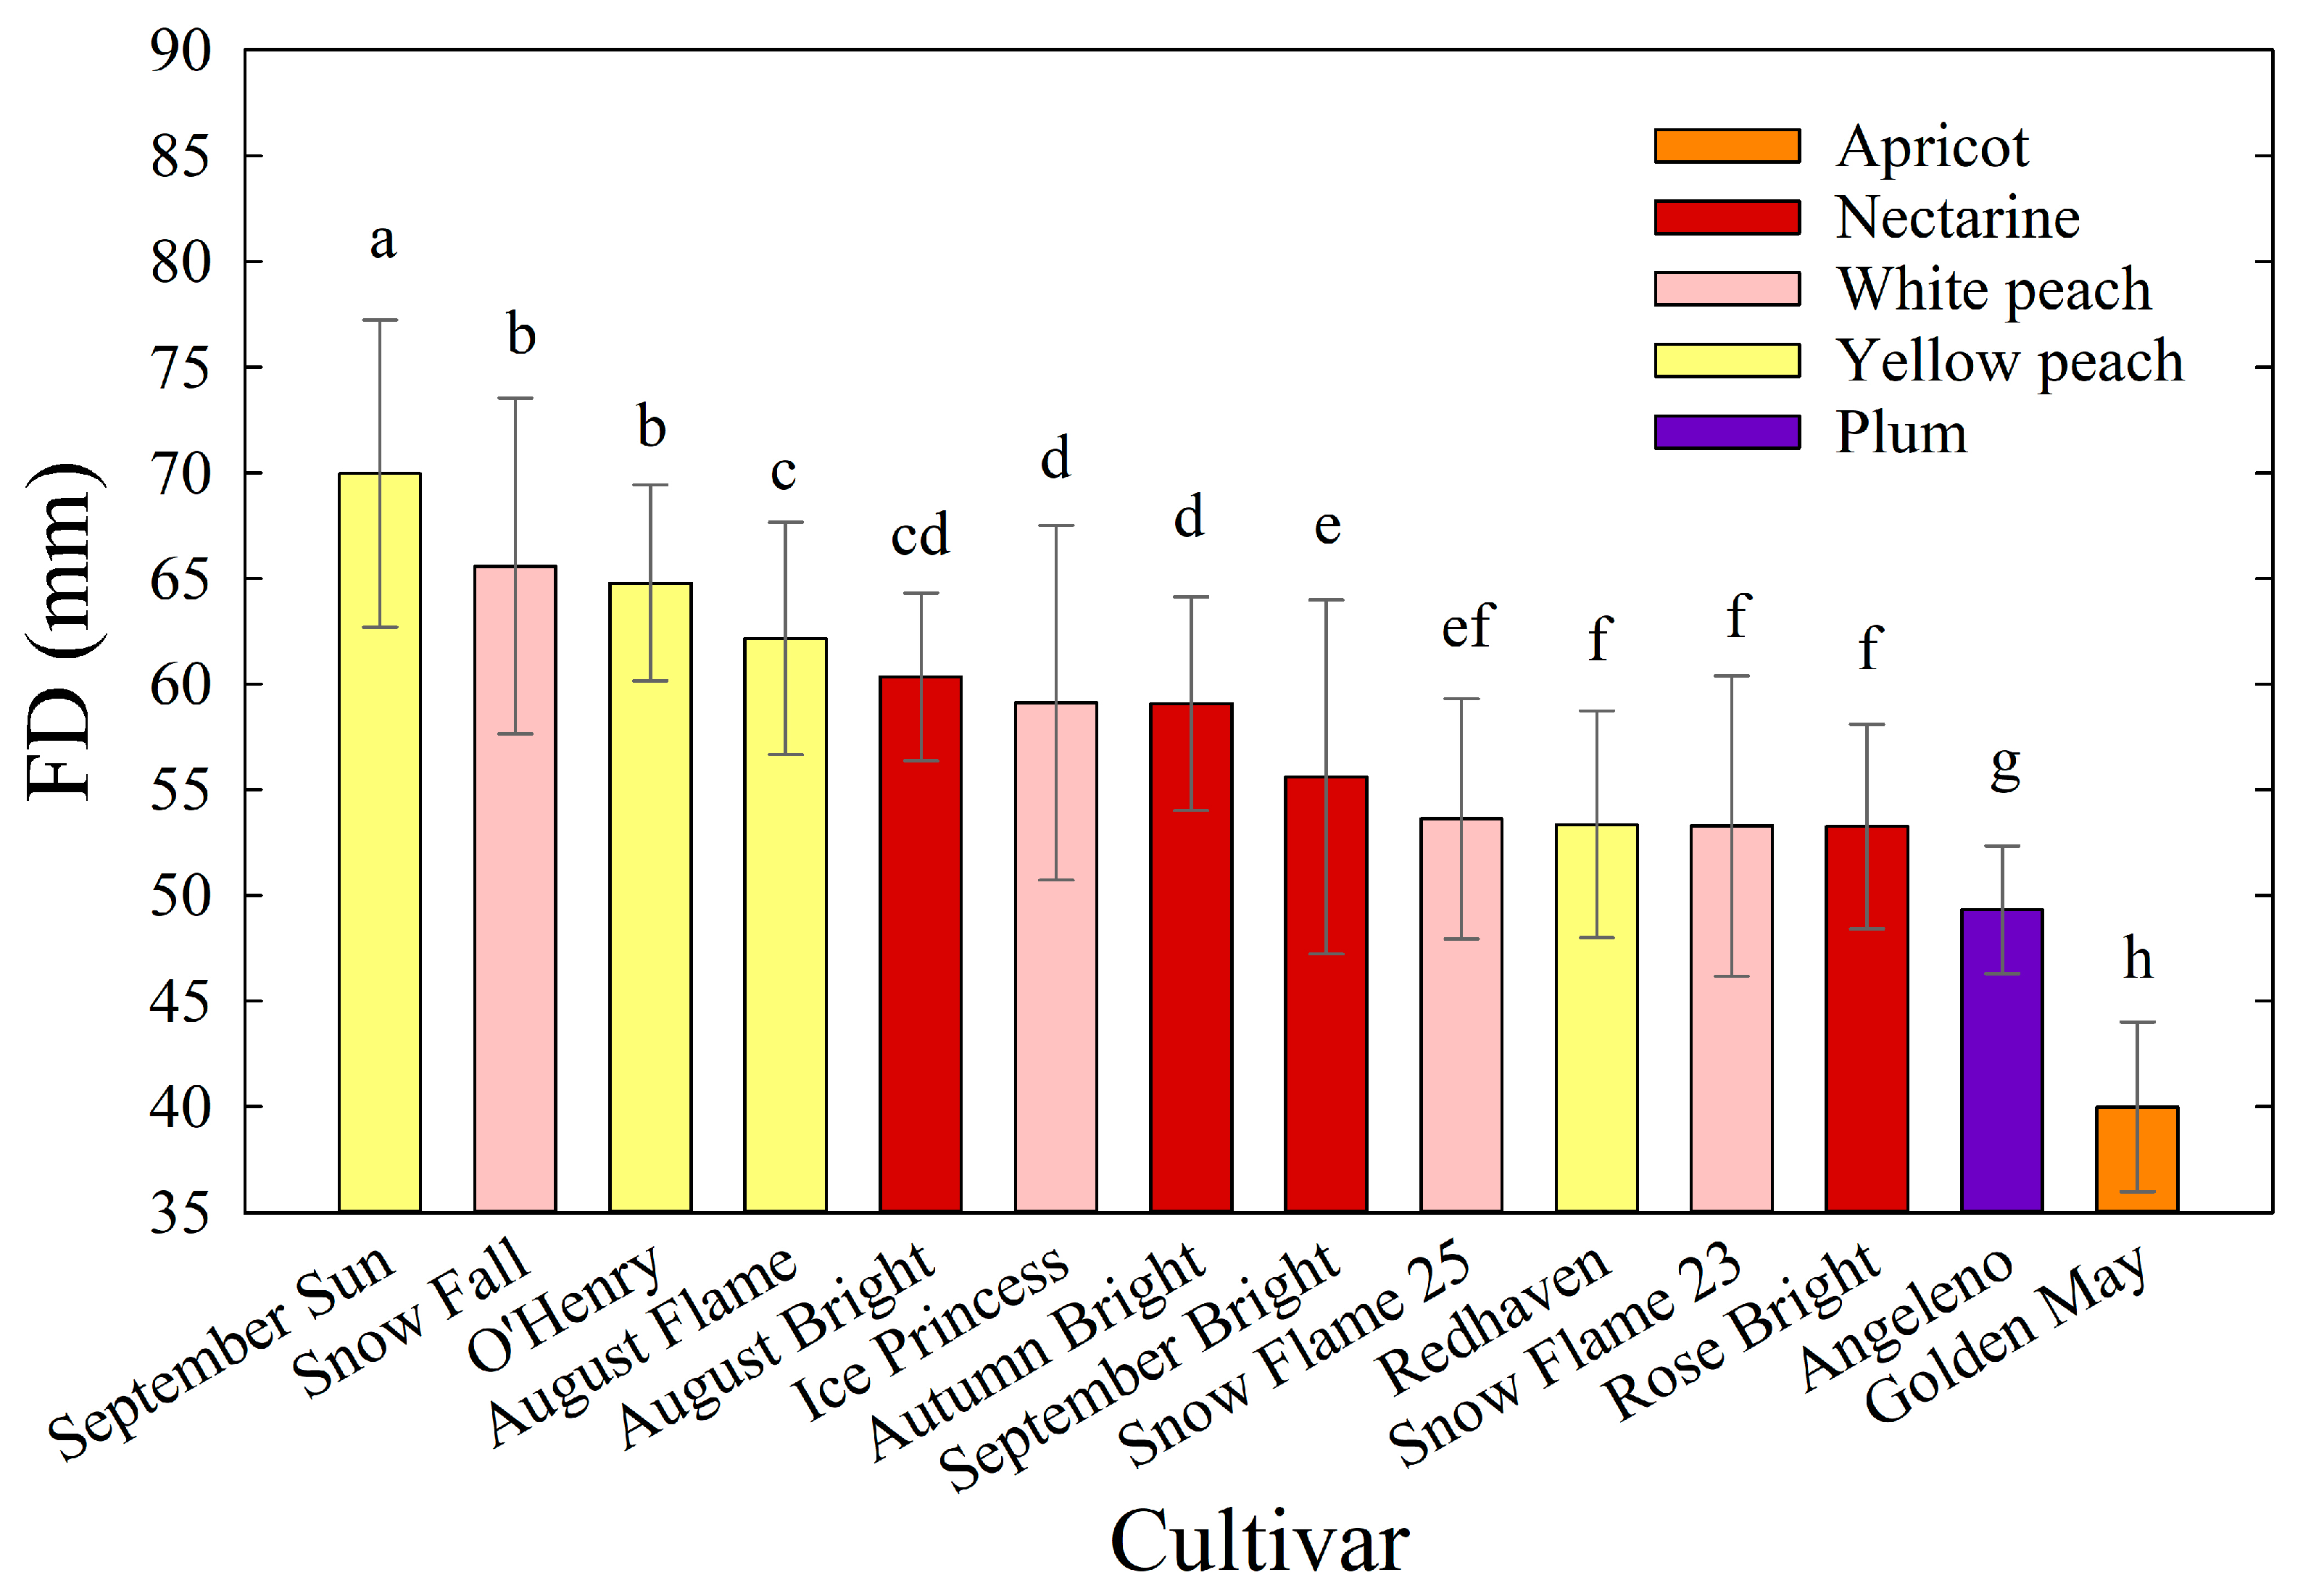
Overall, FD means ranged from approximately 40 to 70 mm among all cultivars under study (Figure 1). ‘Golden May’ apricots were significantly the smallest fruit when compared to all the other cultivars (FD = 40 ± 4 mm) followed by ‘Angeleno’ plums (FD = 49 ± 3 mm). ‘September Sun’ trees yielded fruit significantly larger than others (FD = 70 ± 7 mm), followed by ‘Snow Fall’ (FD = 66 ± 8 mm) and ‘O’Henry’ (FD = 65 ± 4 mm). Notably, fruits in the ‘Angeleno’ plum sample were very uniform in size, resulting in the lowest variability (SD = 3 mm) among cultivars.
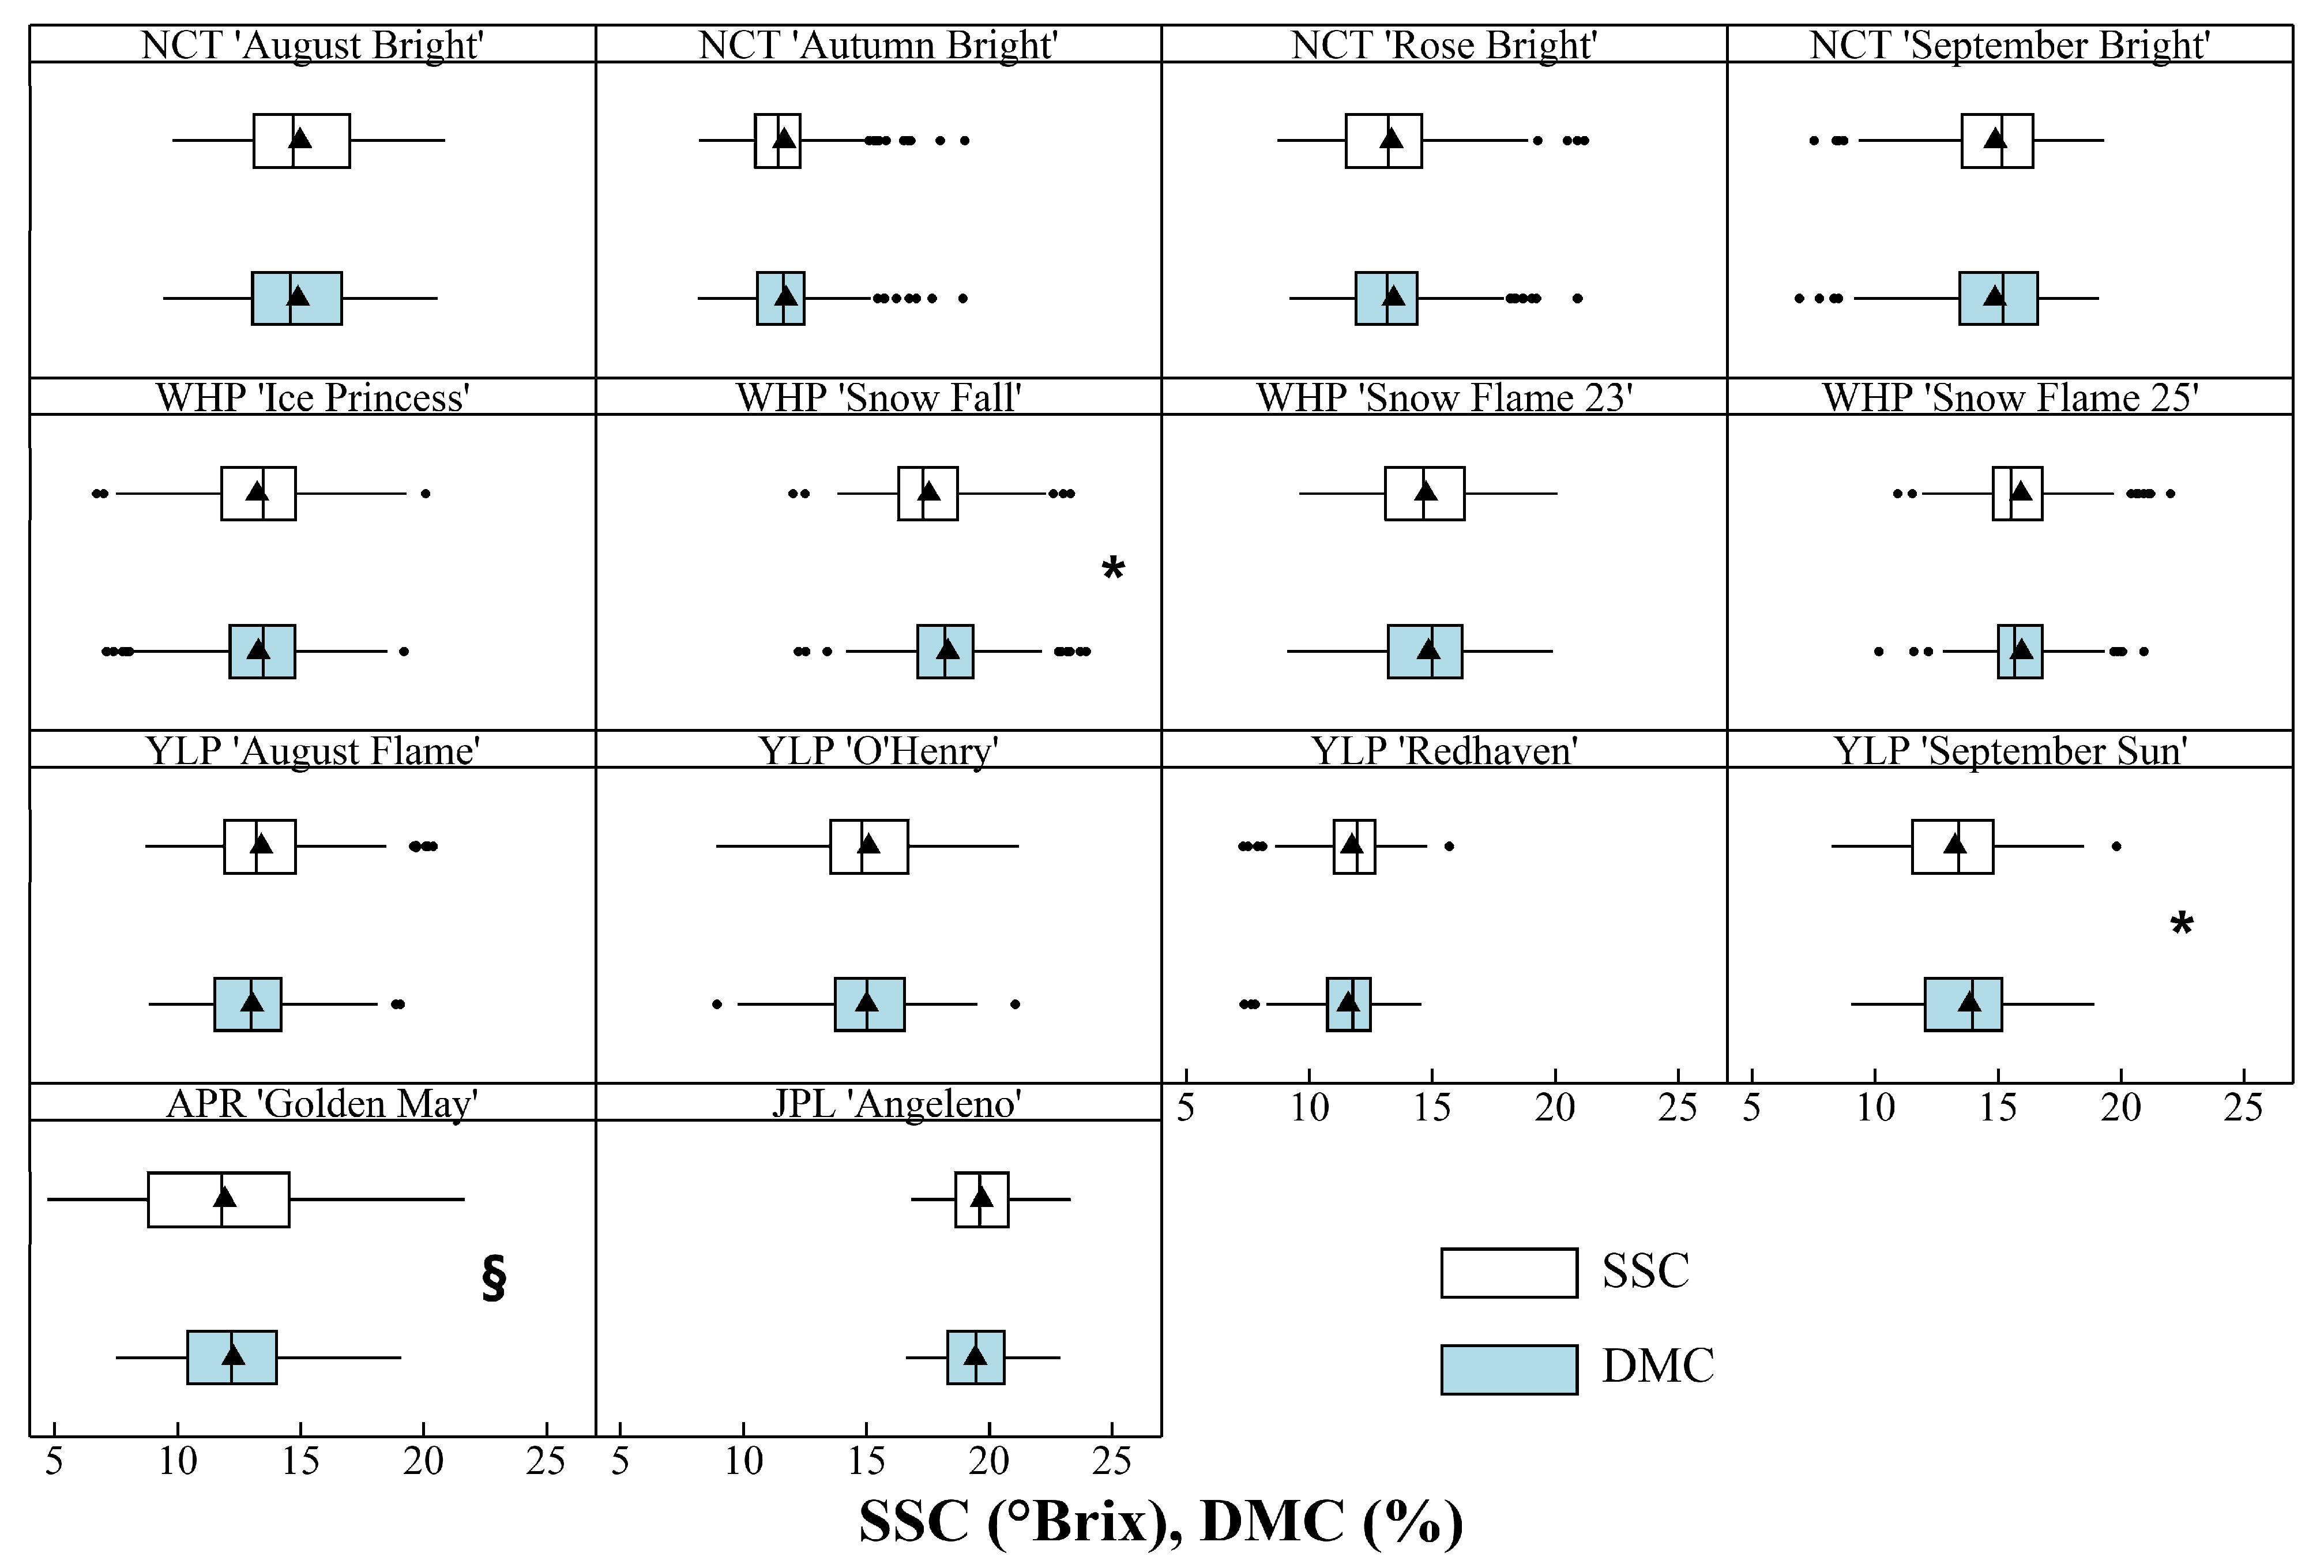
Boxplots of SSC and DMC at harvest highlighted visibly similar data distributions for these two parameters within each cultivar (Figure 2). In each cultivar, both SSC and DMC were normally distributed although their means varied among cultivars as did their variability. Distributions of SSC and DMC within cultivars appeared similar (Figure 2) despite the use of different measurement techniques, respectively. On the one hand, ‘Angeleno’ plums and ‘Redhaven’ peaches expressed low variability for both SSC and DMC (Figure 2). On the other hand, ‘Golden May’ apricots expressed distinctively high SSC variability, leading to a wider IQR (5.7 °Brix) compared to DMC (3.6% w/w) (Figure 2). Furthermore, in ‘September Sun’ and ‘Snow Fall’ peaches, the DMC IQR box was slightly shifted to the right, resulting in a higher mean DMC values (13.8% w/w for ‘September Sun’ and 18.3% w/w for ‘Snow Fall’) compared to SSC (13.2 °Brix for ‘September Sun’ and 17.5 °Brix for ‘Snow Fall’) (Figure 2). The comparison between mean SSC and DMC (t-test) and between their variances (Levene’s test) within each cultivar confirmed previous observations. The mean values of SSC and DMC were not significantly different (p > 0.05) in all the cultivars except for ‘September Sun’ and ‘Snow Fall’ (Figure 2). When SSC and DMC variances were compared, significant differences were only found in the ‘Golden May’ apricot (Figure 2), suggesting that high variability in sugars (i.e., IQR = 5.7 °Brix) is a characteristic of this cultivar that is not reflected by DMC.
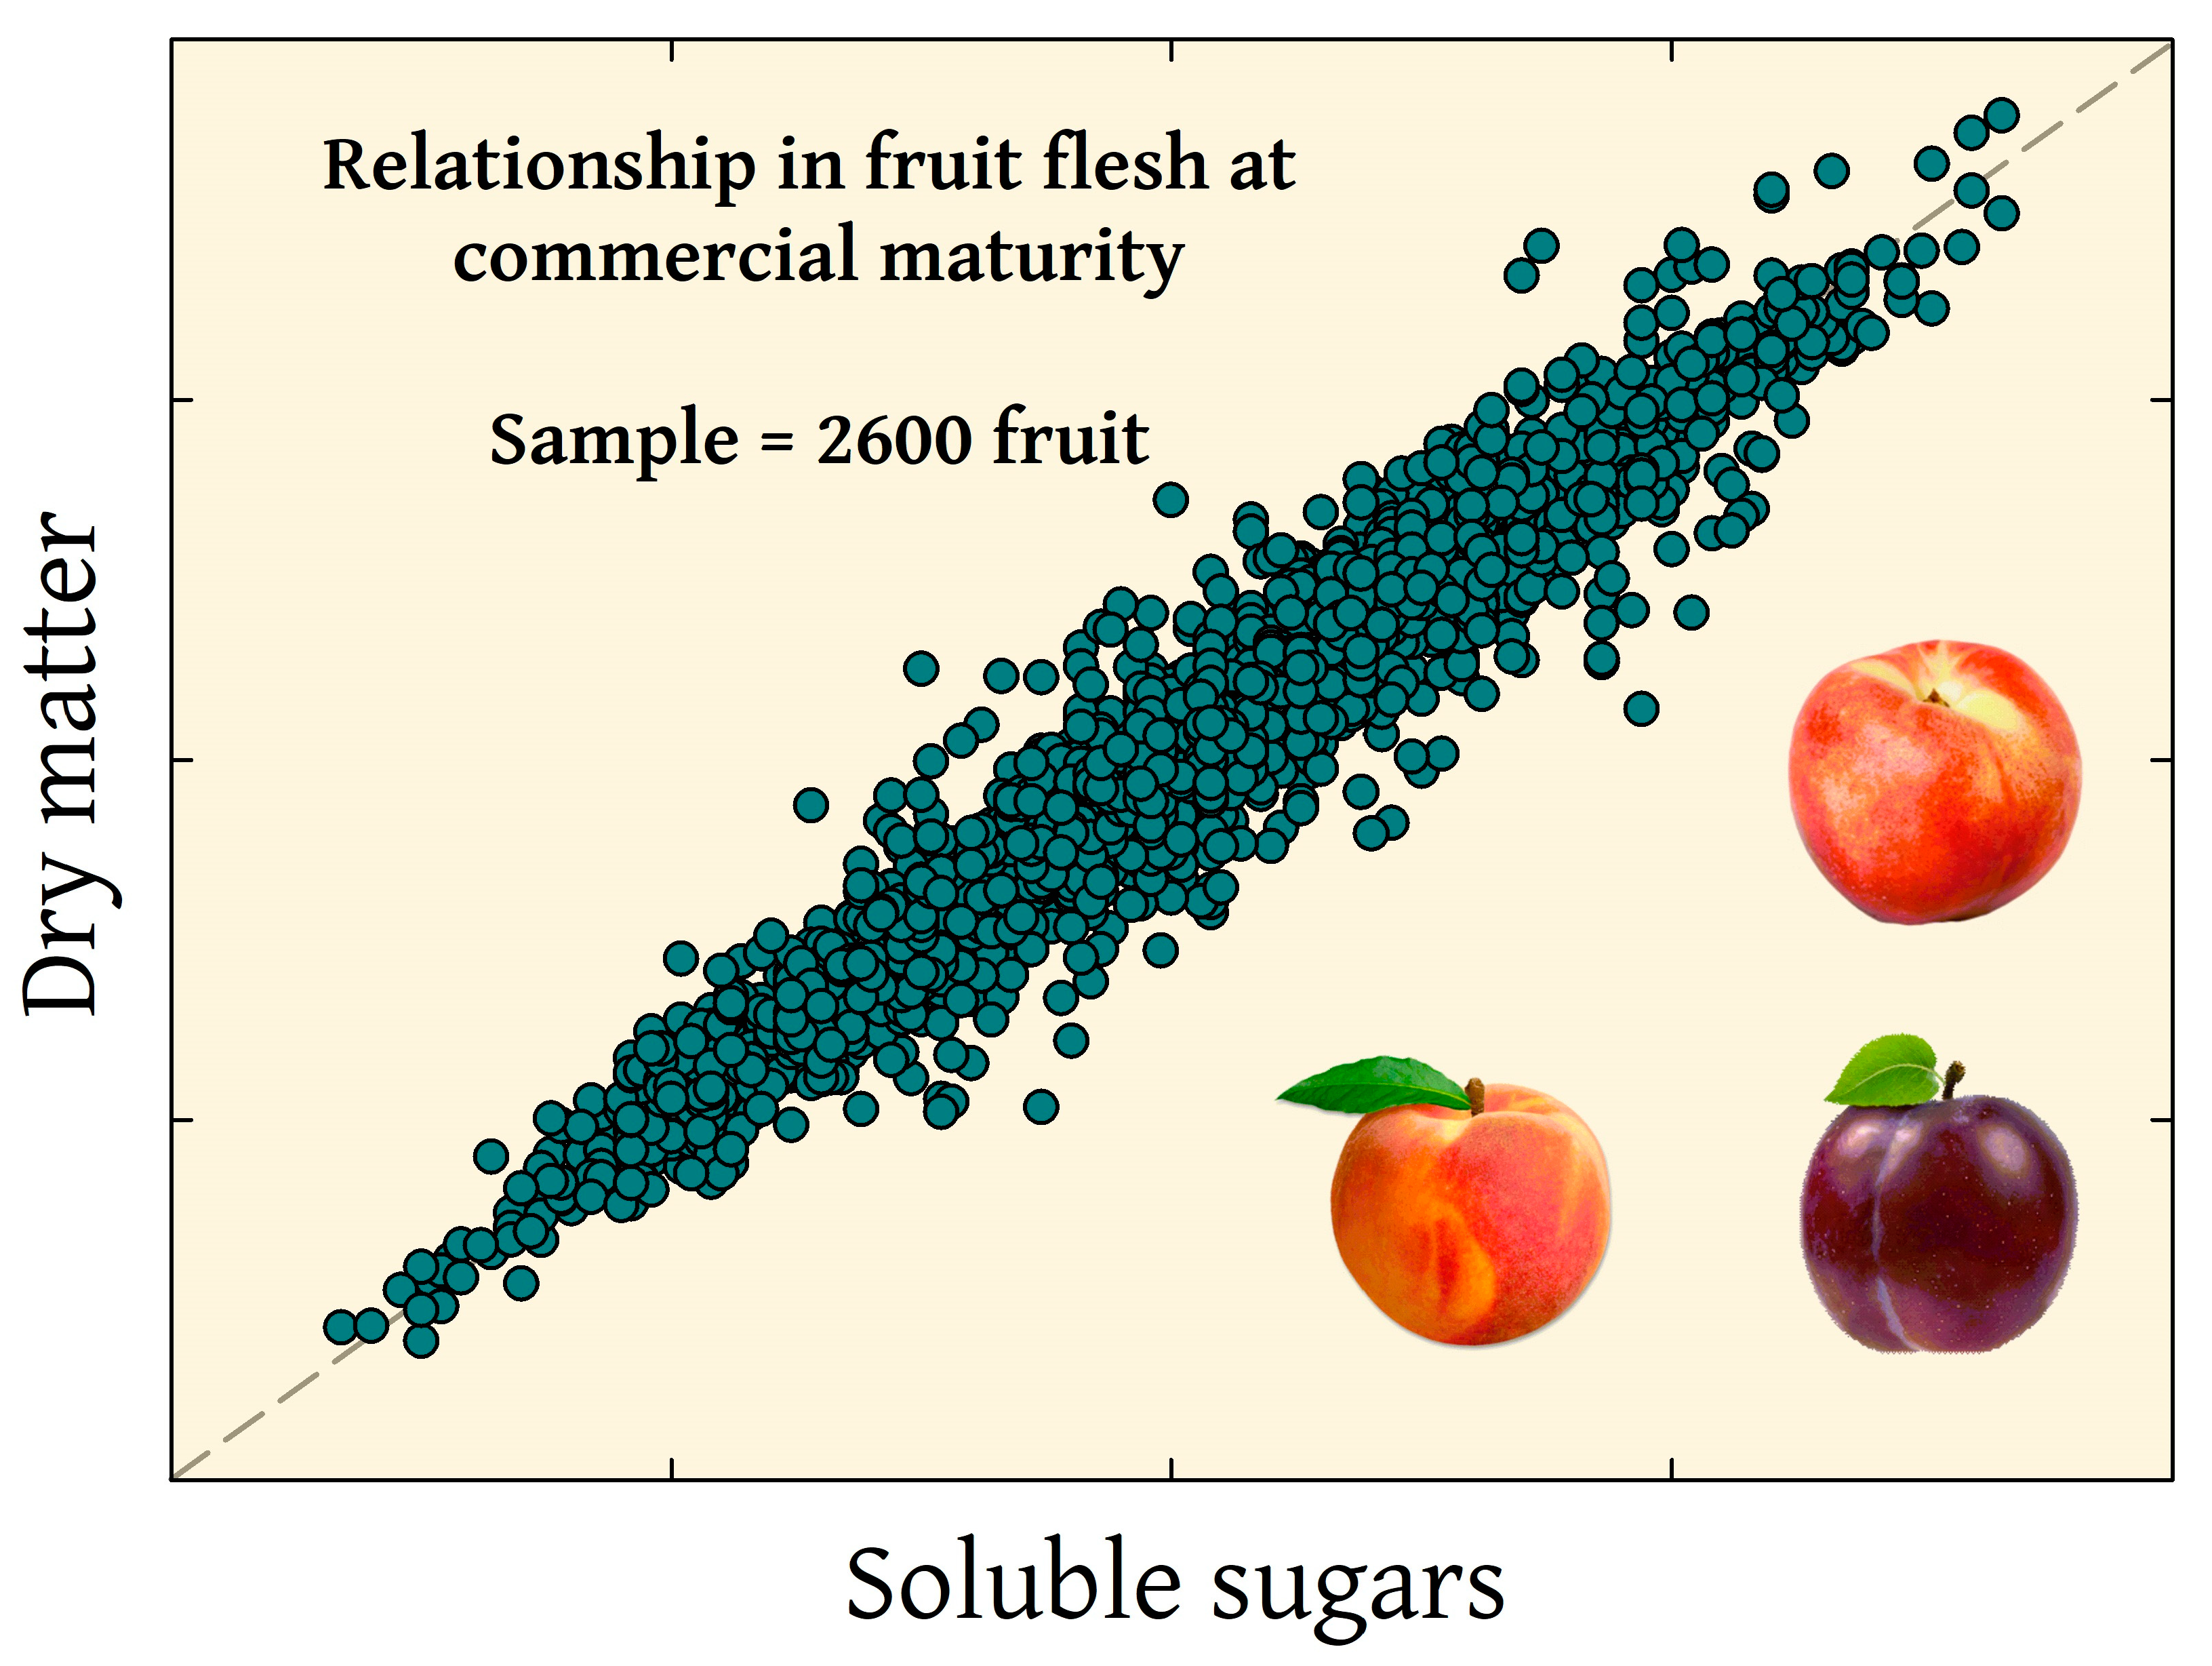
The linear regression analysis between DMC and SSC in the generic stone fruit population revealed a robust direct relationship between them—the best-fit model generated a R2 = 0.931 and a RMSE = 0.874 (Figure 3). The model reported in Figure 3 relied on a large sample size of 2800 fruit, with a SSC range of 4.7 to 23.3 °Brix and a similar DMC range (7.1–23.9% w/w). When the intercept and slope of the best-fit model were compared to the intercept and slope of the reference DMC = SSC (i.e., 0 and 1, respectively), both comparisons generated significant differences (p < 0.001). However, the RMSE obtained with the DMC = SSC model was only slightly higher (0.916) than the one generated by the best-fit model (Figure 3)—i.e., ΔRMSE = 0.042. Figure 3 suggests that individual cultivars may produce some noise in the DMC-SSC relationship (e.g., DMC in ‘Golden May’ apricots appears more dispersed at SSC <12.5 °Brix).
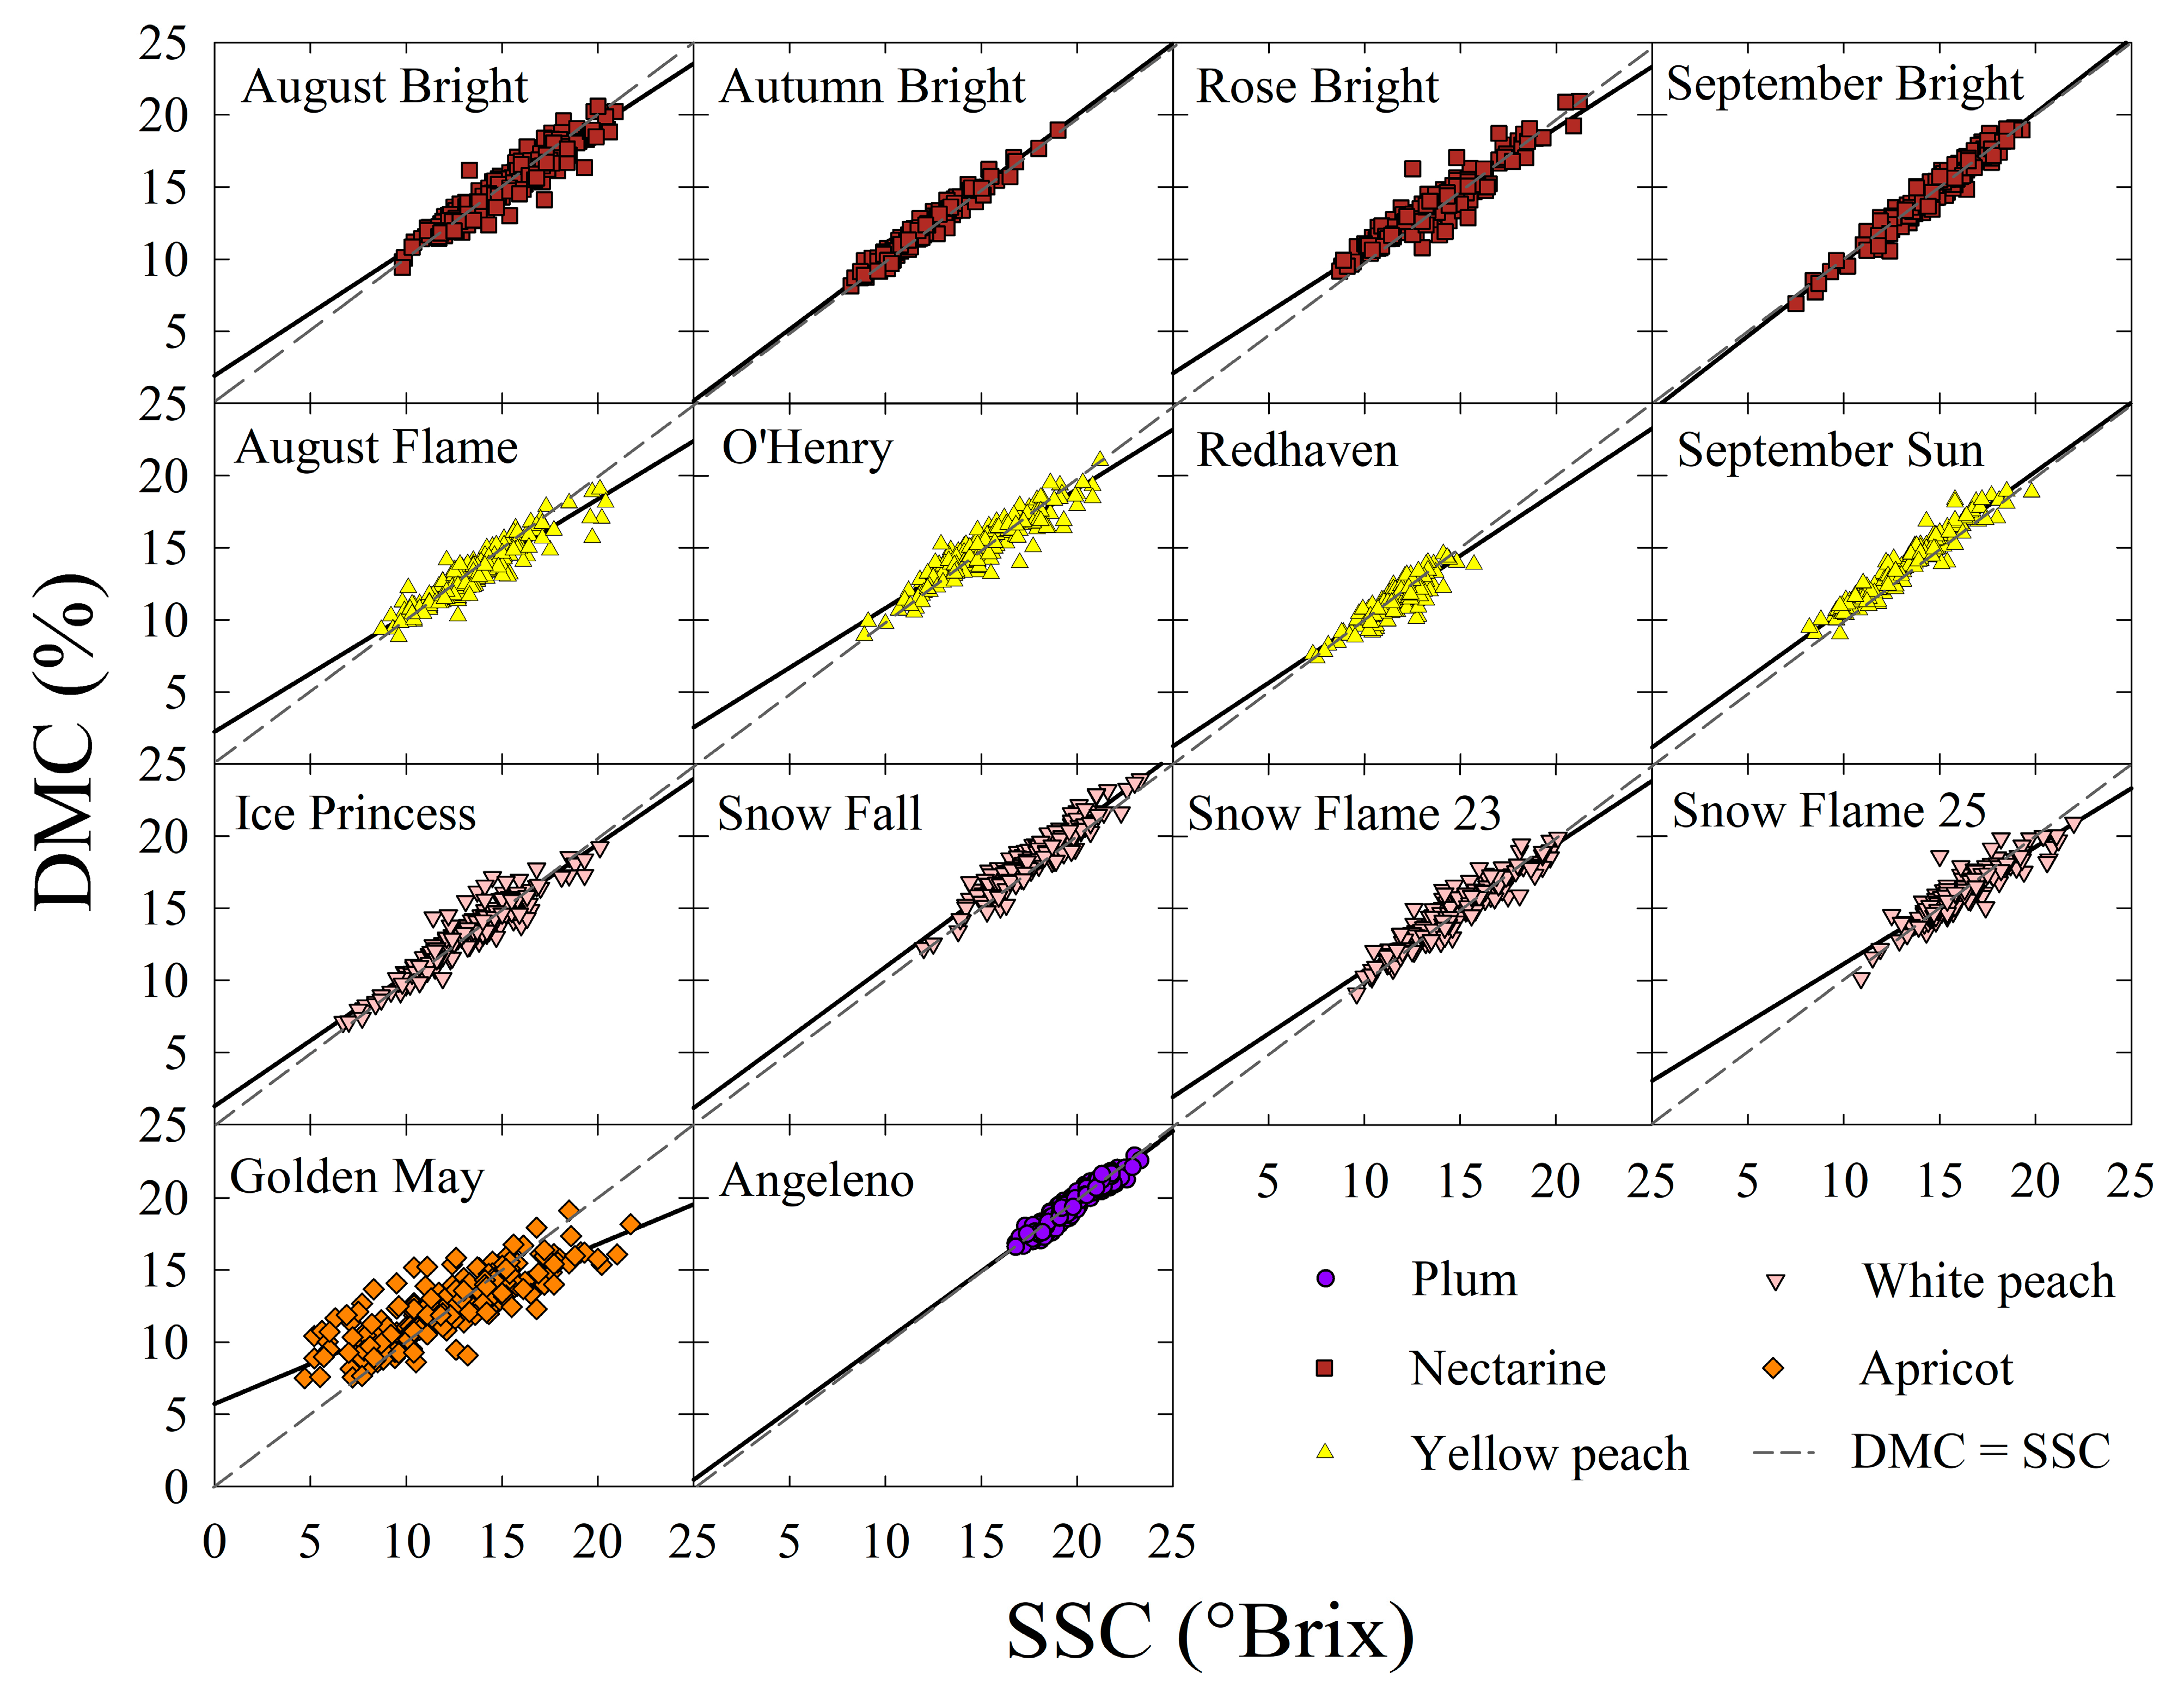
Within-cultivar linear regression models confirmed the tight relationship between DMC and SSC (Figure 4 and Table 1). Except for ‘Golden May’, all the linear regression models expressed highly significant linear associations between SSC and DMC (p < 0.001, R2 > 0.75), although the slopes and intercepts of the models were slightly different among the cultivars (i.e., range for intercept of −0.49 to 3.04, range for slope = 0.81 to 1.03) (Table 1). In ‘Golden May’ the linear regression model generated a lower R2 (0.699) and intercept and slope equal to 5.72 ± 0.32 and 0.55 ± 0.03, respectively (Table 1).
Linear regression best-fits for ‘Autumn Bright’, ‘September Bright’ and ‘Angeleno’ followed an almost identical trend to the reference regression fit of the DMC = SSC model (Figure 4). Indeed, when best-fit intercepts and slopes were compared to 0 and 1 (i.e., DMC = SSC), the ANOVAs highlighted no significant differences in these three cultivars (p ≥ 0.05) (Table 1). In the other cultivars, slopes and intercepts were found to be significantly different between the best-fit and the DMC = SSC model (p < 0.05) with an exception for ‘Snow Fall’, where slope was not significantly different from 1, despite an intercept significantly higher than 0 (Table 1). The RMSE for the best-fit models was lower than 1.00 in all the cultivars under study, with again the exclusion of ‘Golden May’, whose RMSE was 1.328 (Table 1). When the DMC = SSC model was used to estimate DMC, the RMSE slightly increased in all the cultivars that had RMSE < 1.00 for the best-fit model but still did not reach the threshold of RMSE = 1.00 (Table 1). In ‘Golden May’, the DMC = SSC model had a RMSE 1.62-fold higher than the one obtained for the best-fit model and overall, higher than 2.00 (Table 1). The surplus error (ΔRMSE) derived from predicting DMC using the DMC = SSC model instead of the best-fit was < 0.40 in all the cultivars except for ‘Golden May’, in which ΔRMSE was more than double than in ‘Snow Fall’, the cultivar with the second highest ΔRMSE (Table 1).
4. Discussion
Fruit water and dry matter content are inversely related as together they represent the total constituents of fresh mass. The relationship between water and soluble sugar in stone fruit is well known [24,25] and is influenced by dilution/concentration mechanisms occurring in flesh cells. Management strategies such as deficit irrigation have previously been used to maximise SSC of stone fruit at harvest, as water stress induces an increase in the concentration of soluble sugars associated with a reduction in fruit size [3,15]. The significant and positive correlation between SSC and DMC highlighted in linear regression models (Figure 3 and Figure 4 and Table 1) was expected, in line with previous findings on apple [26,27,28] and apricot [29]. The intercept value (% w/w) obtained in the linear regression models can be attributed to the percentage of fresh mass composed of insoluble solids. Insoluble solids accounted for less than 3.1% in peach, nectarine and plum cultivars, but was higher than 5.0% in ‘Golden May’ apricots (Table 1).
The generic best-fit model (Figure 3) generated a RMSE of 0.874, suggesting that DMC at harvest can be estimated from SSC data, and vice versa, with a relatively low error. Furthermore, even assuming a simplified model where DMC = SSC, the prediction error is subjected to a minimal increase (ΔRMSE = 0.042). However, Figure 2 and Figure 3 suggest that the DMC vs. SSC relationship may differ among cultivars. Similar distributions of SSC and DMC were observed in most of the cultivars (Figure 2). Minor differences of SSC and DMC means were only found in the ‘September Sun’ yellow peach and in the ‘Snow Fall’ white peach (Figure 2). These two peach cultivars were characterised by the largest FD (Figure 1), indicating that there may be a tendency to have a larger DMC/SSC ratio in large fruit, possibly determined by different cell size and number and/or higher concentration of structural carbohydrates and fibre. Nevertheless, even in these two cultivars the difference between SSC and DMC means was relatively small (<0.80). The ‘Golden May’ apricot was instead characterised by a significantly different variability of SSC and DMC (Figure 1) that generated a large IQR in SSC (Figure 2). This suggests that ‘Golden May’ apricots could not be considered as part of the same pooled generic stone fruit population. The high variability of SSC observed in ‘Golden May’ was in line with what observed in other apricot genotypes by Socquet-Juglard et al. [30] and was likely influenced by the nonuniform change in the concentration of dietary fibre and acids in the flesh. The sum of acid and fibre concentration tends to be higher in apricot than in nectarines, peach and plum [16]. This also may explain the slope and intercept characteristics of the ‘Golden May’ linear regression equation (Table 1), where DMC = SSC at SSC = 12.5 °Brix, DMC > SSC at SSC < 12.5 °Brix and DMC < SSC at SSC > 12.5 °Brix (Figure 4). Thus, at low SSC, DMC is very likely to be characterised by higher acid and fibre content, whereas at high SSC these constituents tend to be reduced.
Linear regression best-fits were not significantly different from DMC = SSC fits in ‘Autumn Bright’, ‘September Bright’ and ‘Angeleno’, suggesting that DMC and SSC can be interchangeable in these cultivars (Figure 4, Table 1). Therefore, at harvest, in these three cultivars fruit DMC is statistically and practically equivalent to SSC and its values can be estimated using data from SSC with a low error regardless of the model applied (i.e., RMSE ≤ 0.51% w/w, Table 1).
Except ‘Golden May’, replacing the best-fit model with a simplified DMC = SSC model produces small increments of the prediction error (max ΔRMSE = 0.356) in all the cultivars under study (Table 1). The association between DMC and SSC is not statistically equivalent to a simplified DMC = SSC model in all the cultivars, as significant differences in slope and intercept coefficients are often found (Table 1). However, the adoption of the simplified DMC = SSC model generates errors for the DMC prediction lower than 1.00% w/w in thirteen out of fourteen stone fruit cultivars (Table 1). From a practical point of view, errors under 1.00% w/w are acceptable for fruit quality determinations, especially for commercial purposes.
From a precision horticulture perspective, it is important to verify the DMC-SSC relationship for nondestructive SSC and DMC measurements, such as those using near infrared spectroscopy [31,32]. In fact, robust models may be obtained for both parameters as a result of their interdependency. Consumers prefer stone fruit with SSC greater than 11–12 °Brix [11,33,34]; however, high SSC variability within and between cultivars (e.g., Figure 2) is a recurrent problem in the Australian stone fruit industry [5]. Fortunately, ‘smart’ technology (e.g., digital Bluetooth callipers, DA meter, Vis/NIR spectroscopy, colour sensors) can be used to improve orchard management, crop monitoring and harvest protocols, and offers growers the ability to produce high quality fruit that meet consumer expectations [35,36,37].
This study highlighted the strong association between two important fruit quality parameters—SSC and DMC—in Japanese plum, nectarine and peach cultivars at commercial maturity. We caution against the use of DMC and SSC in these crops as separate fruit quality indices at harvest, as their values are very similar, regardless of different measurement techniques. However, in the case of ‘Golden May’ apricots, although SSC and DMC were linearly related, their relationship was less robust than in other cultivars, and generating DMC predictions based on SSC data produced errors > 1%. SSC and DMC show similar values regardless of measurement techniques at harvest, although they represent concentrations of soluble solids on a liquid matrix (juice) and dry matter on a solid matrix (pulp portion), respectively. This is likely due to the low percentage of insoluble solids in fruit fresh mass (i.e., intercept value of the linear regression models) in most of the cultivars. In modern cultivars with high SSC, soluble sugars at harvest represent most of the remaining dry matter in the fruit pulp, justifying why percentages of soluble solids and dry matter are often practically identical. Further work is required to determine how the DMC and SSC are related at different stone fruit maturity stages and to determine if comparable fruit quality relationships exist in other fruits.
Author Contributions
Conceptualization, A.S.; Data curation, A.S.; Formal analysis, A.S.; Funding acquisition, M.G.O.; Investigation, A.S.; Methodology, A.S.; Project administration, M.G.O.; Resources, M.G.O.; Software, A.S.; Supervision, M.G.O.; Writing—original draft, A.S.; Writing—review & editing, M.G.O. All authors have read and agreed to the published version of the manuscript.
Funding
This study was supported by projects ‘Horticulture Development Plan Task 1: Yield and quality relationships with light interception’ funded by the Victorian Government’s Agriculture Infrastructure and Jobs Fund and ‘SF17006: Summerfruit orchard—phase II’ funded by Horticulture Innovation Australia Limited using Summerfruit levy and funds from the Australian Government with coinvestment from Agriculture Victoria.
Data Availability Statement
The data presented in this study are available on request from the corresponding author.
Acknowledgments
We gratefully acknowledge the technical and scientific support and assistance of Des Whitfield, John Lopresti, Madeleine Peavey, Madita Lauer, Dave Haberfield, and Cameron O’Connell.
Conflicts of Interest
The authors declare no conflict of interest.
References
- Delgado, C.; Crisosto, G.M.; Heymann, H.; Crisosto, C.H. Determining the Primary Drivers of Liking to Predict Consumers’ Acceptance of Fresh Nectarines and Peaches. J. Food Sci. 2013, 78. [Google Scholar] [CrossRef] [PubMed]
- Cirilli, M.; Bassi, D.; Ciacciulli, A. Sugars in peach fruit: A breeding perspective. Hortic. Res. 2016, 3, 1–12. [Google Scholar] [CrossRef] [PubMed] [Green Version]
- Lopez, G.; Echeverria, G.; Bellvert, J.; Mata, M.; Behboudian, M.H.; Girona, J.; Marsal, J. Water stress for a short period before harvest in nectarine: Yield, fruit composition, sensory quality, and consumer acceptance of fruit. Sci. Hortic. (Amsterdam) 2016, 211. [Google Scholar] [CrossRef]
- Bae, H.; Yun, S.K.; Jun, J.H.; Yoon, I.K.; Nam, E.Y.; Kwon, J.H. Assessment of organic acid and sugar composition in apricot, plumcot, plum, and peach during fruit development. J. Appl. Bot. Food Qual. 2014, 87, 24–29. [Google Scholar] [CrossRef]
- Lopresti, J.; Goodwin, I.; McGlasson, B.; Holford, P.; Golding, J. Variability in size and soluble solids concentration in peaches and nectarines. Hortic. Rev. (Am. Soc. Hortic. Sci.) 2014, 42, 253–311. [Google Scholar] [CrossRef]
- Lopresti, J.; Goodwin, I.; Stefanelli, D.; Holford, P.; McGlasson, B.; Golding, J. Understanding the factors affecting within-tree variation in soluble solids concentration in peaches and nectarines. Acta Hortic. 2016, 1130, 249–256. [Google Scholar] [CrossRef]
- Borsani, J.; Budde, C.O.; Porrini, L.; Lauxmann, M.A.; Lombardo, V.A.; Murray, R.; Andreo, C.S.; Drincovich, M.F.; Lara, M.V. Carbon metabolism of peach fruit after harvest: Changes in enzymes involved in organic acid and sugar level modifications. J. Exp. Bot. 2009, 60, 1823–1837. [Google Scholar] [CrossRef] [Green Version]
- Crisosto, C.H. Stone fruit maturity indices: A descriptive review. Postharvest News Inf. 1994, 5, 65N–68N. [Google Scholar]
- Subedi, P.P.; Walsh, K.B.; Owens, G. Prediction of mango eating quality at harvest using short-wave near infrared spectrometry. Postharvest Biol. Technol. 2007, 43. [Google Scholar] [CrossRef]
- Gamble, J.; Harker, F.R.; Jaeger, S.R.; White, A.; Bava, C.; Beresford, M.; Stubbings, B.; Wohlers, M.; Hofman, P.J.; Marques, R.; et al. The impact of dry matter, ripeness and internal defects on consumer perceptions of avocado quality and intentions to purchase. Postharvest Biol. Technol. 2010, 57. [Google Scholar] [CrossRef]
- Crisosto, C.H.; Day, K.R. Stone Fruit. In Crop Post-Harvest: Science and Technology; Rees, D., Farrell, G., Orchard, J., Eds.; Blackwell Publishing Ltd.: Oxford, UK, 2012; pp. 212–225. ISBN 9780632057252. [Google Scholar]
- McGlone, V.A.; Jordan, R.B.; Seelye, R.; Clark, C.J. Dry-matter—A better predictor of the post-storage soluble solids in apples? Postharvest Biol. Technol. 2003, 28. [Google Scholar] [CrossRef]
- Palmer, J.W.; Harker, F.R.; Tustin, D.S.; Johnston, J. Fruit dry matter concentration: A new quality metric for apples. J. Sci. Food Agric. 2010. [Google Scholar] [CrossRef] [PubMed]
- Goke, A.; Serra, S.; Musacchi, S. Postharvest dry matter and soluble solids content prediction in d’anjou and bartlett pear using near-infrared spectroscopy. HortScience 2018. [Google Scholar] [CrossRef]
- Scalisi, A.; O’Connell, M.G.; Lo Bianco, R. Field non-destructive determination of nectarine quality under deficit irrigation. Acta Hortic. accepted.
- Wills, R.B.H.; Scriven, F.M.; Greenfield, H. Nutrient composition of stone fruit (Prunus spp.) cultivars: Apricot, cherry, nectarine, peach and plum. J. Sci. Food Agric. 1983, 34, 1383–1389. [Google Scholar] [CrossRef]
- Jones, G.P.; Briggs, D.R.; Wahlquvist, L.M.; Flentje, S.B.J. Dietary fibre content of Australian foods. 3. Fruits and fruit products. Food Aust. 1990, 42, 143–145. [Google Scholar]
- Quilot, B.; Kervella, J.; Génard, M. Shape, mass and dry matter content of peaches of varieties with different domestication levels. Sci. Hortic. (Amsterdam) 2004, 99. [Google Scholar] [CrossRef]
- Lintas, C.; Cappelloni, M. Dietary fiber content of italian fruit and nuts. J. Food Compos. Anal. 1992, 5, 146–151. [Google Scholar] [CrossRef]
- Englyst, H.N.; Bingham, S.A.; Runswick, S.A.; Collinson, E.; Cummings, J.H. Dietary fibre (non-starch polysaccharides) in fruit, vegetables and nuts. J. Hum. Nutr. Diet. 1988, 1, 247–286. [Google Scholar] [CrossRef]
- Gil, M.I.; Tomás-Barberán, F.A.; Hess-Pierce, B.; Kader, A.A. Antioxidant capacities, phenolic compounds, carotenoids, and vitamin C contents of nectarine, peach, and plum cultivars from California. J. Agric. Food Chem. 2002, 50, 4976–4982. [Google Scholar] [CrossRef]
- Wu, B.; Quilot, B.; Kervella, J.; Génard, M.; Li, S. Analysis of genotypic variation of sugar and acid contents in peaches and nectarines through the Principle Component Analysis. Euphytica 2003, 132. [Google Scholar] [CrossRef]
- Peiris, K.H.S.; Dull, G.G.; Leffler, R.G.; Kays, S.J. Spatial variability of soluble solids or dry-matter content within individual fruits, bulbs, or tubers: Implications for the development and use of NIR spectrometric techniques. HortScience 1999, 34. [Google Scholar] [CrossRef] [Green Version]
- Kobashi, K.; Gemma, H.; Iwahori, S. Abscisic acid content and sugar metabolism of peaches grown under water stress. J. Am. Soc. Hortic. Sci. 2000, 125, 425–428. [Google Scholar] [CrossRef]
- Naor, A. Irrigation Scheduling and Evaluation of Tree Water Status in Deciduous Orchards. In Horticultural Reviews; John Wiley & Sons, Inc.: Hoboken, NJ, USA, 2006; pp. 111–166. ISBN 9780470767986. [Google Scholar]
- Mills, T.M.; Behboudian, M.H.; Tan, P.Y.; Clothier, B.E. Plant water status and fruit quality in Braeburn’ apples. HortScience 1994, 29. [Google Scholar] [CrossRef] [Green Version]
- Kilili, A.W.; Behboudian, M.H.; Mills, T.M. Composition and quality of ‘Braeburn’ apples under reduced irrigation. Sci. Hortic. (Amsterdam) 1996, 67. [Google Scholar] [CrossRef]
- Mpelasoka, B.S.; Behboudian, M.H.; Green, S.R. Water use, yield and fruit quality of lysimeter-grown apple trees: Responses to deficit irrigation and to crop load. Irrig. Sci. 2001, 20. [Google Scholar] [CrossRef]
- Ruiz, D.; Egea, J. Phenotypic diversity and relationships of fruit quality traits in apricot (Prunus armeniaca L.) germplasm. Euphytica 2008, 163, 143–158. [Google Scholar] [CrossRef]
- Socquet-Juglard, D.; Christen, D.; Devènes, G.; Gessler, C.; Duffy, B.; Patocchi, A. Mapping Architectural, Phenological, and Fruit Quality QTLs in Apricot. Plant Mol. Biol. Report. 2013, 31. [Google Scholar] [CrossRef]
- Escribano, S.; Biasi, W.V.; Lerud, R.; Slaughter, D.C.; Mitcham, E.J. Non-destructive prediction of soluble solids and dry matter content using NIR spectroscopy and its relationship with sensory quality in sweet cherries. Postharvest Biol. Technol. 2017. [Google Scholar] [CrossRef]
- Donis-González, I.R.; Valero, C.; Momin, M.A.; Kaur, A.; Slaughter, D.C. Performance evaluation of two commercially available portable spectrometers to non-invasively determine table grape and peach quality attributes. Agronomy 2020, 10, 148. [Google Scholar] [CrossRef] [Green Version]
- Azodanlou, R.; Darbellay, C.; Luisier, J.L.; Villettaz, J.C.; Amadò, R. Development of a model for quality assessment of tomatoes and apricots. LWT Food Sci. Technol. 2003, 36, 223–233. [Google Scholar] [CrossRef]
- Iglesias, I.; Echeverría, G. Differential effect of cultivar and harvest date on nectarine colour, quality and consumer acceptance. Sci. Hortic. (Amsterdam) 2009, 120, 41–50. [Google Scholar] [CrossRef]
- O’Connell, M.; Stefanelli, D. Effect of crop load management and canopy architecture on yield and fruit quality of late-season plum ‘Angeleno’. Acta Hortic. 2020, 1281, 227–233. [Google Scholar] [CrossRef]
- O’Connell, M.; Stefanelli, D. Effects of rootstock and crop load management on yield and fruit quality of early-season nectarine ‘Rose Bright’ and late-season peach ‘September Sun’. Acta Hortic. 2020, 1281, 121–129. [Google Scholar] [CrossRef]
- O’Connell, M.G.; Scalisi, A. Sensing fruit and tree performance under deficit irrigation in ‘September Bright’ nectarine. Acta Hortic. accepted.
Figure 1.
Fruit equatorial diameter (FD) in fourteen stone fruit cultivars at harvest (n = 200). Different letters represent significant differences determined with analysis of variance followed by Tukey’s pairwise comparison (p < 0.05).
Figure 1.
Fruit equatorial diameter (FD) in fourteen stone fruit cultivars at harvest (n = 200). Different letters represent significant differences determined with analysis of variance followed by Tukey’s pairwise comparison (p < 0.05).

Figure 2.
Soluble solids concentration (SSC) and dry matter concentration (DMC) in fourteen stone fruit cultivars (NCT = nectarine; YLP = yellow peach; WHP = white peach; APR = apricot; JPL = Japanese plum) at harvest (n = 200). Boxplots display interquartile range boxes (1st to 3rd quartile) with means (black triangles), medians (vertical lines), highest and lowest observations (whiskers) and outliers (dots). Asterisks (*) represent significant differences between SSC and DMC means based on Student’s t-test (p < 0.05). Section signs (§) represent significant differences between SSC and DMC standard deviations based on Levene’s test (p < 0.05).

Figure 3.
Scatter plot and linear regression best-fit model (black line) of fruit dry matter concentration (DMC) against soluble solids concentration (SSC) for the pooled dataset of apricot, plum, nectarine, white and yellow peach cultivars at harvest (p < 0.001, R2 = 0.914, N = 2800). Slope and intercept standard errors (SE) reported in brackets. The grey dashed line shows a reference DMC = SSC linear fit with intercept = 0 and slope = 1. Root mean square errors (RMSE) reported for the best-fit and DMC = SSC models.

Figure 4.
Scatter plots and linear regression best-fits (black lines; see Table 1) of fruit dry matter concentration (DMC) against soluble solids concentration (SSC) in fourteen stone fruit cultivars at harvest (n = 200). Grey dashed lines represent reference DMC = SSC linear fits, with intercept = 0 and slope = 1.


Table 1.
Linear regression models for dry matter concentration (DMC) against soluble solids concentration (SSC) in fourteen stone fruit cultivars (n = 200) at harvest. Slope and intercept with relative standard errors (SE) and linear regression coefficient of determination (R2) reported. Analysis of variance (ANOVA) p-values reported for the comparison of slopes and intercepts between the best-fit models and a reference DMC = SSC model with slope = 1 and intercept = 0. Underlined values for R2 < 0.75, RMSE > 1.00 or p-values > 0.05. Root mean square errors (RMSE) for the best-fit and for the DMC = SSC models, and their difference (ΔRMSE) reported.
| Crop | Cultivar | Best-Fit Linear Regression Coefficients | R2 | ANOVA | RMSE for Best-Fit Model | RMSE for DMC = SSC Model | ΔRMSE | ||||
|---|---|---|---|---|---|---|---|---|---|---|---|
| Intercept | Intercept SE | Slope | Slope SE | Intercept (p) | Slope (p) | ||||||
| Nectarine | ‘August Bright’ | 1.92 | 0.31 | 0.87 | 0.02 | 0.899 | <0.05 | <0.05 | 0.747 | 0.829 | 0.082 |
| ‘Autumn Bright’ | 0.19 | 0.18 | 0.99 | 0.02 | 0.952 | 0.305 | 0.527 | 0.377 | 0.385 | 0.008 | |
| ‘Rose Bright’ | 2.09 | 0.29 | 0.85 | 0.02 | 0.888 | <0.05 | <0.05 | 0.710 | 0.798 | 0.088 | |
| ‘September Bright’ | 0.25 | 1.03 | 0.02 | 0.952 | 0.050 | 0.061 | 0.502 | 0.507 | 0.005 | ||
| Yellow peach | ‘August Flame’ | 2.25 | 0.31 | 0.81 | 0.02 | 0.862 | <0.05 | <0.05 | 0.726 | 0.918 | 0.192 |
| ‘O’Henry’ | 2.58 | 0.35 | 0.82 | 0.02 | 0.868 | <0.05 | <0.05 | 0.748 | 0.854 | 0.106 | |
| ‘Redhaven’ | 1.25 | 0.39 | 0.88 | 0.03 | 0.778 | <0.05 | <0.05 | 0.621 | 0.657 | 0.036 | |
| ‘September Sun’ | 1.18 | 0.25 | 0.95 | 0.02 | 0.933 | <0.05 | <0.05 | 0.567 | 0.818 | 0.251 | |
| White peach | ‘Ice Princess’ | 1.28 | 0.29 | 0.91 | 0.02 | 0.900 | <0.05 | <0.05 | 0.746 | 0.782 | 0.036 |
| ‘Snow Fall’ | 1.16 | 0.43 | 0.98 | 0.02 | 0.894 | <0.05 | 0.351 | 0.642 | 0.998 | 0.356 | |
| ‘Snow Flame 23’ | 1.93 | 0.31 | 0.88 | 0.02 | 0.900 | <0.05 | <0.05 | 0.684 | 0.752 | 0.068 | |
| ‘Snow Flame 25’ | 3.04 | 0.41 | 0.81 | 0.03 | 0.835 | <0.05 | <0.05 | 0.638 | 0.720 | 0.082 | |
| Apricot | ‘Golden May’ | 5.72 | 0.32 | 0.55 | 0.03 | 0.699 | <0.05 | <0.05 | 1.328 | 2.144 | 0.816 |
| Plum | ‘Angeleno’ | 0.46 | 0.40 | 0.96 | 0.02 | 0.918 | 0.254 | 0.074 | 0.388 | 0.470 | 0.082 |
Publisher’s Note: MDPI stays neutral with regard to jurisdictional claims in published maps and institutional affiliations. |
© 2021 by the authors. Licensee MDPI, Basel, Switzerland. This article is an open access article distributed under the terms and conditions of the Creative Commons Attribution (CC BY) license (http://creativecommons.org/licenses/by/4.0/).
Share and Cite
MDPI and ACS Style
Scalisi, A.; O’Connell, M.G. Relationships between Soluble Solids and Dry Matter in the Flesh of Stone Fruit at Harvest. Analytica 2021, 2, 14-24. https://0-doi-org.brum.beds.ac.uk/10.3390/analytica2010002
AMA Style
Scalisi A, O’Connell MG. Relationships between Soluble Solids and Dry Matter in the Flesh of Stone Fruit at Harvest. Analytica. 2021; 2(1):14-24. https://0-doi-org.brum.beds.ac.uk/10.3390/analytica2010002
Chicago/Turabian StyleScalisi, Alessio, and Mark Glenn O’Connell. 2021. "Relationships between Soluble Solids and Dry Matter in the Flesh of Stone Fruit at Harvest" Analytica 2, no. 1: 14-24. https://0-doi-org.brum.beds.ac.uk/10.3390/analytica2010002