Proceeding Paper

Microkinetic Modeling of the Water-Gas Shift Reaction over Cobalt Catalysts Supported on Multi-Walled Carbon Nanotubes †

by
Fabio Machado Cavalcanti
1,2,*,
Jeroen Poissonnier
2,
Tom Vandevyvere
2,3,
Reinaldo Giudici
1,
Rita Maria Brito Alves
1,
Martin Schmal
1 and
Joris W. Thybaut
2
1
LaPCat–Laboratório de Pesquisa e Inovação em Processos Catalíticos, Department of Chemical Engineering, Escola Politécnica, Universidade de São Paulo, Av. Prof. Luciano Gualberto, Travessa 3, No. 380, São Paulo/SP 05508-010, Brazil
2
Laboratory for Chemical Technology, Ghent University, Technologiepark 125, B-9052 Gent, Belgium
3
Industrial Catalysis and Adsorption Technology, Ghent University, Valentin Vaerwyckweg 1, 9000 Ghent, Belgium
*
Author to whom correspondence should be addressed.
Presented at the 1st International Electronic Conference on Catalysis Sciences, 10–30 November 2020; Available online: https://eccs2020.sciforum.net.
Published: 9 November 2020
(This article belongs to the Proceedings of The 1st International Electronic Conference on Catalysis Sciences)

Abstract

:
The development of microkinetic models allows gaining an understanding of fundamental catalyst surface phenomena in terms of elementary reaction steps without a priori defining a rate-determining step, yielding more meaningful and physically reliable reaction rates. This work aimed at developing such a microkinetic model that accurately describes the Water-Gas Shift (WGS) reaction, i.e., one of the major routes for hydrogen production, over cobalt (Co) catalysts supported on multi-walled carbon nanotubes (MWCNTs). Co is known for its sulfur-tolerance and the functionalized MWCNT support has exceptional conductivity properties and defects that facilitate electron transfer on its surface. The model was formulated based on a well-known mechanism for the WGS reaction involving the highly reactive carboxyl (COOH*) intermediate. The kinetic parameters were computed by a combination of calculation via theoretical prediction models (such as the Collision and Transition-State theory) and via regression to the experimental data. The derived system of differential-algebraic equations was solved using the DDAPLUS package available in the Athena VISUAL Studio. The developed model was capable of simulating the experimental data (R² = 0.96), presenting statistically significant kinetic parameters. Furthermore, some of the catalyst descriptors in the model have been related to the catalyst properties as determined by characterization techniques, such as the specific surface area (SP = 22,000 m²/kgcat) and the density of active sites (σ = 0.012 molAct.Surf./kgcat). The modelling and characterization efforts allowed identifying the COOH* formation reaction (CO* + OH* → COOH* + *) as the surface reaction with the highest activation energy. Optimal catalyst performance, resulting in a CO conversion exceeding 85%, was simulated at elevated temperatures (350–450 °C) and space times (70–80 kg·s/mol), in agreement with the experimental observations.

1. Introduction

For most catalytic reactor designs, macrokinetic models are used to describe the reaction. Rates are then generally represented in terms of power-law expressions or Langmuir-Hinshelwood models. However, such models are limited to specific catalysts and provide little information for catalyst design. The development of microkinetic models, on the other hand, allows the gaining of an understanding of fundamental catalyst surface phenomena in terms of elementary reaction steps, yielding more accurate reaction rates [1].
This methodology takes the physical and chemical catalyst properties into account as part of the model formulation. The corresponding parameters, referred to as catalyst descriptors, can, ideally speaking, be computed from theoretical chemistry or experimentally measured, thus assisting in the search of new or improved catalysts for a particular process [2]. Some of these descriptors are the density of active sites, σ [molAct.Surf. mcat–2], which provides the number of available active sites on the catalyst surface, where the elementary steps of the reaction mechanism take place [3], and the specific surface area, SP [m² kgcat–1], which quantifies the potential for interaction between gas molecules and the catalyst surface through adsorption–desorption steps [4].
Therefore, this work aimed at developing a microkinetic model that best describes the Water-Gas Shift (WGS) reaction, i.e., one of the major routes for hydrogen production—a clean valuable energy source—over cobalt (Co) catalysts supported on multi-walled carbon nanotubes (MWCNTs). Co is known for its sulfur-tolerance and the functionalized MWCNT support has exceptional conductivity properties and defects that facilitate electron transfer on its surface [5]. In addition, the employed catalyst has ceria and strontium nanoparticles impregnated on its surface, which provide promoting effects on its activity [5].

2. Methodology

The microkinetic methodology is based on the elementary steps that constitute the reaction mechanism without considering, in principle, a rate-determining step. Although it is computationally intensive, such a detailed description of the reaction chemistry allows understanding the fundamental catalyst surface phenomena taking place, justifying the additional (computational) effort. In this study, we formulated the microkinetic model based on a well-known mechanism for the WGS reaction involving a highly reactive surface intermediate—the carboxyl (COOH*), according to the following elementary steps in Table 1 [6].
In Table 1, * represents the free active sites and X* the adsorbed species on the catalyst surface (intermediates). The adsorption/desorption steps are labeled as 1, −1, 2, −2, 6, −6, 7, and −7; while the surface reaction ones are labeled as 3, −3, 4, −4, 5, and −5. In this microkinetic methodology, apart from the set of ordinary differential equations describing the mass balance of each bulk species (Equation (1)), the pseudo-steady state approximation for the intermediates (Equation (2)), and the mass balance of the active sites (Equation (3)) were also taken into account [7]:
d F i d W = R i   with     F i = F i , i n l e t   at   W = 0
R i n t e r m e d i a t e = 0
C t o t a l = C * + C i n t e r m e d i a t e
Fi is the molar flow rate of component i (µmol min–1), W the catalyst mass (g), Ri the net production rate of component i (µmol g–1 min–1), Rintermediate the net production rate of each intermediate (µmol g–1 min–1), Ctotal the total active site concentration (mol g–1), C* the free active site concentration (mol g–1), and Cintermediate the occupied active site concentration (mol g–1). The resulting system of differential-algebraic equations (DAEs) (1)–(3) was solved using the DDAPLUS package, and the regression made by the GREGPLUS package, both as available in Athena VISUAL Studio. The kinetic data used for the model adjustment were collected from 60 experiments carried out in an automated catalytic activity test unity (Microactivity-Effi from PID ENG&TECH–micromeritics®), varying the temperature, feed composition, and space velocity.
The microkinetic modeling uses kinetic parameters that exhibit a clear physicochemical meaning. As the model has a large set of adjustable parameters (a total of 28), only a subset of them could be estimated from the kinetic data without compromising the accuracy. Therefore, the others were calculated using theoretical prediction models, such as the Collision Theory and Transition-State Theory, respectively and kept fixed during the regression [8]:
k i 0 = S P σ 1 2 π M R T
k i 0 = N A S P k B T h Q A B Q A * Q B *
ki0 is the pre-exponential factor for adsorption (Pa–1 s–1), reaction (kg mol–1 s–1), or desorption (s–1), SP is the catalyst specific surface area (m2 kgcat–1), σ the active site density (molAct.Surf. kgcat–1), M the molar mass of the gas species (kg mol–1), NA the Avogadro constant (mol–1), kB the Boltzmann constant (J K–1), h the Planck constant (J s), and Qi” the molecular partition function of the involved species i (m–2).
In other words, these theories were used to complement the available information presented in the experimental data, which was not sufficient to estimate all rate coefficients [9]. In addition, in order to further reduce the number of estimated parameters, beyond the theoretical calculations, some of the activation energy values were obtained from other modeling efforts performed on a similar catalyst [8].
The catalyst descriptors (Sp and σ) used in those expressions were experimentally determined from characterization techniques. The catalyst-specific surface area was acquired from N2 physisorption isotherms (NOVA 1200e Surface Area and Pore Size Analyzer, from Quantachrome Instruments), using the BET method: S P = 22 , 000   m 2 kg cat 1 . While the catalyst active site density was computed from CO pulse chemisorption measurements (Autochem II, from micromeritics®) assuming an equimolar stoichiometry of CO-cobalt: σ = 0.012   mol Act . Surf .   kg cat 1 .
In addition, energetic consistency is ensured in the model, by expressing that the appropriate sum of the activation energies for all elementary steps must be equal to the overall standard enthalpy of the WGS reaction [1,8]:
j ν j E j , f o r j ν j E j , r e v = Δ H W G S 0 = 41   kJ   mol 1
νj is the stoichiometry number of the elementary steps in the reaction mechanism, Ej the activation energy of the forward (for), and reverse (rev) steps (kJ mol–1), and Δ H W G S 0 the standard enthalpy of the WGS reaction (kJ mol–1).

3. Results and Discussion

The estimated kinetic parameter values with their corresponding confidence intervals are presented in Table 1. As can be noted, five parameters were estimated from the collected kinetic data (all statistically significant), while the other 23 were determined a priori as discussed above. The main challenge in the parameter estimation was to find and tune the balance between the amount of information available in the kinetic data and the degree of detail retained in the model.
In 
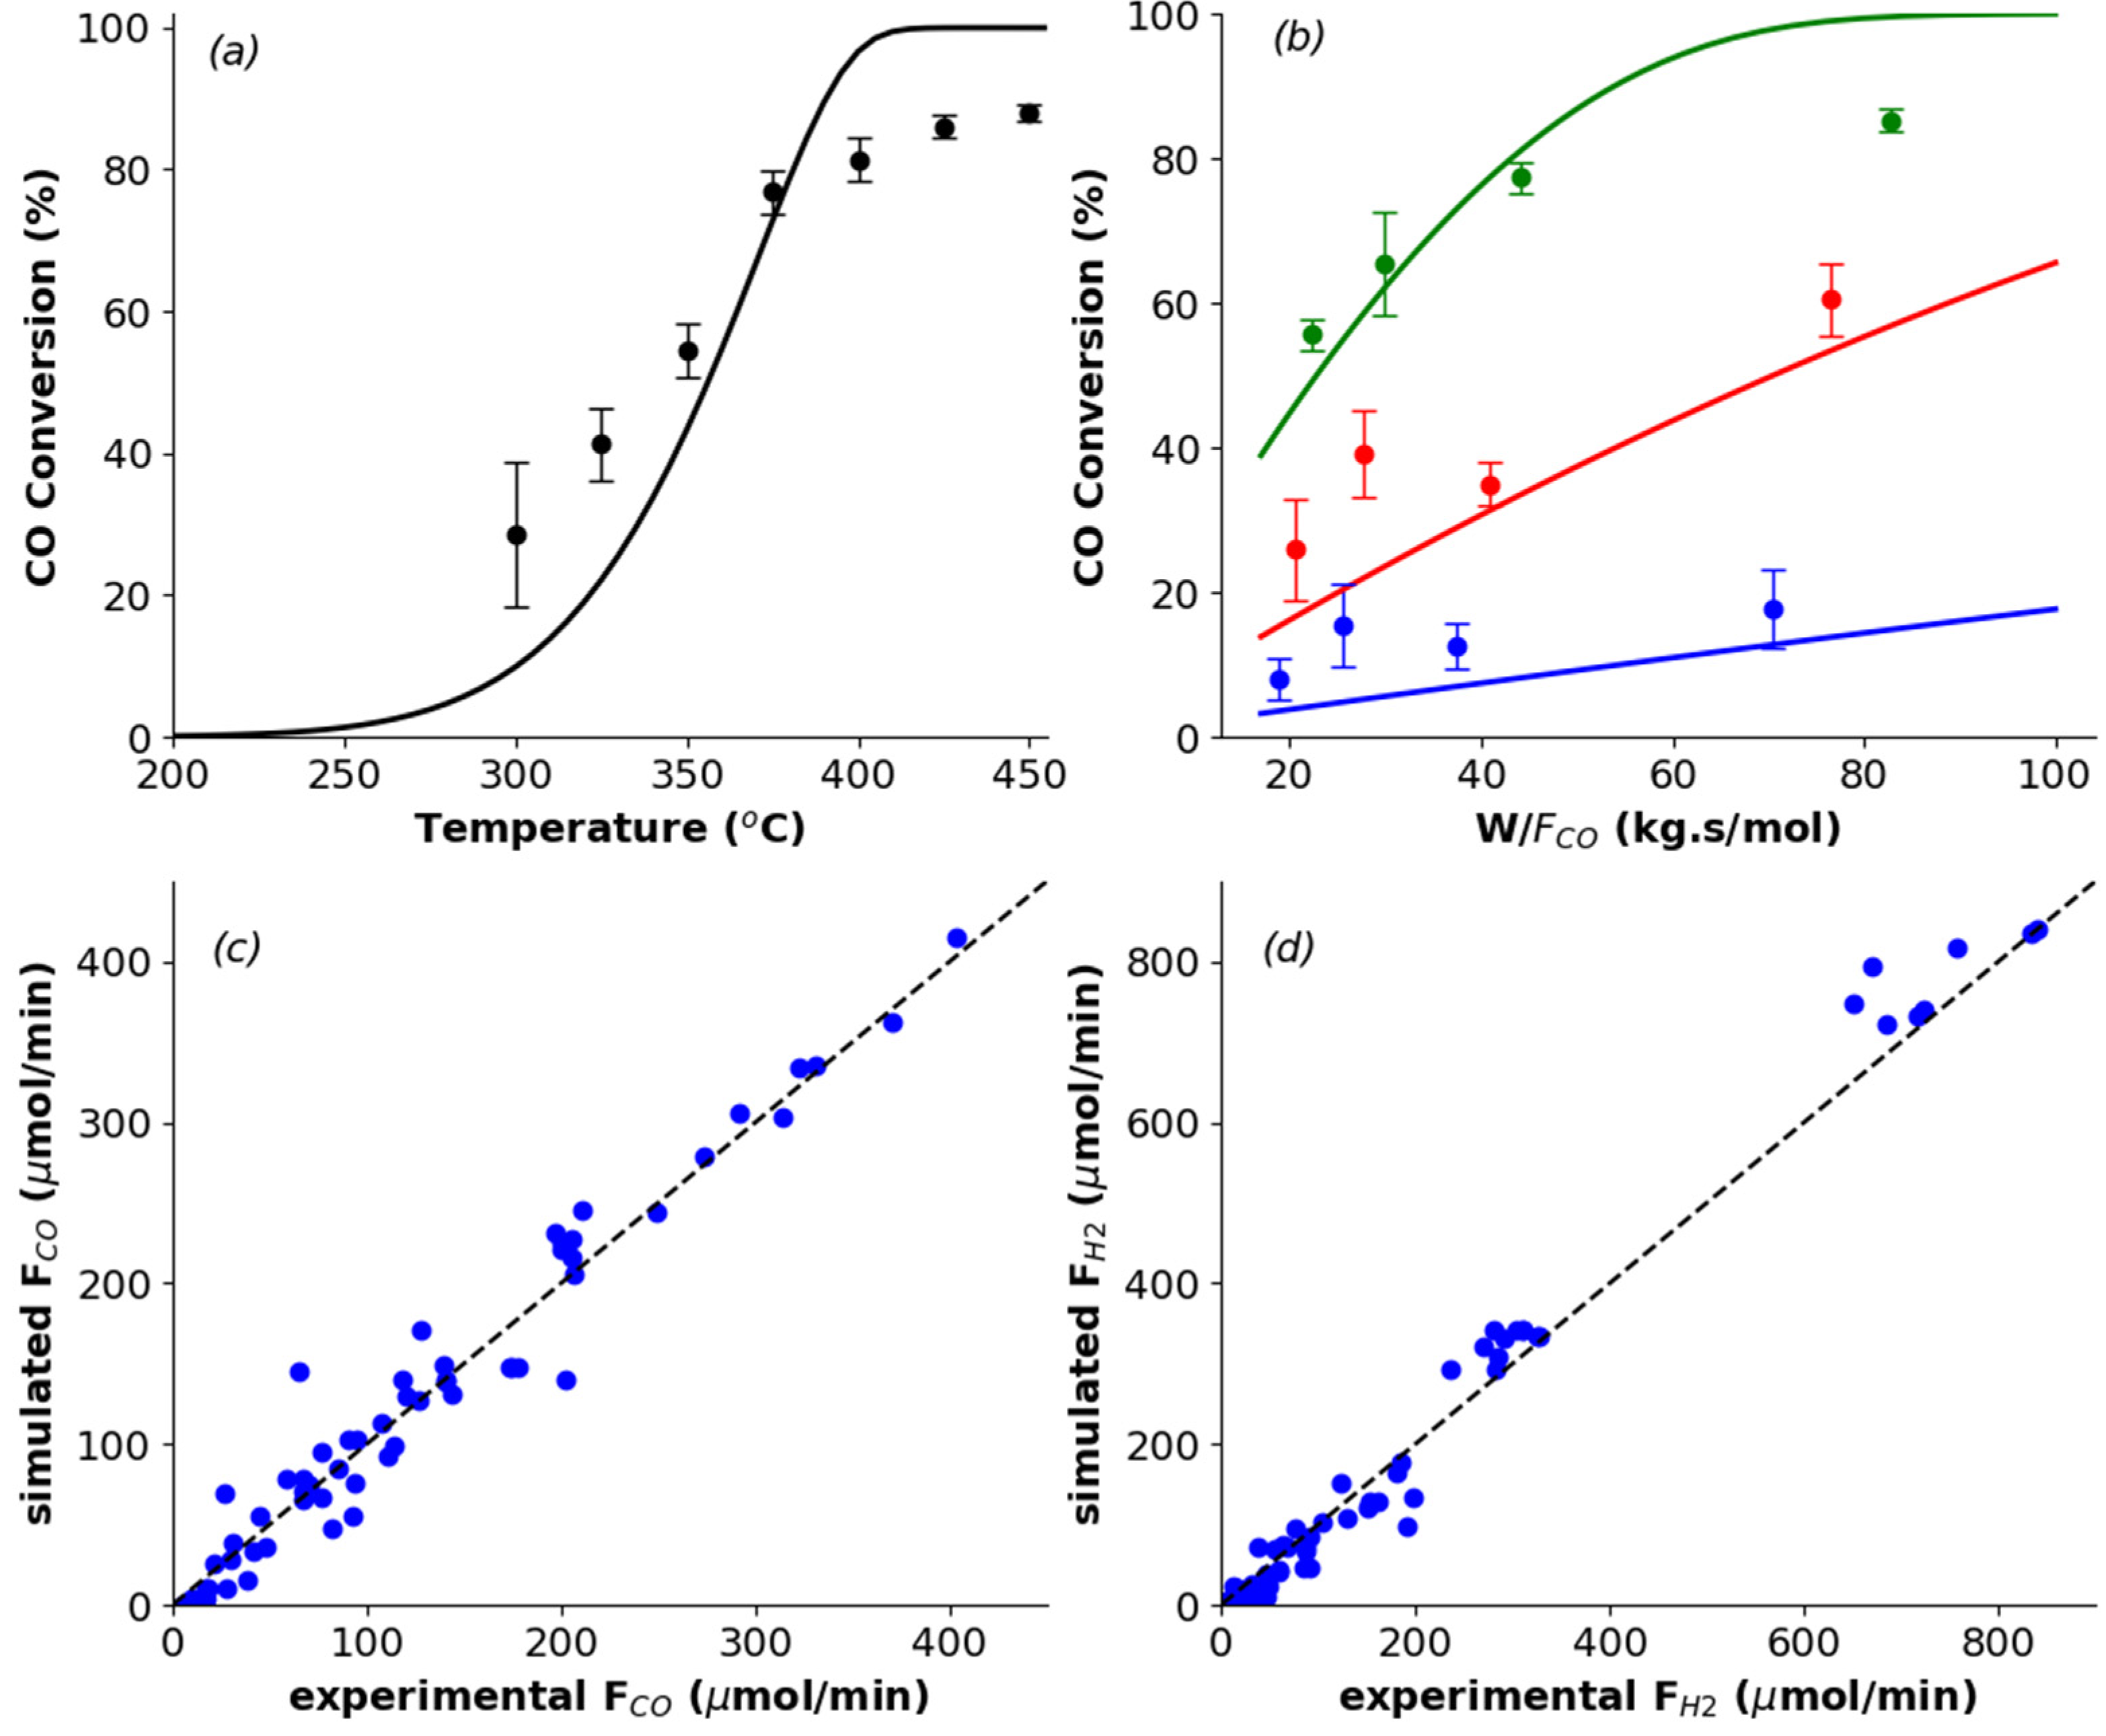
Figure 1, the performance curves and the parity plots are presented, showing that the microkinetic model seems to reasonably describe the behavior of the experimental data, with the catalyst presenting an optimal performance (XCO = 85–95%) at elevated temperatures (350–450 °C) and space times (70−80 kg s mol–1). As expected, the higher the temperature and space velocity, the greater the CO conversion.
This appropriate agreement between observed and predicted values is also confirmed by the R2 value of 0.96, and the F-test for verifying the global significance of the regression: Fcalc = 103 (>Ftab = 4). Furthermore, the experimental points show a good distribution along the 45o line in the parity plots, being more symmetrical for CO. However, model simulated data at temperatures above 400 °C are exceeding the equilibrium conversion, hence indicating where the discrepancy between experimental and model simulated data originates from. This may be overcome by considering the calculation of the reverse reaction rate coefficients, not by using the Collision and Transition-State theories, but rather by enforcing thermodynamic equilibrium for each elementary step (Kj = kj,for/kj,rev), which involves the knowledge of the standard Gibbs energy of all the intermediate species presented in the mechanism [10]. In this way, together with the energetic constraint in Equation 6, the overall thermodynamic consistency would be guaranteed. In addition, for the CO conversion as a function of space time graphs, the higher the temperature, the better seems the adjustment for lower W/FCO values. Thus, the model seems to work well in high temperature regions, but far from equilibrium and with small space times, potentially indicating that chemical kinetics are no longer dominating at this point and effects of heat and mass transfer are present.
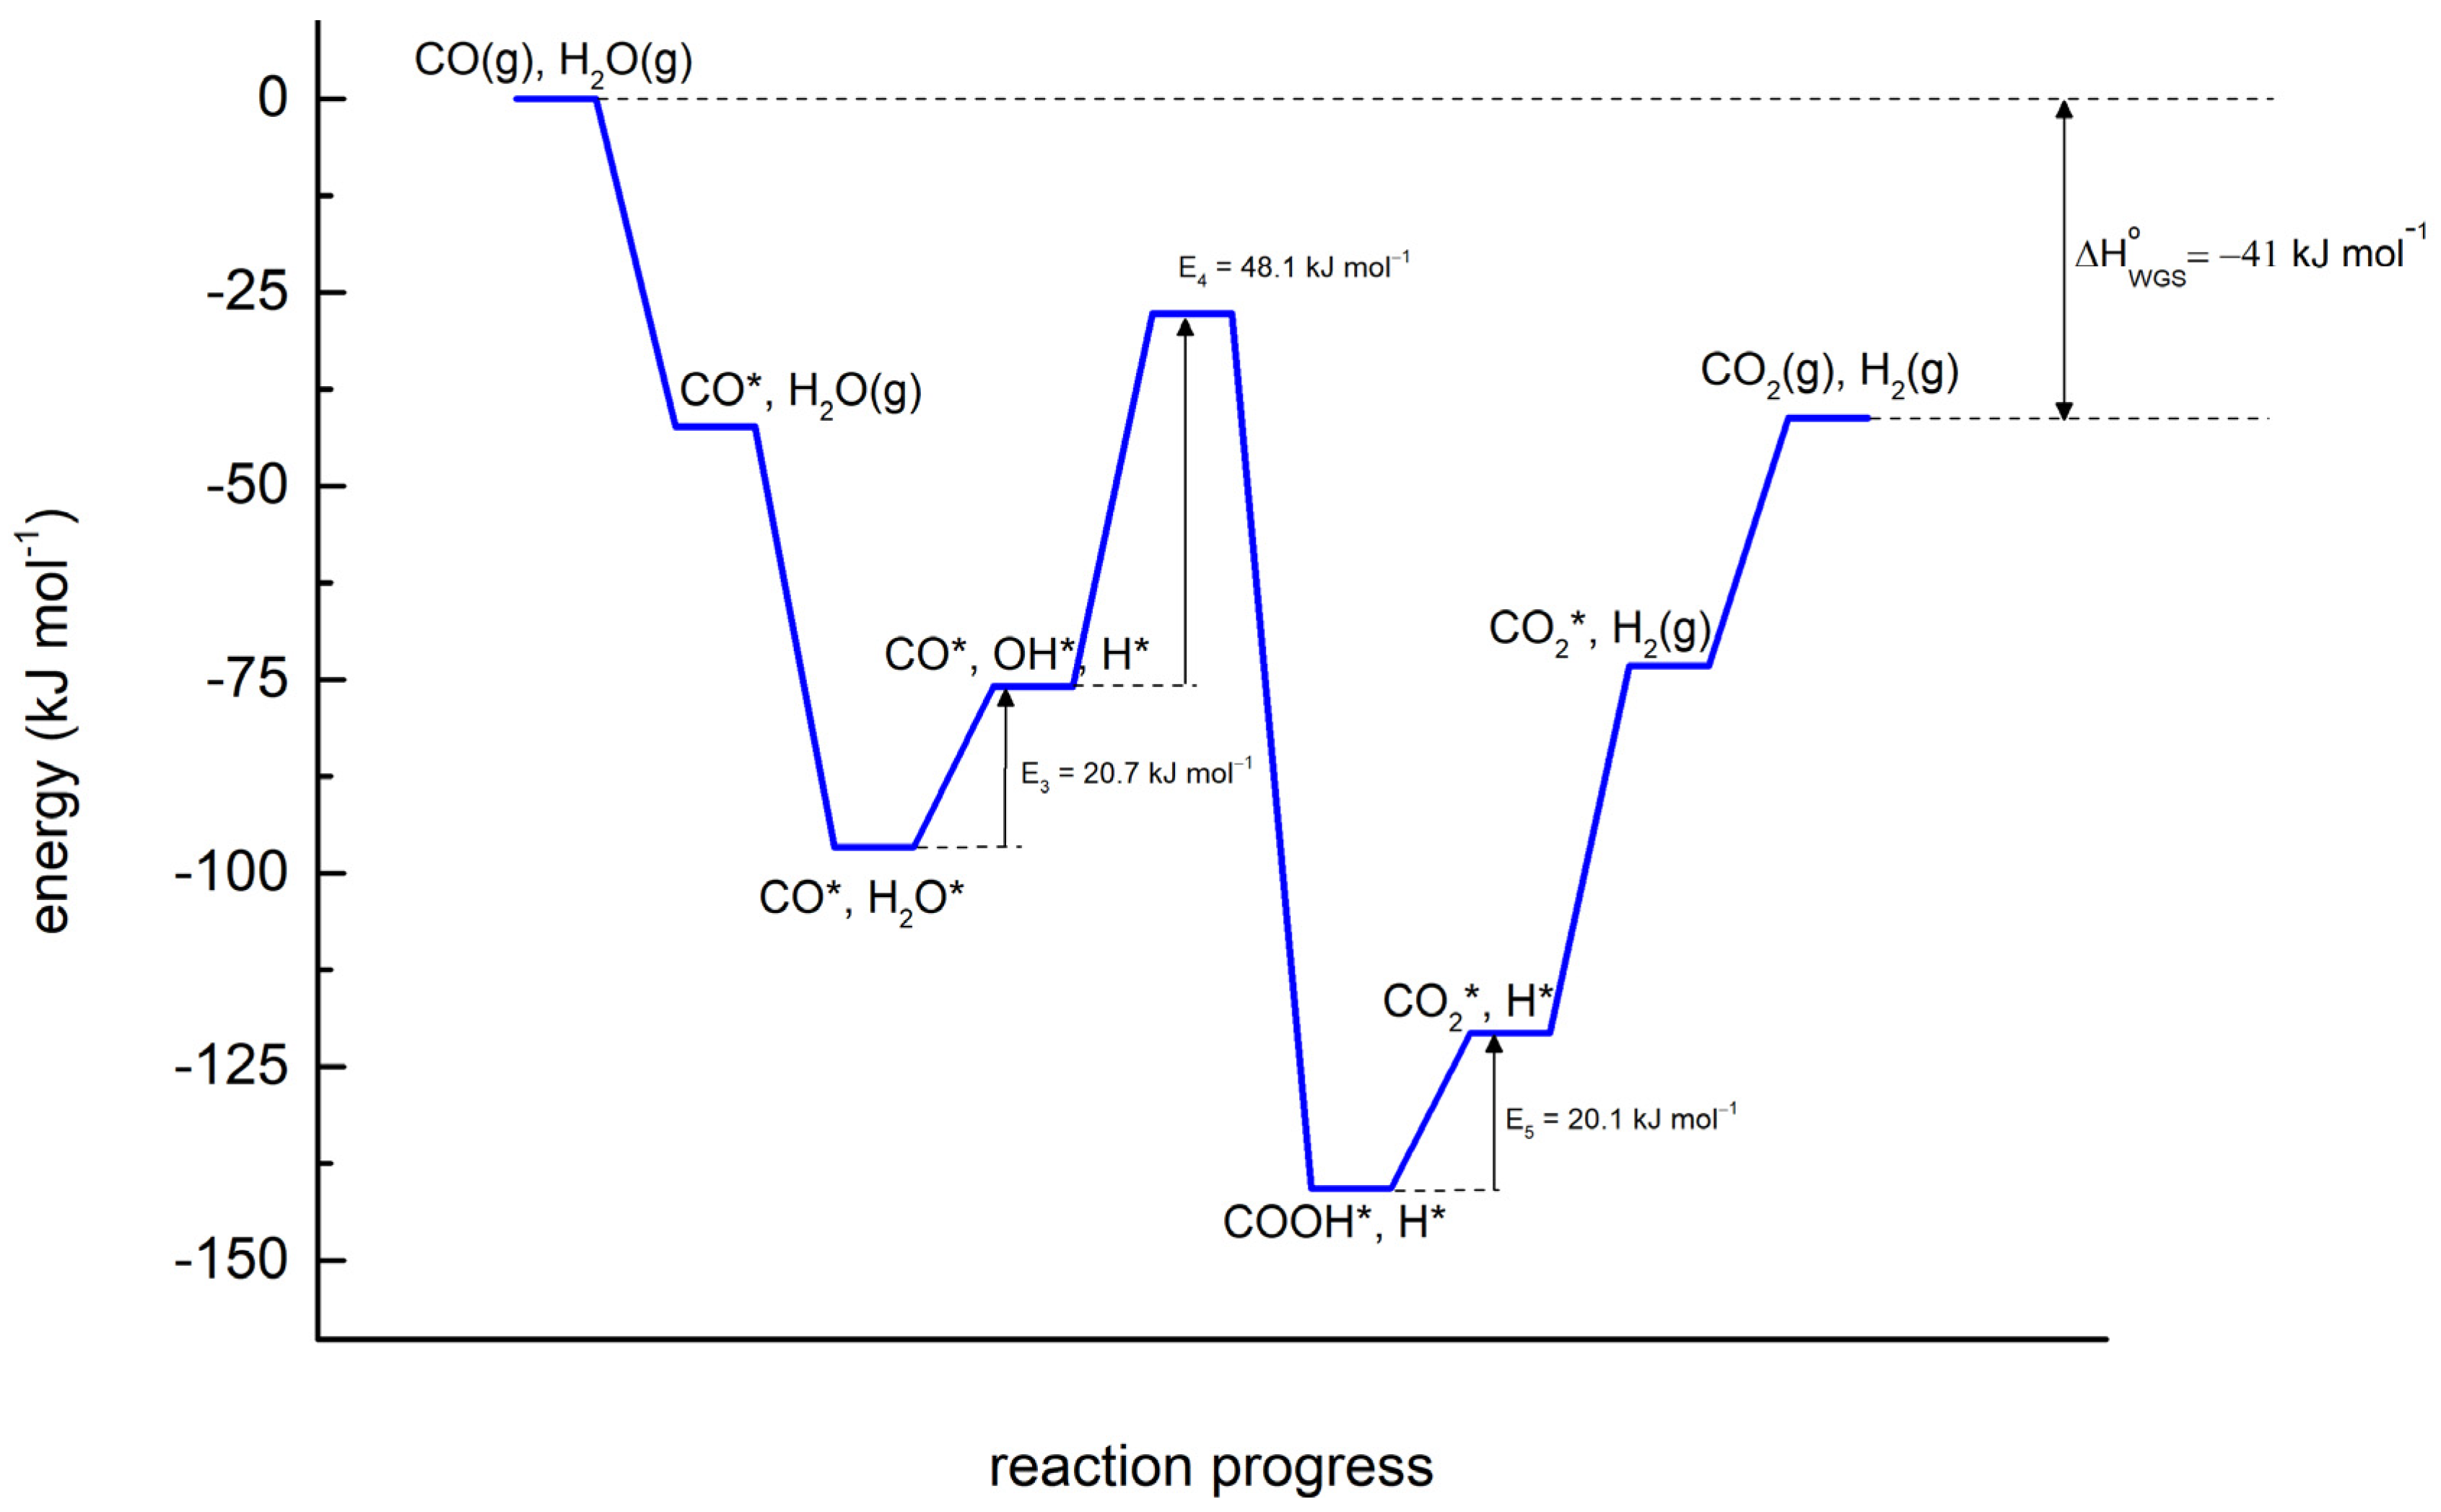
Furthermore, the COOH* formation reaction (CO* + OH* → COOH* + *) has the highest activation energy of all surface reactions, as can be observed in the energy diagram (Figure 2) constructed with the activation energies in Table 1. Since ko values are almost the same in all reactions, it can be inferred with the Arrhenius law ( k j = k o , j exp ( E a , j / R T )) that the higher the activation energy, the lower the rate coefficient. Therefore, reaction #4 can be considered the rate-determining step for the WGS reaction over the Co/MWCNT catalyst, as its rate has the greatest sensitivity with temperature variation. In addition, the partial equilibrium ratio (= rj,for/rj,for + rj,rev) for this elementary reaction (with a value of 0.99, greater than 0.5) proves that it is forward favorable, and the conclusion above can be actually supported. Finally, in the diagram, the thermodynamic constraint incorporated into the model (Equation 6) can be observed by the energy difference between the reactants and the products, being equal to Δ H W G S 0 = 41   kJ   mol 1 [10].

4. Conclusions

The development of this microkinetic model allowed the determination of more detailed kinetics for the WGS reaction over the Co/MWCNT catalyst, considering catalyst surface properties, such as its specific surface area and its density of active sites. The incorporation of these catalyst descriptors into this model confirms that the COOH* formation reaction (CO* + OH* → COOH* + *) is the rate-determining step and allows describing the optimal catalyst performance at elevated temperatures (350–450 °C) and space times (70–80 kg·s/mol), as indicated by the experimental results. Therefore, it is a robust procedure for predicting reaction performance based on intrinsic catalyst properties, thus assisting in future catalyst design and optimization research.

Author Contributions

Conceptualization, R.G., R.M.B.A., M.S. and J.W.T.; data curation, F.M.C., J.P., and T.V.; formal analysis, F.M.C. and J.P.; investigation, F.M.C., J.P., and T.V.; methodology, J.P., T.V., R.G., R.M.B.A., M.S., and J.W.T.; project administration/funding acquisition, R.G., R.M.B.A., M.S., and J.W.T.; supervision, J.P., R.G., R.M.B.A., M.S., and J.W.T.; validation, F.M.C. and J.P.; writing—original draft preparation, F.M.C.; writing—review and editing, F.M.C., J.P., and J.W.T.; visualization, T.V., R.G., R.M.B.A., and M.S. All authors have read and agreed to the published version of the manuscript.

Funding

We gratefully acknowledge support of the RCGI–Research Centre for Gas Innovation, hosted by the University of São Paulo (USP) and sponsored by FAPESP–São Paulo Research Foundation (2014/50279-4) and Shell Brasil. Furthermore, the authors acknowledge the financial support provided by FAPESP for the doctoral scholarship of F.M.C. (Grant #2017/11940-5 and Grant #2019/09766-2). T.V. acknowledges financial support from a doctoral fellowship (1SA7520N) from the Research-Foundation Flanders (FWO).

Conflicts of Interest

The authors declare no conflict of interest. The funders had no role in the design of the study; in the collection, analyses, or interpretation of data; in the writing of the manuscript, or in the decision to publish the results.

References

  1. Dumesic, J.A.; Rudd, D.F.; Aparicio, L.M.; Rekoske, J.E.; Treviño, A.A. The Microkinetics of Heterogeneous Catalysis, 1st ed.; American Chemical Society: Washington, DC, USA, 1993; ISBN 0-8412-2214-2. [Google Scholar]
  2. Thybaut, J.W.; Sun, J.; Olivier, L.; Van Veen, A.C.; Mirodatos, C.; Marin, G.B. Catalyst design based on microkinetic models: Oxidative coupling of methane. Catal. Today 2011, 159, 29–36. [Google Scholar] [CrossRef]
  3. Sun, J.; Thybaut, J.W.; Marin, G.B. Microkinetics of methane oxidative coupling. Catal. Today 2008, 137, 90–102. [Google Scholar] [CrossRef]
  4. Schmal, M. Heterogeneous Catalysis and Its Industrial Applications, 1st ed.; Springer: Basel, Switzerland, 2016; ISBN 978-3-319-09249-2. [Google Scholar]
  5. Figueira, C.E.; Moreira, P.F.; Giudici, R.; Alves, R.M.B.; Schmal, M. Nanoparticles of Ce, Sr, Co in and out the multi-walled carbon nanotubes applied for dry reforming of methane. Appl. Catal. A Gen. 2018, 550, 297–307. [Google Scholar] [CrossRef]
  6. Gokhale, A.A.; Dumesic, J.A.; Mavrikakis, M. On the mechanism of low-temperature water gas shift reaction on copper. J. Am. Chem. Soc. 2008, 130, 1402–1414. [Google Scholar] [CrossRef] [PubMed]
  7. Poissonnier, J.; Pelckmans, M.; Van Waes, F.; Moonen, K.; Sels, B.F.; Thybaut, J.W.; Marin, G.B. Kinetics of homogeneous and heterogeneous reactions in the reductive aminolysis of glucose with dimethylamine. Appl. Catal. B Environ. 2018, 227, 161–169. [Google Scholar] [CrossRef]
  8. Sprung, C.; Kechagiopoulos, P.N.; Thybaut, J.W.; Arstad, B.; Olsbye, U.; Marin, G.B. Microkinetic evaluation of normal and inverse kinetic isotope effects during methane steam reforming to synthesis gas over a Ni/NiAl2O4 model catalyst. Appl. Catal. A Gen. 2015, 492, 231–242. [Google Scholar] [CrossRef]
  9. Devocht, B.R.; Thybaut, J.W.; Kageyama, N.; Toch, K.; Oyama, S.T.; Marin, G.B. Balance between model detail and experimental information in steam methane reforming over a Ni/MgO-SiO2 catalyst. AIChE J. 2019, 65, 1222–1233. [Google Scholar] [CrossRef]
  10. De Carvalho, T.P.; Catapan, R.C.; Oliveira, A.A.M.; Vlachos, D.G. Microkinetic Modeling and Reduced Rate Expression of the Water-Gas Shift Reaction on Nickel. Ind. Eng. Chem. Res. 2018, 57, 10269–10280. [Google Scholar] [CrossRef]
Figure 1. Performance curves of CO conversion (a) as a function of temperature and (b) of space time. In them, points are experimental data, and lines represent the model predictions. Graph (a) was obtained with space time of 88 kg s mol−1; and, in graph (b), the blue line represents the reaction performed at 300 °C, the red at 350 °C, and the green at 400 °C. Moreover, parity plots of molar flow rates of (c) CO and (d) H2.
Chemproc 02 00011 g001
Figure 2. Energy diagram of the WGS reaction mechanism according to the values in Table 1.
Chemproc 02 00011 g002
Table 1. Reaction mechanism considered for the microkinetic model of the WGS over a Co catalyst supported on MWCNT with its parameter values (the estimated ones are shown in bold with the corresponding 95% confidence interval. The adsorption/desorption steps are labeled as 1, −1, 2, −2, 6, −6, 7, and −7; while the surface reaction ones are labeled as 3, −3, 4, −4, 5, and −5.
#Elementary Stepsk0 (min–1)Ea (kJ mol–1)
1CO + * → CO*4.62 × 10¹¹ atm–10
−1CO* → CO + *7.79 × 101442.3
2H2O + * → H2O *5.76 × 1011 atm–10
−2H2O * → H2O + *7.79 × 101454.3
3H2O* + * → OH* + H*6.57 × 10¹⁴ g µmol–120.7
−3OH* + H* → H2O* + *6.57 × 10¹⁴ g µmol–10
4CO* + OH* → COOH* + *6.57 × 10¹⁴ g µmol–148.1 ± 12.3
−4COOH* + * → CO* + OH*4.10 × 10¹⁴ g µmol–1112.9 ± 8.0
5COOH* + * → CO2* + H*9.03 × 10¹⁴ ± 4.02 × 10⁵ g µmol–120.1 *
−5CO2* + H* → COOH* + *6.57 × 10¹⁴ g µmol–10.01
62H* → H2 + 2*7.79 × 101447.4 ± 11.3
−6H2 + 2* → 2H*(3.86 ± 0.41) × 108 g µmol–1 atm–10
7CO2* → CO2 + *7.79 × 101432.0
−7CO2 + * → CO2*3.68 × 1011 atm–10
* thermodynamic consistency.
Publisher’s Note: MDPI stays neutral with regard to jurisdictional claims in published maps and institutional affiliations.

