Proceeding Paper

Smartphone-Based Optical Fiber Sensor for the Assessment of a Fed-Batch Bioreactor †

by
Marco César Prado Soares
*,
Thiago Destri Cabral
,
Pedro Machado Lazari
,
Matheus dos Santos Rodrigues
,
Gildo Santos Rodrigues
and
Eric Fujiwara
School of Mechanical Engineering, University of Campinas, São Paulo 13083-860, Brazil
*
Author to whom correspondence should be addressed.
Presented at the 7th Electronic Conference on Sensors and Applications, 15–30 November 2020; Available online: https://ecsa-7.sciforum.net/.
Published: 2 December 2020
(This article belongs to the Proceedings of 7th International Electronic Conference on Sensors and Applications)

Abstract

:
Industry is currently in a period of great expansion, the so-called “Industry 4.0”. This period relies on the development of new sensor technologies for the generation of systems capable of collecting, distributing, and delivering information. Particularly in chemical and biochemical industries, the development of portable monitoring devices can improve many process parameters, such as safety and productivity. In this work, the design of a smartphone-based optical fiber sensing platform for the online assessment of fed-batch fermentation systems is reported. The setup is comprised of a smartphone equipped with a 3D-printed case that couples optical fibers to the phone, and of an application for collecting images from the camera and then analyzing the pixel intensity. Finally, the obtained intensities are correlated to the broth refraction index, which is function of the sucrose concentration. We calculated the sensitivity of this sensor as 85.83 RIU−1 (refractive index units), and then compared its performance to results obtained with a handheld refractometer and with Monod model predictions. It showed to be a reliable, portable, and low-cost instrument for the online monitoring of bioreactors that can be easily reproducible on-site by simply printing it.

1. Introduction

Contemporary industry is in a period of great expansion. The so-called “Industry 4.0” applies novel mathematical and computer-based methods for the optimization and monitoring of systems, with social, economic, and environmental repercussions on the many human activities [1]. This new period relies on the development of new sensor technologies capable of collecting, distributing, and delivering information by themselves.
In chemical and biochemical industries, the increase on the data availability and on the portability of the monitoring devices has potential for enhancing safety; productivity; energy-use efficiency; environmental sustainability; product quality; and general process performance [2]. However, the analysis and evaluation of many chemical and biochemical agents (from pesticides to pharmacological drugs) is still based on high-performance liquid chromatography (HPLC); gas chromatography (GC); combined techniques like GC coupled to mass spectrometry (GC-MS); and enzyme-linked immunosorbent assay (ELISA). Such methods are sensitive, reliable, and precise, but demand expensive and bulky instrumentation; highly trained technicians; and procedures with long times of analysis. The use of compact and real-time sensors, on the other hand, allows the monitoring, control, and screening of the best process conditions [2,3,4]. Optical fiber sensors, in particular, are very attractive for chemical assessment. They present biocompatibility; immunity to electromagnetic interference; and the fibers demonstrate chemical and thermal stability [5]; as well as reduced manufacturing costs, making the devices suitable for mass-fabrication [4,6].
In this work, a smartphone-based optical fiber sensor was designed for the monitoring of fed-batch fermentation systems. The fed-batch mode was chosen for the study because most of the alcoholic fermentation industries in Brazil operate with this methodology [7]. The results were validated through comparison with a handheld refractometer and with the Monod mathematical model. It is worth mention that our platform is essentially different from other chemical and biochemical smartphone-based analytical tools already reported. Most of the previous works are based on electrochemical setups where the USB port of the phone is explored for the evaluation of the current in an external circuit [8,9]. The optical monitoring smartphone systems, in turn, are generally of high costs and complexity, and their interrogation is usually based on colorimetric analysis of the images captured by the camera [10]. For instance: a smartphone was coupled to a commercial enzymatic chromogenic-kit for detecting coliforms and bacteria in water [11]; and a colorimetric sensor was projected to analyze perfectly positioned spheroids of cells, but these spheroids had to be genetically modified for the emission of fluorescence (the physical parameter actually detected by the phone’s camera) [12].

2. Materials and Methods

2.1. Fermentation Monitoring and Modelling

The monitoring and control of a fermentation process is focused on the maintenance of the adequate conditions for the microorganisms, being based on the evaluation of the cells’ concentration X . Many of the traditional measurements (e.g. cell counting with Neubauer chamber; dry mass evaluation; and the surface plating method to estimate the number of viable cells) rely on manual time-consuming procedures. Therefore, in most of the practical and industrial cases, the assessment and control depend on the quantification of a specific property, which may be either physical (e.g. variation of the medium’s refractive index, viscosity, or electrical conductivity) or biochemical (concentration of: proteins, carbohydrates, DNA, or RNA, for example). These properties are posteriorly correlated to the concentration of cells by an appropriate model derived from the general fermentation reaction: X + S P + ( X + Δ X ) , where a microorganism (concentration X ) consumes a substrate (the “reactant” of cellular reactions) with concentration S (e.g. sucrose), producing both a product with concentration P (on yeast fermentation, it is usually ethanol), and an increase in the cellular concentration Δ X that represents the cellular reproduction (it is an autocatalytic process) [4,13,14]. The mathematical kinetic models of cellular growth are also based on the definition of the specific cell growth rate: μ = ( 1 / X ) ( d X / d t ) . One of the most applied models is the Monod equation, given by: μ = μ m S / ( K M + S ) , where μ m is the maximum specific growth rate and K M is the Monod constant [4]. The estimates of rates of product formation and substrate uptake can be performed with two supporting definitions, which are: the specific rate of product formation: q p = Y P / X μ + m p , where m p is the product formation rate not associated to the cellular growth, and Y P / X is the theoretical yield of product formation per cell reproduction; and the specific rate of substrate consumption: μ s = ( 1 / Y X / S ) μ + m s , where m s is the substrate consumption rate associated to the metabolic activities, and Y X / S is the theoretical yield of cell reproduction per substrate uptake [4,15].
On fed-batch operation mode, the reaction is started with initial concentrations: X 0 , P 0 and S 0 , ( P 0 is usually zero) and an initial volume of fermentation broth V 0 . A constant feed flow F supplies the reactor with an aqueous solution of fresh substrate (feed solution concentration = S F ). The expressions that correlate the instant volume of fermentation broth V and the instant concentrations X , P and S with the time t from the beginning of the process are given by Equations (1)–(4) [15]. It may be noticed that, if F = 0 , the equations are still applicable and represent the batch mode. This is because they are derived directly from the mass balance [4].
d V d t = F V = V 0 + F t
d X d t = μ X F V X
d P d t = q p X F V P
d S d t = μ s X + F V ( S F S )
In this work, Saccharomyces cerevisiae ATCC 7754 cells were cultivated in yeast-peptone-dextrose (YPD) medium (composed of yeast extract, peptone and dextrose with concentrations in proportions of 1:2:2) and pH of 6.5 ± 0.2, conditions adequate for their growth and that contain all the macro- and micronutrients needed. The cells were inoculated into a bioreactor with total volume of 2 L. The other operational parameters were defined for keeping a constant proportion in relation to the fed-batch conditions previously applied to a total volume of 10 L [15]. Sucrose dissolved in deionized (DI) water ( S F = 30.0 g·L−1, a condition of excess of substrate that prevents the growth inhibition associated to the lack of S ) was fed with a flow of 6.67 × 10⁻² L.h−1 using a peristaltic pump (MPS 380, Marte Científica, São Paulo, SP, Brazil) to a reactor with initial conditions V 0 = 0.1 L, X 0 = 1.5 g·L−1, S 0 = 10.0 g·L−1 , P 0 = 0, and constant temperature of 33 °C to maximize the S. cerevisiae fermentation yield [4]. The reactor design was chosen for obtaining a high ratio of surface area per liquid column height. Its surface was kept free to the atmospheric air and under magnetic stirring, guaranteeing the saturation of the liquid medium with air. In aerobic conditions, the cell reproduction is favored over the ethanol production (ethanol is mostly formed in anaerobiose) [13,14]. Therefore, the variation of the refractive index due to the sucrose uptake by cells is not confused with the variation that could be caused by high ethanol formation. Equations (1)–(4) were numerically solved (Euler method; step 0.1 h; all differential equations simultaneously integrated) with the μ m and K M values previously obtained for this same strain of microorganism operating under sucrose flow and cultivated in YPD at 33 °C ( μ m = 0.49 h−1 and K M = 4.1 g·L−1 [4]). The other parameters were defined as the ones obtained in a previous work where a different strain of S. cerevisiae was cultivated in a complex medium similar to YPD (fermentation in fed-batch mode, 33 °C): Y P / X = 2.660 g.g−1, Y X / S = 0.2880 g.g−1, m p = 0.010 h−1 and m s = 0.290 h−1 [15].
Besides that, solutions of sucrose in deionized (DI) water with concentrations ranging from 2.5 to 100 g·L−1 (the concentration range commonly applied to industrial and laboratory fermentation processes [4]) had their refractive indexes (RI) evaluated with a MISCO PA 202 Refractometer (Palm Abbe, Cleveland, OH, U.S.A.). They were also tested with the fiber sensor for evaluating the sensor sensitivity regarding S . Finally, the fed-batch reaction was online assessed over 3.5 h with the smartphone, and the results were compared to the refractometer and to the model predictions. The substrate instant concentrations were obtained by taking small samples of the fermentation broth for analysis of RI. All experiments and microbial cultures were performed in accordance with the Bioethical Committee of the University of Campinas and with the declaration to Brazilian’s Genetic Heritage Database (Register number: AD886EA).

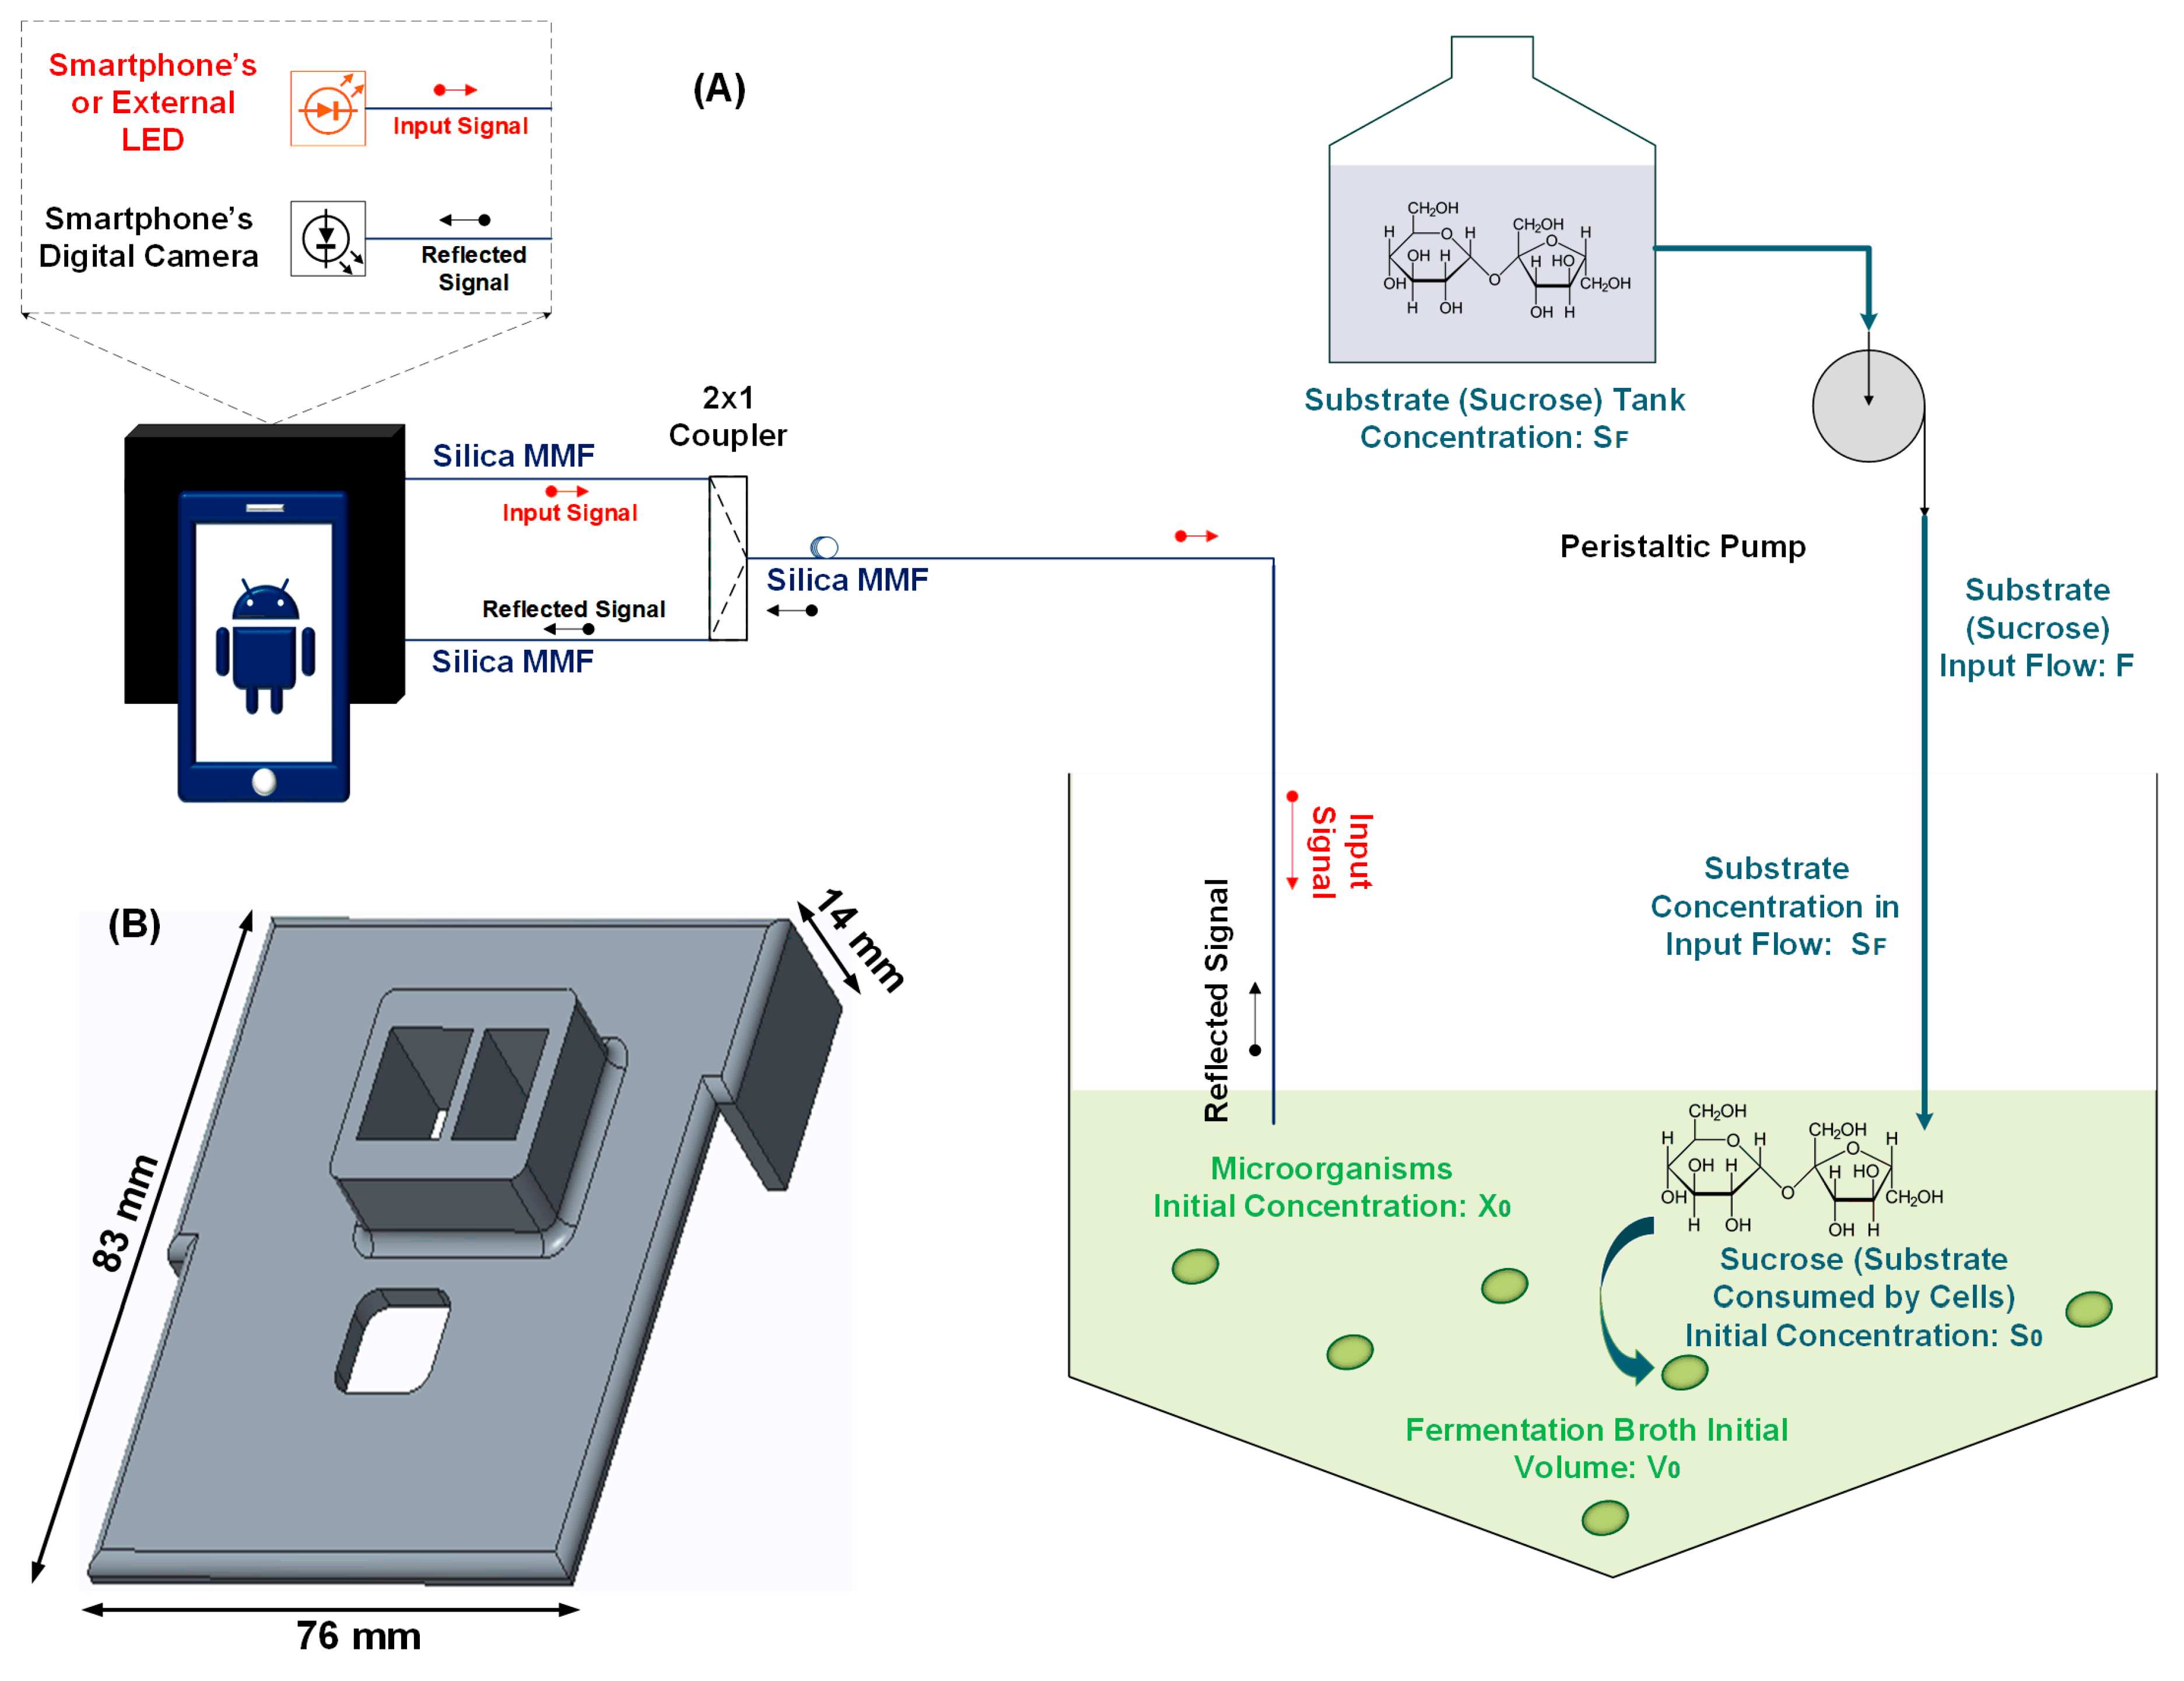
2.2. Sensing with the Smartphone

The optical fiber sensor is based on the modulation of the power reflectance caused by differences in the refractive index of the liquid medium (originated by the consumption of sucrose by the cells [4]). Light is emitted by a LED source (that may be either the smartphone camera’s LED or an external source) through a multi-mode silica optical fiber (MMF), and the light is directed by a 2 × 1 coupler to the liquid medium. When light reaches the fiber–liquid interface, part of it is transmitted and part is reflected back, with power given by the Fresnel law [4]. Finally, the reflected light is redirected by the coupler to the smartphone’s camera, and a developed application acquires and processes the data. Correct positioning of the optical fibers in relation to the smartphone’s camera and the isolation from the environmental light are crucial for a reliable reading. For this purpose, a smartphone case was developed with dimensions for fitting a Samsung Galaxy 9 Plus smartphone (76 mm × 83 mm × 14 mm, hardware setup: Snapdragon 845 2.8 GHz, 6 GB RAM, 12 MP resolution camera). The case contained ports for connecting optical fibers to the camera and to the LED. It was manufactured by a 3D-printer Ultimaker 2+ Extended (Ultimaker BV, Utrecht, The Netherlands) using poly (ethyleneglycol) filament. The full setup for the operation and analysis of the fed-batch fermentation system is shown in Figure 1A, and the 3D-printed case is present in Figure 1B.
An application for processing the intensity signals was developed in Android Studio. The operation was based on three steps: (i) setting image processing parameters; (ii) acquisition of the fiber output light; and (iii) analysis of intensity for each video frame. The application presents two operation modes: the first one evaluates the light intensity (pixel intensity) for a single image received from the camera (this mode is used for calibration and fiber alignment); the second mode performs the effective acquisition of data by recording a video, which is further analyzed frame-by-frame. The application reads the camera images, which consist of a dark background and an illuminated spot referent to the optical fiber termination, and then calculates the average pixel luminous intensity I m on the selected region using the expression: I m = Σ i = 1 N I w ( x i , y i ) / N . In this equation, the dark region is not considered for the calculus, N is the total number of pixels present on the region-of-interest, and I w ( x i , y i ) is the intensity level of the pixel in the coordinate ( x i , y i ) , given by the average of the RGB channels in this coordinate. Finally, the processed light intensities can be exported to a text file and the normalized data are compared to the calibration curve for obtaining the values of P.

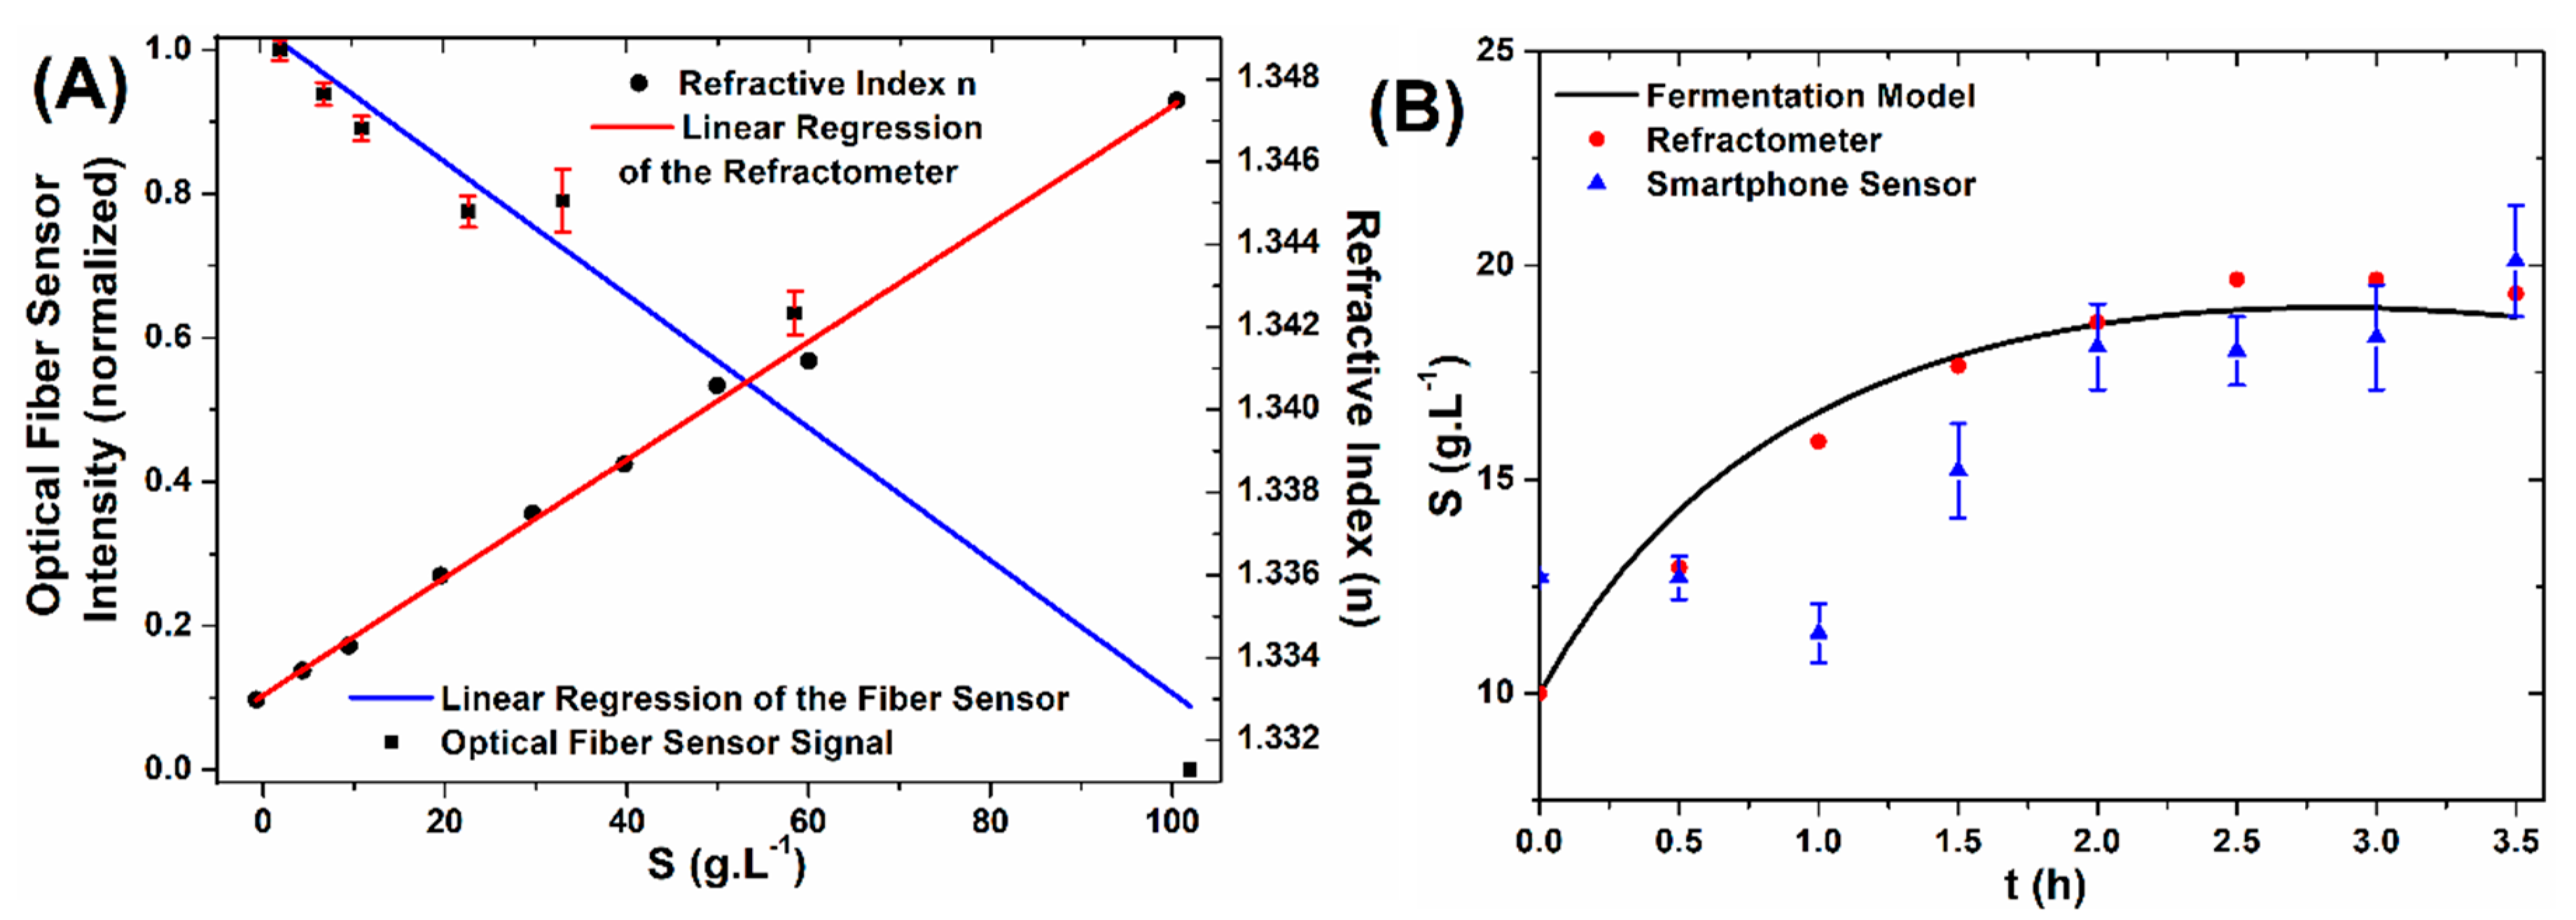
3. Results and Discussion

Figure 2A shows both the correlation between RI and the sucrose concentrations ranging from 0 to 100 g·L−1, and the intensities detected by the smartphone-based sensor for the same solutions. Linear increases in n ( n = 1.3330 + (1.4432 × 10⁻⁴) S , where S is the sucrose concentration in g·L−1, adjusted R² = 0.9971), and in the average intensity I m were verified (normalized I m = 85.8353n − 63.6340, R² = 0.9344). The sensitivity of the fiber sensor was calculated as the ratio of variation of the intensity with the refractive index, leading to a sensitivity of 85.83 RIU−1 (refractive index units). The signal-to-noise ratios (SNRs) were evaluated as the relation I m 2 / σ 2 , where σ is the signal standard variation: SNRs ranging from 2.25 × 10² to 2.4 × 10⁵ were obtained. The fed-batch assessment is shown in Figure 2B, where the mathematical model predictions (Equations (1)–(4)) are represented by a solid black line. Results obtained by the smartphone sensor corroborate with the refractometer and with the theoretical model analyses. In fermentation systems, relatively high deviations from the model are usually expected due to the uncertainties involved in representing different cells as a homogeneous population and to other different aspects of the bioprocess. These aspects may include temporal evolution of the microorganisms; adaption to small differences of substrate; small oscillations of temperature throughout the experiment; differences in shear stresses, etc. Therefore, the constant recalculating of the adjusted parameters is highly suggested [4].
The refractometer presents a high resolution of 1 × 10⁻⁴ RIU, but it is a high-cost device and requires sample collecting throughout the experiment (in contrast to the smartphone-based fiber sensor that is available for online monitoring of the fermentation broth). It is finally important to notice that the solution of Equation (4) for the 3.5 h of experiment (results that are not shown in Figure 2) resulted in a final concentration of P (ethanol) of only 3.51 g·L−1, 5.36 times lower than the predicted concentration of sucrose S (18.80 g·L−1). Considering that the solution has approximately the same density as water at 33 °C (994.8 kg.m−3), this concentration P corresponds to a mass percent of approximately 0.35% of ethanol. It is known that a fraction of 0.50% enhances the refractive index of a hydro-alcoholic solution to only 1.3334 [16]. This is the same effect caused by a solution containing concentrations as low as 2.5 g·L−1 of sucrose. Therefore, the ethanol effect on the RI can indeed be neglected in these analyzed situations.

4. Conclusions

The design of a portable and low-cost smartphone-based optical fiber sensor for the monitoring of bioreactors was demonstrated, providing a sensitivity of 85.83 RIU−1 and a reliable assessment of the fermentation process. Due to the limited frequency of data collection by the camera, the system is not capable of performing a quasi-elastic light scattering analysis like the sensor described in [4], where the direct evaluation of the biomass concentration was demonstrated. On the other hand, its production costs are considerably lower. It can be manufactured on-site by 3D-printing, and it can then be easily integrated to an industrial line. This last characteristic is of major importance for the Industry 4.0 concept, and this integration would not possible neither for the microfluidic systems nor the traditional assessment methods. Future works will focus on enhancing the sensitivity of the sensor and on testing its performance for higher fermentation scales and for more complexes systems. The smartphone processing will be also applied to the interrogation of special fibers and of other chemical sensors under development.

Author Contributions

M.C.P.S. and T.D.C. wrote the paper, prepared the yeast and the bioreaction system, and performed the data analysis; P.M.L. and M.d.S.R. performed the experiments; G.S.R. designed and fabricated the case; E.F. conceived the fiber sensor and provided funding.

Funding

This research was funded by the São Paulo Research Foundation (FAPESP) under grants 2017/20445-8 and 2019/22554-4, CNPq and Capes (Finance Code—001).

Acknowledgments

Authors thank Lucimara Gaziola de la Torre (School of Chemical Engineering—FEQ/UNICAMP) for the yeast strain (S. cerevisiae ATCC 7754), and Cristiano Monteiro de Barros Cordeiro (Institute of Physics—IFGW/UNICAMP) for the handheld refractometer and 3D-printing equipment.

Conflicts of Interest

The authors declare no conflict of interest.

References

  1. Pan, M.; Sikorski, J.; Kastner, C.A.; Akroyd, J.; Mosbach, S.; Lau, R.; Kraft, M. Applying Industry 4.0 to the Jurong Island Eco-industrial Park. Energy Procedia 2015, 75, 1536–1541. [Google Scholar] [CrossRef]
  2. Reis, M.S.; Kenett, R. Assessing the value of information of data-centric activities in the chemical processing industry 4.0. AIChE J. 2018, 64, 3868–3881. [Google Scholar] [CrossRef]
  3. Ju, H.; Kandimalla, V.K. Electrochemical Sensors, Biosensors and Their Biomedical Applications; Zhang, X., Ju, H., Wang, J., Eds.; Elsevier: Amsterdam, The Netherlands, 2008. [Google Scholar]
  4. Soares, M.C.P.; Vit, F.F.; Suzuki, C.K.; de la Torre, L.G.; Fujiwara, E. Perfusion Microfermentor Integrated into a Fiber Optic Quasi-Elastic Light Scattering Sensor for Fast Screening of Microbial Growth Parameters. Sensors 2019, 19, 2493. [Google Scholar] [CrossRef] [PubMed]
  5. Li, X.; Nguyen, L.V.; Zhao, Y.; Ebendorff-Heidepriem, H.; Warren-Smith, S.C. High-sensitivity Sagnac-interferometer biosensor based on exposed core microstructured optical fiber. Sensors Actuators, B Chem. 2018, 269, 103–109. [Google Scholar] [CrossRef]
  6. Gong, C.; Gong, Y.; Chen, Q.; Rao, Y.J.; Peng, G.D.; Fan, X. Reproducible fiber optofluidic laser for disposable and array applications. Lab Chip 2017, 17, 3431–3436. [Google Scholar] [CrossRef] [PubMed]
  7. Basso, L.C.; Basso, T.O.; Rocha, S.N. Biofuel Production. Recent Developments and Prospect; Bernardes, M.A.S., Ed.; IntechOpen: Rijeka, Croatia, 2011. [Google Scholar] [CrossRef]
  8. Hasenfratz, D.; Saukh, O.; Sturzenegger, S.; Thiele, L. Participatory Air Pollution Monitoring Using Smartphones. In Proceedings of the 2nd International Workshop on Mobile Sensing (Mobile Sensing: From Smartphones and Wearables to Big Data). Workshop co-located with IPSN ’12 and CPSWEEK, Beijing, China, 16 April 2012; Academic Press: Beijing, China, 2012. [Google Scholar]
  9. Guo, J. Uric Acid Monitoring with a Smartphone as the Electrochemical Analyzer. Anal. Chem. 2016, 88, 11986–11989. [Google Scholar] [CrossRef] [PubMed]
  10. Dutta, S.; Sarma, D.; Nath, P. Ground and river water quality monitoring using a smartphone-based pH sensor. AIP Adv. 2015, 5, 057151. [Google Scholar] [CrossRef]
  11. Gunda, N.S.K.; Naicker, S.; Shinde, S.; Kimbahune, S.; Shrivastava, S.; Mitra, S. Mobile Water Kit (MWK): a smartphone compatible low-cost water monitoring system for rapid detection of total coliform and E. coli. Anal. Methods 2014, 6, 6236–6246. [Google Scholar] [CrossRef]
  12. Michelini, E.; Calabretta, M.M.; Cevenini, L.; Lopreside, A.; Southworth, T.; Fontaine, D.M.; Simoni, P.; Branchini, B.R.; Roda, A. Smartphone-based multicolor bioluminescent 3D spheroid biosensors for monitoring inflammatory activity. Biosens. Bioelectron. 2019, 123, 269–277. [Google Scholar] [CrossRef] [PubMed]
  13. Bailey, J.; Ollis, D. Biochemical Engineering Fundamentals; McGraw-Hill: New York City, NY, USA, 1986. [Google Scholar]
  14. Doran, P. Bioprocess Engineering Principles, 2nd ed.; Elsevier: Amsterdam, The Netherlands, 2013. [Google Scholar]
  15. Soares, M.C.P.; Luz, G.F.; Costa, A.C.; Gomes, M.K.; Mendes, B.F.; Torre, L.G.; Fujiwara, E. Saccharomyces cerevisiae Fed-Batch Fermentation and Artificial Intelligence Method for Adjusting Model Parameters to Experimental Data. Blucher Chem. Eng. Proc. 2018, 1, 2010–2014. [Google Scholar] [CrossRef]
  16. Concentrative Properties of Aqueous Solutions: Density, Refractive Index, Freezing Point Depression, and Viscosity. In CRC Handbook of Chemistry and Physics, 100th ed.; Rumble, J. (Ed.) CRC Press (Taylor and Francis Group): Boca Raton, FL, USA, 2019. [Google Scholar]
Figure 1. (A) Setup of the fed-batch fermentation and monitoring systems; (B) 3D-printed smartphone case. MMF refers to the multi-mode optical fiber.
Engproc 02 00026 g001
Figure 2. (A) Correlation between sucrose concentration S (red) and refractive indexes (RI) of the solution, and calibration of pixel intensity in relation to the RI (blue); (B) fed-batch fermentation results.
Engproc 02 00026 g002
Publisher’s Note: MDPI stays neutral with regard to jurisdictional claims in published maps and institutional affiliations.

