Experimental Study on Cabin Carbon Dioxide Concentration in Light Passenger Vehicles †


1
School of Engineering and Technology Central Queensland University, Rockhampton, QLD 4700, Australia
2
School of Science Technology and Engineering, University of the Sunshine Coast, Sunshine Coast, QLD 4556, Australia
*
Author to whom correspondence should be addressed.
†
Presented at the 7th Electronic Conference on Sensors and Applications, 15–30 November 2020; Available online: https://ecsa-7.sciforum.net/.
Eng. Proc. 2020, 2(1), 88; https://0-doi-org.brum.beds.ac.uk/10.3390/ecsa-7-08266
Published: 14 November 2020
(This article belongs to the Proceedings of 7th International Electronic Conference on Sensors and Applications)
Abstract
:This paper discusses the initial experimental results of monitoring carbon dioxide (CO2) and total volatile organic compounds (TVOC) inside automobiles with different cabin sizes and with different numbers of occupants. The initial study shows that the CO2 and TVOC concentrations are inversely proportional to cabin volume and proportional to passenger numbers and time when the metabolic activities were maintained at the same level. This study was aimed at short distance travel on normal roads, and further studies are to be carried out for long distance running on highways to make sound decisions on automatic air inflow control to maintain the in-cabin air within permissible levels of CO2. The study shows that a CO2 concentration of 1500 ppm is reached by all three light passenger vehicle types used within 20 minutes with a single person and reached a CO2 level of nearly 3000 ppm within the same time with two passengers in the cabin.
1. Introduction
Automobiles have become an essential part of hardware in modern human society, where all services and businesses are highly dependent upon them. Since its development in the last century, occupant safety and comfort have become the main focal points in the automobile industry. Since air conditioning was introduced to automobiles, there has been a generic trend among users to close the external airflow into the cabin to increase the cooling efficiency. This leads to a situation of increasing carbon dioxide (CO2) concentration in the cabin. This paper discusses an experimental investigation using three different light passenger vehicles to study the actual in-cabin CO2 and concentration of total volatile organic compounds (TVOC) in the cabin during operation.
Vehicle cabin air quality has been investigated by different research groups under various conditions in different parts of the world [1,2]. Carbon dioxide levels in the cabin can be assumed to be equal to the CO2 levels in the outside air, which also vary by location. The atmospheric CO2 concentration measured by the Global Monitoring Laboratory of the US National Oceanic and Atmospheric Administration (NOAA) for the month of September 2020 was 411.29 ppm [3]. This value has been increasing at an alarming rate since the industrial revolution, mainly due to human activities [4]. Studies show that the atmospheric CO2 levels were comparatively lower than that of today, but still varying within the range of 170~260 ppm due to natural events during the period of 650,000 to 800,000 years before today [5]. The current rate of increase is nearly 2.5 ppm per year, and the air we inhale is becoming polluted continuously [4]. Therefore, monitoring and controlling the in-cabin air of automobiles has become an interesting topic in the industry to avoid possible health and safety risks due to high CO2 concentrations for long time periods.
There are various standards developed by respective authorities regarding the recommended levels of CO2 concentrations in enclosed environments [6,7,8]. Allen et al. showed in their study that the level of CO2 in an environment has a direct impact on the cognitive abilities of people. In their experiments, they tested the same individuals at two different CO2 concentrations of 945 and 1400 ppm and observed a 21% decrease in cognitive ability with an increase in CO2 concentration of 0.044%. This in itself reveals how crucial the in-cabin CO2 concentration is regarding the decisions made by drivers while driving and how important it is to monitor and control the CO2 concentration inside the cabin.
ASHRAE standard 62 of 1981 recommends the allowable CO2 levels linked to minimum area per person in an indoor environment [9]. In an indoor environment, the required airflow rate is calculated as
where G is the CO2 generation rate per person, is the steady state indoor CO2 concentration, and is the outdoor CO2 concentration.
When it comes to in-cabin air quality, we can calculate the required flow rate of fresh air. However, due to various reasons, such as carbon monoxide smoke in outside air in urban environments, passengers in vehicles prefer to switch the air circulation to inside mode, preventing fresh air from entering into the cabin.
Persily and Jonge suggested that the rate of CO2 generation per person is given by [10]
where is the DuBois surface area (m2), is the metabolic rate (met), and is the respiratory quotient (dimensionless). is calculated using the following equation where is height in meters and is weight in kilograms.
2. Materials and Methodology
In this study, three different vehicle types were subjected to tests with two different passenger numbers. CO2 concentrations and TVOC concentrations were measured every 10 seconds using a CCS881 environmental air quality measurement sensor. The vehicles used were:
- (a)
- Toyota Corolla (Petrol) (2005)
- (b)
- Toyota Kluger (Petrol) (2015)
- (c)
- Toyota RAV4 (Hybrid) (2019)
The cabin size of the Corolla is the smallest, while that of the Kluger is the largest among the three vehicles used.
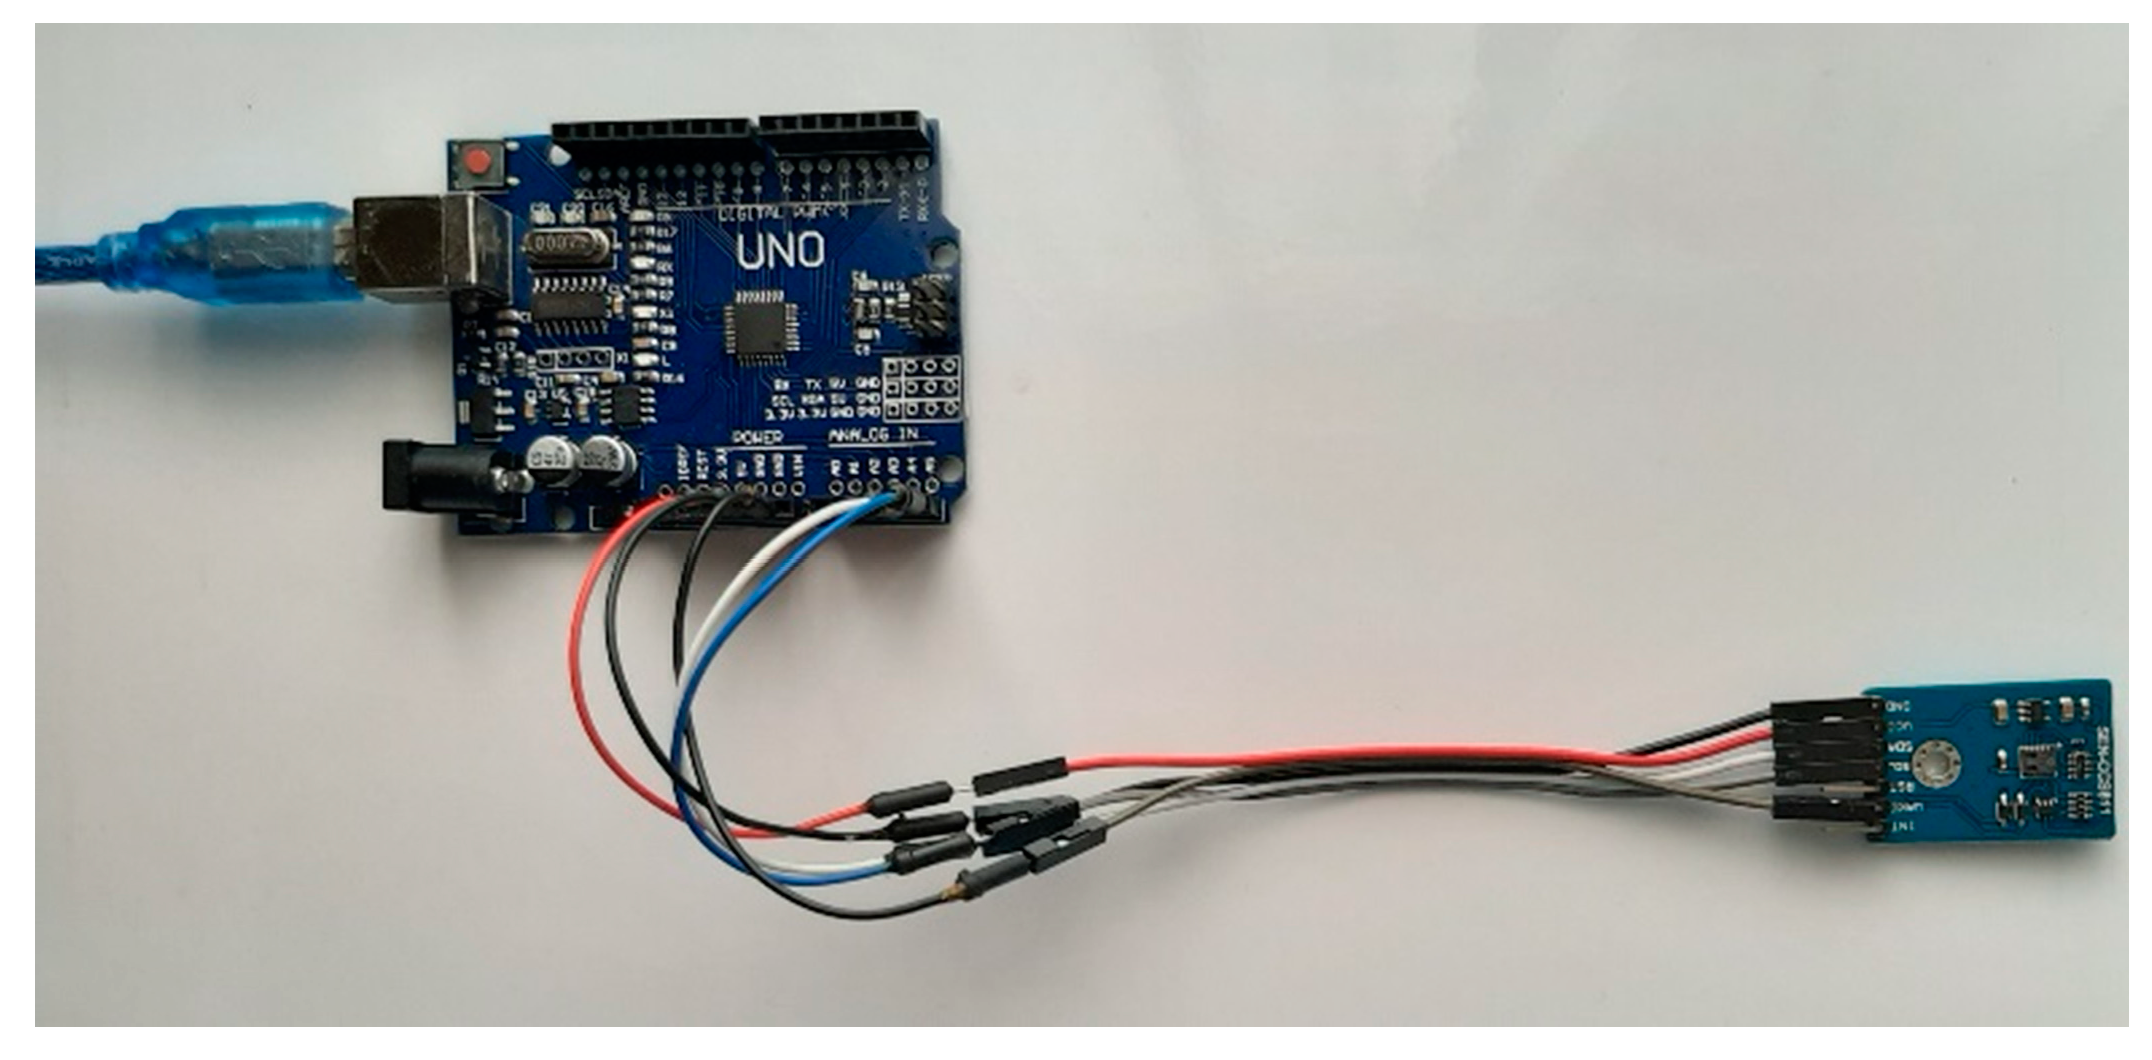
Figure 1 shows the experimental setup used for the measurements, and before every measurement cycle, all windows were opened to get fresh air into the cabin for a reasonable amount of time. Then the passengers got in and windows were closed before starting the measurements. The route used was the same for all the measurements. The air circulator was put on inside recirculation mode where no fresh air comes in to the cabin. The fan was set to low flow rate with flow direction on head and foot mode, and the temperature was set to 22 °C. The sensor was placed towards the front of the glovebox in each vehicle.
Previous research showed that the in-cabin temperature, metabolic activity, and various other factors have an influence on cabin CO2 concentration. Therefore, in this experiment these factors were set to constant levels as far as possible in all three vehicles. However, there are clear differences in interior setup from vehicle to vehicle, and the sensor placement has differences due to the physical setup of different vehicles. In future experiments, we expect to employ multiple sensors in different places and map the air quality with respect to their physical locations.
In all the experiments carried out, the metabolic rates were kept constant by limiting the activities to the same during each test, and the respiratory quotient can be assumed the same throughout all experiments, as per Equation (2).
The CCS811 sensor module was interfaced to an Arduino Uno microcontroller development kit on I2C bus, and it was programmed to take measurements in every 10 second period and send the data directly to a laptop via the USART protocol. CCS881 has the measurement range of 400 to 29,206 ppm of eCO2 and 0 to 32,768 ppb of eTVOC, where ‘e’ stands for equivalent.
3. Results and Discussion
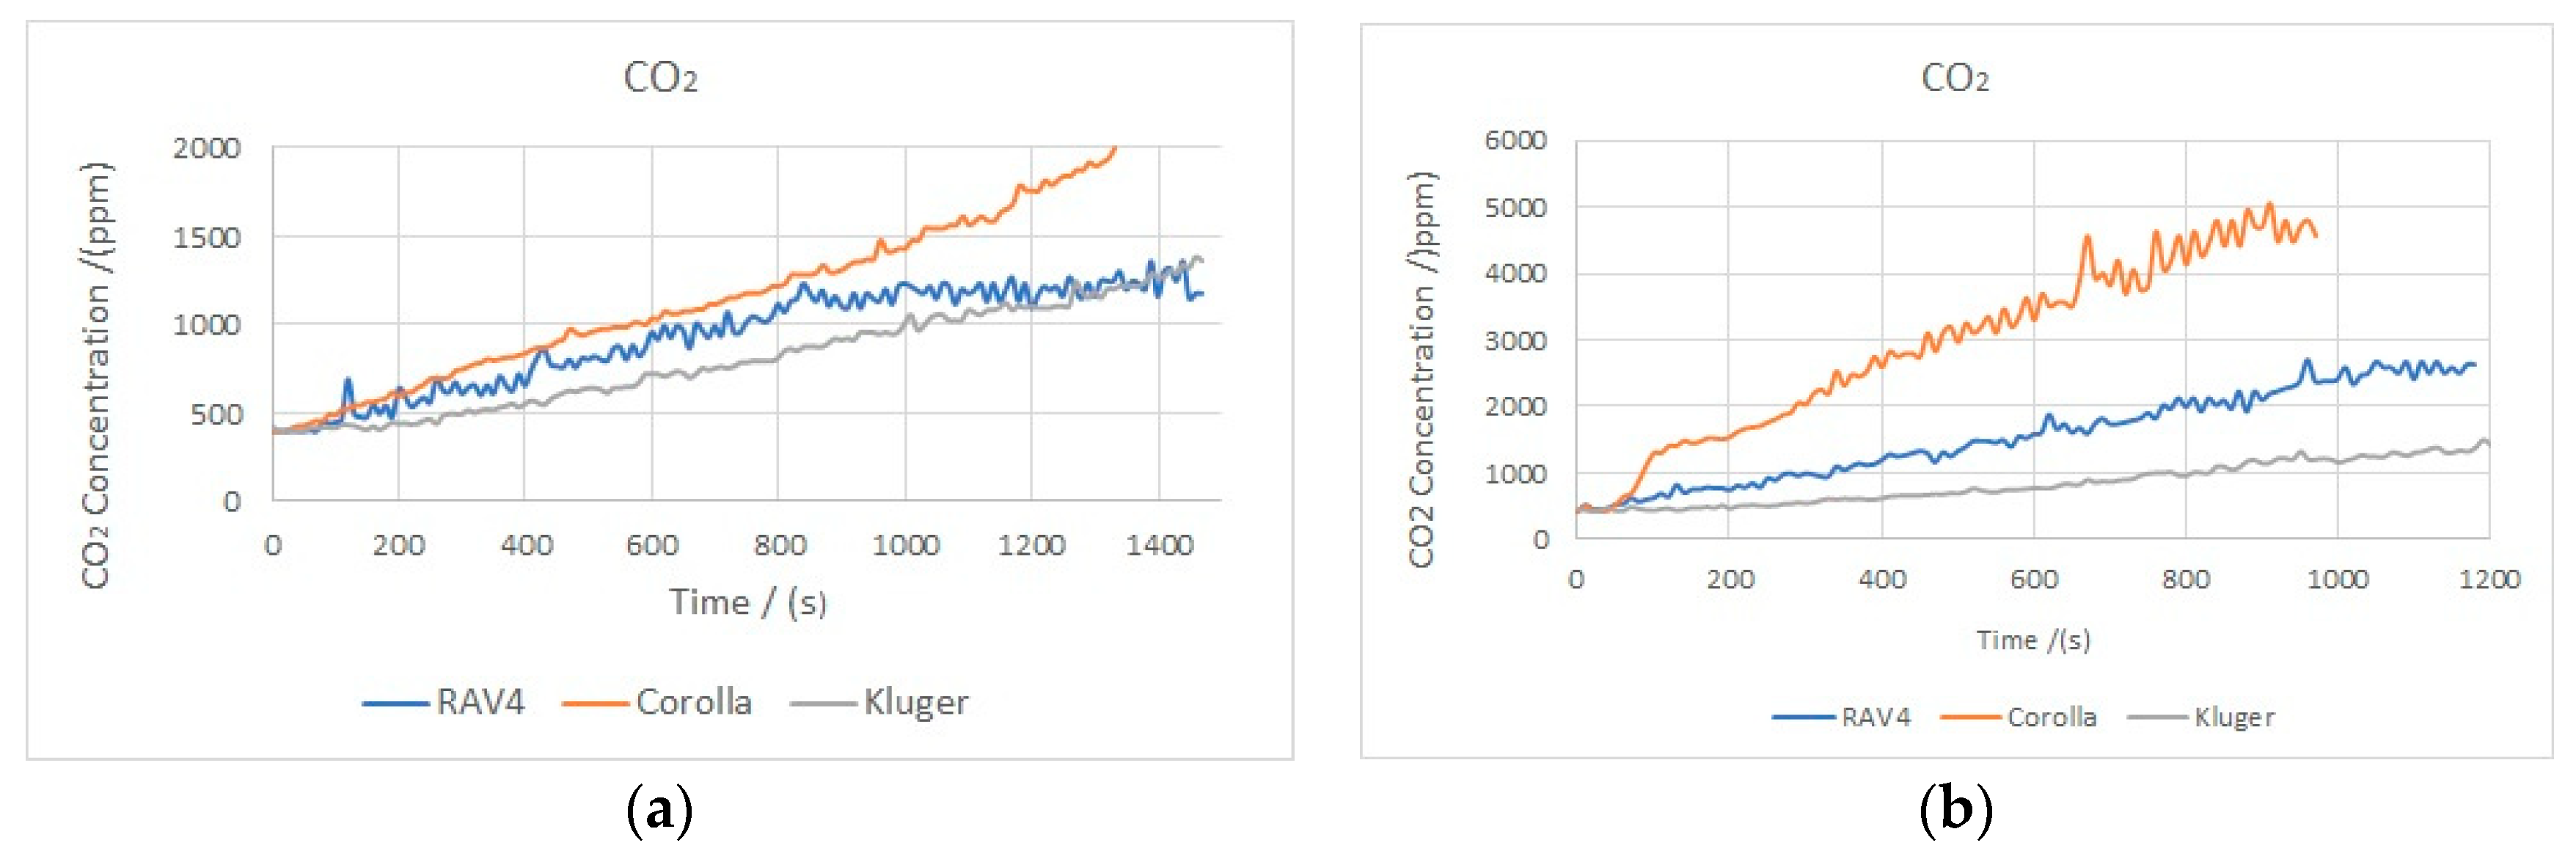
Figure 2 shows the equivalent CO2 measurement results using three different vehicles with one and two passengers in the cabin. The rate of change in CO2 concentration can be said to be inversely proportional to the cabin size, as well as to the number of occupants in the cabin.
It can be clearly seen from these results that the cabin size of the vehicle plays a great role in the CO2 concentration, where the Toyota Corolla has the highest rate of CO2 concentration and the Toyota Kluger has the lowest, where the Corolla has the smallest cabin size while Kluger has the largest. In some trials, the initial part looks slightly different from what is expected, and this may be due to that fact that the initial heating time needed for the sensor is not received properly.
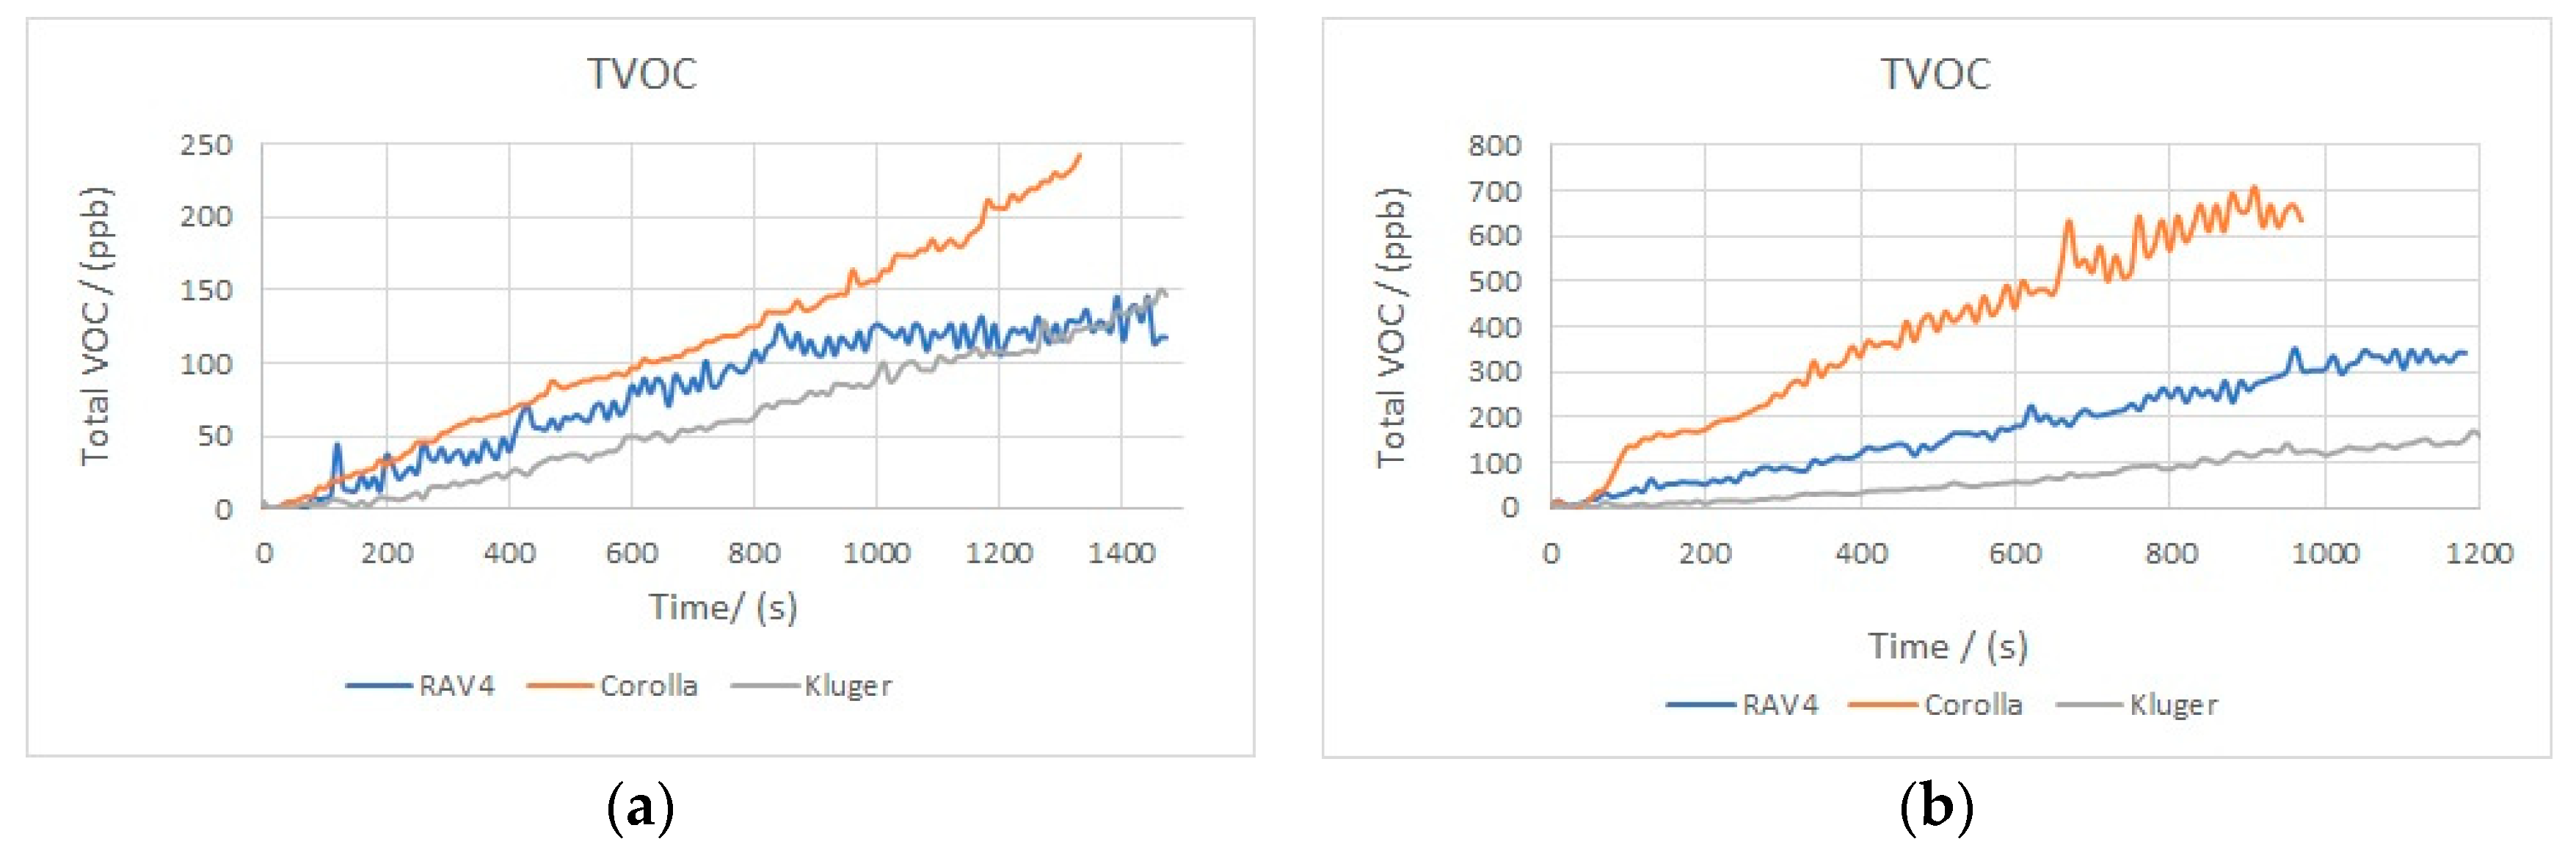
Figure 3 shows the equivalent TVOC measurement results, and the outcome is very similar to the eCO2 measurement results. This may be due to the fact that the sensor outputs are eCO2 and eTVOC, which are calculated from the same measurement by the sensor and converted into two parameters logically within the sensor hardware. Therefore, in subsequent experiments, it has been decided to employ different types of CO2 and TVOC sensors to have more realistic measurements.
The total volatile organic compounds measured are well in line with the expected profile over time with respect to the occupant number and the volume of the cabin. However, to ensure the accuracy of measurements, different types of TVOC sensors and CO2 sensors need to be employed simultaneously.
4. Conclusions
This experimental study was carried out to understand the actual pattern of in-cabin CO2 concentrations during travel in light passenger vehicles. In the initial experiments carried out, it can be concluded that the eCO2 and eTVOC concentrations are inversely proportional to the cabin volume and proportional to the time. However, it is necessary to employ multiple types of CO2 and TVOC sensors and have multiple locations within the cabin measurement system with temperature, humidity and oxygen sensors to make a more accurate decision on when to open the external airflow into the cabin and how long it should be kept open. Once all these parameters are measured, a more informed decision can be made that can be integrated into the vehicle heating ventilation and air conditioning system control program.
Author Contributions
Conceptualization, D.M.G.P., L.P., and U.I.; methodology, D.M.G.P., L.P., and U.I.; software, D.M.G.P.; validation, D.M.G.P.,U.I.; formal analysis, D.M.G.P.; investigation, D.M.G.P.; resources, D.M.G.P., L.P.; writing—review and editing, D.M.G.P., L.P., and U.I.; project administration, D.M.G.P.; All authors have read and agreed to the published version of the manuscript.
Funding
This research received no external funding.
Conflicts of Interest
The authors declare no conflict of interest.
References
- Stitnimankarn, P.; Siripoorikan, T.; Thanomkul, N.; De Silva, P.; Pungetmongkol, P.; Staubs, J. Transient CO2 Diffusion from Vehicle Cabin Micro-environment in Hot and Humid Climates. IJESD 2020, 11, 273–277. [Google Scholar] [CrossRef]
- Luangprasert, M.; Vasithamrong, C.; Pongratananukul, S.; Chantranuwathana, S.; Pumrin, S.; De Silva, I.P.D. In-vehicle carbon dioxide concentration in commuting cars in Bangkok, Thailand. J. Air Waste Manag. Assoc. 2017, 67, 623–633. [Google Scholar] [CrossRef] [PubMed]
- Monthly Average Mauna Loa CO2; Global Monitoring Laboratory, National Oceanic and Atmospheric Administration (NOAA), US Department of Science, USA. Available online: https://www.esrl.noaa.gov/gmd/ccgg/trends/ (accessed on 09 December 2020).
- Lindsey, R. Climate Change: Atmospheric Carbon Dioxide; National Oceanic and Atmospheric Administration: US Department of Science, USA. Available online: https://www.climate.gov/news-features/understanding-climate/climate-change-atmospheric-carbon-dioxide (accessed on 09 December 2020).
- Lüthi, D.; Le Floch, M.; Bereiter, B.; Blunier, T.; Barnola, J.-M.; Siegenthaler, U.; Raynaud, D.; Jouzel, J.; Fischer, H.; Kawamura, K.; et al. High-resolution carbon dioxide concentration record 650,000–800,000 years before present. Nature 2008, 453, 379–382. [Google Scholar] [CrossRef] [PubMed]
- ASHRAE Standards Ventilation for Acceptable Indoor Air Quality; ASHRAE Standing Standard Project Committee 62. 1; American Society of Heating refrigerating and Air-Conditioning Engineers Inc.: Atlanta, GA, USA, 2003; pp. 1–15. [Google Scholar]
- ASHRAE Standards. Ventilation for Acceptable Indoor Air Quality-Addenda 2016; ANSI/ASHRAE Addendum b to ANSI/ASHRAE Standard 62.1-2016; American Society of Heating refrigerating and Air-Conditioning Engineers Inc.: Atlanta, GA, USA, 2016; pp. 1–6. [Google Scholar]
- Review of In-Cabin Carbon Dioxide Levels; Roads and Maritime Services: Sydney, NSW, Australia; p. 57.
- ASHRAE Standards ASHRAE standard 62-1981: Ventilation for Acceptable Indoor Air Quality; ASHRAE Standing Standard Project Committee 62. 73R; American Society of Heating refrigerating and Air-Conditioning Engineers Inc.: Atlanta, GA, USA, 1989; pp. 1–11. [Google Scholar]
- Persily, A.; de Jonge, L. Carbon dioxide generation rates for building occupants. Indoor Air 2017, 27, 868–879. [Google Scholar] [CrossRef] [PubMed]
Figure 1.
Indoor air quality measurement sensor and data acquisition hardware.

Figure 2.
Equivalent carbon dioxide (eCO2) concentration variation with time: (a) single person in cabin; (b) two persons in cabin.
Figure 2.
Equivalent carbon dioxide (eCO2) concentration variation with time: (a) single person in cabin; (b) two persons in cabin.

Figure 3.
Equivalent total volatile organic compound (eTVOC) concentration variation with time: (a) single person in cabin; (b) two persons in cabin.
Figure 3.
Equivalent total volatile organic compound (eTVOC) concentration variation with time: (a) single person in cabin; (b) two persons in cabin.

Publisher’s Note: MDPI stays neutral with regard to jurisdictional claims in published maps and institutional affiliations. |
© 2020 by the authors. Licensee MDPI, Basel, Switzerland. This article is an open access article distributed under the terms and conditions of the Creative Commons Attribution (CC BY) license (https://creativecommons.org/licenses/by/4.0/).
Share and Cite
MDPI and ACS Style
Preethichandra, D.M.G.; Piyathilaka, L.; Izhar, U. Experimental Study on Cabin Carbon Dioxide Concentration in Light Passenger Vehicles. Eng. Proc. 2020, 2, 88. https://0-doi-org.brum.beds.ac.uk/10.3390/ecsa-7-08266
AMA Style
Preethichandra DMG, Piyathilaka L, Izhar U. Experimental Study on Cabin Carbon Dioxide Concentration in Light Passenger Vehicles. Engineering Proceedings. 2020; 2(1):88. https://0-doi-org.brum.beds.ac.uk/10.3390/ecsa-7-08266
Chicago/Turabian StylePreethichandra, Daluwathu Mulla Gamage, Lasitha Piyathilaka, and Umar Izhar. 2020. "Experimental Study on Cabin Carbon Dioxide Concentration in Light Passenger Vehicles" Engineering Proceedings 2, no. 1: 88. https://0-doi-org.brum.beds.ac.uk/10.3390/ecsa-7-08266