
System for Forecasting COVID-19 Cases Using Time-Series and Neural Networks Models †


Department of System Programming, South Ural State University, 454080 Chelyabinsk, Russia
*
Author to whom correspondence should be addressed.
†
Presented at the 7th International conference on Time-series and Forecasting, Gran Canaria, Spain, 19–21 July 2021.
Eng. Proc. 2021, 5(1), 46; https://0-doi-org.brum.beds.ac.uk/10.3390/engproc2021005046
Published: 9 July 2021
(This article belongs to the Proceedings of The 7th International Conference on Time Series and Forecasting)
Abstract
:COVID-19 is one of the biggest challenges that countries face at the present time, as infections and deaths change daily and because this pandemic has a dynamic spread. Our paper considers two tasks. The first one is to develop a system for modeling COVID-19 based on time-series models due to their accuracy in forecasting COVID-19 cases. We developed an “Epidemic. TA” system using R programming for modeling and forecasting COVID-19 cases. This system contains linear (ARIMA and Holt’s model) and non-linear (BATS, TBATS, and SIR) time-series models and neural network auto-regressive models (NNAR), which allows us to obtain the most accurate forecasts of infections, deaths, and vaccination cases. The second task is the implementation of our system to forecast the risk of the third wave of infections in the Russian Federation.
Keywords:
COVID-19; time-series models; ARIMA; BATS; TBATS; Holt’s linear trend; NNAR; forecasting system1. Introduction
The COVID-19 (Here and later, all the acronyms are listed at the end of Introduction section, see Table 1) pandemic has become global. While the challenge for the medical sciences where treatments, drugs, vaccines, and test systems are developed are pervasive, the challenges for all fields of knowledge including mathematical and statistical science are also pervasive as they play an important role in modeling and discovering patterns of spread in infection cases and in forecasting COVID-19 infection cases and deaths. Since the first days of the pandemic, various methods for modeling and forecasting the spread of infection cases worldwide and in local regions have developed and appeared. Various articles were devoted to the use of known models, identification of their parameters, and testing on known data.
On 1 March 2020, the virus began to spread in a pattern that resulted in millions of infections in less than a year. Most of the deaths from this virus occur among the elderly and people with chronic heart disease, which is the leading cause of death even in developed countries. Recently, quite a lot of studies have been published on forecasting the number of COVID-19 cases on both a worldwide and regional basis. These studies used mainly the ARIMA model, Holt’s linear trend model, and the SIR state transition model. There are also studies devoted to comparing the work of the models, for example, in [1] it is shown that the linear Holt model is better than the ARIMA model for the states considered in it. In this article, we will investigate the performance of these models and provide an analysis of the errors of the forecasts obtained.
Given the similarity of the characteristics of the models in the United States and Italy, it was suggested in [2] that the corresponding forecasting tools can be applied to other countries facing the COVID-19 pandemic, as well as to any pandemics that may arise in the future. However, a general principle for choosing models for forecasting the spread of COVID-19 has not yet been formulated. Moreover, for different states and different conditions of the spread of the epidemic, it is advisable to build a forecast using different models. For example, in [3] it was shown that the LSTM model consistently possessed the lowest rates of forecast errors for tracking the dynamics of infection cases in the four countries considered. There are also studies that show that the ARIMA model and cubic smoothing spline models had lower forecast errors and narrower forecast intervals compared to Holt’s and TBATS models. Forecasting time-series data have been around for several decades with techniques such as ARIMA. Recently, recurrent neural networks (LSTM) have been used with much success. The most important advantages of ARIMA include the following: (1) dealing with small data; (2) simple to implement with no parameter tuning; (3) easier to handle multivariate data; (4) quick to run. The advantages of LSTM include the following: (1) no pre-requisites (stationarity, no level shifts); (2) can model non-linear function with neural networks; (3) requires a lot of data (Big data) and so time-series models are considered more appropriate for dealing with COVID-19 data as they have the ability to deal with small data.
The results obtained cannot be generalized to all countries affected by the COVID-19 pandemic due to the different patterns of the virus spreading. At the very beginning of the pandemic, lots of researchers from all over the world tried to forecast the outbreak of COVID-19 by using the models of susceptible-infected-recovered (SIR) family known as the classical epidemiological models [4]. One of the first papers [5] was devoted to the simulation of the COVID-19 in the Isfahan province of Iran for the period from 14 February 2020 to 11 April 2020. The authors of this paper forecasted the remaining infectious cases with three scenarios that differed in terms of the stringency level of social distancing. Despite the prediction of infectious cases in short-term intervals, the constructed SIR model was unable to forecast the actual spread and pattern of the epidemic in the long term. Remarkably, most of the published SIR models developed to predict COVID-19 for other communities suffered from the same conformity. The SIR models are based on assumptions that seem not to be true in the case of the COVID-19 epidemic. Hence, more sophisticated modeling strategies and detailed knowledge of the biomedical and epidemiological aspects of the disease are required to forecast the pandemic.
One more example of using this model is the paper [6] in which the authors predicted that the peak of the second wave of infection cases in Pakistan should have occurred on 25 August 2020; however, the peak of infection in this country was, in fact, in December 2020. The “covid19.analytics” package [7] developed in the R language possesses the same drawbacks. This is evidenced by the results of the SIR model and the prediction of the time of occurrence of the second (and subsequent) wave cycles. Despite these shortcomings, they have been widely accepted. There is also a drawback in that it does not deal with time-series models and neural networks. Due to this deficiency in SIR models, it was important to work on developing time-series models that have been proven effective in modeling and predicting COVID-19 cases. In our paper, we observe that classical SIR model produces greater error than statistical methods.
The purpose of our work is to create an algorithm that allows for the available initial data on the spread of coronavirus infection in a certain region for a given period of time to determine the best model for making a forecast for a given period. The algorithm analyzes forecasts from time-series models (ARIMA, Holt’s linear model, BATS, and TBATS), and neural networks model (NNAR) and selects a model that produces a forecast with a minimum mean absolute percentage error (MAPE). The article describes a program in the R language that produces a forecast using the models described above.
2. The Review of Epidemic.TA System
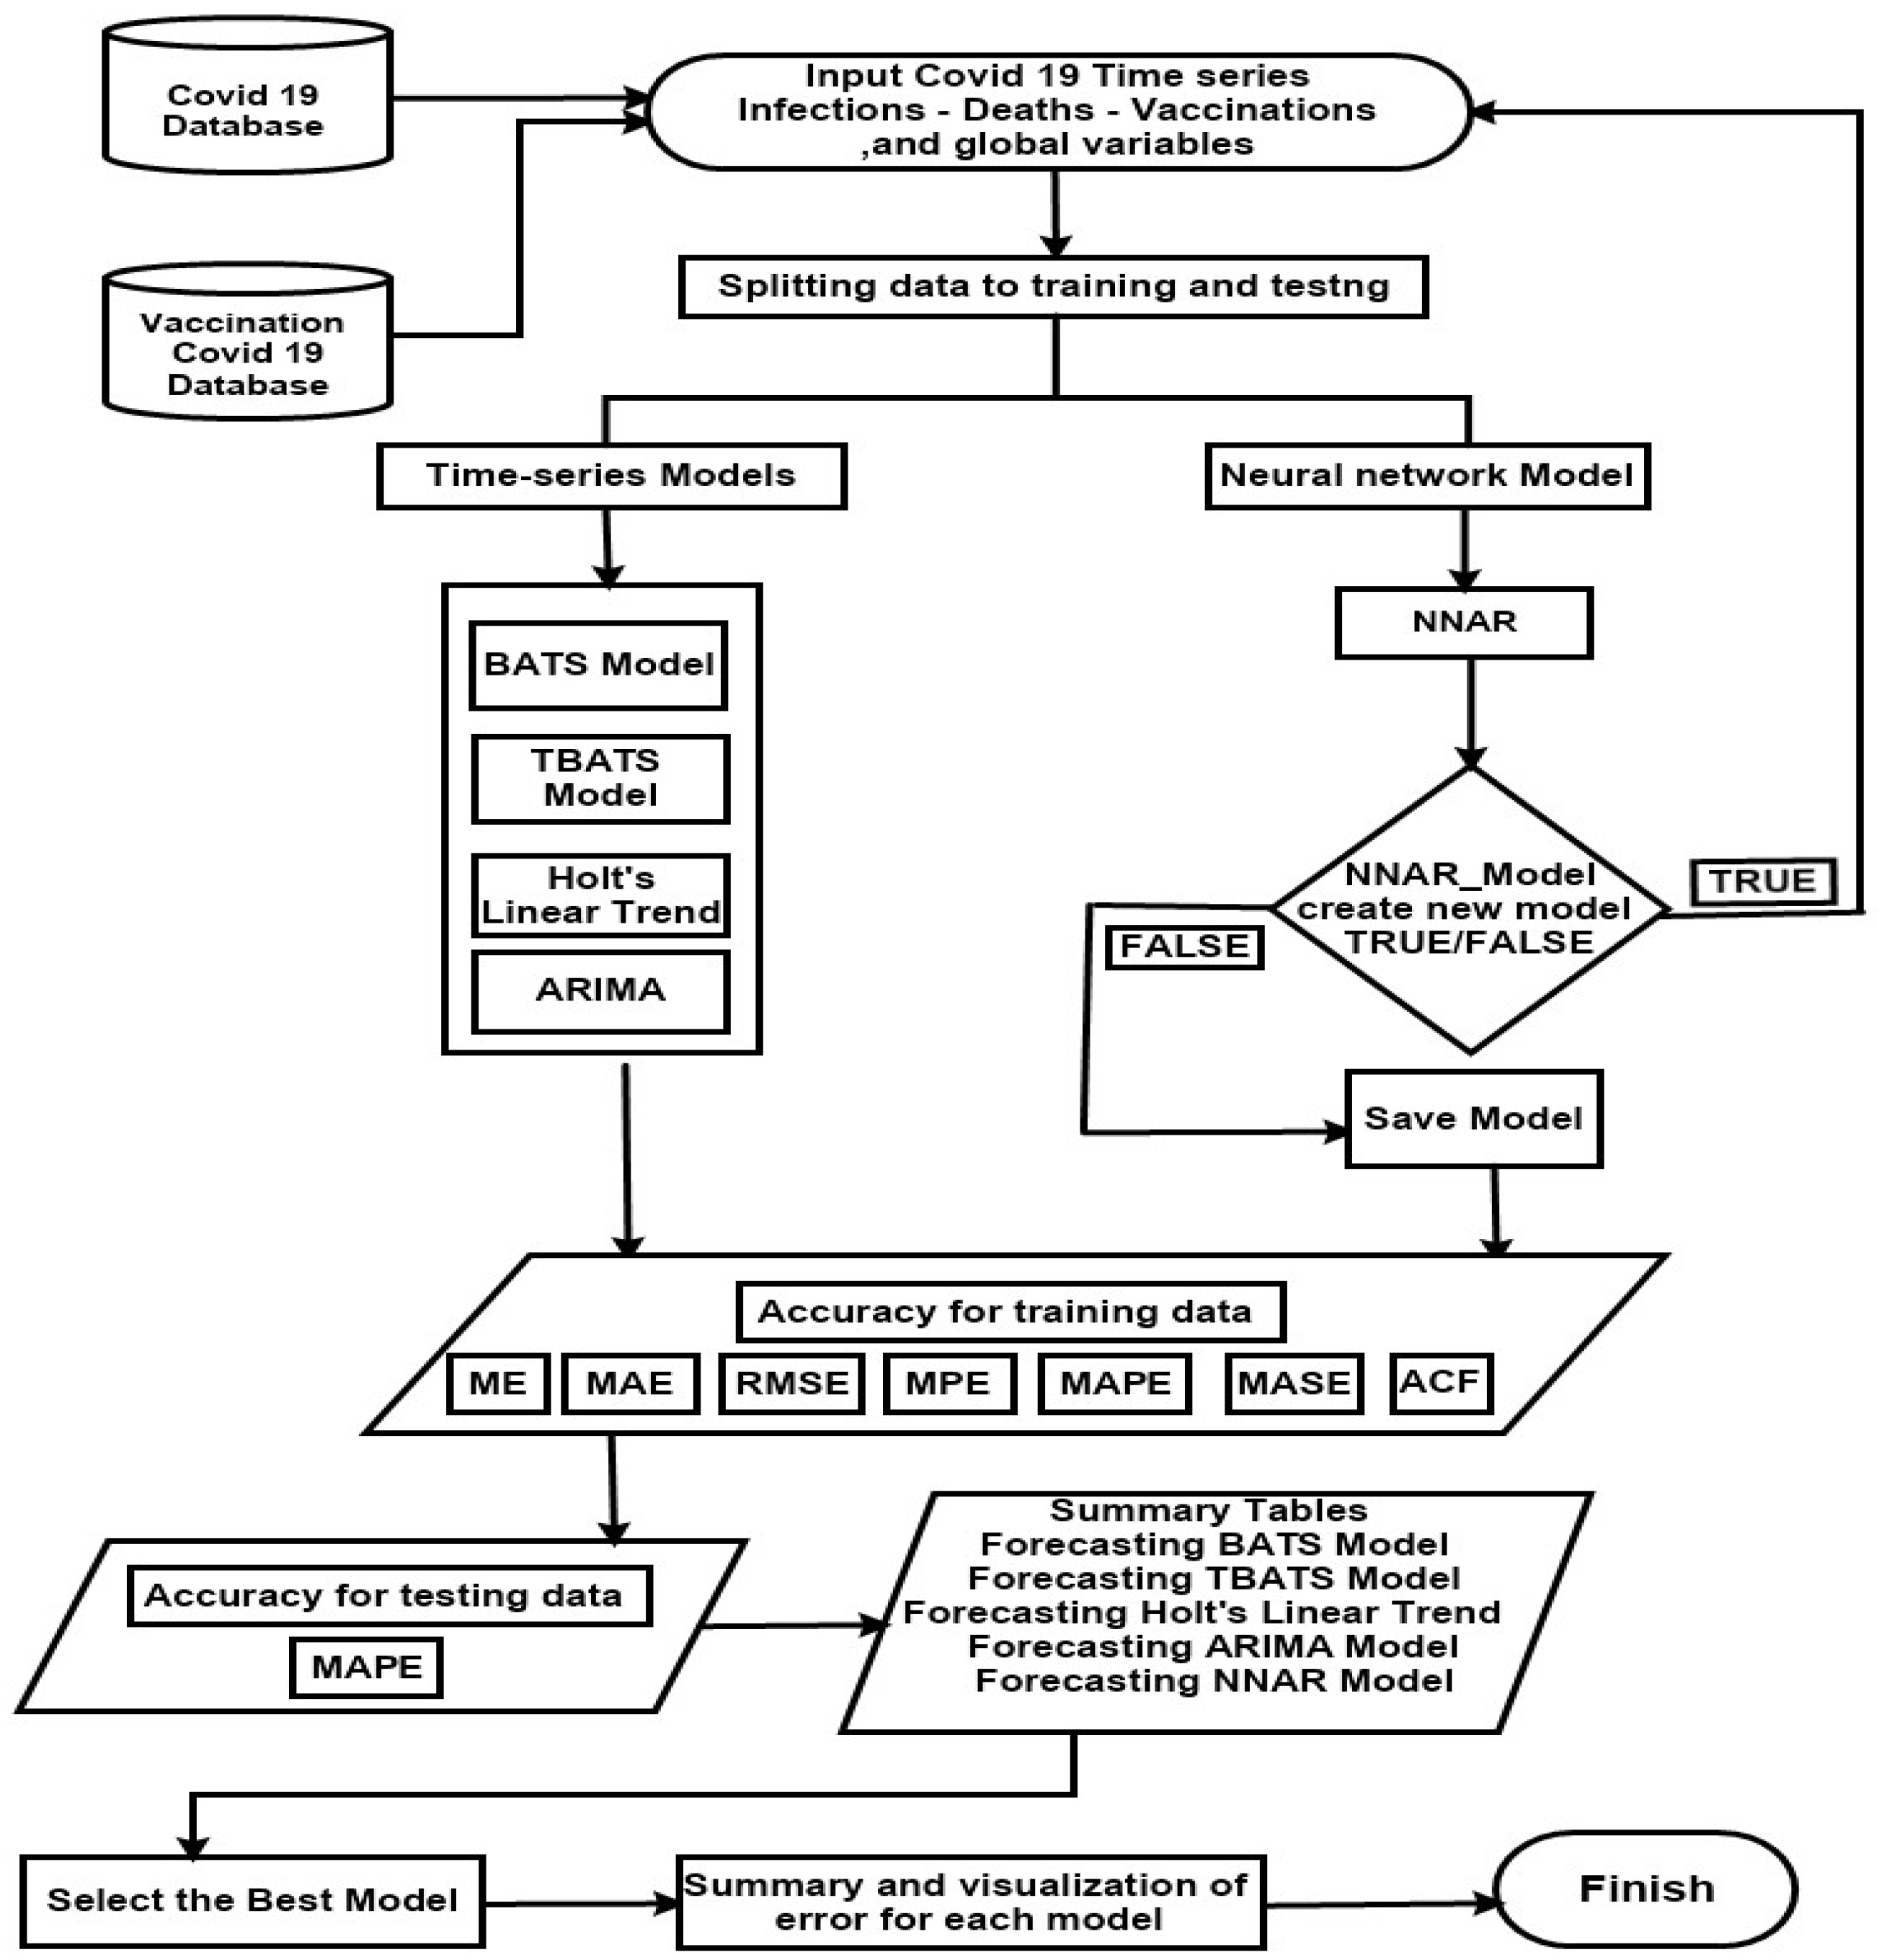
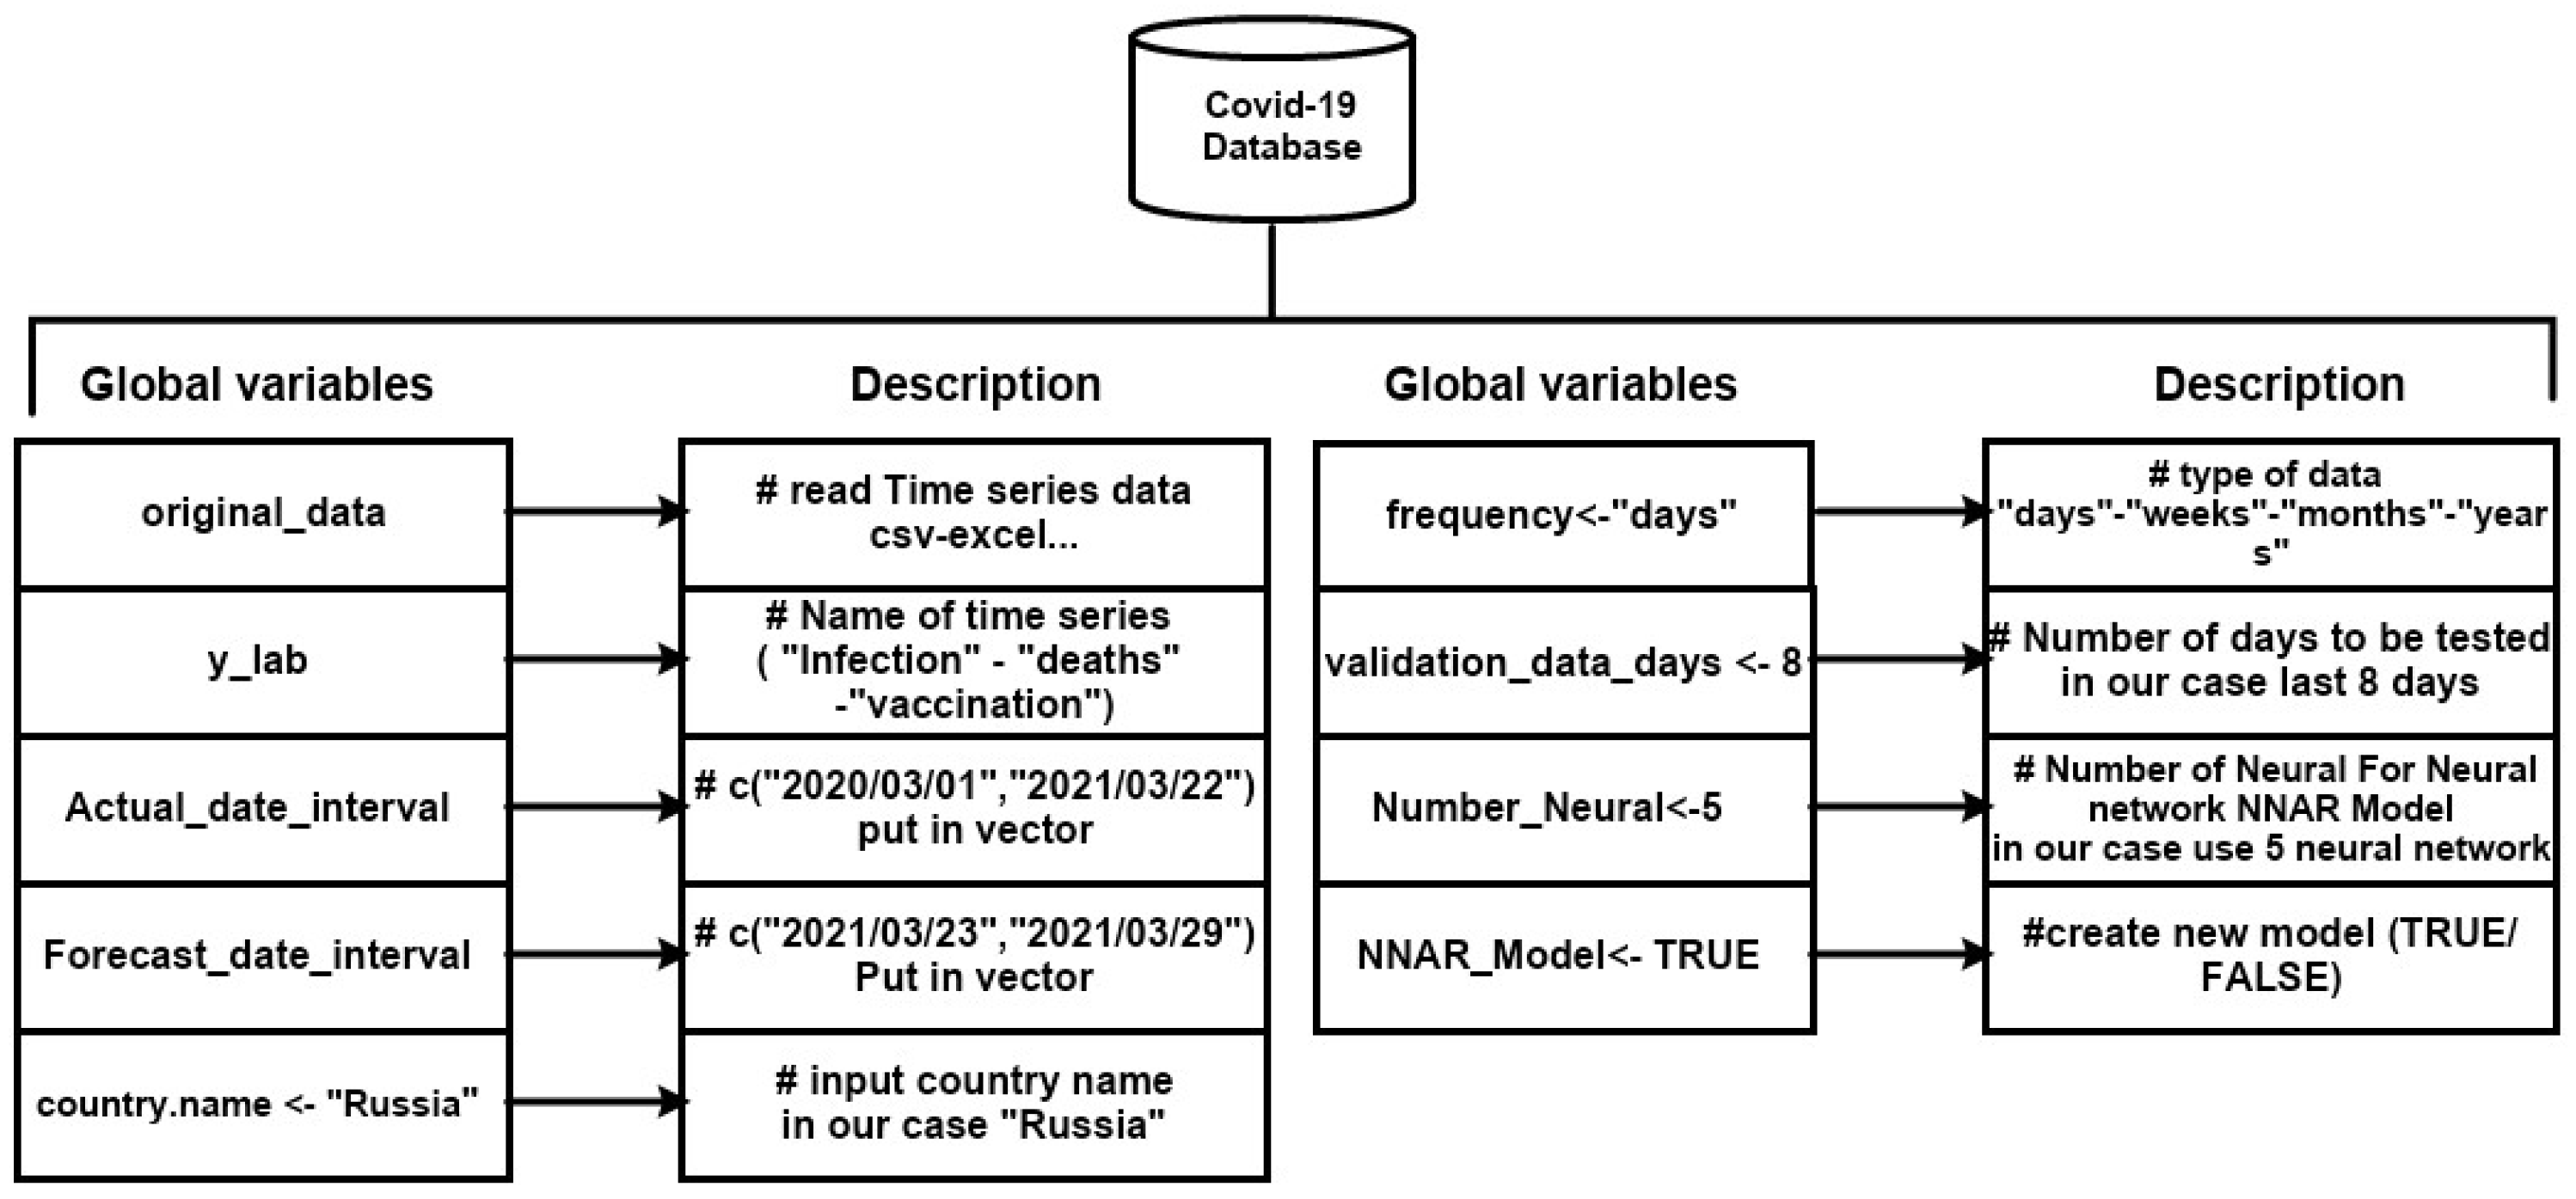
One of the biggest challenges is modeling COVID-19 by using time-series models to obtain very accurate forecasts of infection and death cases. We developed an “Epidemic. TA” system that includes the most important time-series models used for forecasting COVID-19, namely the BATS, TBATS, Holt’s Linear trend, ARIMA, and NNAR models. In [1] we concluded that Holt’s linear trend model was better than the ARIMA model for forecasting COVID-19 in September 2020. In [8] we show that it is impossible produce a highly accurate forecast without updating the model’s parameters during some periods. This pointed to the urgent necessity of developing a system that automatically chooses the best model for forecasting and its best parameters. Figure 1 shows the scheme of the developed software module, which allows choosing the best model with the available initial data, and Figure 2 contains the used global variables. This software module works according to the following algorithm.
The source code for “Epidemic.TA” system using this algorithm is published in github [9].
The inferences of time-series forecasting models ARIMA and SARIMAX (taking seasonality into account) were efficient in producing exact and approximate results [10] and so that system selects the best model from five time-series models forecasting COVID-19 with the least error of MAPE in terms of testing data. Note that the considered system can be used to forecast not only the time-series associated with the spread of the epidemic but also for other time-series (for example, to forecast the production volume and the prices of goods, etc.); this could be a topic for further research.
3. Computational Experiments
Let us consider the results of using “Epidemic.TA” system for forecasting the daily infection cases, cumulative infection cases, cumulative deaths cases, and cumulative vaccination cases [9].
3.1. COVID-19 Datasets
The system uses COVID-19 data from the World Health Organization (WHO) [11] related to COVID-19 infection and deaths cases in the Russian Federation for the period from 1 March 2020 to 22 March 2021 and data for vaccinations [12] from 16 December 2020 to 22 March 2021. For our computational experiments, the following data were used [9]:
- ⮚
- COVID-19 data about infection cases in each region of Russia from 12 March 2020 to 22 March 2021;
- ⮚
- Used the last 8 days for testing daily cases (15 March 2021 until 22 March 2021);
- ⮚
- Used the last 8 days for testing cumulative cases and last 4 days for daily cases;
- ⮚
- COVID-19 data in the Russian Federation from 1 March 2020 to 22 February 2021 and used the last 50 days for testing the forecasting of the third wave;
- ⮚
- COVID-19 data in Spain from 1 March 2020 to 31 December 2020 and testing for the last 30 days.
- ⮚
- COVID-19 data in Italy from 1 March 2020 to 28 February 2021 and testing for the last 4 days.
- ⮚
- COVID-19 data in Russian Federation from 1 March 2020 to 22 February 2021 and testing the last 50 days for forecasting the third wave.
3.2. Analysing the Obtained Results
In Table 2, we represent the error of the time-series and neural network models (NNAR) for daily infection cases in the Russian Federation. Our system selects the best model for the simulation of COVID-19 daily infection cases and, for the considered period, the model ARIMA(2,2,3) was chosen. This model has the minimal MAPE for the considered period [13].
In Table 3, the MAPE for the last 8 days (testing data) for cumulative data for COVID-19 is presented. We can observe that the ARIMA model is the best one for forecasting infection and vaccinations and the BATS model is the best for death cases for the data we have [9]. This fact once again proves our assumption about choosing the best model for the available time-series.
By analyzing the quality of forecasts for different regions, we can observe that different models are chosen to obtain the best result for each region. The choices of models are a consequence of different factors affecting the spreading of the virus and it cannot be obtained without the experiment held.
In order to show the differences in the best obtained model, let us consider eight federal districts of the Russian Federation with different population densities, climates, traditions, and other characteristics. For example, Table 4 and Table 5 represent the best chosen models for different federal districts of the Russian Federation either for cumulative data or for daily data, correspondingly [9].
The system that allows the definition and utilization of the best forecasting model is expedient, since all the considered forecasting methods work in polynomial time and the automatic use of each of them for time-series with a length of 100–200 elements does not require significant computational resources.
Similar results may be obtained for the whole world and separate countries, continents, and regions, which allows us to classify all the examined regions (or countries) into several clusters with the best model used for forecasting the COVID-19 cases. This approach may become advantageous for the superposition of forecasting results for different regions and different countries. This is an open task and it is not only the statistical but also medical research that is still an open problem: The information on the virus is updated every day and the results of new research are constantly appearing.
3.3. The Risk of the Next Wave Analysis
In March 2021, the third wave of COVID-19 spreading in some countries is one of the main problems in the European Union and in the whole world. As of the end of March 2021, there is a decline in the second wave in the Russian Federation. And now the question arises of lifting the previously introduced restrictions for citizens. It should be understood that weakening of some of the restrictions could result in a new wave of the disease, which is what happened in October 2020. In addition, the study of the likelihood of a new wave of the disease is an urgent and unresearched task not only for the regions of the Russian Federation but also for the whole world.
Undoubtedly, the dynamics of the spread of COVID-19 in each individual country are significantly different, as well as the different models that allow the best forecasts to be obtained. In some countries, the second wave is now occurring (Indonesia and Switzerland) while in other countries the first wave has not yet been completed (India). There are countries that are living in the third wave (Netherlands and Germany), those that have passed the third wave (Israel, Spain, and USA), and there are countries for which data cannot allow, in general, the frequency of the process to be judged (Czech Republic).
Moreover, one more delusion in COVID-19 forecasting is the great number of sophisticated factors, such as the different restrictions of different countries, that affect the spreading of the virus. It seems obvious that these factors must be taken into account. For example, in [14] the authors apply their model to compare several intervention strategies, including restrictions on international air travel, case isolation, home quarantine, social distancing with varying levels of compliance, and school closures. A lot of these factors such as ‘‘school closures’’ are not found to bring decisive benefits unless they are coupled with high levels of social distancing compliance. In our computational experiment, we did not take into account any factors influencing the spreading of virus. The examples are made for the Russian Federation, where the last and the only lockdown ended on 12 May 2020 (Truthfully, it is very hard to call it a lockdown taking into account the Russian attitude of ‘‘I don’t care’’) and the strongest restrictions concern the flights between some countries.
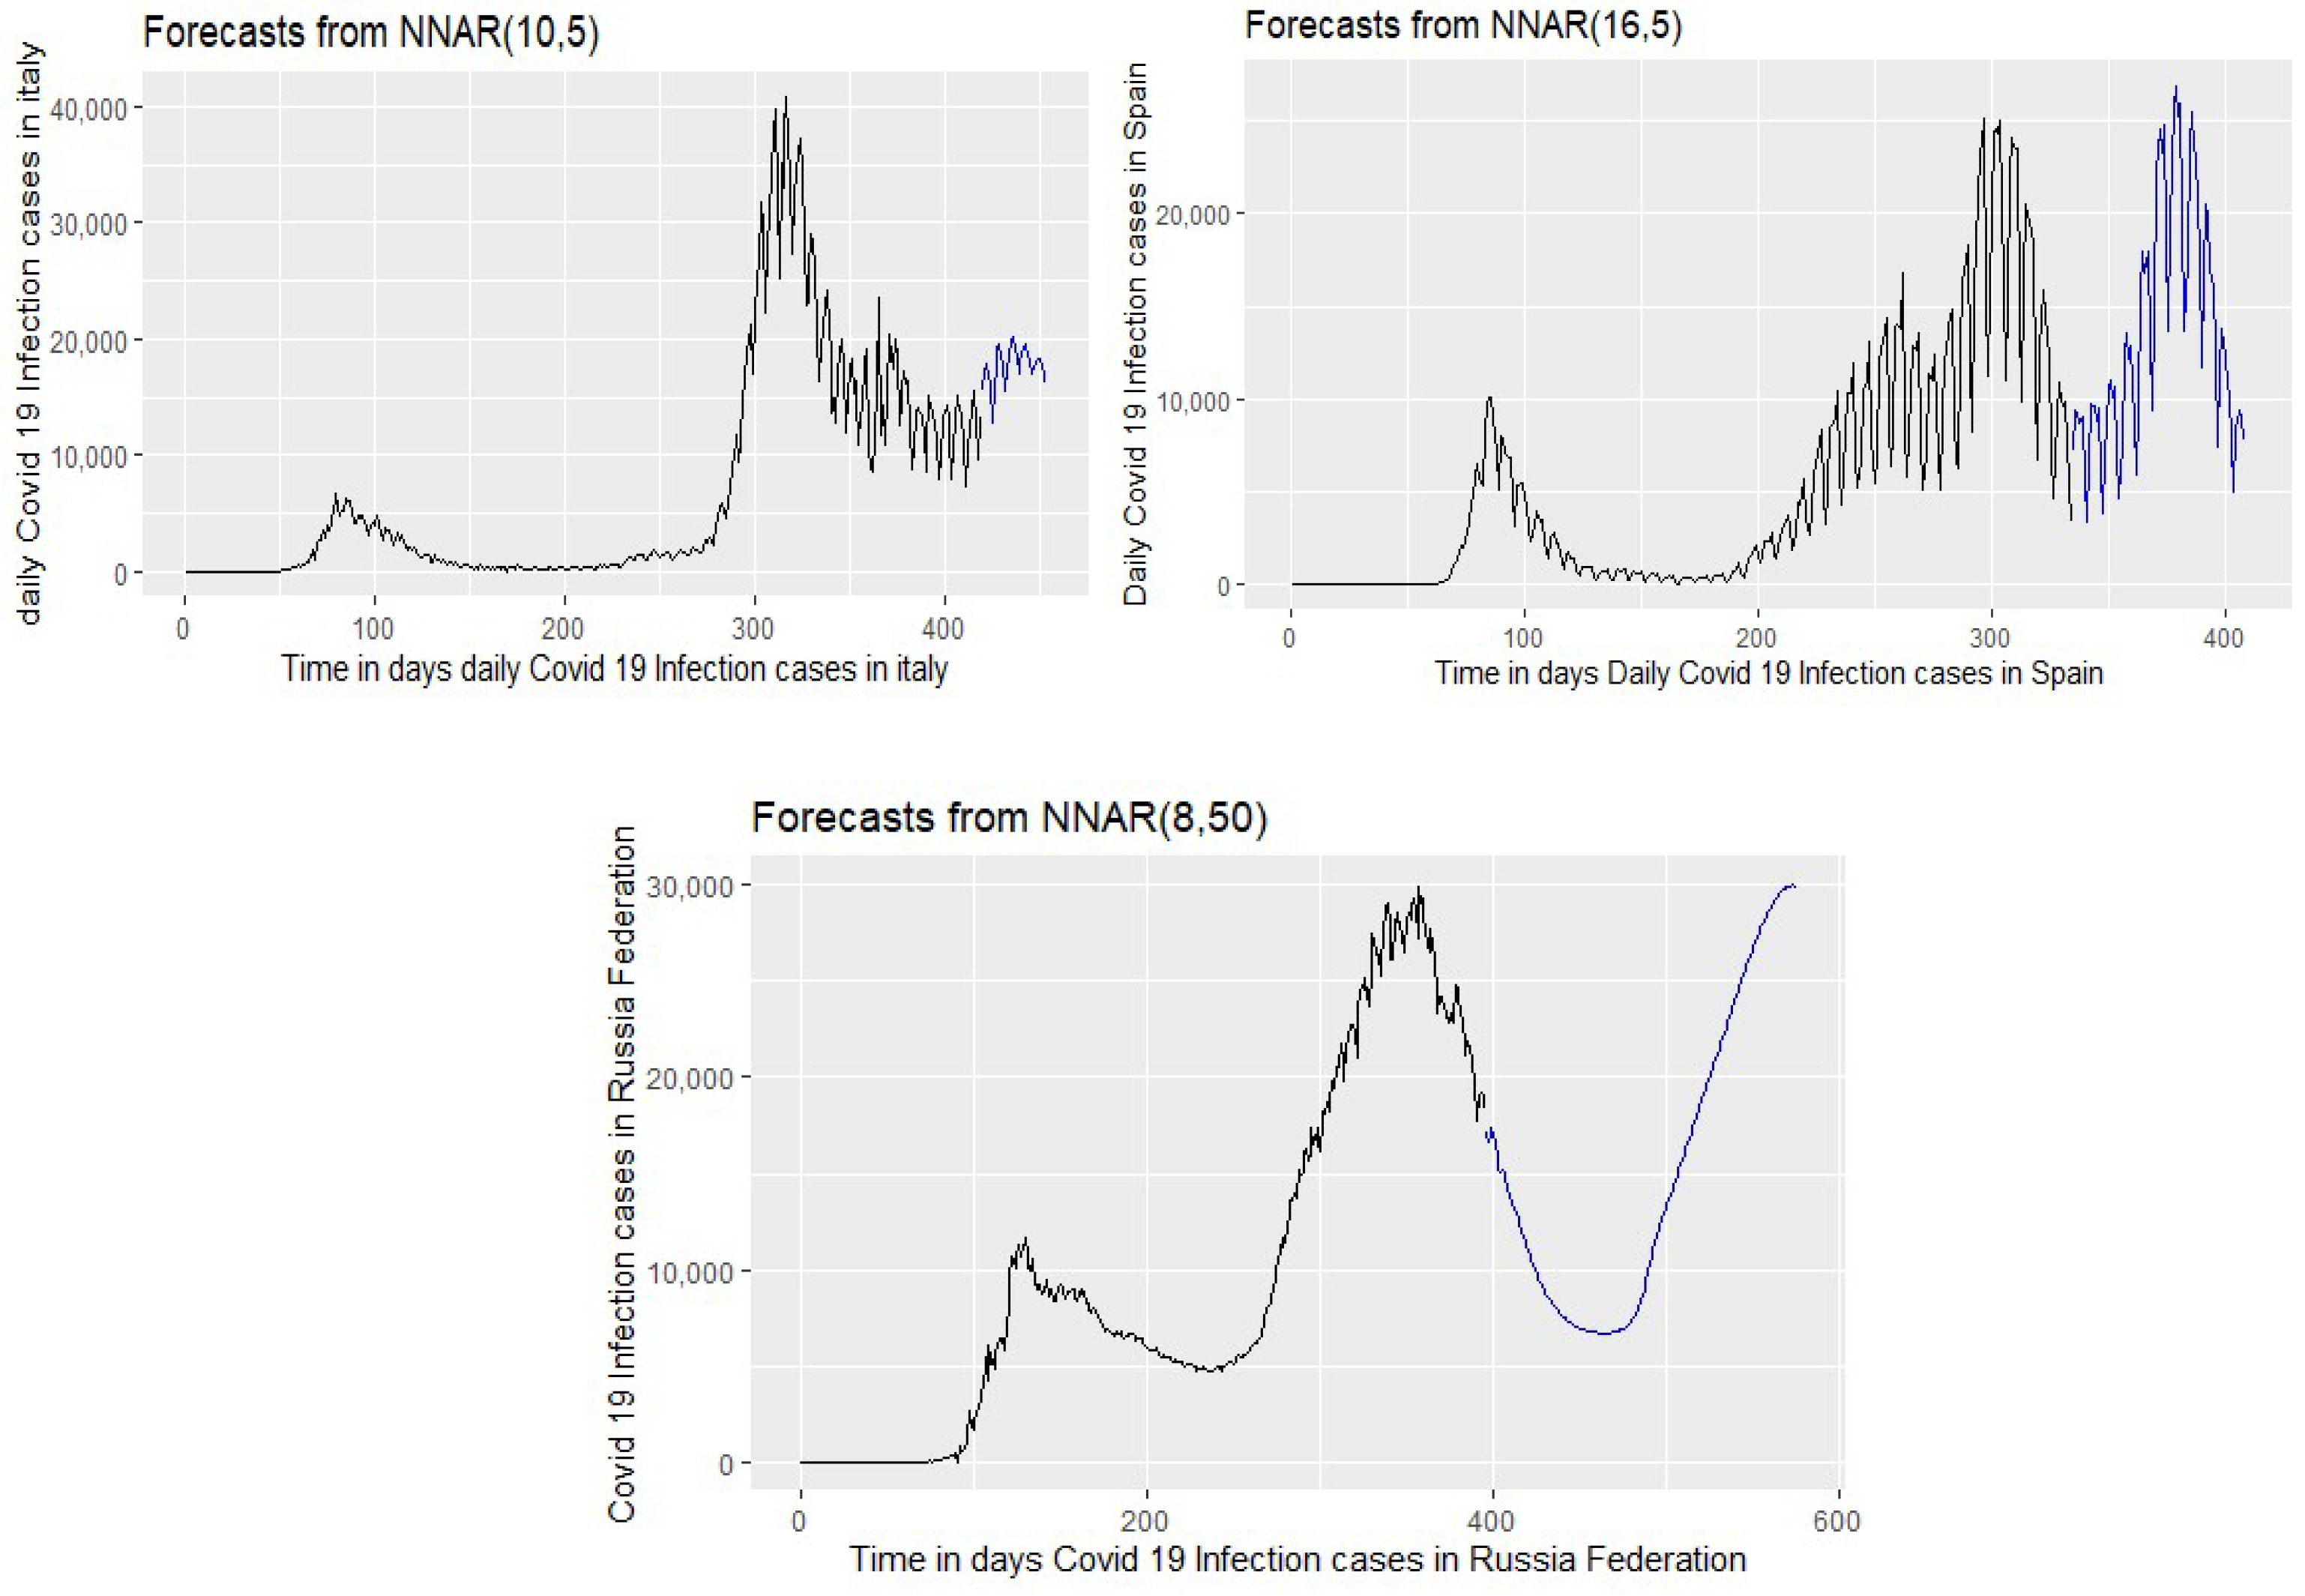
Let us consider the application of the forecasting system developed for the prediction of the probability of the next wave in the Russian Federation. The use of the system for medium-term forecasting (NNAR model) predicts the beginning of the next wave (rise in incidence) in mid-July (see Table 6 and Figure 3).
As we can observe, Russia, Italy, and Spain have different restrictions and they change these restrictions according to the current situation with virus spreading. Nevertheless, NNAR model allows accurate forecasts to be obtained even without taking into account the existence or absence of these restrictions. Hence, the restrictions do not influence the quality of forecasting using NNAR model.
Obviously, this forecast was obtained due to the existing system of restrictions introduced in the considered state. In order to obtain these results, we used NNAR model with five neurons on the hidden level for Italy and Spain for the test periods mentioned before. As for Russia, we needed 50 neurons because the value of testing data had to be increased.
From the WHO data, the inception of the virus in the world is on 1 March 2020, which is represented by time zero on the x-axis in Figure 3.
We used the data for Italy and Spain, since the nature of the spread of coronavirus infection in these countries had clearly defined periods of the rise and fall in infection and there are sufficiently detailed data. We considered the time-series from 1 March 2020 to 28 February 2021 for Italy and the time-series from 1 March 2020 to 31 December 2020 for Spain. The forecast results are also shown in Table 6. For experiments with the peak on the next wave, we take a horizon equal to 45 days for the third wave in Spain, 31 days for Italy, and 129 days for Russian Federation.
Analyzing the results, we note that for the time-series for Italy and in Spain, accurate results were obtained on the date of the onset of the rise in incidence, which coincides with the actual values [9].
Thus, the developed system can be used for medium-term forecasting for up and downtrends in the number of reported cases of COVID-19, which is very important when making management decisions and canceling or introducing various restrictions for citizens.
4. Conclusions
In conclusion, we considered the developed forecasting system and “Epidemic.TA” can automatically select the appropriate model to obtain forecasts with very low MAPE because of the choice of the best model for the time-series used as input data. Surely, the used time-series forecasting can have significant limitations due to time-changing conditions, such as the decisions of the health authorities (e.g., confinements) and vaccine availability, etc. That is, under real circumstances, time-series forecasting can generally be accurate only in the short term. Nevertheless, if we fix the current circumstances (lockdown constraints, vaccine availability and the velocity of vaccination, the capacity of hospitals, etc.) we can observe the scenario of the development situation according to the given circumstances in mid-term or long-term forecasting. This and obtaining the long-term forecasting models are the topics for our future research.
Note that our algorithm for this system is extensible and various modules can be connected to it, providing the construction of forecasts by various methods. Thus, using the considered algorithm scheme it is possible to create a flexible calling function that permits the choice, from the set of implemented methods, of the model with the best result in accordance to a given criterion. This system uses the numbers only, without analyzing any factors influencing the process itself. Hence, the methods used for choosing the best model for forecasting COVID-19 cases may be used for obtaining the forecasts for the other time-series. This topic is an opportunity for further research. To obtain accurate results, it is recommended that the data are updated at least on a weekly basis because there are some factors affecting the process of the virus spreading that can significantly affect the model choice and accuracy of the obtained forecasts.
The open task is testing Epidemic.TA for epidemic data for different countries and the different manners of COVID-19 infections spreading to obtain low MAPE forecasting of peaks for further waves and to define the optimal criteria for choosing the best model while taking into account different exogenous factors (such as lockdown period, vaccination process, etc.).
One of the directions of future research is defining the methods of extending the Epidemic.TA package with deep learning models (LSTM and others), exploring the non-linear models, and the development of our own methods of forecasting that is appropriate for COVID-19 time-series.
Acknowledgments
The work was supported by the Ministry of Science and Higher Education of the Russian Federation (government order FENU-2020-0022).
Conflicts of Interest
The authors declare no conflict of interest.
References
- Abotaleb, M.S.A. Predicting COVID-19 Cases using Some Statistical Models: An Application to the Cases Reported in China Italy and USA. Acad. J. Appl. Math. Sci. 2020, 6, 32–40. [Google Scholar] [CrossRef]
- Tian, Y.; Luthra, I.; Zhang, X. Forecasting COVID-19 cases using Machine Learning. In Proceedings of the 33rd Conference on Neural Information Processing Systems (NeurIPS 2019), Vancouver, BC, Canada, 8–14 December 2020. [Google Scholar] [CrossRef]
- Gecili, E.; Ziady, A.; Szczesniak, R.D. Forecasting COVID-19 confirmed cases, deaths and recoveries: Revisiting established time-series modeling through novel applications for the USA and Italy. PLoS ONE 2021, 16, e0244173. [Google Scholar] [CrossRef] [PubMed]
- Banerjee, M.; Tokarev, A.; Volpert, V. Immuno-epidemiological model of two-stage epidemic growth. Math. Model. Nat. Phenom. 2020, 15, 27. [Google Scholar] [CrossRef]
- Moein, S.; Nickaeen, N.; Roointan, A.; Borhani, N.; Heidary, Z.; Javanmard, S.H.; Ghaisari, J.; Gheisari, Y. Inefficiency of SIR models in forecasting COVID-19 epidemic: A case study of Isfahan. Sci. Rep. 2021, 11, 1–9. [Google Scholar] [CrossRef] [PubMed]
- Hussain, N.; Li, B. Using R-studio to examine the COVID-19 Patients in Pakistan Implementation of SIR Model on Cases. Int. J. Sci. Res. Multidiscip. Stud. 2020, 6, 54–59. [Google Scholar]
- Ponce, M. covid19.analytics: An R Package to Obtain, Analyze and Visualize Data from the Corona Virus Disease Pandemic. arXiv 2020, arXiv:2009.01091v1. [Google Scholar]
- Makarovskikh, T.A.; Abotaleb, M.S.A. Automatic Selection of ARIMA Model Parameters to Forecast COVID-19 Infection and Death Cases. Bull. South Ural State Univ. Ser. Comput. Math. Softw. Eng. 2021, X, Z1–Z2. [Google Scholar]
- Abotaleb, M.; Makarovskikh, T. Epidemic.TA-System. Available online: https://github.com/abotalebmostafa11/Epidemic.TA-System (accessed on 29 June 2021).
- Bhangu, K.S.; Sandhu, J.K.; Sapra, L. Time-series analysis of COVID-19 cases. World J. Eng. 2021. [Google Scholar] [CrossRef]
- World Health Organization. Available online: https://covid19.who.int/info/ (accessed on 29 June 2021).
- Our World in Data. Available online: https://ourworldindata.org/grapher/daily-COVID-19-vaccination-doses (accessed on 29 June 2021).
- Abotaleb, M.; Makarovskikh, T. Epidemic.TA System for Forecasting COVID-19 Cases Using Time-series and Neural Networks Models. Available online: https://rpubs.com/abotalebmostafa/744347 (accessed on 29 June 2021).
- Chang, S.L.; Harding, N.; Zachreson, C.; Cliff, O.M.; Prokopenko, M. Modelling transmission and control of the COVID-19 pandemic in Australia. Nat. Commun. 2020, 11, 1–13. [Google Scholar] [CrossRef] [PubMed]
Figure 1.
The structure scheme of Epidemic.TA system for forecasting COVID-19 cases.

Figure 2.
The global variables in Epidemic.TA system.

Figure 3.
Forecasting the third wave peak of COVID-19 infection cases in Italy, Spain, and the Russian Federation by using NNAR Model from 12 March 2020. The black lines are actual data, and blue ones are forecasted data.
Figure 3.
Forecasting the third wave peak of COVID-19 infection cases in Italy, Spain, and the Russian Federation by using NNAR Model from 12 March 2020. The black lines are actual data, and blue ones are forecasted data.


Table 1.
The list of acronyms.
| COVID-19 | Corona Virus Disease |
|---|---|
| ARIMA | Autoregressive integrated moving average |
| SIR | Susceptible-Infected-Recovered |
| LSTM | Long Short-Term Memory |
| BATS/TBATS | Trigonometric, Box-Cox transformation, ARMA, Trend, Seasonality |
| NNAR | Neural network autoregressive Models |
| SARIMAX | Seasonal ARIMA |
| ME | Mean Error |
| MAE | Mean absolute error |
| RMSE | Root-mean-square error |
| MPE | Mean percentage error |
| MAPE | Mean absolute percentage error |
| MASE | Mean absolute scaled error |
| ACF | Autocorrelation function |
| WHO | World Health Organization |
| FD | Federal District |
Table 2.
MAPE (%) for daily COVID-19 infection cases in Russian Federation for testing last 4 days.
| Cases | NNAR | BATS | TBATS | Holt’s | ARIMA | ARIMA Model | Best Mode |
|---|---|---|---|---|---|---|---|
| Infections | 2.5 | 5.589 | 4.29 | 3.319 | 1.638 | ARIMA(2,2,3) | ARIMA |
Table 3.
MAPE for cumulative cases of Covid-19 (infection, deaths, and vaccinations) in the Russian Federation for testing last 8 days.
Table 3.
MAPE for cumulative cases of Covid-19 (infection, deaths, and vaccinations) in the Russian Federation for testing last 8 days.
| Cases | NNAR | BATS | TBATS | Holt’s | ARIMA | ARIMA Model | Best Mode |
|---|---|---|---|---|---|---|---|
| Infections | 0.399 | 0.063 | 0.071 | 0.059 | 0.009 | ARIMA(1,2,4) | ARIMA |
| Deaths | 0.31 | 0.037 | 0.038 | 0.084 | 0.084 | ARIMA(3,2,2) | BATS |
| Vaccinations | 4.747 | 1.485 | 2.375 | 1.752 | 1.081 | ARIMA(1,2,4) | ARIMA |
Table 4.
Model selection for forecasting cumulative data of COVID-19 infection cases in the Russian Federation Federal Districts (FD) on testing data based on MAPE (%) for last 8 days.
Table 4.
Model selection for forecasting cumulative data of COVID-19 infection cases in the Russian Federation Federal Districts (FD) on testing data based on MAPE (%) for last 8 days.
| Fed.Distr. | NNAR | BATS | TBATS | Holt’s | ARIMA | ARIMA Model | Best Mode |
|---|---|---|---|---|---|---|---|
| Far Eastern FD | 0.192 | 0.017 | 0.005 | 0.042 | 0.012 | ARIMA(2,2,2) | TBATS |
| Volga FD | 0.282 | 0.003 | 0.042 | 0.056 | 0.004 | ARIMA(2,2,3) | BATS |
| Northwestern FD | 0.373 | 0.036 | 0.044 | 0.039 | 0.002 | ARIMA(1,2,1) | ARIMA |
| North Caucasian FD | 0.346 | 0.044 | 0.036 | 0.038 | 0.039 | ARIMA(3,2,2) | TBATS |
| Siberian FD | 0.193 | 0.004 | 0.038 | 0.049 | 0.006 | ARIMA(1,2,2) | BATS |
| Ural FD | 0.458 | 0.035 | 0.013 | 0.026 | 0.033 | ARIMA(1,2,4) | TBATS |
| Central FD | 0.387 | 0.088 | 0.084 | 0.093 | 0.067 | ARIMA(2,2,2) | ARIMA |
| Southern FD | 0.327 | 0.048 | 0.045 | 0.071 | 0.039 | ARIMA(3,2,2) | ARIMA |
Table 5.
Model selection for the forecasting of daily COVID-19 infection cases in the Russian Federation federal districts on testing data based on MAPE for last 4 days.
Table 5.
Model selection for the forecasting of daily COVID-19 infection cases in the Russian Federation federal districts on testing data based on MAPE for last 4 days.
| Fed.Distr. | NNAR | BATS | TBATS | Holt’s | ARIMA | ARIMA Model | Best Mode |
|---|---|---|---|---|---|---|---|
| Far Eastern FD | 9.064 | 1.614 | 1.646 | 3.007 | 2.038 | ARIMA(0,2,3) | BATS |
| Volga FD | 2.503 | 0.727 | 1.478 | 1.376 | 1.177 | ARIMA(4,2,1) | BATS |
| Northwestern FD | 4.641 | 0.998 | 3.976 | 1.711 | 0.656 | ARIMA(4,2,1) | ARIMA |
| North Caucasian FD | 10.626 | 1.905 | 2.257 | 2.452 | 1.78 | ARIMA(4,2,1) | ARIMA |
| Siberian FD | 3.2 | 1.568 | 1.182 | 1.106 | 1.037 | ARIMA(4,2,1) | ARIMA |
| Ural FD | 1.819 | 2.49 | 1.71 | 1.888 | 1.668 | ARIMA(4,2,1) | ARIMA |
| Central FD | 10.352 | 14.184 | 3.9 | 3.708 | 8.074 | ARIMA(2,1,2) | Holt |
| Southern FD | 0.703 | 4.238 | 4.174 | 4.172 | 4.328 | ARIMA(0,2,3) | NNAR(2,5) |
Table 6.
Model selection for forecasting the third wave peak in Spain, Italy, and Russia and the obtained data of the third wave peak.
Table 6.
Model selection for forecasting the third wave peak in Spain, Italy, and Russia and the obtained data of the third wave peak.
| Country | Model | Forecast Date | Actual Date |
|---|---|---|---|
| Italy | NNAR(10, 5) | 13 March 2021 | 13 March 2021 |
| Spain | NNAR(16, 5) | 17 January 2021 | 17 January 2021 |
| Russian Federation | NNAR(8, 50) | 19 July 2021 | ---- |
Publisher’s Note: MDPI stays neutral with regard to jurisdictional claims in published maps and institutional affiliations. |
© 2021 by the authors. Licensee MDPI, Basel, Switzerland. This article is an open access article distributed under the terms and conditions of the Creative Commons Attribution (CC BY) license (https://creativecommons.org/licenses/by/4.0/).
Share and Cite
MDPI and ACS Style
Abotaleb, M.; Makarovskikh, T. System for Forecasting COVID-19 Cases Using Time-Series and Neural Networks Models. Eng. Proc. 2021, 5, 46. https://0-doi-org.brum.beds.ac.uk/10.3390/engproc2021005046
AMA Style
Abotaleb M, Makarovskikh T. System for Forecasting COVID-19 Cases Using Time-Series and Neural Networks Models. Engineering Proceedings. 2021; 5(1):46. https://0-doi-org.brum.beds.ac.uk/10.3390/engproc2021005046
Chicago/Turabian StyleAbotaleb, Mostafa, and Tatiana Makarovskikh. 2021. "System for Forecasting COVID-19 Cases Using Time-Series and Neural Networks Models" Engineering Proceedings 5, no. 1: 46. https://0-doi-org.brum.beds.ac.uk/10.3390/engproc2021005046