
The Conflicting Developments of RMB Internationalization: Contagion Effect and Dynamic Conditional Correlation †


Center of Excellence in Econometric, Faculty of Economics, Chiang Mai University, Chiang Mai 50200, Thailand
*
Author to whom correspondence should be addressed.
†
Presented at the 7th International Conference on Time Series and Forecasting, Gran Canaria, Spain, 19–21 July 2021.
Eng. Proc. 2021, 5(1), 54; https://0-doi-org.brum.beds.ac.uk/10.3390/engproc2021005054
Published: 14 July 2021
(This article belongs to the Proceedings of The 7th International Conference on Time Series and Forecasting)
Abstract
:As the world’s largest exporter and second-largest importer, China has made exchange rate stability a top priority for its economic growth. With development over decades, however, China now holds excess dollar reserves that have suffered a huge paper loss because of quantitative easing in the United States. In this reality, China has been provoked into speeding RMB internationalization as a strategy to reduce the cost and get rid of the excessive dependence on the US dollar. Thus, this study attempts to investigate the volatility contagion effect and dynamic conditional correlation among four assets, namely China’s onshore exchange rate (CNY), China’s offshore exchange rate (CNH), China’s foreign exchange reserves (FER), and RMB internationalization level (RGI). Considering the huge changes before and after China’s “8.11” exchange rate reform in 2015, we separate the period of study into two sub-periods. The Diagonal BEKK-GARCH model is employed for this analysis. The results exhibit large GARCH effects and relatively low ARCH effects among all periods and evidence that, before August 2015, there was a weak contagion effect among them. However, after September 2015, the model validates a strengthened volatility contagion within CNY and CNH, CNY and RGI, and CNH and RGI. However, the contagion effect is weakened between FER and CNY, FER and CNH, and FER and RGI.
1. Introduction
In the last two decades, China’s gross domestic product (GDP) has been increasing year by year, from 1.34 trillion US dollars in 2001 to 15.42 trillion US dollars in 2020, and currently ranks as the second largest in the world by nominal GDP and the largest in the world by purchasing power parity. The main source of China’s economic growth is the net trade of import and export. The ratio of China’s trade to GDP reached a record high of 64.48% in 2006. Since then, although the share fluctuates, the ratio has remained above 35%. As the world’s largest exporter and second-largest importer, China still needs to use the US dollar and other international currencies when it participates in international trade, overseas investment, or debt. The large fluctuation of the benchmark exchange rate based on the RMB against the US dollar will bring great risks to the domestic economy. Accordingly, China has made exchange rate policy a top priority for its economic development. From 2005, China has shifted gradually from a fixed exchange rate system to a managed floating exchange rate regime to regulate and control its exchange rate by the change of China’s foreign exchange reserves until the exchange rate between the renminbi and the dollar reaches its target level. Although China’s intervention in exchange rate fluctuations has long been a controversial topic, the Chinese government have been longing for a balance between the fixed exchange rate system and the floating exchange rate system.
However, stung by the financial crisis of 2008, the US Fed’s open up to long years of quantitative easing, with the direct creation of base currency, has led to the huge expansion of the balance sheet and China has the largest dollar-denominated foreign exchange reserve assets in the world, which suffered huge paper losses and damage or loss of opportunity cost. To reduce the transaction cost and exchange rate risk, China proposed to promote the internationalization of the RMB in 2009 as a strategic measure to get rid of the excessive dependence on the US dollar by fundamentally reducing the dollar reserves relatively but holding more special drawing rights (SDRs) currencies and gold. Since then, RMB settlement in the international market has been increasing. For example, the RMB joined SDRs on 1 October 2016 to become one of the top five international currencies officially. On 26 March 2018, renminbi-denominated crude oil futures, namely SC1906, were listed, which means that renminbi is trying to peg to crude oil. Until 2020, China had signed currency swap agreements with 40 countries, including Russia, the European Union, the United Kingdom, Japan, Canada, Brazil, South Korea, Thailand, Australia, and so on.
There are many articles examining exchange rate volatility and its impact on trade flows (Jiang, 2014) [1] only analyzing causality within exchange rate and foreign exchange reserves (Mayuresh et al. 2013) [2], or studying RMB internationalization level and exchange rate fluctuation from the perspective of local currency as a trade settlement currency (Wenbing et al. 2014) [3] and reserve currency (Yanjing, 2012) [4]. McKinnon et al. (2014) [5] pointed out that only once the domestic financial system has been well-capitalized and competently regulated is it safe to open the economy to allow the exchange rate to float, and on that basis to internationalize the currency. However, they did not analyze the contradiction between foreign exchange control and internationalization from the direction of measurement in China. This study aims to fill this gap in the literature, to examine the dynamic correlation and volatility contagion effect of exchange rate volatility concerning currency internationalization under foreign exchange reserve interference in China. To accomplish our goal, four different variables of China’s onshore market exchange rate CNY, China’s offshore market rate CNH, renminbi globalization index RGI, and China’s foreign exchange reserves are considered in this study. Studying the volatility of CNY and CNH markets separately will more directly reflect the contradictions and fragmentation of China’s exchange rate system. Selecting the RMB globalization index (RGI) to represent the level of renminbi internationalization (Kelvin et al. 2012) [6] should be more comprehensive than using a single variable, e.g., overseas RMB deposit (Xueceng, 2015) [7] or major currencies accounting for the share of international bond issuance (Zhiwen et al., 2013) [8]. Moreover, the change of China’s foreign exchange reserves (FER) is taken as a substitute variable of China’s foreign exchange intervention (Qiumin, 2015) [9], which is very typical and representative. The contagion effect is a transmission of volatility from shocks arising in one country to other countries, but from the finance perspective, the contagion effect can explain how the shock of one asset can be transferred to other assets. Indeed, some studies use it to explain the market transmission effects, e.g., in major coal markets (M. Thenmozhi et al. 2020) [10]. In this study, we analyze the contagion effect of the above four assets.
From the methodological point of view, the contagion effect is tested by correlation. Dynamic correlation models include, e.g., the Constant Conditional Correlation GARCH, Dynamic Conditional Correlation GARCH, and Full BEKK-GARCH model. The diagonal BEKK-GARCH model is a restricted form of Full BEKK, but DBEKK is mathematically and statistically preferable to the fatally flawed full BEKK and the DCC model, and thus provides a suitable benchmark (McAleer, 2019) [11,12]. In short, the objective of this study is to investigate the volatility contagion effect of four variables in two periods and analyse the dynamic correlations by the Diagonal BEKK GARCH model.
2. Literature Review
There has been no consensus regarding whether there exists a strong correlation between China’s exchange rate, China’s foreign exchange reserves, and renminbi globalization. Marggie et al. (2014) [13] have investigated the volatility of CNY and CNH exchange rates by GARCH and EGARCH models. Their results showed that the exchange rate volatility is asymmetric. Zhilai (2019) [14] divided CNY and CNH data from 2012 to 2018 into three different periods to make the DCC-GARCH model and proved that the intensity of the volatility spillover effect was different at different time nodes. Qiumin (2015) [9] estimated the exchange rate volatility under the condition of foreign exchange intervention by the GARCH-VaR model. Their results show that the use of China’s foreign exchange reserve intervention effectively reduces the exchange rate fluctuations in the period from 2008 to 2015. Since 2012, the International Monetary Institute of Renmin University of China has regularly released the RMB Internationalization Report every year. Yanjing (2012) [4] undertook an econometric analysis of the historical evolution of the composition of the current international reserve currency (1980–2008), and concludes that RMB has preliminary met the conditions for internationalization. Zhiwen et al. (2013) [8] documented the exchange rate volatility and local currency internationalization on the Australian Dollar, finding that the greater exchange rate volatility of the AUD against the USD has a significantly negative effect on AUD internationalization. This has an important reference value for RMB internationalization. Luyao (2018) [15] pointed out that the development level of China’s financial market has a certain degree of influence on RMB internationalization, but it is not significant. Foreign exchange reserves are not only conducive to regulating China’s balance of international payments, but also play an important role in stabilizing the RMB exchange rate. The volatility of the exchange rate has a significant negative effect on RMB internationalization. There is no agreement on the effect of the degree of currency internationalization on the size of a country’s foreign exchange reserves. Some studies believe that the degree of currency internationalization has a relationship with the scale of foreign exchange reserves of a country, increasing at first and then decreasing (Zhu Guoping et al. 2014) [16], while others believe that there is a negative relationship between foreign exchange reserves and the degree of currency internationalization (Zhang et al., 2011) [17]. Lian et al. (2017) [18] believed that foreign exchange reserves have a phased impact on the internationalization of the local currency. In the initial stage, it promotes the internationalization of local currency, while excessive accumulation hinders it. Mengnan (2017) [19,20] founded that the internationalization degree of the Japanese yen is negatively correlated with the exchange rate level of the Japanese yen against the US dollar. The influence of the scale of Japan’s foreign exchange reserves on the internationalization of the yen depends on the relative size of foreign exchange reserves. The restraining effect of the size of foreign exchange reserves on the internationalization of the yen is due to the “insufficient” rather than the “excessive” size of Japan’s foreign exchange reserves.
3. Materials and Methods
3.1. Methods
To examine the magnitude of volatility contagion across the provided series, we employ a diagonally restricted BEKK-GARCH model. The estimation of the model involves the joint estimation of both its mean as well as variance equations. We specify the model as follows.
Given the mean equation:
Given the diagonal (or scalar) BEKK model, DBEKK-GARCH (1,1), namely:
where A and B are diagonal (or scalar) matrices, Ω = is positive semidefinite, the matrix can be represented as:
Then, each conditional variance and covariance equation are given as:
where ,, , , , and represent the conditional covariance between CNY return and CNH return, CNY return and FER return, CNY return and RGI return, CNH return and FER return, CNH return and RGI return, and RGI return and FER return, respectively.
3.2. Materials
The data as Table 1 employed in this study are the monthly data of exchange rate central parity rate on CNY and CNH markets, foreign reserve assets in China (FER), and RMB internationalization index (RGI). Considering the different development periods of China’s onshore market (CNY) and offshore market (CNH), the data were selected from August 2010 to January 2021. The monthly returns are computed as the difference of the natural logarithm of all consecutive assets.
4. Empirical Results
4.1. Descriptive Statistics
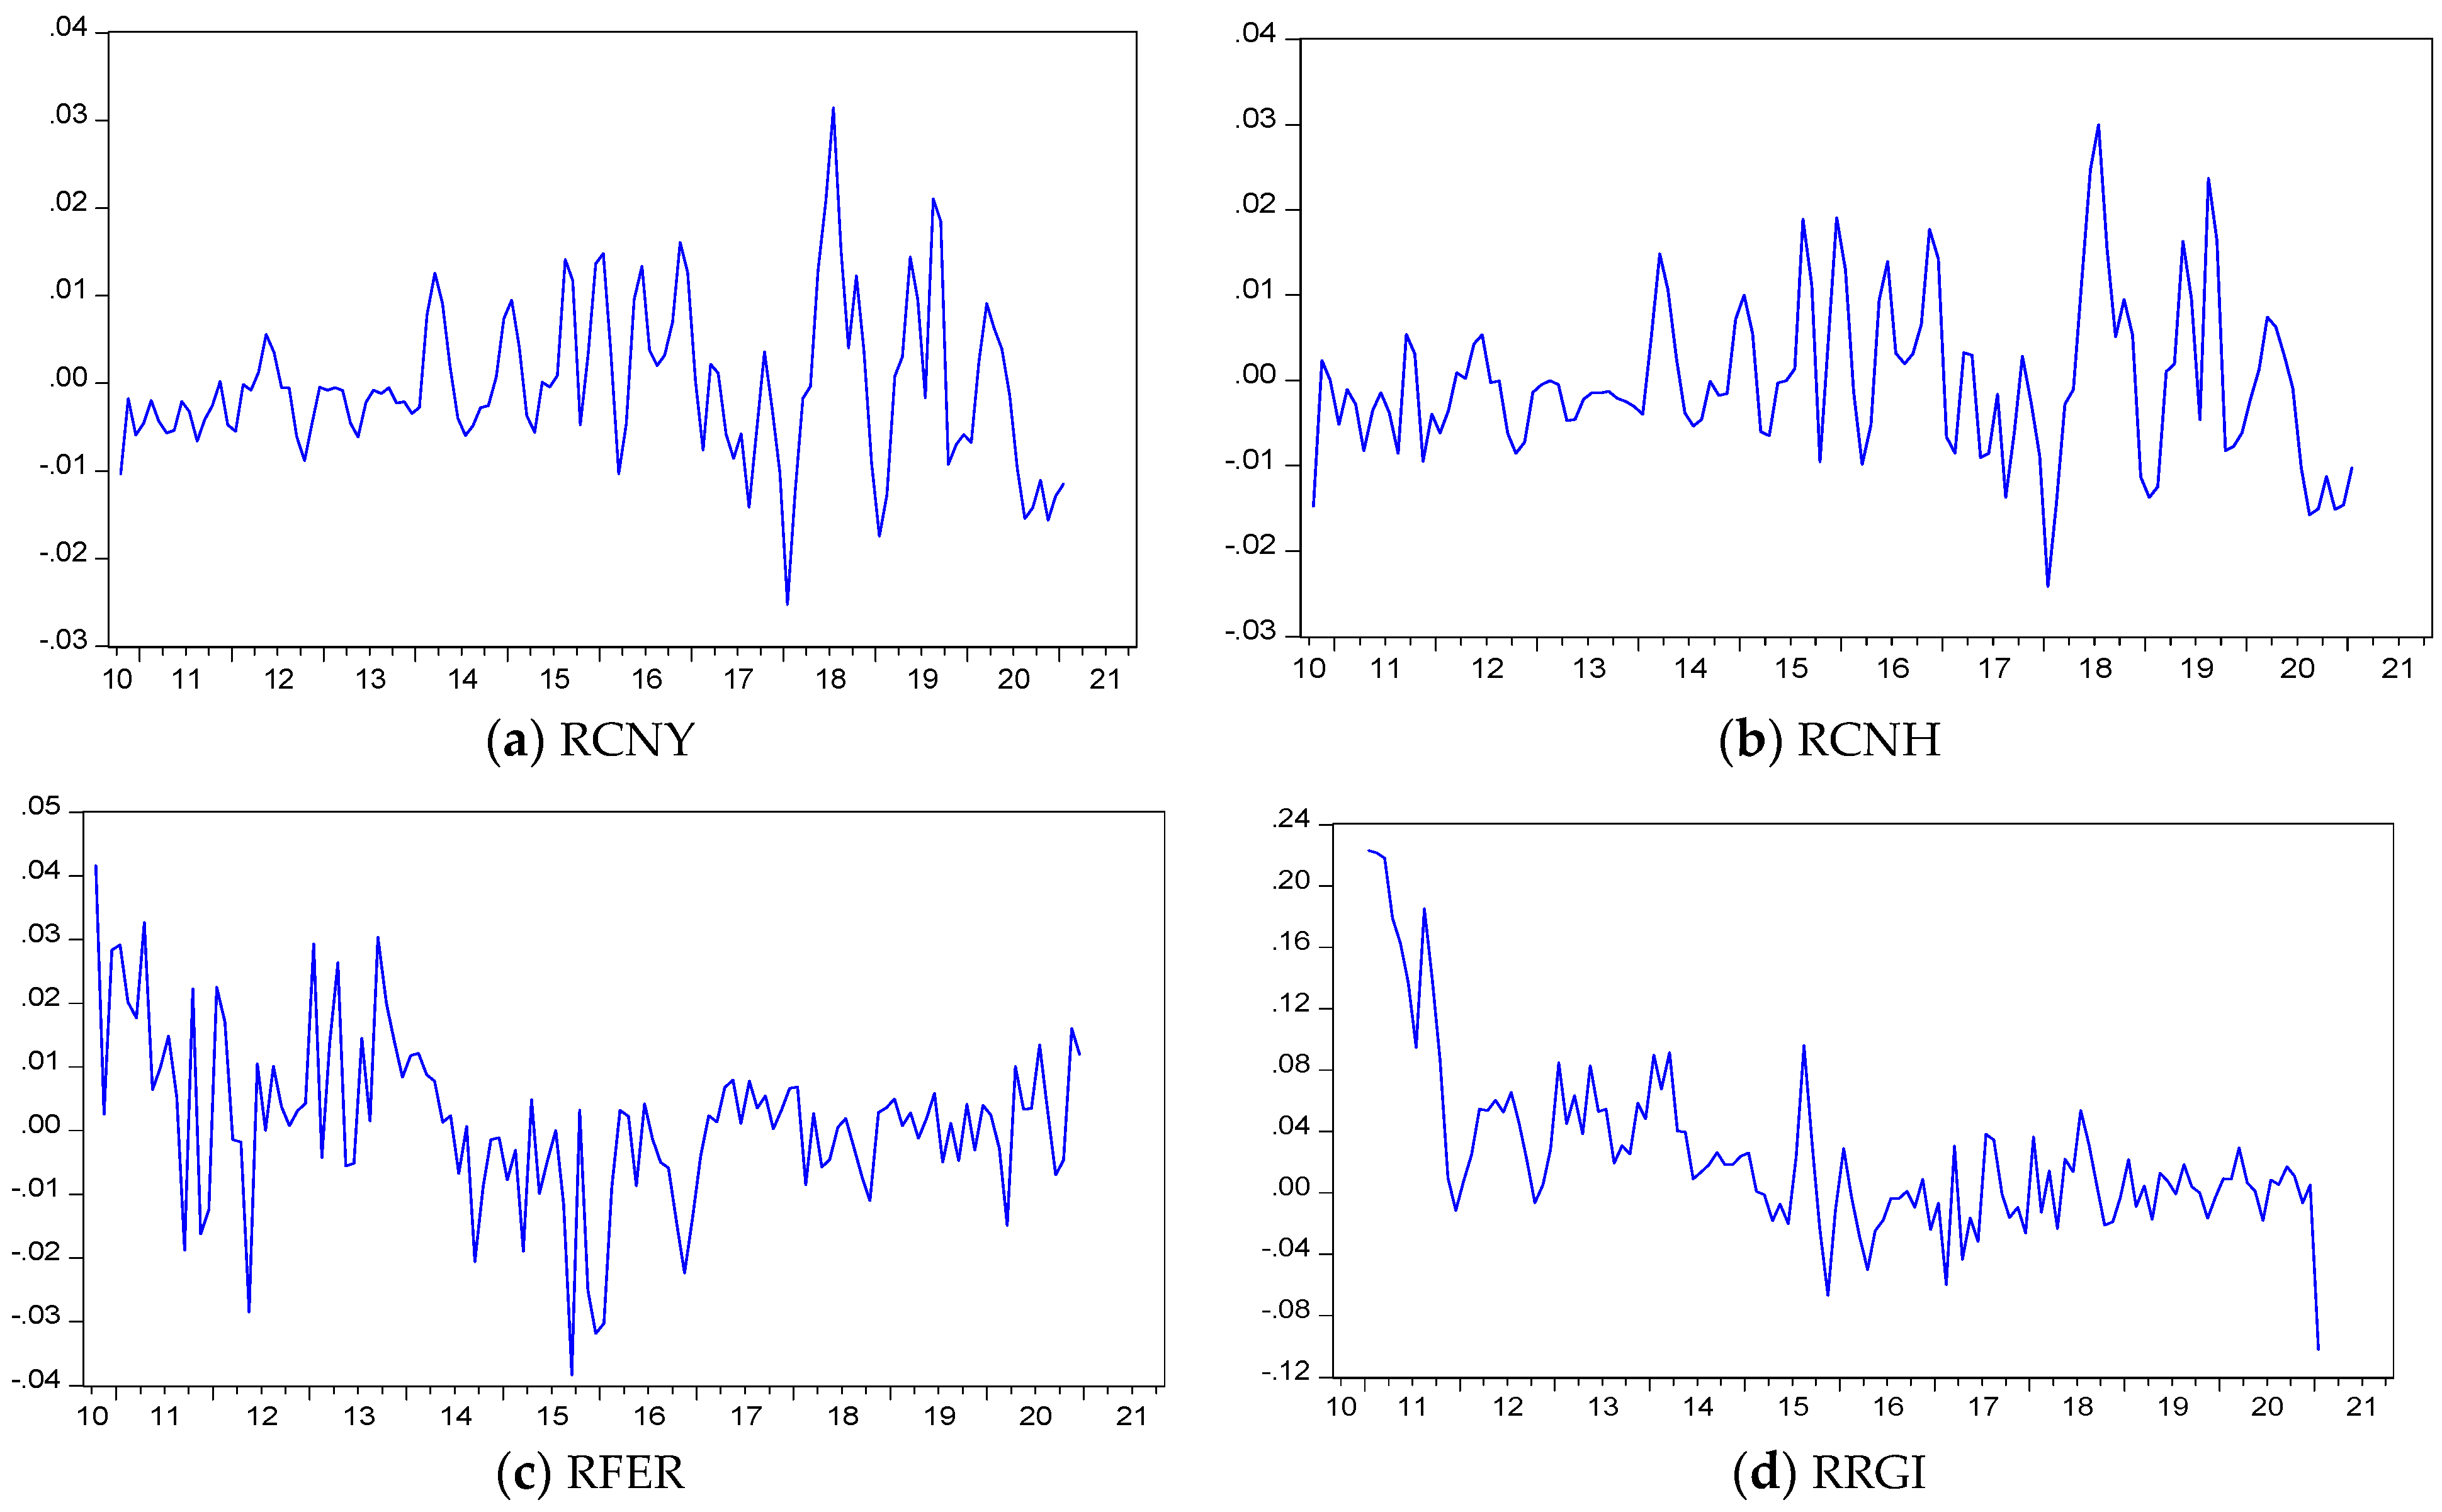
In Table 2, the first R for returns, it can be seen that the standard deviation of the four variables indicates fluctuation degree of the variables is small, among which RGI has the largest fluctuation degree, followed by FER, CNH, and CNY. All skewness is not zero, which means all the rates of return are not symmetric. The skewness of CNY, CNH, and RGI is greater than 0, indicating that the sequence is right-skewed and has the characteristic of sharp peak and thick tail. The skewness of FER is less than 0, indicating that the sequence is left-skewed. All kurtosis is larger than 3, indicating that these sequences have excessive kurtosis, which means all assets return steeper than the normal distribution. Besides, all Jarque–Bera test values are large (12.0259, 10.8568, 7.6614, 120.4339) and significant at the 5% level, which means the returns of all series are not a normal distribution. Rather, they are peaked distributions with fat tails. The more obvious the thick tail is, the longer the state lasts, and the historical information is important for the future forecast. Figure 1 exhibits the monthly returns series corresponding to CNY, CNH, FER, and RGI and exposes the differences in their fluctuations.
4.2. Unit Root Test
As the result of the ADF test has shown in Table 3, the large negative values in all cases. A p-value of all sequences less than 0.01 indicate rejection of the null hypothesis at the 1% level. Thus, the analysis shows that the rate of return sequences has no unit root and satisfies the stationary condition, suitable for further analysis.
4.3. Volatility Contagion Effect
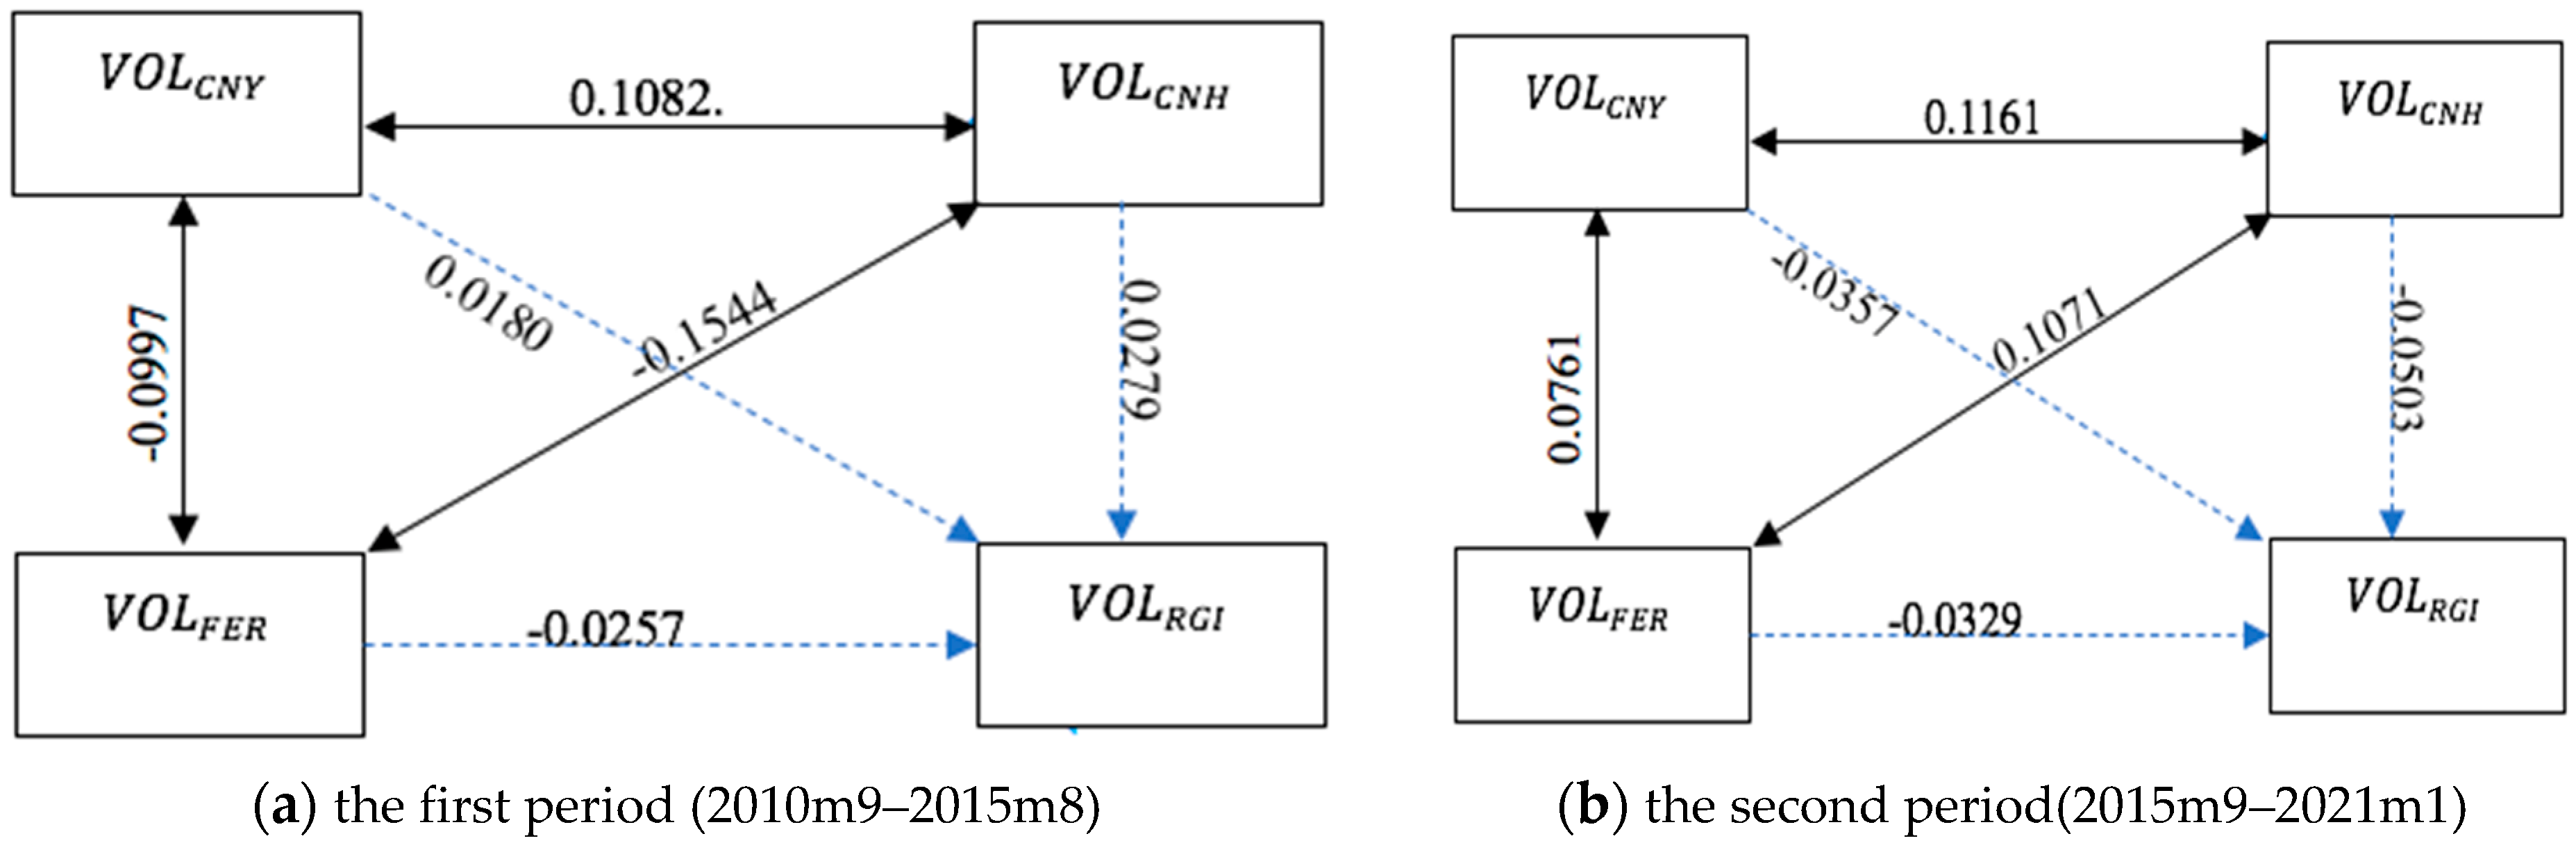
As mentioned in the introduction part, the contagion effect is used to measure the transmission of volatility from shocks arising in one country to other countries, and from the finance perspective, can explain how the shock of one asset can be transferred to other assets. The contagion effect is tested by correlation. The diagonal BEKK model is mathematically and statistically preferable to the fatally flawed full BEKK and the DCC model, that’s why we use it. Besides, we suspect that the volatility contagion effect of those variables may not be stable over the different periods and obtain underlying long memory and time-varying characteristics. Accordingly, we take China’s exchange rate reform, namely “8.11” in 2015, as the boundary, dividing the analysis into two stages, the first period from September 2010 to August 2015, and the second period from September 2015 to January 2021.
The estimated diagonally restricted BEKK-GARCH results as shown in Table 4. We can find that, in the first period, values are found to be significant at the 1% level of significance for both CNY and RGI, while CNH is significant at the 1% level, which indicates that the mean value of returns for each of those three variables is influenced by their own returns effect. However, the value for FER is not significantly affected by its own early returns.
In the second period, values of CNY and CNH were significant at 1% level, and the value of FER was significant at 5%. However, at this period, RGI is no longer significantly affected by its own early returns. The coefficients of the ARCH term and GARCH term in the conditional variance and covariance equation indicate a cross-volatility effect and own-volatility effect, respectively. The own-volatility effect is under the dominant influence of its own past shocks and volatility (one lag), and the cross-volatility effect under the influence of the news that came from other exogenous variables. The sum of the coefficients ARCH term and GARCH term in the below conditional variance-covariance equation is less than 1, which indicates the stability condition of the variance. At the same time, as the sum is close to 1, the process slightly oscillates around the mean value, and shows the effects of long memory in the four series. Besides, the conditional covariance model effectively captures the own volatility and cross volatility contagion effects among the four markets. The parameters are statistically significant in Table 4, indicating that, at this stage, the offshore exchange rate market, onshore exchange rate market, China’s foreign exchange reserve, and RMB internationalization index are significantly affected by their own volatility in the previous period. While the results stand as evidence for strong GARCH effects, we find the presence of ARCH effects to be relatively weak. All GARCH term coefficients in the above equations are greater than the ARCH term coefficients, which means that the volatility of four variables is mainly affected by their own volatility effects.
In the first period, the coefficient means that dealers in China’s onshore exchange rate market, foreign exchange reserves market, as well as renminbi globalization market should pay attention to the news coming from the Chinese offshore exchange rate market. The coefficients mean that the shocks on the China’s foreign exchange reserves market last longer than in the renminbi internationalization market, the onshore exchange rate market, and offshore exchange rate market in terms of future market volatility. In the second period, the parameters of , are statistically significant, indicating that, during this period, the offshore exchange rate market, onshore exchange rate, foreign exchange reserve, and RMB internationalization index are significantly affected by their own volatility effects in the previous period. The second period evidenced the presence of both ARCH and GARCH effects, but the GARCH term still higher than the ARCH term. The volatility sequences are mainly affected by its own previous shocks. noted that dealers in China’s offshore exchange rate market must pay greater attention to the news coming from China’s onshore exchange rate market and then the news from foreign exchange reserves markets. Meanwhile, the impact of news from the offshore market exchange rate to the RGI market is small in the current stage. means that the shocks on the renminbi internationalization market last longer than in China’s foreign exchange reserves market, onshore exchange rate market, and offshore exchange rate market in terms of future market volatility.
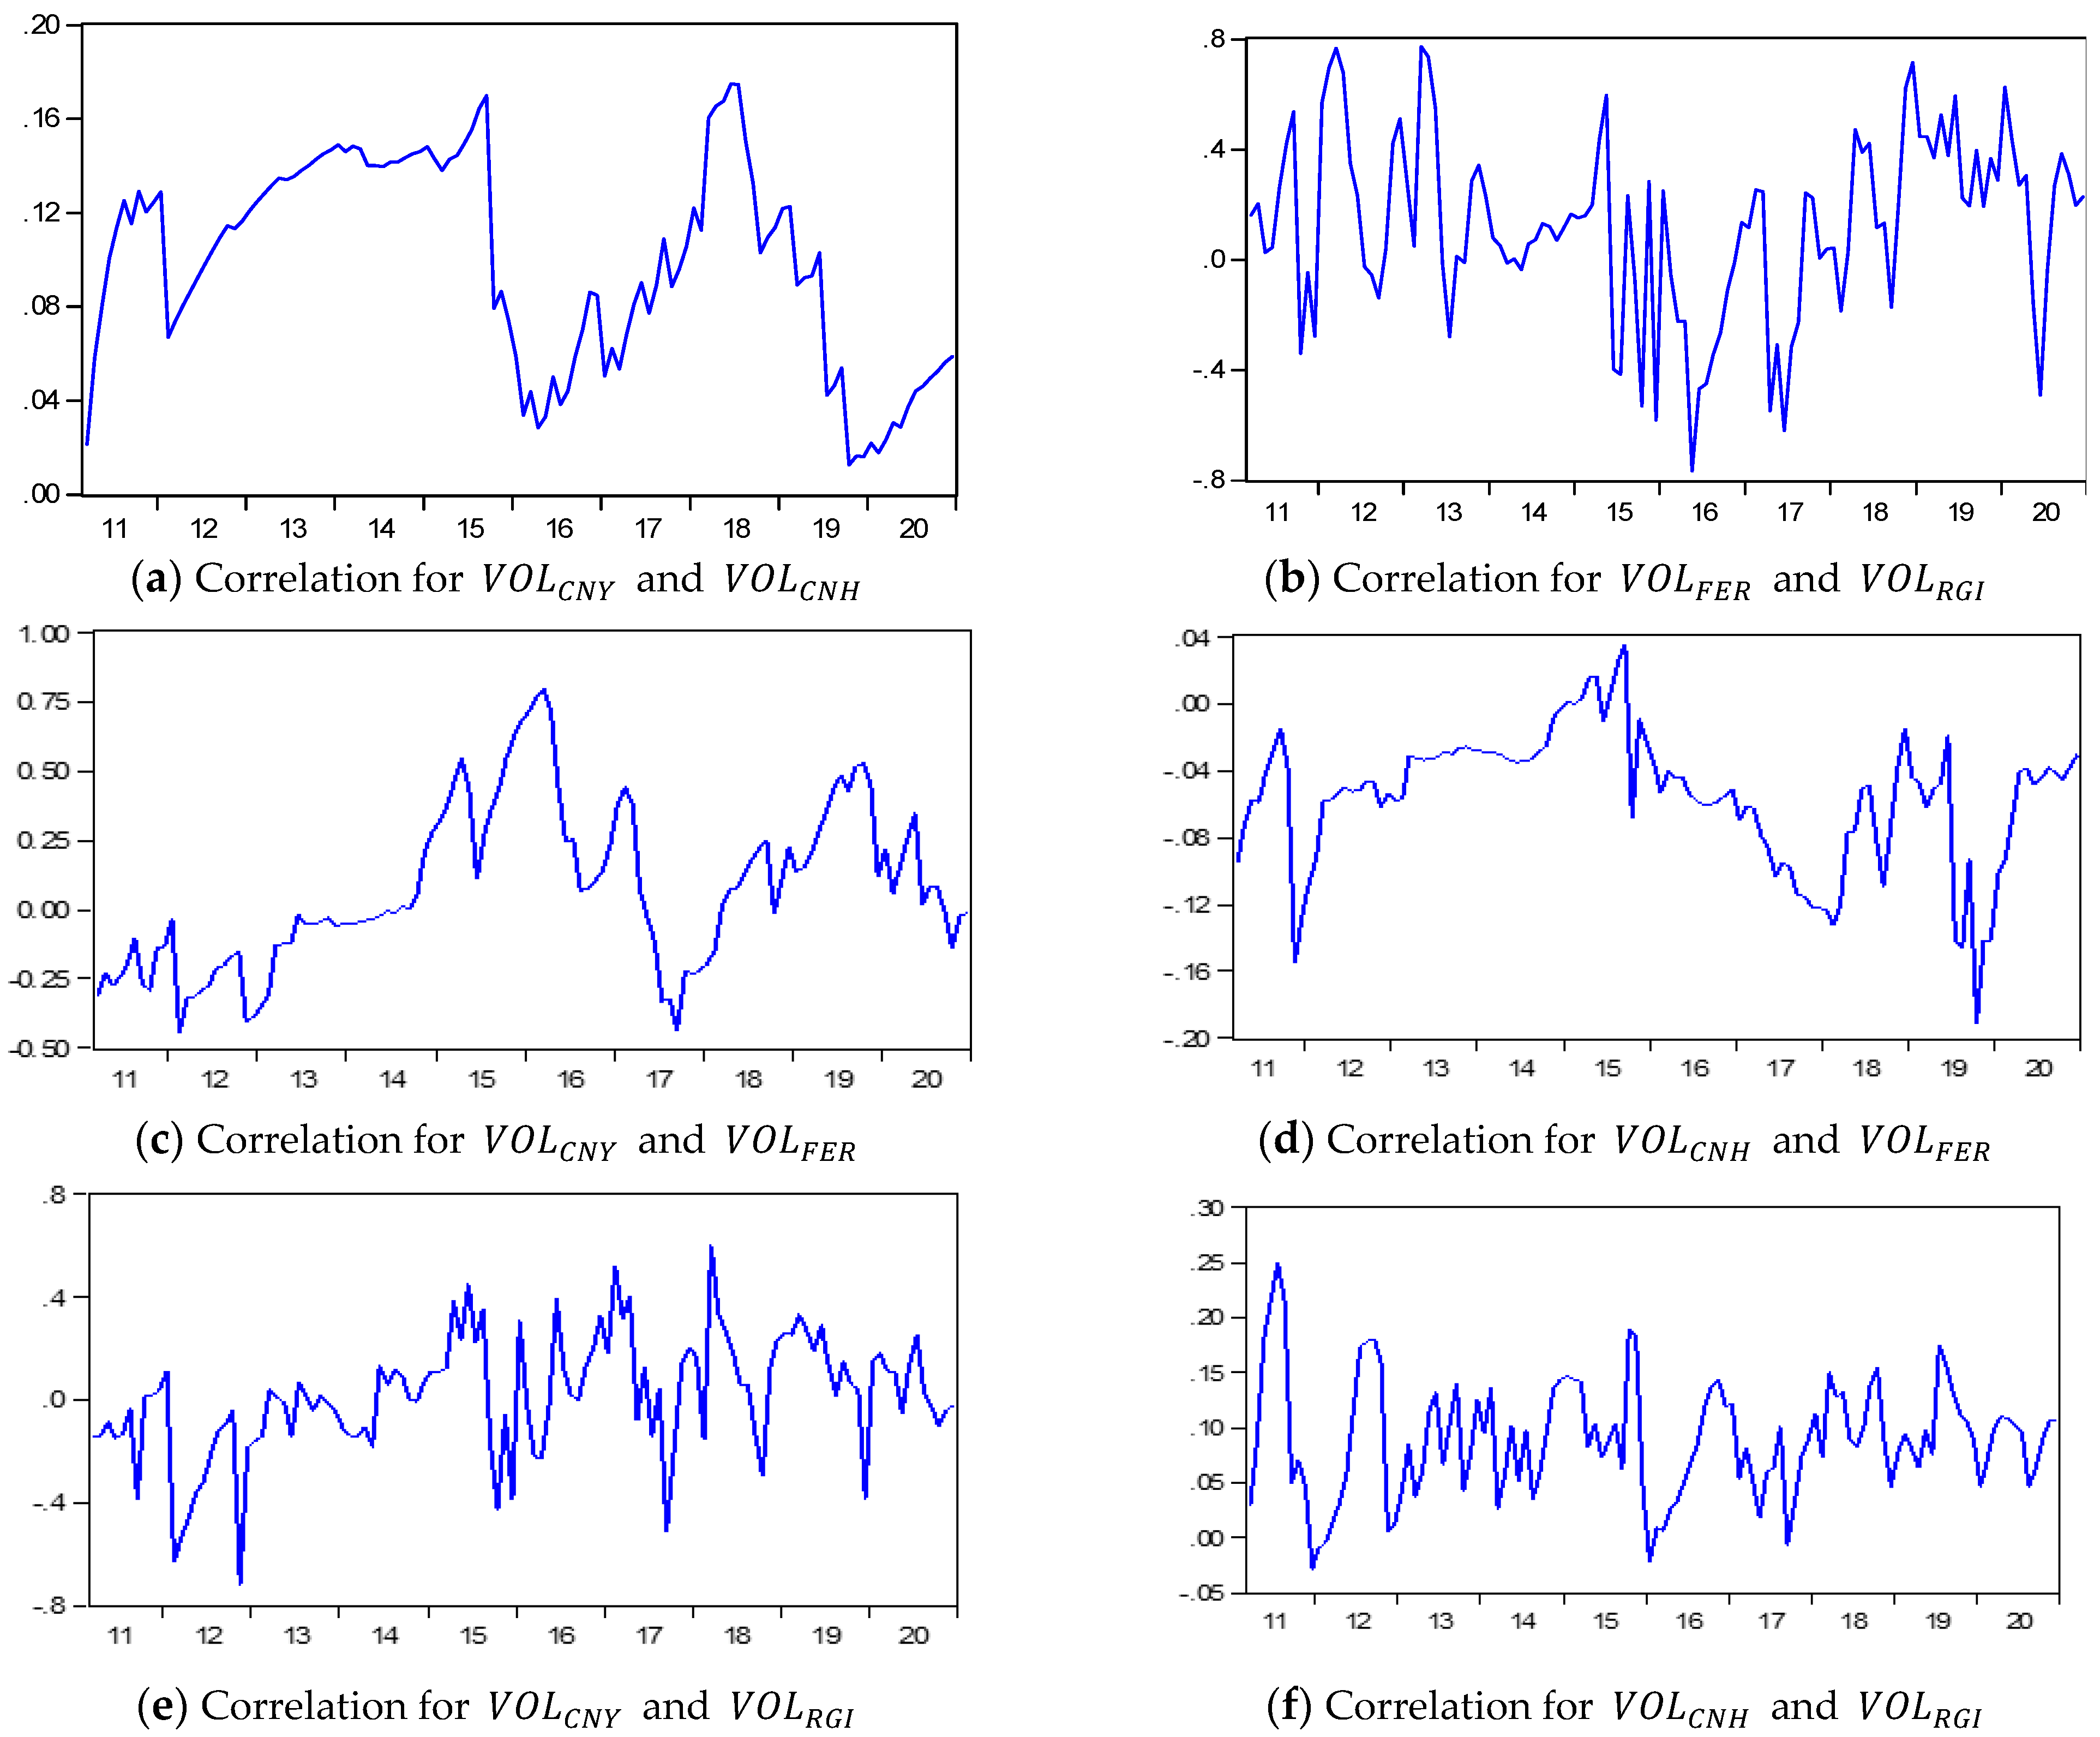
Comparing the two periods, we can see that after 2015, the contagion effect of volatility among CNY and CNH markets has been significantly strengthened. As contrast, the pass-through effect of volatility among FER and RGI are reduced. Besides, the covariance parameters of CNY and FER as well as FER and CNH changed from negative to positive. Meanwhile, the covariance coefficients of CNY with RGI and CNH with RGI shifted from positive to negative. The absolute value shows that, before August 2015, there is a weak contagion effect among them. However, after September 2015, the model validates the presence of a strengthened volatility contagion within CNY and CNH, CNY and RGI, and CNH and RGI. However, the contagion effect is weakened between FER and CNY, FER and CNH, and FER and RGI. The difference in volatility contagion effect within two periods is shown in Figure 2. Moreover, we can observe the volatility dynamic correlation from Figure 3.
5. Conclusions
From the model to the actual situation, we can argue that, from 2010 to 2015, the renminbi was in a primitive stage of internationalization. Even though China adopted a controlled floating exchange rate system, during this period, China’s foreign exchange reserve accumulation grew at a much faster rate than normal. Hence, during this period, RMB gradually appreciated, China’s foreign exchange reserves increased rapidly, the government had to start the financial firewall, and the level of RMB globalization was stimulated to initiate development. After 2015, with the reform of China’s exchange rate system, the Chinese government gradually opened the foreign exchange market and adopted a relatively flexible managed floating exchange rate system. The RMB was accelerating the internationalization process to an immature stage. However, China’s excessive accumulation of foreign exchange reserves at this stage made the huge amount of foreign exchange outstanding lead to currency overissue, which brought about inflation risk, local currency devaluation expectation, and capital flight, which hindered the process of RMB internationalization to a certain extent. This is where the contradiction lies.
Firstly, from this study, there is a strengthened trend of positively bidirectional volatility contagion effect between the offshore and onshore markets of RMB. This is consistent with previous research. The currency volatility is quietly stable, which means that, although China is trying to find a balance between a fixed exchange rate system and floating exchange rate system, it is still a controlled exchange rate market, also leading to less liquidity in China’s capital market. From this perspective, we suggest that the Chinese government further open its foreign exchange market and promote foreign exchange circulation. For international trade, enterprises should be able to take advantage of the currently favorable foreign exchange market environment.
Secondly, a large amount of foreign exchange reserves in China was indeed conducive to stabilizing the volatility of exchange rate of China’s onshore and offshore markets before 2015. However, nowadays, the increasing of FER will rise the volatility and risk on the RMB exchange rate market and the internationalization level of RMB. We already see a weakened contagion effect trend in the model, but not enough. Thus, we recommend that China still needs to reduce the frequency of intervention in the foreign exchange market and further reduce the proportion of the US dollar to promote the diversification of reserve asset structures.
Thirdly, this study finds that China’s foreign exchange reserves have a two-way contagion effect with both CNY and CNH markets, indicating that the management of foreign exchange reserves should be at the top of the list of issues that China needs to face in coming years.
From the research, we came to recognize that the internationalization level of RMB is still relatively low and cannot have a significant effect on China’s exchange rate system and China’s foreign exchange reserves. As a result, it is necessary to continue to encourage and promote the internationalization process of RMB for China. The contagion effect shows a way to strengthen CNY to RGI as well as CNH to RGI so we can stimulate the internationalization of RMB from these aspects, e.g., by promoting the development and growth of the CNH market, increasing the yuan settlement in trade, accelerating the rollout of digital payments and cryptocurrencies, and so on.
Institutional Review Board Statement
The study did not involve humans or animals.
Informed Consent Statement
The study did not involve humans.
Data Availability Statement
The data sources for this paper are publicly available, the data of CNY and CNH are from investing.com, and the data of RMB globalization index from Standard Chartered Research. Finally, the data of FER came from People’s republic Bank of China.
References
- Jiang, W. The Effect of RMB Exchange Rate Volatility on Import and Export Trade in China. Int. J. Acad. Res. Bus. Soc. Sci. 2014, 4, 615. [Google Scholar]
- Gokhale, M.S.; Raju, J.R. Causality between Exchange Rate and Foreign Exchange Reserves in the Indian Context. Glob. J. Manag. Bus. Res. [S.l.]. July 2013. Available online: https://journalofbusiness.org/index.php/GJMBR/article/view/1021 (accessed on 14 July 2021).
- Wenbing, S.; Hongzhong, L. RMB Internationalization, Exchange Rate Fluctuation and Exchange Rate Expectations. Stud. Int. Financ. 2014, 8, F832.6. [Google Scholar]
- Yanjing, L. The Quantitative Analysis on the Evolution of the International Reserve Currency—Also on the Feasibility of the Internationalization of RMB. Stud. Int. Financ. 2012, 4. [Google Scholar]
- McKinnon, R.; Schnabl, G. China’s exchange rate and financial repression: The conflicted emergence of the RMB as an international currency. China World Econ. 2014, 22, 1–35. [Google Scholar] [CrossRef]
- Lau, K.; Mann, D.; Maratheftis, M.; Weng, S. CNH—Introducing the Renminbi Globalisation Index. Glob. Res. Res. 2012. Available online: https://research.sc.com/reports/RGI_20121114.pdf (accessed on 14 July 2021).
- Zha, X. Study on the Relationship between RMB Internationalization and Exchange Rate. Commer. Econ. Res. 2015. No. 17. Available online: http://www.cnki.com.cn/Article/CJFDTotal-SYJJ201517032.htm (accessed on 14 July 2021).
- Zhang, Z.; Bai, Q. Exchange Rate Volatility and Local Currency Internationalization: An Empirical Study on the Australian Dollar (20 August 2012). Stud. Int. Financ. April 2013. Available online: https://ssrn.com/abstract=2147416 (accessed on 14 July 2021). (In Chinese).
- Li, Q. Study on the Trend and Fluctuation of RMB Exchange Rate under the Management Floating Exchange Rate System. Ph.D. Thesis, University of Electronic Science and Technology of China, Beijing, China, 24 April 2015. Available online: http://cdmd.cnki.com.cn/Article/CDMD-10614-1016049477.htm (accessed on 14 July 2021).
- Thenmozhi, M.; Maurya, S. Crude Oil Volatility Transmission across Food Commodity Markets: A Multivariate BEKK-GARCH Approach. J. Emerg. Market Financ. 2020. [Google Scholar] [CrossRef]
- McAleer, M. What They Did Not Tell You about Algebraic (Non-) Existence, Mathematical (IR-)Regularity and (Non-) Asymptotic Properties of the Full BEKK Dynamic Conditional Covariance Model. J. Risk Financ. Manag. 2019, 12, 61. [Google Scholar] [CrossRef] [Green Version]
- McAleer, M. What They Did Not Tell You about Algebraic (Non-) Existence, Mathematical (IR-)Regularity, and (Non-) Asymptotic Properties of the Dynamic Conditional Correlation (DCC) Model. J. Risk Financ. Manag. 2019, 12, 66. [Google Scholar] [CrossRef] [Green Version]
- Marggie, M.; Jiangze, D.; Kin, L. Modeling Volatility Exchange Rate of Chinese Yuan against US Dolla Based on GARCH Models. In Proceedings of the Sixth International Conference on Business Intelligence and Financial Engineering, Hangzhou, China, 14–16 November 2013; Available online: https://0-ieeexplore-ieee-org.brum.beds.ac.uk/abstract/document/696114 (accessed on 14 July 2021).
- Liu, Z. Study on the Formation Mechanism of RMB Exchange Rate. Master’s Thesis, Shanghai Academy of Social Science, Shanghai, China, 1 June 2019. Available online: https://cdmd.cnki.com.cn/Article/CDMD-87903-1019045437.htm (accessed on 14 July 2021).
- Shao, L. The Influence of Exchange Rate Fluctuation on RMB Internationalization. Master’s Thesis, Soochow University, Suzhou, China, May 2018. Available online: http://cdmd.cnki.com.cn/Article/CDMD-10285-1018102808.htm (accessed on 14 July 2021).
- Zhu, G.; Liu, L.; Zhang, W. Optimal International Reserve Size in the Process of Currency Internationalization. Int. Finance Res. 2014, 3. Available online: http://www.cnki.com.cn/Article/CJFDTOTAL-GJJR201403003.htm (accessed on 14 July 2021).
- Bai, Q.; Zhang, Z. The Size of Foreign Exchange Reserve and Local Currency Internationalization: An Empirical Study on the Japanese Yen (4 May 2013). Econ. Res. J. October 2011. Available online: https://ssrn.com/abstract=2260861 (accessed on 14 July 2021). (In Chinese).
- Lian, P.; Ding, J.; E, Y. Internationalization of RMB and Management of Foreign Exchange Reserves—Based on Theoretical and Empirical Analysis. Int. Financ. 2017. Available online: http://www.cnki.com.cn/Article/CJFDTOTAL-JRGJ201706008.htm (accessed on 14 July 2021).
- Zhu, M.; Yan, S. Foreign Exchange Reserve Size, Exchange Rate and Currency Internationalization: An Empirical Study Based on Yen. J. Southwest Univ. Natl. (Humanit. Soc. Sci. Ed.). 2017. Available online: http://www.cnki.com.cn/Article/CJFDTOTAL-XNZS201703022.htm (accessed on 14 July 2021).
- Zhu, M.; Cao, C. Currency Globalization, Financial Stability and Reserve Requirement. Stat. Res. 2019, 36. [Google Scholar] [CrossRef]
Figure 1.
Monthly data of returns in CNY, CNH, FER, and RGI.

Figure 2.
The volatility contagion effect in two stages.

Figure 3.
Dynamic conditional correlation for volatilities.


Table 1.
Variables description.
| Data | Description | Source |
|---|---|---|
| CNY | In the onshore mainland China market, the Chinese Yuan is called CNY, and the CNY central parity exchange rate is calculated from the average of the buying price plus selling price. | investing.com |
| CNH | The offshore market includes traditional Yuan centers, such as Hong Kong (a special administrative region of China), Singapore, London, and newly developed centers such as Luxembourg is called CNH. while the CNH central parity exchange rate is calculated from the average of the buying price plus selling price. | investing.com |
| RGI | Represent the RMB globalization index, which calculate from offshore RMB deposits, trade settle and other international payments, dim sum bonds and foreign exchange turnover. | Standard Chartered Research |
| FER | Represent China’s foreign exchange reserves, the change of China’s foreign exchange reserve is the substitution variable of foreign exchange intervention. | People’s republic Bank of China |
Table 2.
Descriptive statistics for returns in CNY, CNH, FER, and RGI.
| RCNY | RCNH | RFER | RRGI | |
|---|---|---|---|---|
| Mean | −0.0003 | −0.0003 | 0.0016 | 0.0248 |
| Median | −0.0013 | −0.0014 | 0.0022 | 0.0128 |
| Maximum | 0.0314 | 0.0300 | 0.0416 | 0.2231 |
| Minimum | −0.0253 | −0.0242 | −0.0383 | −0.1024 |
| Std. Dev. | 0.0088 | 0.0092 | 0.0130 | 0.0546 |
| Skewness | 0.5656 | 0.6234 | −0.0169 | 1.6294 |
| Kurtosis | 4.0238 | 3.7396 | 4.2222 | 6.6424 |
| J-B | 12.0259 | 10.8568 | 7.6614 | 120.4339 |
| Prob. | 0.0024 | 0.0044 | 0.0217 | 0.0000 |
Notes: The Jarque-Bera test corresponds to the test statistic for the null hypothesis of normality in the distribution of sample returns.
Table 3.
Unit Root Test for sample returns-ADF approach.
| T-Stat | 1% Level | 5% Level | 10% Level | Prob. | Results | |
|---|---|---|---|---|---|---|
| RCNH | −5.1187 | −3.4856 | −2.8857 | −2.5797 | 0.0000 | Stationary |
| RCNY | −5.0032 | −3.4856 | −2.8857 | −2.5797 | 0.0000 | Stationary |
| RRGI | −3.9669 | −3.4870 | −2.8863 | −2.5800 | 0.0022 | Stationary |
| RFER | −8.0091 | −3.4847 | −2.8852 | −2.5795 | 0.0000 | Stationary |
Table 4.
Estimated Coefficients for Diagonal BEKK GARCH model.
| Period 1: September 2010 to August 2015 | Period 2: September 2015 to January 2021 | |||||
|---|---|---|---|---|---|---|
| Mean equation | Coeff. | Std. error | z-Stat | Coeff. | Std. error | z-Stat |
| −0.0009 * | 0.0005 | −1.8123 | −0.0013 | 0.0016 | −0.8023 | |
| 0.3088 *** | 0.0977 | 3.1605 | 0.3675 *** | 0.0979 | 3.7534 | |
| −0.0009 * | 0.0005 | −1.8581 | −0.0014 | 0.0017 | −0.7870 | |
| 0.3976 *** | 0.1018 | 3.9070 | 0.3122 *** | 0.1057 | 2.9537 | |
| 0.0039 * | 0.0020 | 1.8959 | 0.0006 | 0.0015 | 0.4234 | |
| 0.1624 | 0.1265 | 1.2839 | 0.3881 ** | 0.1543 | 2.5148 | |
| 0.0116 ** | 0.0050 | 2.3058 | 0.0043 * | 0.0024 | 1.8130 | |
| 0.6161 *** | 0.0970 | 6.3521 | 0.1198 | 0.1473 | 0.8131 | |
| Variance equation | Coeff. | Std. error | z-Stat. | Coeff. | Std. error | z-Stat. |
| 1.24 × 10⁻⁶ | 8.50 × 10⁻⁷ | 1.4560 | 2.94 × 10⁻⁵ * | 1.60 × 10⁻⁵ | 1.8317 | |
| 1.62 × 10⁻⁶ ** | 6.30 × 10⁻⁷ | 2.5646 | 3.89 × 10⁻⁵ ** | 1.76 × 10⁻⁵ | 2.2110 | |
| −7.06 × 10⁻⁷ | 1.23 × 10⁻⁶ | −0.5761 | −6.71 × 10⁻⁶ | 8.51 × 10⁻⁶ | −0.7888 | |
| 1.94 × 10⁻⁶ | 3.72 × 10⁻⁶ | 0.5220 | 6.21 × 10⁻⁶ | 8.95 × 10⁻⁶ | 0.6938 | |
| 1.99 × 10⁻⁶ *** | 7.12 × 10⁻⁷ | 2.8006 | 4.86 × 10⁻⁵ ** | 2.00 × 10⁻⁵ | 2.4259 | |
| −2.78 × 10⁻⁶ | 2.09 × 10⁻⁶ | −1.3290 | −7.25 × 10⁻⁶ | 1.09 × 10⁻⁵ | −0.6650 | |
| 2.54 × 10⁻⁶ | 5.12 × 10⁻⁶ | 0.4961 | 8.45 × 10⁻⁶ | 1.43 × 10⁻⁵ | 0.5906 | |
| −1.89 × 10⁻⁵ | 1.86 × 10⁻⁵ | −1.0127 | 1.40 × 10⁻⁵ | 1.16 × 10⁻⁵ | 1.2080 | |
| 7.59 × 10⁻⁶ | 1.74 × 10⁻⁵ | 0.4349 | −7.02 × 10⁻⁶ | 5.04 × 10⁻⁶ | −1.3937 | |
| 7.66 × 10⁻⁵ | 0.0001 | 0.6865 | −1.09 × 10⁻⁵ *** | 2.34 × 10⁻⁶ | −4.6486 | |
| 0.2643 *** | 0.1020 | 2.5912 | 0.287159 ** | 0.1258 | 2.2819 | |
| 0.4094 *** | 0.1010 | 4.0517 | 0.4044 *** | 0.1321 | 3.0606 | |
| −0.3772 ** | 0.1532 | −2.4612 | 0.2649 * | 0.1601 | 1.6548 | |
| 0.0682 | 0.1770 | 0.3852 | −0.1243 | 0.1493 | −0.8326 | |
| 0.9153 *** | 0.0551 | 16.6129 | 0.7684 *** | 0.1064 | 7.2244 | |
| 0.8412 *** | 0.0358 | 23.4845 | 0.6249 *** | 0.1218 | 5.1322 | |
| 0.9855 *** | 0.0400 | 24.6565 | 0.7945 *** | 0.1356 | 5.8599 | |
| 0.9366 *** | 0.0579 | 16.1700 | 0.9801 *** | 0.0182 | 53.9888 | |
| LogL | 790.1209 | 879.7569 | ||||
| AIC | −27.74985 | −27.5406 | ||||
Note: *** indicates reject the null hypothesis at the 1% significance level; ** indicates reject the null hypothesis at the 5% significance level; * indicates reject the null hypothesis at the 10% significance level.
Publisher’s Note: MDPI stays neutral with regard to jurisdictional claims in published maps and institutional affiliations. |
© 2021 by the authors. Licensee MDPI, Basel, Switzerland. This article is an open access article distributed under the terms and conditions of the Creative Commons Attribution (CC BY) license (https://creativecommons.org/licenses/by/4.0/).
Share and Cite
MDPI and ACS Style
Lu, X.; Tansuchat, R. The Conflicting Developments of RMB Internationalization: Contagion Effect and Dynamic Conditional Correlation. Eng. Proc. 2021, 5, 54. https://0-doi-org.brum.beds.ac.uk/10.3390/engproc2021005054
AMA Style
Lu X, Tansuchat R. The Conflicting Developments of RMB Internationalization: Contagion Effect and Dynamic Conditional Correlation. Engineering Proceedings. 2021; 5(1):54. https://0-doi-org.brum.beds.ac.uk/10.3390/engproc2021005054
Chicago/Turabian StyleLu, Xiangqing, and Roengchai Tansuchat. 2021. "The Conflicting Developments of RMB Internationalization: Contagion Effect and Dynamic Conditional Correlation" Engineering Proceedings 5, no. 1: 54. https://0-doi-org.brum.beds.ac.uk/10.3390/engproc2021005054