
Bisphenol A: Quantification in Complex Matrices and Removal by Anaerobic Sludges


1
Robert Boyle Institute e.V., 07751 Jena, Germany
2
Institute for Inorganic and Analytical Chemistry, Friedrich Schiller University Jena, 07743 Jena, Germany
3
Institute for Technical and Environmental Chemistry, Friedrich-Schiller-University Jena, 07743 Jena, Germany
4
Center for Energy and Environmental Chemistry (CEEC Jena), 07743 Jena, Germany
5
Fraunhofer Institute for Ceramic Technologies and Systems IKTS, 07629 Hermsdorf, Germany
6
Institute of Waste Management and Circular Economy, Technische Universität Dresden, 01796 Pirna, Germany
*
Authors to whom correspondence should be addressed.
Pollutants 2021, 1(4), 194-206; https://0-doi-org.brum.beds.ac.uk/10.3390/pollutants1040016
Submission received: 12 August 2021
/
Revised: 3 October 2021
/
Accepted: 11 October 2021
/
Published: 14 October 2021
(This article belongs to the Special Issue Analysis of Trace Pollutants in Complex Matrices)
Abstract
:The endocrine disruptor bisphenol A (BPA) is one of the most commonly found micropollutants in the environment. However, the biodegradation of BPA under anaerobic (methanogenic) conditions is still an understudied process in wastewater treatment systems. The current study thus addresses the need for a simple and user-friendly analytical method for the rapid and accurate quantification of BPA in complex matrices such as digested and co-digester sludges. We established a microwave-assisted extraction method, followed by derivatization and gas chromatography–mass spectrometry to quantify BPA by comparing it with a deuterated internal standard. The BPA removal capabilities of three digester sludges and three co-digester sludges were examined under mesophilic methanogenic conditions in biogas plants. The endogenous BPA concentration (dry weight) ranged from 1596 to 10,973 µg kg−1 in digested sewage sludges, and from below the limit of quantification to 9069 µg kg−1 in co-digester sludges. When BPA was added to the sludges, the removal capabilities ranged from not significant to 50% after 21 days of incubation. Biogas production was unaffected by the addition of BPA (228 µg kg−1) to the aqueous sludge. The study demonstrated that BPA could be removed under anaerobic conditions in accustomed inoculates. The findings have far-reaching implications for understanding BPA persistence and detoxification under anaerobic conditions.
1. Introduction
Bisphenol A (BPA) is a micropollutant that is commonly found in the environment [1]. It is an almost ubiquitous, pseudo-persistent xenoestrogen and has been identified as an endocrine disruptor [2]. Due to the adverse effects of BPA on people and the environment, the European Chemicals Agency (ECHA) has listed BPA on the Candidate List of substances of very high concern (SVHC) and recommended BPA to be included in the REACH authorization list [3]. The hormone-like properties of BPA lead to the lowest observed effect concentrations (LOECs) between 0.1 and 1 µg L−1 for many aquatic organisms [4], while its production in 2020 was estimated to be 6.2 million tons [5]. It is mainly used as a monomer for polycarbonates and epoxy resins, although its use as a developing dye for thermal paper has the most significant impact on the environment [6]. For example, when the thermal paper is recycled into toilet paper, BPA is carried over to the recycled product and ends up in sewage, where it is only partially removed during the water treatment process [7]. Municipal wastewater treatment plants (WWTPs) discharge BPA through treated wastewater and the disposal of digested sludges. Thus, WWTPs function as primary point sources, but BPA also leaches from landfills into the environment [8,9,10]. It is necessary to determine BPA in environmental samples to understand its transfer and accumulation in matrices and to assess the risk of endocrine disruption [11].
Anaerobically digested sewage sludge contains elevated amounts of BPA (up to 36.7 mg kg−1 dry weight) [12] due to the adsorption of BPA on primary and activated sludge in the water treatment process. As a result of this adsorption, sludges that enter anaerobic digesters contain high amounts of BPA. These sludges are defined as: (i) primary sludge, which consists of settleable solids removed in a clarifier during primary treatment, and (ii) waste activated sludge, which is removed through sedimentation after secondary treatment. Therefore, the mode of action of BPA during anaerobic digestion has been assessed and discussed in several studies (Table 1). Our study addresses the need for a user-friendly and straightforward analytical method for the rapid and accurate quantification of BPA in complex matrices such as anaerobic sludges.
Under aerobic conditions, BPA is biodegraded in activated sludges with reaction constants between 0.028 and 0.804 h−1 [13,14]. Currently, there is no evidence of anaerobic biodegradation or transformation, except for when electron acceptors other than oxygen (e.g., Fe3+, NO3-, SO42-) are present [15]. For example, only the facultative anaerobic bacterial strain Bacillus sp. GZB biodegraded BPA under anaerobic conditions with Fe3+ as the electron acceptor [16]. In another study, 93% and 89% anaerobic biodegradation was observed after 120 days in river sediment under nitrate- and sulfate-reducing conditions, respectively [17].
In many studies, no significant biodegradation of BPA has been observed under anaerobic methanogenic conditions [18,19,20,21], whereas an increase in BPA concentration was reported for five out of six German anaerobic mesophilic WWTP digesters [22]. This was attributed to the degradation of polymers (e.g., polycarbonates), which released the monomer BPA [22]. Moreover, in a lab-scale experiment, mesophilic anaerobic sludge treatment increased BPA concentrations by 80 ± 113% [23]. Additionally, Canadian anaerobic WWTP digesters increased BPA concentrations in dry sludge from 360 µg kg−1 to 540 µg kg−1 (n = 83, p < 0.01), potentially through “the substantial reduction of volatile solids” [24].
While three studies reported decreases in BPA concentrations under anaerobic methanogenic conditions (Table 1), none provided unequivocal proof of removal. The first study reported 39 ± 8% biotransformation of BPA within 20 days [25]. In the second study, increased BPA removal of up to 80 ± 16% was observed during anaerobic digestion of sewage sludge within 20 days [26]. The third study reported 99.9 ± 0.0% removal by an anaerobic membrane bioreactor [27]. However, all three studies applied extraction and clean-up of complex matrices without using internal standards, and the reported removal capabilities might be affected by sorption processes and low recoveries. The use of an isotopically labeled internal standard is a common technique to compensate for analyte loss during the analytical process, e.g., due to extraction. The removal of BPA under anaerobic conditions has never been investigated using this technique. Therefore, previous studies reporting the anaerobic removal of BPA lack unequivocal evidence.
Until this point, the biological degradability of BPA under anaerobic (methanogenic) conditions has been a very controversial topic. Im and Löffler (2016) concluded that proof of anaerobic BPA co-metabolism and degradation is still missing [15]. The reason for the observed removal in three studies (Table 1) might be different biological activities of the sludges used as inoculum sources but could also be due to different experimental setups or variable recovery rates due to the complex matrix. Moreover, several sampling strategies for the influent and effluent do not account for sorption processes in the reactors (such as anaerobic sludge blanket reactors) [28,29,30,31,32]. At the same time, there is great interest in the anerobic biotransformation processes of BPA [33,34,35,36,37].
Our research is thus motivated by: (i) the varied results from some research groups, which generally do not provide clear evidence for BPA removal under anaerobic conditions; (ii) the limitations of studies using only one inoculum; and (iii) methodological improvement through using an internal 13C- or deuterium-labeled standard.
In summary, BPA in sludges must be quantified quickly and accurately using simple and user-friendly analytical methods to obtain reliable data. To overcome the difficulties of safely quantifying BPA, a mass spectrometry-based analytical method was developed using deuterated BPA (D16-BPA) as an internal standard.
Upon setting up an analytical methodology, our study aimed to compare the BPA removal efficiency of different sludges under standardized anaerobic (methanogenic) conditions, using deuterated BPA as an internal standard to account for adsorption losses. We tested inoculates from three different co-digesters and three sewage sludge digesters (Table S1) to measure the removal capability of different inoculates, while also monitoring their biogas production. We chose inoculates from digesters with diverse conditions (different substrates and processes), which were reportedly associated with various stable microbiome compositions [38].
2. Materials and Methods
2.1. Seeding Sludges and Chemicals
In this study, inoculates were retrieved from three co-digesters and three sewage sludge digesters in Germany (Table S1). The following chemicals were obtained: bisphenol A (BPA), 97+% (Alfa Aesar GmbH and Co. GK., Germany); bisphenol A-d16 (D16-BPA, 4,4′-(propane-2,2-diyl-1,1,1,3,3,3-d6)bis(phen-2,3,5,6-d4-ol-d)), 99.1% d16 (CDN Isotopes, Canada); N-methyl-N-(trimethylsilyl)trifluoroacetamide (MSTFA, Macherey-Nagel, Germany); pyridine 99.8+% (Merck KGaA, Germany); and methanol, UHPLC gradient grade (VWR International, Germany).
2.2. Experimental Setup
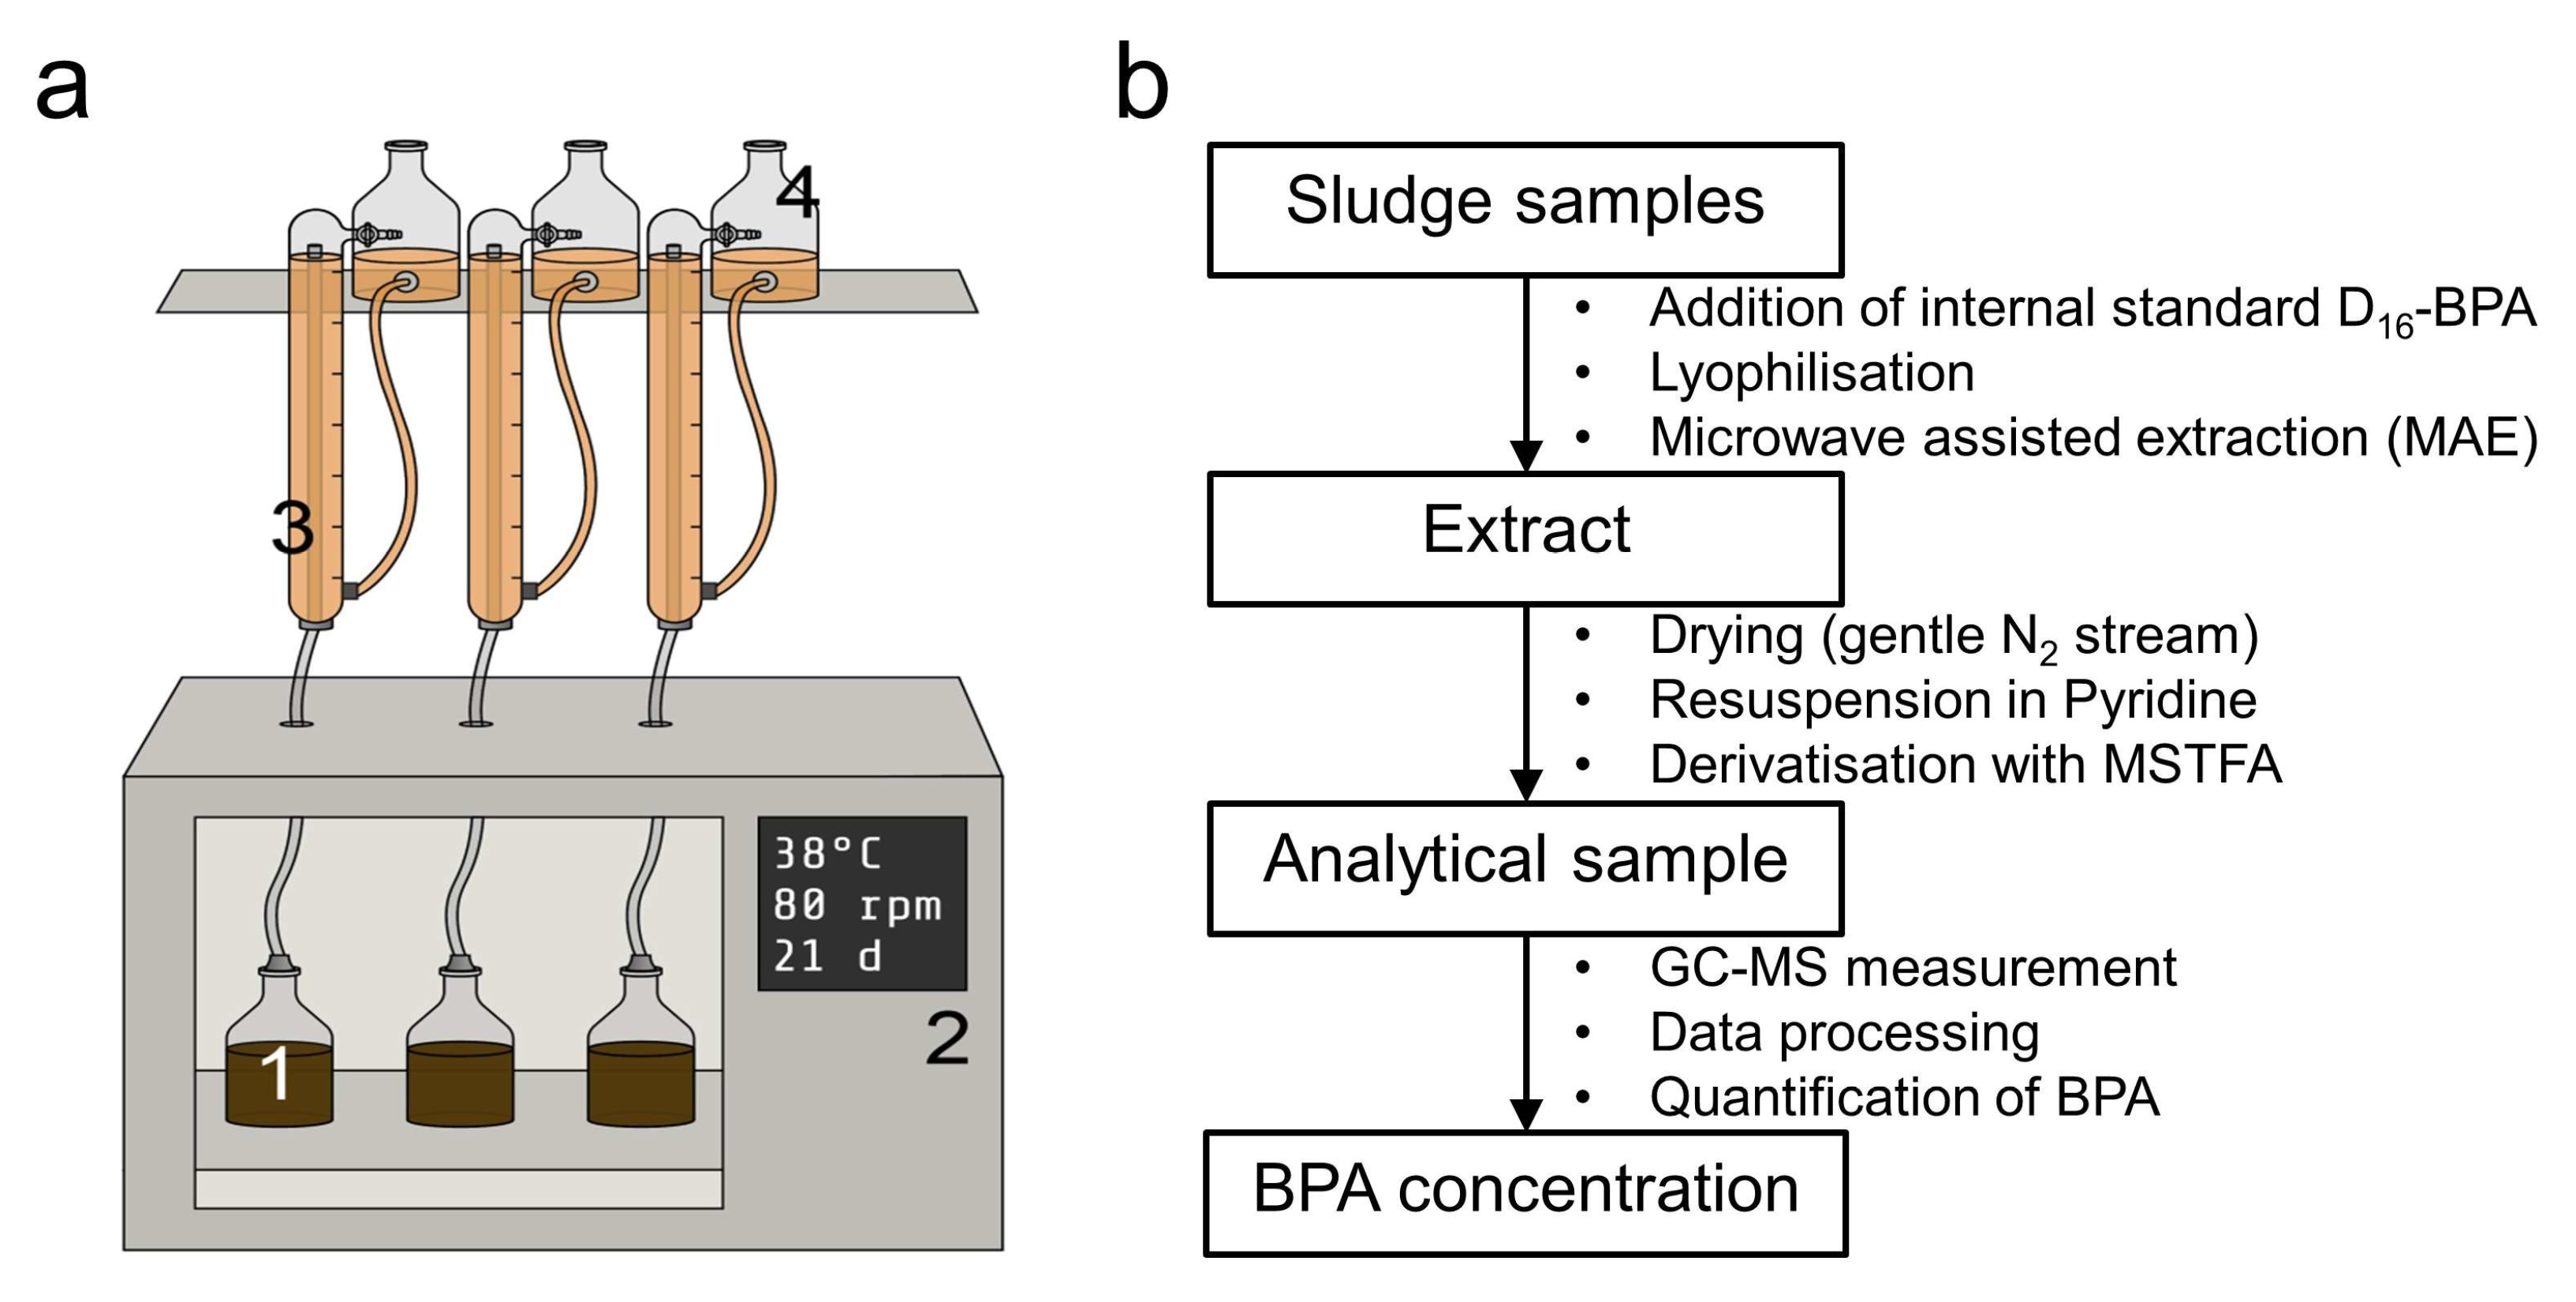
For the anaerobic digestion experiments, 1 L glass bottles were used for batch experiments, according to the German standard VDI 4630 (Figure 1a) [39]. For each bottle, 600 g of the respective aqueous sludge types were used as the seed sludge. All batches were operated under mesophilic conditions at 38 °C in an orbital shaker at 80 rpm for 21 days. Digestion experiments were conducted in triplicate after adding 137 µg of BPA (concentration in aqueous sludge = 228 µg kg−1 ≙ 1 µmol kg−1). An additional untreated control for each inoculum was incubated without spiking. All batches were supplemented with microcrystalline cellulose (mass concentration = 0.2%) as an additional carbon source. To ensure anaerobic conditions at the beginning of the experiment, the bottles were flushed with N2 before being closed. Biological triplicates were sampled before and after 21 days of incubation for the spiked sludges. Analogously, analytical triplicates were sampled for the untreated sludges. The biogas volume was measured in liquid displacement systems, and biogas composition was measured daily with the COMBIMASS® GA m gas analyzer (Bindergroup, Germany).
2.3. Calculation of Methane and Carbon Dioxide Yields Produced by the Anaerobic Batches
The methane yields of the anaerobic experiment were calculated according to VDI 4630 [39]. The dry biogas yield was calculated using
where volume of the dry gas in the normal state in mL, measured volume in mL, pressure of the gas phase at the time of measurement in hPa, vapor pressure of water at the measured temperature in hPa, temperature of the gas phase at the time of measurement in K, standard pressure (1013 hPa), and standard temperature (273 K). The produced methane volume was calculated using
where methane yield in mL, volume of the dry gas in the normal state in mL, methane percentage, and carbon dioxide percentage. The carbon dioxide yield was calculated using
where carbon dioxide yield in mL, volume of the dry gas in the normal state in mL, methane percentage, and carbon dioxide percentage. The produced volumes were calculated for each day. For the spiked triplicates, an average value was calculated. The sum curves and total volumes produced were calculated from the daily volumes produced [39]. Additionally, the theoretical maximum methane potential of 1.2 g cellulose was calculated according to the methods reported by Buswell and Mueller [40]. The maximum methane potential was corrected to determine the biochemical methane potential [41]. Lastly, the theoretical gas curve was estimated based on the Gompertz model [42].
2.4. Analytical Methodology for Quantification of BPA
The aqueous sludges were spiked with 228 µg kg−1 of the internal standard, deuterated BPA (D16-BPA), during the earliest step of the analytical process (Figure 1b). Samples were incubated with the internal standard for 1 h, frozen in liquid nitrogen and freeze-dried to obtain a constant weight. Next, the samples were extracted via microwave-assisted extraction (MAE) with the MARS 5 microwave extraction system (CEM Corporation, US). About 1 g of dry matter was extracted in 55 mL PFA MARS Xpress vessels with 10 mL methanol at 120 °C, 1200 W, and 100% power with a 20 min ramp, 15 min hold time and 30 min cooldown. Afterwards, 2 mL of the extracts were dried, first under a gentle stream of nitrogen and then at 30 mbar, before they were each resuspended twice in 100 µL pyridine. For each sample, the two 100 µL solutions were combined and 50 µL of each mixture was derivatized with 25 µL of MSTFA at 60 °C for 60 min.
One µL of each prepared sample was injected into the gas chromatograph–mass spectrometer ISQ trace GC ultra (Thermo Fisher Scientific, Waltham, MA, USA) with the AS3000 autosampler (Thermo Fisher Scientific, Waltham, MA, USA). A split/splitless injector with a split ratio of 50 was applied at 250 °C. Helium was used as a carrier gas with a constant flow of 1.2 mL min−1. A ZB-SemiVolatiles GC column (Phenomenex, Torrance, CA, US, 5% phenyl phase, length 30 m, diameter 0.25 mm, and film thickness 0.25 µm) was used. The GC temperature program started at 80 °C and was held for 2 min, then ramped at 20 °C min−1 to 120 °C and held for 1 min, further ramped at 5 °C min−1 to 250 °C and held for 3 min, and finally ramped at 10 °C min−1 to 320 °C and held for 2 min. The MS transfer line temperature was 250 °C, and the ion source electron impact ionization temperature was 280 °C. Lastly, the mass range of 50–600 m/z was scanned every 0.3 s.
2.5. Calculation of the BPA Concentration
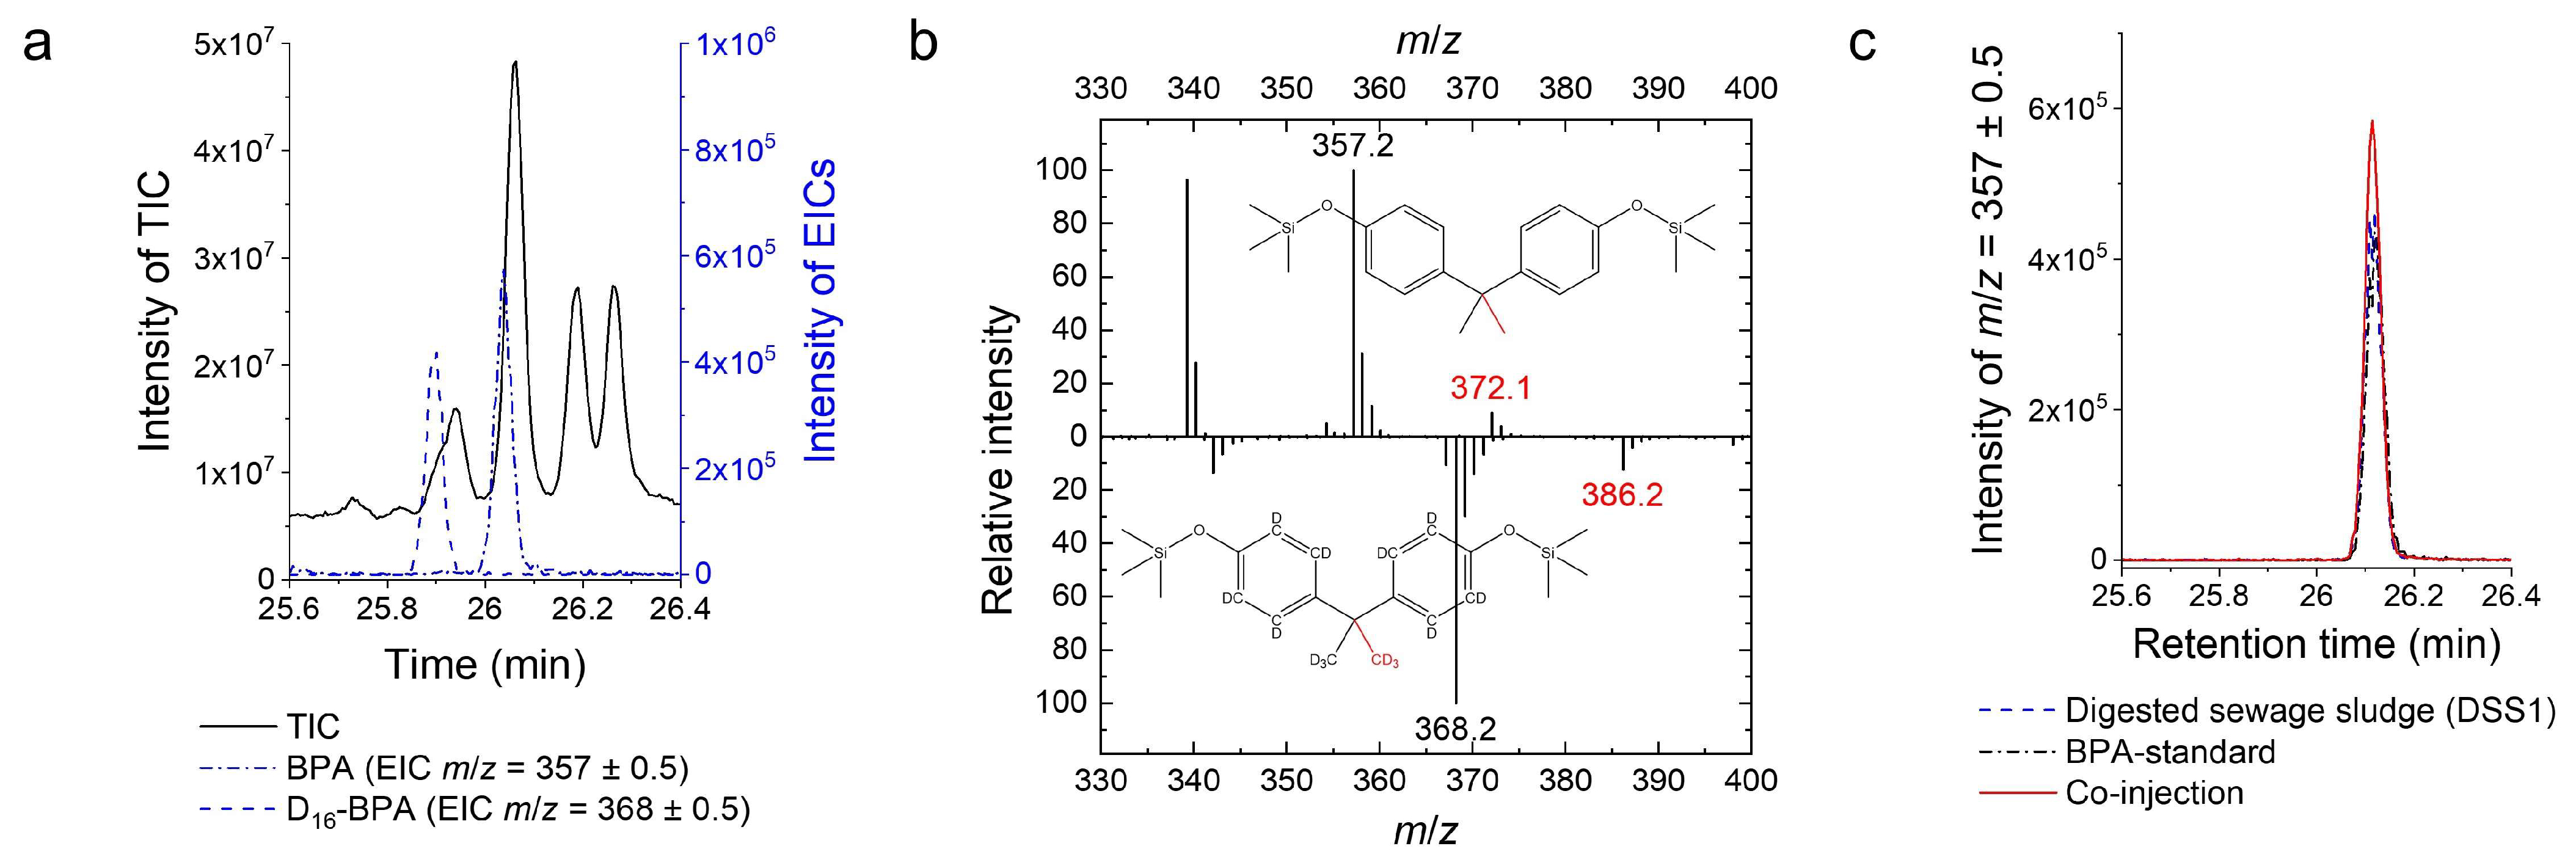
BPA concentrations were determined from the peak areas of the extracted ion chromatograms (Figure 2a) of the most abundant specific fragments of the TMS derivatives of the analyte, BPA (m/z = 357 ± 0.5, [M-CH3]+), and the internal standard, D16-BPA (m/z = 368 ± 0.5, [M-CD3]+) (Figure 2b). Furthermore, the presence of BPA in samples was confirmed with the co-injection of a 50:50 mixture of the sample and a BPA standard solution with a similar concentration (Figure 2c). The molecular ions at m/z = 372 ± 0.5 (BPA) and m/z = 386 ± 0.5 (D16-BPA) were used for confirmation. The quantifier ions were caused by the cleavage of a methyl group or a deuterated methyl group, respectively. For quantification, the response factor () was determined by comparing the quantifier ion isotope patterns of the BPA and D16-BPA standards within the linear working range.
The BPA concentration in aqueous sludge was calculated according to
where BPA concentration in aqueous sludge (µg kg−1), added concentration of D16-BPA, peak area of EIC m/z 357 ± 0.5, peak area of EIC m/z 368 ± 0.5, and response factor = 1.109. The peak areas were calculated for the EICs with the Xcalibur software (Thermo Fisher Scientific, US), using a baseline window of 40, an area noise factor of 5, and a peak noise factor of 10. The final ratio of ranged from 0.15 to 2.5, in which linearity was proven. The limit of quantification (LOQ) for BPA was calculated using the signal-to-noise ratio (S/N) for each sample [43]. An S/N of 10 was considered acceptable for the calculation of the BPA concentration.
The concentration of BPA was calculated in µg per kg of aqueous (wet) sludge for several reasons: (a) due to the viscosity and biological activity of several sludges, their volumes could not be measured; (b) the internal standard had to be added to aqueous sludge to account for sorption; (c) for normalization of the removal, the concentration in dry sludge was a misleading parameter, since the dry mass was drastically reduced during incubation, but the aqueous mass was relatively stable. However, for all samples except the sludge from CoD1, the density was around 1.0 kg L−1, and concentration in µg kg−1 was equal to the concentration in µg L−1.
Removal efficiencies were calculated using
where BPA concentration in aqueous sludge (µg kg−1) before incubation, and BPA concentration in aqueous sludge (µg kg−1) after incubation.
2.6. Statistical Analysis
The methane yields of reactors with and without additional BPA were compared through a paired two-tailed t-test (n = 6). The carbon dioxide yields were compared in the same manner. In addition, the BPA concentrations before and after fermentation were compared. Depending on the equality of variances, Student’s or Welch’s t-test (both two-tailed) was performed to compare the concentrations before and after fermentation. Pearson correlation coefficients were calculated for endogenous BPA concentrations and concentration changes (removal) in untreated (n = 5) and spiked sludges (n = 6). The differences were considered statistically significant for p ≤ 0.05.
3. Results and Discussion
After establishing the analytical methodology, we studied BPA removal in six different anaerobic digester sludges. Removal was defined as the relative decrease in BPA concentration in aqueous sludge through incubation experiments. In particular, BPA removal in sludge samples spiked with BPA (228 µg kg−1) was compared with that in untreated control samples, considering the endogenous BPA content of the samples. In addition, this study compared the biogas production in untreated and spiked sludges to assess the potential influence of BPA on the microbiome of the three digested sewage sludges and three co-digester inoculates.
3.1. Bisphenol a Fragmentation and Matrix-Matched Calibration
To quantify BPA in the complex matrix of sludge, we used D16-BPA as an internal standard. This involved applying MAE, derivatization (trimethylsilylation), and, subsequently, gas chromatography–mass spectrometry (GC-MS). Matrix-matched calibration with a deuterated internal standard was the most straightforward calibration strategy, allowing a high throughput of samples. As expected, the deuterated standard eluted several seconds before the analyte (Figure 2a) [44]. The addition of the deuterated internal standard before extraction allowed direct quantification despite high matrix interference and varying recovery rates [45]. In this case, MAE generally had high recovery rates and was well suited for dried sludge samples. Moreover, GC-MS of the derivatized samples provided reliable limits of detection (LOD) and quantification (LOQ), and an efficient linearity range.
Importantly, the base fragment [M-CD3]+ (m/z 368) was used as a quantifier for D16-BPA. To enable comparison with the base peak [M-CH3]+ (m/z 357) of the analyte BPA, a response factor was calculated. This response factor takes into account the fact that there are more possibilities for the formation of the [M-CH3]+ fragment than for [M-CD3]+, since the silylated alcohol groups (TMS) are not deuterium-labeled. Furthermore, isotopic signatures were used to determine the impact of partially labeled D16-BPA molecules. The response factor also corrected for this effect.
3.2. Biogas Production of Various Anaerobic Sludges in the Presence of BPA
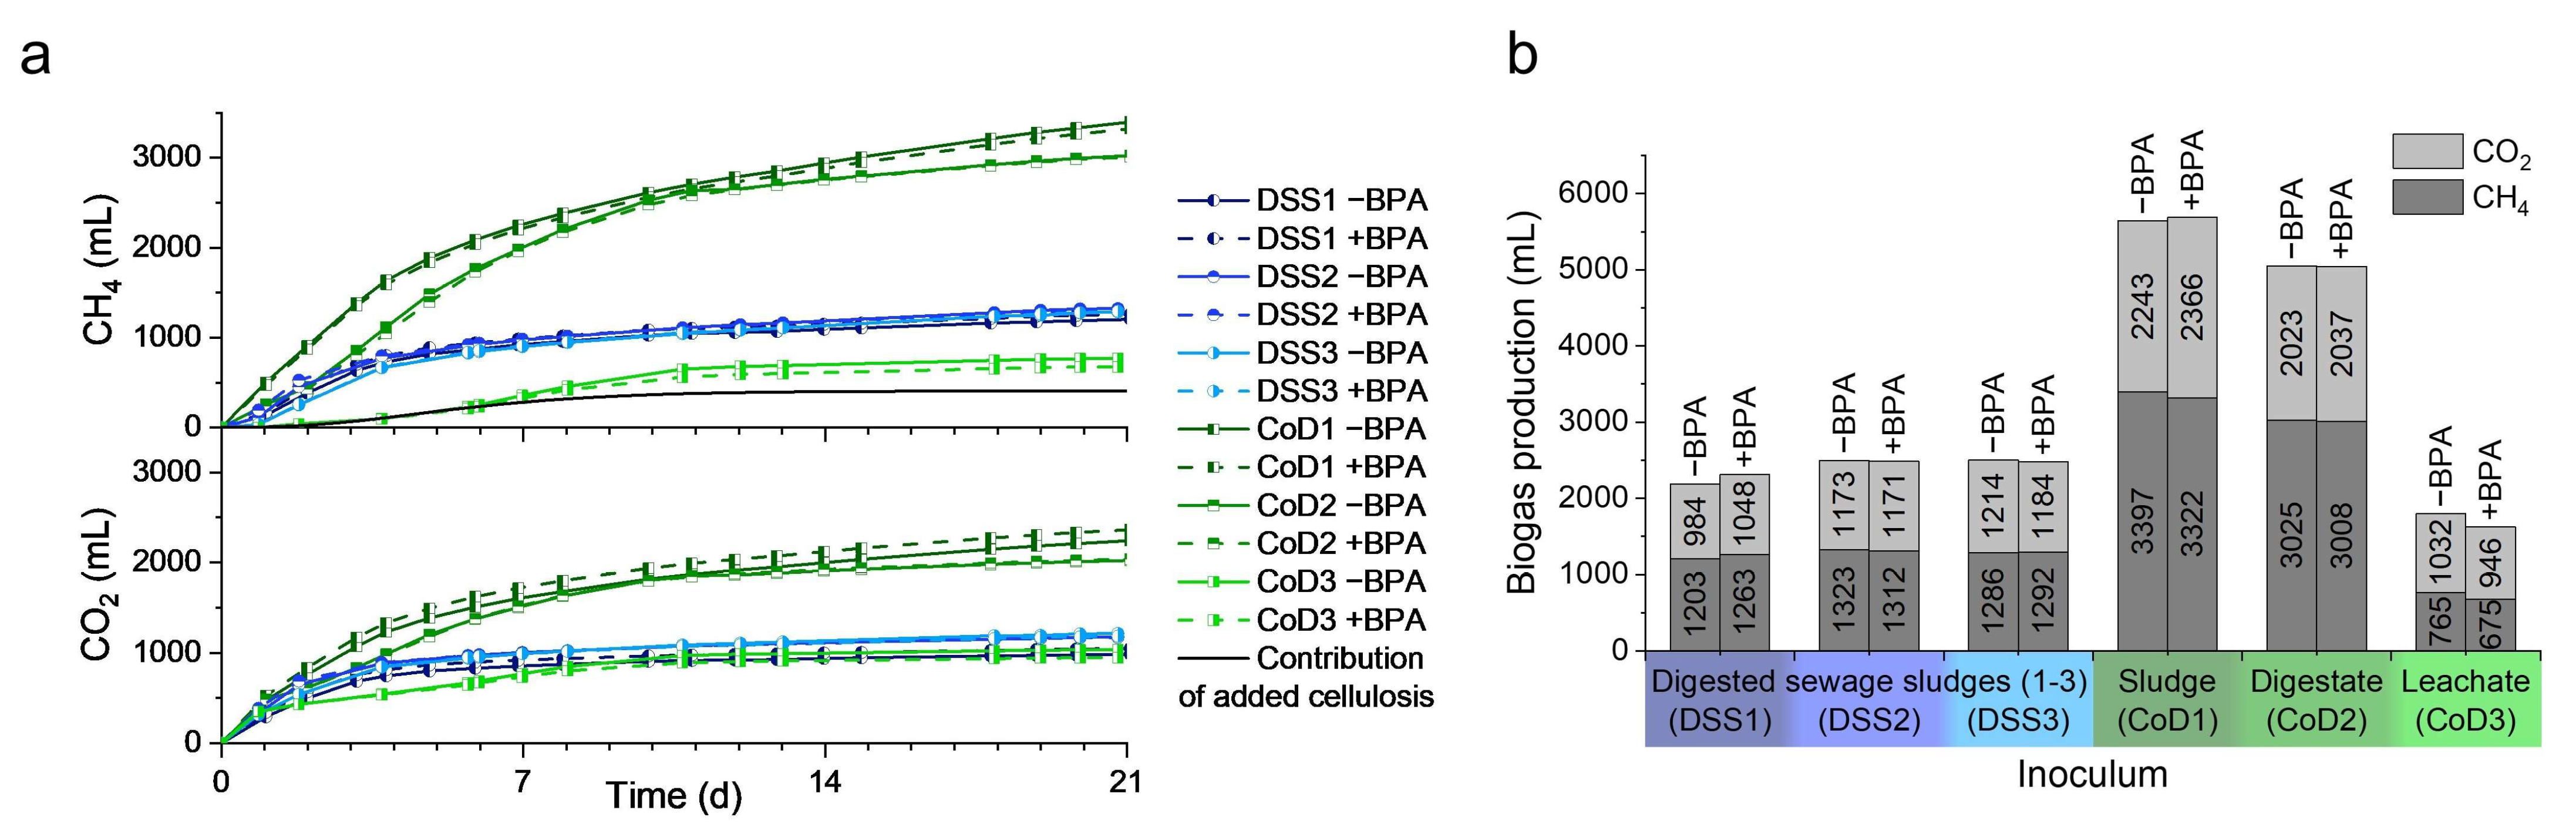
To characterize the influence of BPA on biogas production, untreated inoculums were compared with those spiked with BPA in three digested sewage sludges (DSS) and three co-digester inoculates (CoD) (Figure 3). Notably, only negligible differences in methane and carbon dioxide production were observed upon BPA addition (228 µg kg−1 BPA) (Figure 3a). In addition, a paired t-test showed no significant changes in either carbon dioxide (p = 0.669) or methane (p = 0.394) production (Figure 3b). On a related note, previous studies have reported that the addition of small amounts of BPA (3.6 µg L−1) inhibited methanogenesis by approximately 24% in anaerobically digested sludge [46]. In contrast to these results, elevated amounts of BPA administered to the sludges in the present study (228 µg kg−1) did not significantly change methane production. The microbiomes associated with five sludges were probably adapted to high BPA concentrations (see Figure 4). However, the apparent resilience of the microbiome of the sixth sludge (CoD1) could not be explained by adaptation, since the sludge did not contain endogenous BPA. The microbiome of CoD1 might be more resilient due to different taxonomic compositions, as observed by Abendroth et al. [38], or the higher cell and particle content (11.7% dry mass) of the sludge. Furthermore, the inoculates revealed high endogenous methanogenic activity compared with the estimated contribution of the added substrate (Figure 3a, black line).
3.3. Endogenous Concentrations of BPA in Various Sludge Types
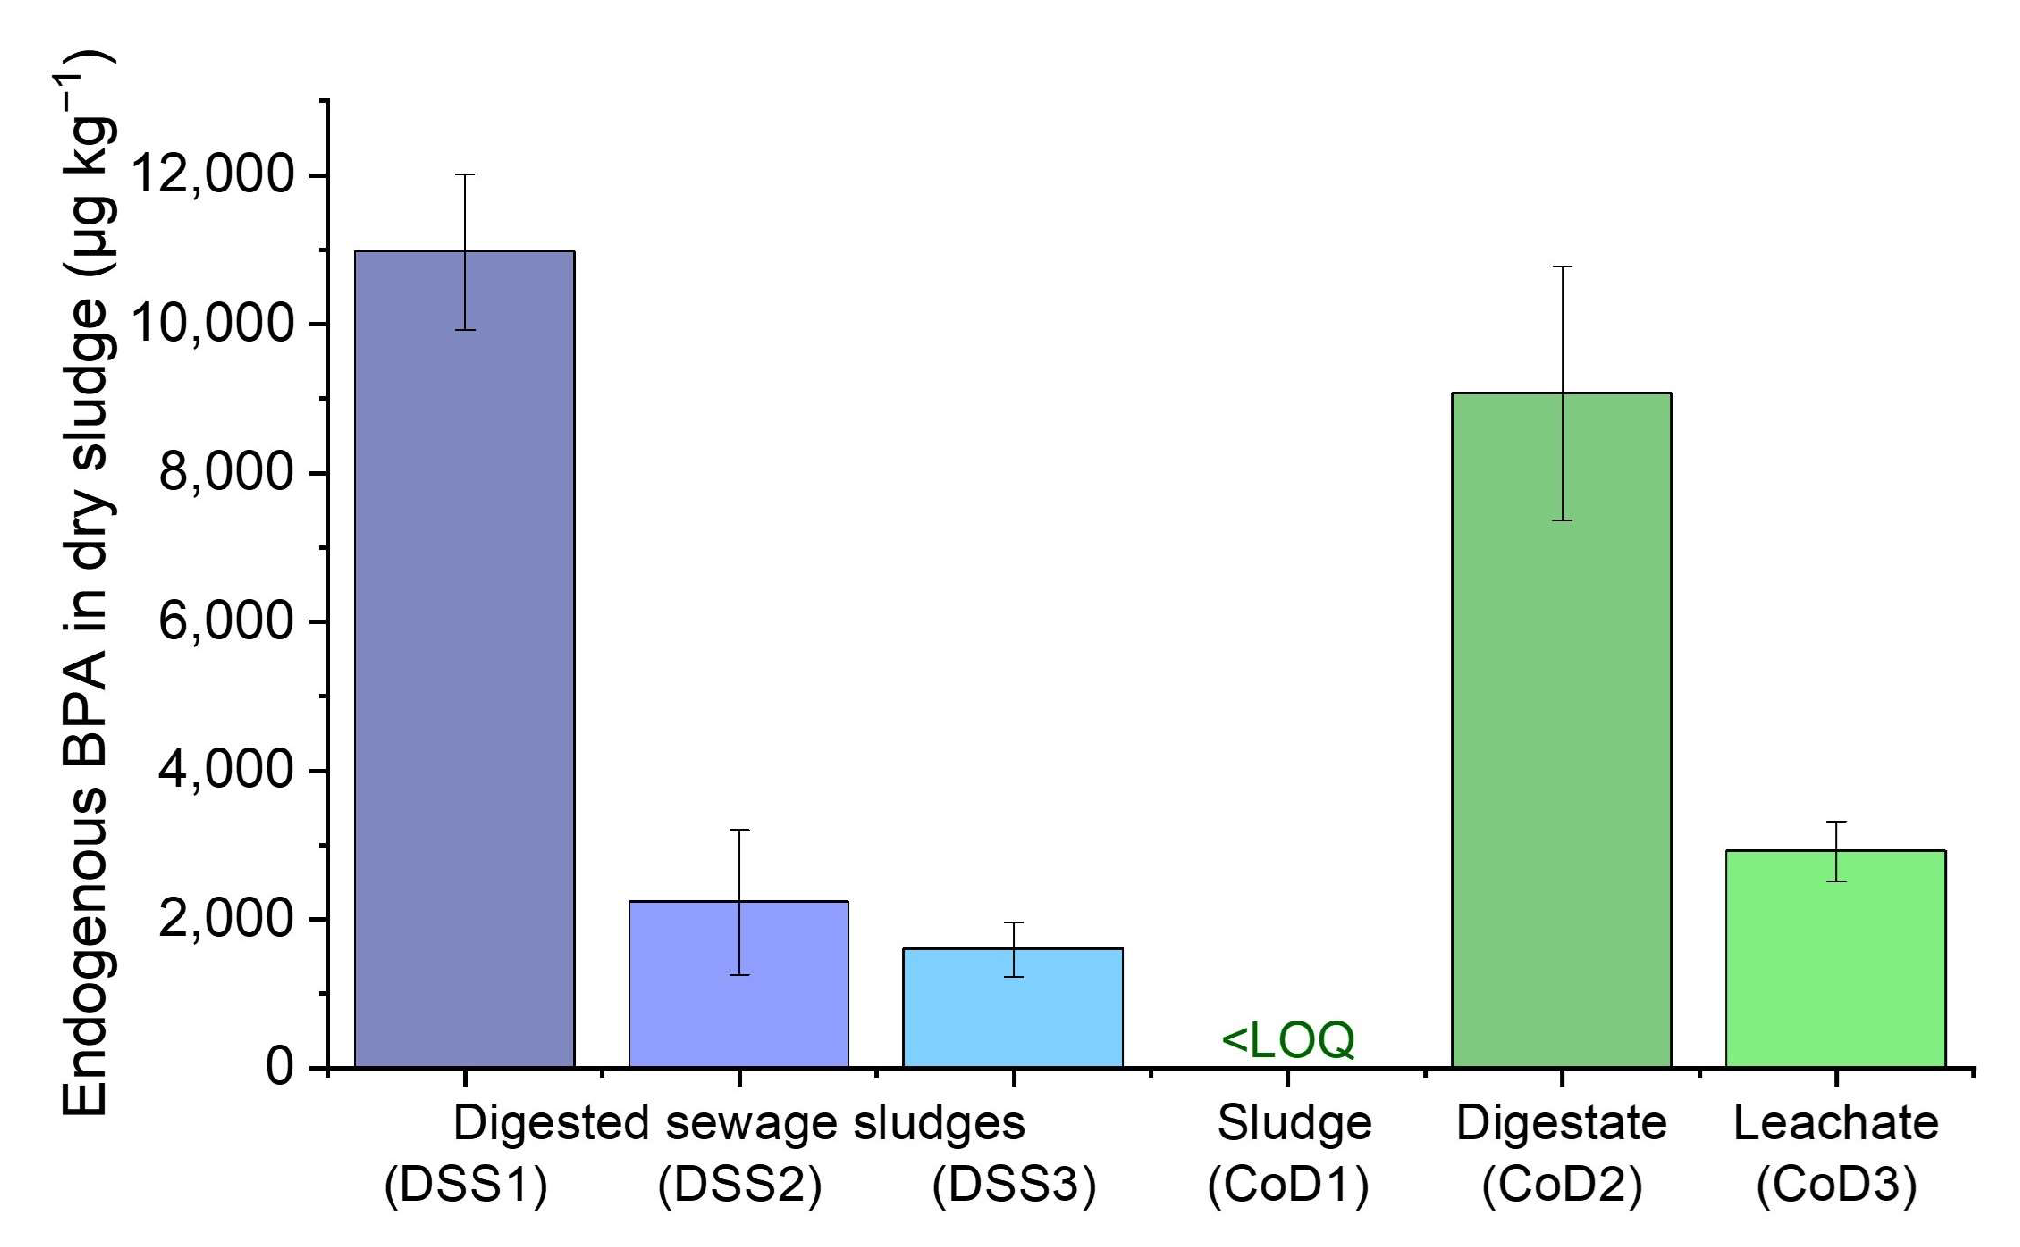
The BPA concentration in untreated samples was measured for anaerobic sludges to determine the endogenous content before spiking with BPA (Figure 4). The concentration in the sludges (dry weight) varied strongly. In the digested sewage sludges, the concentration ranged from 1596 to 10,973 µg kg−1, and in the co-digester sludges, the values ranged from below the LOQ up to 9069 µg kg−1, depending on the individual digester. The endogenous BPA concentration in digested sewage sludge was at the higher end of the reported spectrum of BPA concentrations in digested sewage sludge. It was relatively similar to other German WWTPs (n = 15, c = 152–28,380 µg kg−1, median 712 µg kg−1) [22,23], but higher compared with Canadian WWTPs (n = 78, c = 27–4600 µg kg−1, median 290 µg kg−1) [24].
BPA is commonly found in industrial wastewaters, particularly from paper recycling [47,48]. As the sampled DSS received wastewater from a paper recycling plant, DSS1 potentially had far higher concentrations of BPA than the other two digested sewage sludges.
Furthermore, the determined endogenous BPA concentration in the co-digested sludges was consistent with the expected BPA content of the various substrates for the co-digesters (Figure 4, CoD1–3). CoD1 received silage, farm manure, and livestock and farming waste, which should contain low amounts of BPA, according to a European Union risk assessment report [49]. Conversely, CoD2 received packaged—and subsequently shredded—food waste, which was likely contaminated with BPA [50]. CoD3 received the organic fraction of municipal solid waste, which was very likely to contain receipt slips, known for their high BPA content [51], thus explaining the BPA values.
3.4. BPA Removal under Anaerobic Conditions
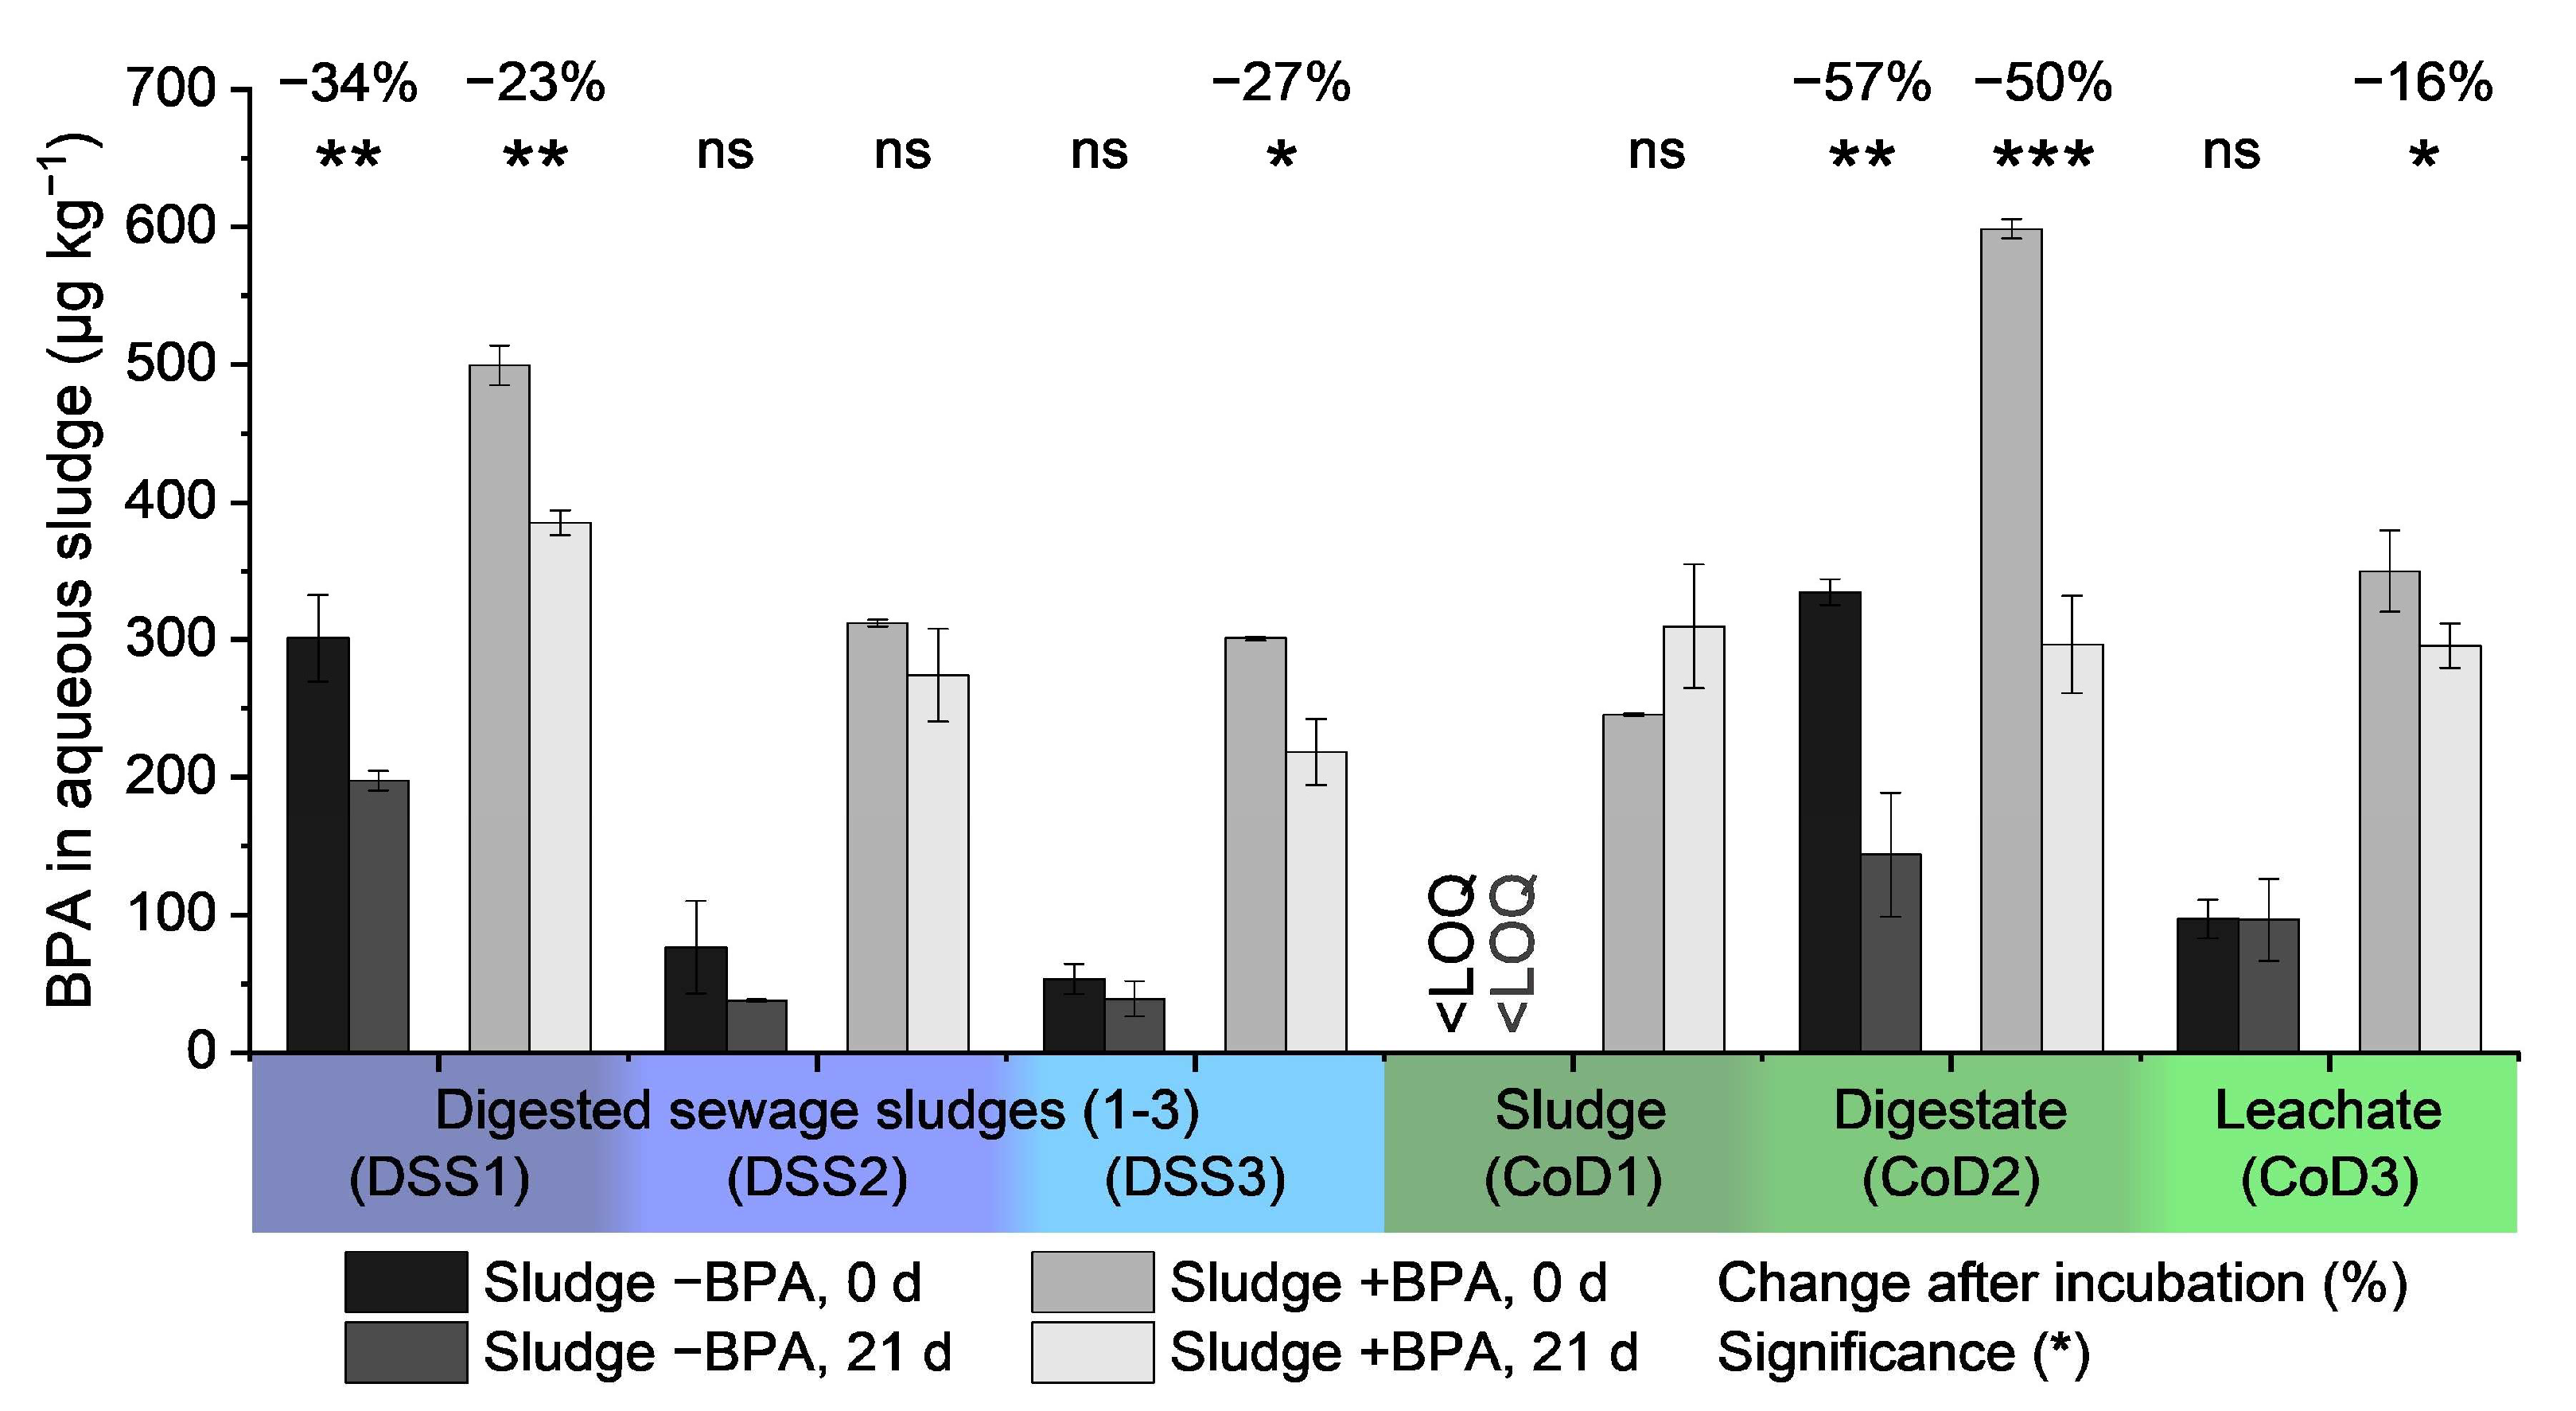
Most importantly, our study demonstrated varying BPA removal capabilities under anaerobic conditions, depending on the inoculum (Figure 5). BPA removal efficiencies ranged from 16 to 57%. We observed significant BPA removal in two of six sludges without additional BPA spiking (DSS1, CoD2) and four of six sludges with BPA spiking (228 µg kg−1). Throughout the treatments, no change in BPA concentration was recorded in the other four cases without BPA spiking and the other two cases with spiking. Notably, even the addition of BPA did not cause any change in the two sludges (DSS2, CoD1).
We observed that the higher the BPA concentration, the higher the absolute removal (−BPA: Pearson correlation coefficient r = 0.921, n = 5, p < 0.05; +BPA: r = 0.858, n = 6, p < 0.05; Figure 6), which indicated a first-order reaction.
High endogenous BPA concentrations may trigger BPA removal due to potential acclimation of the microbial community and subsequent triggered BPA degradation. This conclusion is supported by the observation that BPA addition induced removal within 21 days in two sludges (Figure 5, DSS3, CoD3). Additionally, the two sludges that removed BPA without spiking showed high endogenous BPA concentrations (>8000 µg kg−1 dry weight, Figure 4).
In our study, high recovery rates (98.7–100.6%) of BPA from sludge samples were achieved using MAE, which was comparable to other studies [53,54]. More importantly, the internal standard can compensate for analyte loss in the analytical process. Therefore, we conclude that adsorption and biosorption are negligible for the BPA removal observed in our study. Notably, even in sludge with the highest TS content (11.7 ± 0.3%, CoD1), no significant change in BPA concentration was measured, whereas sludge with a low TS content (2.7 ± 0.03%, DSS1) showed BPA removal. Therefore, reasons other than sorption processes must be considered for the observed BPA removal. We suggest that syntrophic bacteria degrade BPA, which is typical for aromatic compounds under methanogenic conditions. For example, benzoate, gentisate, and hydroquinone are degraded by syntrophic co-cultures [55]. Thus, BPA might be transformed and subsequently degraded via the benzoyl-CoA pathway [56]. Indeed, several bacteria that can degrade aromatic compounds under methanogenic conditions in a Birch-like reaction are often found in anaerobic sludges (e.g., the mixotroph Rhodopseudomonas palustris and nitrate-reducing Thauera aromatica) [57,58,59].
4. Conclusions
In summary, the mass spectrometry-based methodology and the application of an internal standard allow BPA to be quantified, even in complex matrices. Unfortunately, no inter-laboratory tests or certified standards for BPA are available for digested sludges. To our knowledge, this is the first study that unequivocally demonstrates anaerobic BPA removal by applying D16-BPA. The BPA removal capability and its persistence under anaerobic conditions depended on the sampled digesters. Interestingly, inoculates with already high endogenous BPA concentrations removed BPA efficiently (up to 57%), presumably because BPA-degrading bacteria were adapted to high BPA concentrations. We propose a combination of several inoculates with well-adapted microbiomes to aid in the biodegradation of micropollutants, as the underlying mechanism of microbiological degradation is largely unknown.
Supplementary Materials
The following are available online at https://0-www-mdpi-com.brum.beds.ac.uk/article/10.3390/pollutants1040016/s1, Table S1: Seeding sludges and plant parameters.
Author Contributions
Conceptualization, C.A. and T.W.; Formal analysis, J.H.; Investigation, J.H.; Methodology, J.H., C.A. and T.W.; Resources, P.B., C.A. and T.W.; Supervision, P.B., C.A. and T.W.; Validation, J.H. and T.W.; Visualization, J.H.; Writing—Original draft, J.H.; Writing—Review and editing, C.A. and T.W. All authors have read and agreed to the published version of the manuscript.
Funding
This research was funded by the Friedrich Schiller University Jena (Germany) (‘Landesgraduiertenstipendium’ of the Free State of Thuringia) and the German Ministry of Economic Affairs and Energy (grant numbers 16KN041348 and 16KN070128).
Data Availability Statement
Data is contained within the article or supplementary material.
Acknowledgments
We wish to thank the Bio H2 Umwelt GmbH, the BioEnergie Verbund e.V. and the Robert Boyle Institut e.V. for their technical support.
Conflicts of Interest
The authors declare no conflict of interest. The funders had no role in the design of the study; in the collection, analyses, or interpretation of data; in the writing of the manuscript, or in the decision to publish the results.
References
- Zielińska, M.; Wojnowska-Baryła, I.; Cydzik-Kwiatkowska, A. Bisphenol A Removal from Water and Wastewater; Springer: Berlin/Heidelberg, Germany, 2018. [Google Scholar] [CrossRef]
- Diamanti-Kandarakis, E.; Bourguignon, J.-P.; Giudice, L.C.; Hauser, R.; Prins, G.S.; Soto, A.M.; Zoeller, R.T.; Gore, A.C. Endocrine-Disrupting Chemicals: An Endocrine Society Scientific Statement. Endocr. Rev. 2009, 30, 293–342. [Google Scholar] [CrossRef] [PubMed]
- Malm, J. Inclusion of Substances of Very High Concern in the Candidate List for Eventual Inclusion in Annex XIV; European Chemicals Agency: Helsinki, Finland, 2017.
- European Chemicals Agency. SVHC Support Document—4,4′-Isopropylidenediphenol; European Chemicals Agency: Helsinki, Finland, 2017.
- Global Industry Analysts. Global Bisphenol A Industry; Global Industry Analysts Inc.: San Jose, CA, USA, 2021. [Google Scholar]
- Pivnenko, K.; Pedersen, G.A.; Eriksson, E.; Astrup, T. Bisphenol A and its structural analogues in household waste paper. Waste Manag. 2015, 44, 39–47. [Google Scholar] [CrossRef] [Green Version]
- Gehring, M.; Tennhardt, L.; Vogel, D.; Weltin, D.; Bilitewski, B. Sources of Bisphenol A in Wastewater and Sewage Sludge. In Matter and Particle Transport in Surface and Subsurface Flow, Proceedings of the 3rd International Conference on Water Resources and Environment Research; Schmitz, G.H., Ed.; Pirna: Dresden, Germany, 2002; Volume 28/2, pp. 111–114. [Google Scholar]
- US EPA. Advanced notice of proposed rulemaking: Testing of bisphenol A. Fed. Reg. 2011, 76, 44535–44547. [Google Scholar]
- Mohapatra, D.; Brar, S.; Tyagi, R.; Surampalli, R. Physico-chemical pre-treatment and biotransformation of wastewater and wastewater Sludge—Fate of bisphenol A. Chemosphere 2010, 78, 923–941. [Google Scholar] [CrossRef]
- Corrales, J.; Kristofco, L.; Steele, W.B.; Yates, B.S.; Breed, C.S.; Williams, E.S.; Brooks, B.W. Global Assessment of Bisphenol A in the Environment. Dose-Response 2015, 13, 1559325815598308. [Google Scholar] [CrossRef] [Green Version]
- Sosa-Ferrera, Z.; Mahugo-Santana, C.; Santana-Rodríguez, J.J. Analytical Methodologies for the Determination of Endocrine Disrupting Compounds in Biological and Environmental Samples. BioMed Res. Int. 2013, 2013, 1–23. [Google Scholar] [CrossRef] [PubMed]
- Lee, H.B.; Peart, T.E. Determination of bisphenol A in sewage effluent and sludge by solid-phase and supercritical fluid extraction and gas chromatography/mass spectrometry. J. Assoc. Off. Anal. Chem. 2000, 83, 290–298. [Google Scholar] [CrossRef] [Green Version]
- Urase, T.; Kikuta, T. Separate estimation of adsorption and degradation of pharmaceutical substances and estrogens in the activated sludge process. Water Res. 2005, 39, 1289–1300. [Google Scholar] [CrossRef] [PubMed]
- Zhao, J.; Li, Y.; Zhang, C.; Zeng, Q.; Zhou, Q. Sorption and degradation of bisphenol A by aerobic activated sludge. J. Hazard. Mater. 2008, 155, 305–311. [Google Scholar] [CrossRef]
- Im, J.; Löffler, F.E. Fate of Bisphenol A in Terrestrial and Aquatic Environments. Environ. Sci. Technol. 2016, 50, 8403–8416. [Google Scholar] [CrossRef]
- Li, G.; Zu, L.; Wong, P.K.; Hui, X.; Lu, Y.; Xiong, J.; An, T. Biodegradation and detoxification of bisphenol A with one newly-isolated strain Bacillus sp. GZB: Kinetics, mechanism and estrogenic transition. Bioresour. Technol. 2012, 114, 224–230. [Google Scholar] [CrossRef] [PubMed]
- Yang, Y.; Wang, Z.; He, T.; Dai, Y.; Xie, S. Sediment Bacterial Communities Associated with Anaerobic Biodegradation of Bisphenol A. Microb. Ecol. 2014, 70, 97–104. [Google Scholar] [CrossRef] [PubMed]
- Limam, I.; Mezni, M.; Guenne, A.; Madigou, C.; Driss, M.R.; Bouchez, T.; Mazéas, L. Evaluation of biodegradability of phenol and bisphenol A during mesophilic and thermophilic municipal solid waste anaerobic digestion using 13C-labeled contaminants. Chemosphere 2013, 90, 512–520. [Google Scholar] [CrossRef]
- Yang, S.; McDonald, J.; Hai, F.; Price, W.E.; Khan, S.; Nghiem, L.D. The fate of trace organic contaminants in sewage sludge during recuperative thickening anaerobic digestion. Bioresour. Technol. 2017, 240, 197–206. [Google Scholar] [CrossRef] [PubMed]
- Phan, H.V.; Wickham, R.; Xie, S.; McDonald, J.; Khan, S.; Ngo, H.H.; Guo, W.; Nghiem, L.D. The fate of trace organic contaminants during anaerobic digestion of primary sludge: A pilot scale study. Bioresour. Technol. 2018, 256, 384–390. [Google Scholar] [CrossRef]
- Choi, Y.J.; Nies, L.F.; Lee, L.S. Persistence of three bisphenols and other trace organics of concern in anaerobic sludge under methanogenic conditions. Environ. Technol. 2019, 42, 1373–1382. [Google Scholar] [CrossRef]
- Gehring, M. Verhalten der Endokrin Wirksamen Substanz Bisphenol A bei der Kommunalen Abwasserentsorgung (Behaviour of the Endocrine Disrupting Substance Bisphenol A in Municipal Wastewater Disposal). Ph.D. Thesis, Technische Universität Dresden, Dresden, Germany, 2004. [Google Scholar]
- Weltin, D.; Gehring, M.; Tennhardt, L.; Vogel, D.; Bilitewski, B. Occurrence and Fate of Bisphenol A during Wastewater and Sewage Sludge Treatment in Selected German Wastewater Treatment Plants; American Water Works Association: Denver, CO, USA, 2002. [Google Scholar]
- Guerra, P.; Kim, M.; Teslic, S.; Alaee, M.; Smyth, S. Bisphenol-A removal in various wastewater treatment processes: Operational conditions, mass balance, and optimization. J. Environ. Manag. 2015, 152, 192–200. [Google Scholar] [CrossRef]
- Gonzalez-Gil, L.; Mauricio-Iglesias, M.; Serrano, D.; Lema, J.M.; Carballa, M. Role of methanogenesis on the biotransformation of organic micropollutants during anaerobic digestion. Sci. Total. Environ. 2018, 622–623, 459–466. [Google Scholar] [CrossRef]
- Samaras, V.G.; Stasinakis, A.S.; Thomaidis, N.; Mamais, D.; Lekkas, T.D. Fate of selected emerging micropollutants during mesophilic, thermophilic and temperature co-phased anaerobic digestion of sewage sludge. Bioresour. Technol. 2014, 162, 365–372. [Google Scholar] [CrossRef]
- Wijekoon, K.C.; McDonald, J.; Khan, S.; Hai, F.; Price, W.E.; Nghiem, L.D. Development of a predictive framework to assess the removal of trace organic chemicals by anaerobic membrane bioreactor. Bioresour. Technol. 2015, 189, 391–398. [Google Scholar] [CrossRef] [Green Version]
- Leal, L.H.; Vieno, N.; Temmink, H.; Zeeman, G.; Buisman, C.J.N. Occurrence of Xenobiotics in Gray Water and Removal in Three Biological Treatment Systems. Environ. Sci. Technol. 2010, 44, 6835–6842. [Google Scholar] [CrossRef]
- Brandt, E.M.; de Queiroz, F.B.; Afonso, R.J.; Aquino, S.; Chernicharo, C.A. Behaviour of pharmaceuticals and endocrine disrupting chemicals in simplified sewage treatment systems. J. Environ. Manag. 2013, 128, 718–726. [Google Scholar] [CrossRef] [PubMed] [Green Version]
- Arias, A.; Alvarino, T.; Allegue, T.; Suárez, S.; Garrido, J.; Omil, F. An innovative wastewater treatment technology based on UASB and IFAS for cost-efficient macro and micropollutant removal. J. Hazard. Mater. 2018, 359, 113–120. [Google Scholar] [CrossRef]
- Moya-Llamas, M.J.; Trapote, A.; Prats, D. Removal of micropollutants from urban wastewater using a UASB reactor coupled to a MBR at different organic loading rates. Urban Water J. 2018, 15, 437–444. [Google Scholar] [CrossRef]
- Monsalvo, V.M.; McDonald, J.; Khan, S.; Le-Clech, P. Removal of trace organics by anaerobic membrane bioreactors. Water Res. 2014, 49, 103–112. [Google Scholar] [CrossRef] [PubMed]
- Gonzalez-Gil, L.; Mauricio-Iglesias, M.; Carballa, M.; Lema, J.M. Why are organic micropollutants not fully biotransformed? A mechanistic modelling approach to anaerobic systems. Water Res. 2018, 142, 115–128. [Google Scholar] [CrossRef] [PubMed]
- Carneiro, R.B.; Gonzalez-Gil, L.; Londoño, Y.A.; Zaiat, M.; Carballa, M.; Lema, J.M. Acidogenesis is a key step in the anaerobic biotransformation of organic micropollutants. J. Hazard. Mater. 2019, 389, 121888. [Google Scholar] [CrossRef]
- Harb, M.; Lou, E.; Smith, A.L.; Stadler, L.B. Perspectives on the fate of micropollutants in mainstream anaerobic wastewater treatment. Curr. Opin. Biotechnol. 2019, 57, 94–100. [Google Scholar] [CrossRef]
- Lim, M.; Patureau, D.; Heran, M.; Lesage, G.; Kim, J. Removal of organic micropollutants in anaerobic membrane bioreactors in wastewater treatment: Critical review. Environ. Sci. Water Res. Technol. 2020, 6, 1230–1243. [Google Scholar] [CrossRef]
- Gonzalez-Gil, L.; Carballa, M.; Lema, J.M. Removal of organic micro-pollutants by anaerobic microbes and enzymes. In Current Developments in Biotechnology and Bioengineering; Elsevier: Amsterdam, The Netherlands, 2020; pp. 397–426. [Google Scholar] [CrossRef]
- Abendroth, C.; Vilanova, C.; Günther, T.; Luschnig, O.; Porcar, M. Eubacteria and archaea communities in seven mesophile anaerobic digester plants in Germany. Biotechnol. Biofuels 2015, 8, 87. [Google Scholar] [CrossRef] [Green Version]
- VDI-Gesellschaft Energie und Umwelt. Fermentation of Organic Materials: Characterisation of the Substrate, Sampling, Collection of Material Data, Fermentation Tests; Verein Deutscher Ingenieure e.V.: Freiburg im Breisgau, Germany, 2016; Volume 4630. [Google Scholar]
- Buswell, A.M.; Mueller, H.F. Mechanism of Methane Fermentation. Ind. Eng. Chem. 1952, 44, 550–552. [Google Scholar] [CrossRef]
- Chandler, J.A.; Jewell, W.J.; Gossett, J.M.; Vansoest, P.J.; Robertson, J.B. Predicting Methane Fermentation Biodegradability. Biotechnol. Bioeng. 1980, 22, 93–107. [Google Scholar]
- Nielfa, A.; Cano, R.; Fdz-Polanco, M. Theoretical methane production generated by the co-digestion of organic fraction municipal solid waste and biological sludge. Biotechnol. Rep. 2014, 5, 14–21. [Google Scholar] [CrossRef] [PubMed] [Green Version]
- Reichenbächer, M.; Einax, J.W. Challenges in Analytical Quality Assurance; Springer: Berlin/Heidelberg, Germany, 2011. [Google Scholar] [CrossRef]
- Hübschmann, H.-J. Handbook of GC/MS: Fundamentals and Applications, 2nd ed.; Wiley: Hoboken, NJ, USA, 2009; p. 719. [Google Scholar]
- Cunha, S.; Almeida, C.; Mendes, E.; Fernandes, J. Simultaneous determination of bisphenol A and bisphenol B in beverages and powdered infant formula by dispersive liquid–liquid micro-extraction and heart-cutting multidimensional gas chromatography-mass spectrometry. Food Addit. Contam. Part A 2011, 28, 513–526. [Google Scholar] [CrossRef] [PubMed]
- Wei, W.; Huang, Q.-S.; Sun, J.; Wang, J.-Y.; Wu, S.-L.; Ni, B.-J. Polyvinyl Chloride Microplastics Affect Methane Production from the Anaerobic Digestion of Waste Activated Sludge through Leaching Toxic Bisphenol-A. Environ. Sci. Technol. 2019, 53, 2509–2517. [Google Scholar] [CrossRef]
- Fürhacker, M.; Scharf, S.; Weber, H. Bisphenol A: Emissions from point sources. Chemosphere 2000, 41, 751–756. [Google Scholar] [CrossRef]
- Petrie, B.; Lopardo, L.; Proctor, K.; Youdan, J.; Barden, R.; Kasprzyk-Hordern, B. Assessment of bisphenol-A in the urban water cycle. Sci. Total. Environ. 2018, 650, 900–907. [Google Scholar] [CrossRef]
- Munn, S.; Allanou, R.; Aschberger, K.; Berthault, F.; De Bruijn, J.; Musset, C.; O’Connor, S.; Pakalin, S.; Pellegrini, G.; Scheer, S.; et al. European Union Risk Assessment Report. Bisphenol A. CAS No. 80-05-EINECS No. 201-245-EUR 20843 EN.; JRC26023; Office for Official Publications of the European Communities: Luxembourg, 2003. [Google Scholar]
- Geens, T.; Apelbaum, T.Z.; Goeyens, L.; Neels, H.; Covaci, A. Intake of bisphenol A from canned beverages and foods on the Belgian market. Food Addit. Contam. Part A 2010, 27, 1627–1637. [Google Scholar] [CrossRef]
- Geens, T.; Goeyens, L.; Kannan, K.; Neels, H.; Covaci, A. Levels of bisphenol-A in thermal paper receipts from Belgium and estimation of human exposure. Sci. Total. Environ. 2012, 435–436, 30–33. [Google Scholar] [CrossRef]
- York, D.; Evensen, N.M.; Martinez, M.L.; Delgadob, J.D.B. Unified equations for the slope, intercept, and standard errors of the best straight line. Am. J. Phys. 2004, 72, 367–375. [Google Scholar] [CrossRef]
- Llompart, M.; Celeiro, M.; Dagnac, T. Microwave-assisted extraction of pharmaceuticals, personal care products and industrial contaminants in the environment. TrAC Trends Anal. Chem. 2019, 116, 136–150. [Google Scholar] [CrossRef]
- Dorival-García, N.; Zafra-Gómez, A.; Navalón, A.; Vílchez, J. Analysis of bisphenol A and its chlorinated derivatives in sewage sludge samples. Comparison of the efficiency of three extraction techniques. J. Chromatogr. A 2012, 1253, 1–10. [Google Scholar] [CrossRef] [PubMed]
- Schink, B.; Stams, A.J.M. Syntrophism among Prokaryotes. In The Prokaryotes: Volume 2: Ecophysiology and Biochemistry; Dworkin, M., Falkow, S., Rosenberg, E., Schleifer, K.-H., Stackebrandt, E., Eds.; Springer: New York, NY, USA, 2006; pp. 309–335. [Google Scholar]
- Heider, J.; Fuchs, G. Anaerobic Metabolism of Aromatic Compounds. JBIC J. Biol. Inorg. Chem. 1997, 243, 577–596. [Google Scholar] [CrossRef] [PubMed]
- Thiele, B.; Rieder, O.; Golding, B.T.; Müller, M.; Boll, M. Mechanism of Enzymatic Birch Reduction: Stereochemical Course and Exchange Reactions of Benzoyl-CoA Reductase. J. Am. Chem. Soc. 2008, 130, 14050–14051. [Google Scholar] [CrossRef]
- Schink, B.; Philipp, B.; Müller, J. Anaerobic Degradation of Phenolic Compounds. Naturwissenschaften 2000, 87, 12–23. [Google Scholar] [CrossRef] [Green Version]
- Kyoto Encyclopedia of Genes and Genomes. Enzyme: 1.3.7.8 Benzoyl-CoA Reductase. Available online: https://www.genome.jp/dbget-bin/www_bget?ec:1.3.7.8 (accessed on 23 February 2021).
Figure 1.
Experimental design: (a) Anaerobic batch test following German standard VDI 4630, and (b) analytical workflow. Inoculates were digested in bottles (a1) under anaerobic mesophilic conditions (38 °C) in an orbital shaker (a2) connected to eudiometers (a3) with levelling bottles (a4) to allow quantitative and qualitative measurements of the produced biogas.

Figure 2.
Analytical methodology, method development, and method evaluation: Bisphenol A measurements in the complex matrix: (a) Total ion chromatogram (TIC) and extracted ion chromatograms (EICs) of the most abundant fragments of analyte (BPA) and standard (D16-BPA) used for quantification. (b) Mass spectra of the analyte (BPA) and the internal standard (D16-BPA) in the complex matrix. The mass spectra (m/z 330–400) at retention time 26.02–26.06 min (BPA) and 25.88–25.92 min (D16-BPA) show isotopic distributions of the molecular ions (red; m/z = 372, 386) and the most abundant fragments (m/z = 357, 368) of TMS-BPA and TMS-D16-BPA, respectively. Structures of the molecular ions of the TMS derivatives are depicted, and fragment loss is highlighted. A matrix peak can be seen at m/z 339 in the BPA spectrum. (c) The presence of BPA was confirmed by co-injection of the sample and the BPA standard solution with a similar concentration.

Figure 3.
Biogas production of different inoculates with and without additional bisphenol A: (a) Methane and carbon dioxide curve over 21 days. Three digested sewage sludges (DSS1–3), and three co-digester inoculates (CoD1–3) were tested with additional BPA (+BPA, dashed lines) and without (−BPA, solid lines). (b) The total methane and carbon dioxide yields for 21 days. Differences due to BPA addition were not statistically significant (paired t-test, n = 6, p = 0.39 for methane and p = 0.67 for carbon dioxide production).

Figure 4.
Endogenous bisphenol A concentration of various sludges (dry weight). Standard deviations of triplicates are represented by error bars.
Figure 4.
Endogenous bisphenol A concentration of various sludges (dry weight). Standard deviations of triplicates are represented by error bars.

Figure 5.
The anaerobic removal efficiency of bisphenol A for different sludge types. BPA concentrations in aqueous sludge (µg kg−1) are shown before and after digestion for 21 days in different anaerobic sludges. Spiked sludges (+BPA) received 228 µg kg−1 of BPA, and untreated samples (−BPA) were used without additional BPA. Anaerobic batch digestion occurred with three different digested sludges from WWTPs and seed sludges from three different co-digester plants. Standard deviations of the triplicates are represented by error bars. The significance level of removal is highlighted above each pair of bars, with the percentage change of BPA concentration (= −% removal efficiency) for significant values. A p-value > 0.05 was considered not significant (ns), while p-values ≤ 0.05 were considered significant, with p ≤ 0.05 (*), ≤0.01 (**), and ≤0.001 (***).

Figure 6.
Correlation of removal of bisphenol A with endogenous BPA concentration. Spiked sludges (+BPA) received 228 µg kg−1 of BPA, and untreated samples (−BPA) were used without additional BPA. Absolute removal and endogenous BPA concentration were calculated for six aqueous sludges (−BPA: Pearson correlation coefficient r = 0.921, n = 5, p < 0.05; +BPA: r = 0.858, n = 6, p < 0.05). Standard deviations of triplicates are represented by error bars. Linear regressions were calculated with x and y errors according to York et al. (2004) [52].


Table 1.
Anaerobic removal of bisphenol A (BPA): comparison of BPA changes in other studies.
| Experimental Setup | Sample/Inoculum | BPA Change | Study |
|---|---|---|---|
| Sample of 6 German WWTPs | Anaerobic digester | +68% | [22] |
| Sample of 83 Canadian WWTPs | Anaerobic digester | +50% | [24] |
| Semi-continuous, 37 °C, stirred, Germany | Digested sludge | +180 ± 113% (20 d) | [23] |
| Semi-continuous with recuperative thickening, 35 °C, recirculated, Australia. | Digested sludge | 0% (30 d) | [19] |
| Semi-continuous, 35 °C, stirred, Australia | Digested sludge | 0% (20 d) | [20] |
| Buffer solution batch, 25 °C, five days of incubation before BPA addition, daily shaking, USA | Digested sludge | 0% (28 d) | [21] |
| Carbonate buffer solution batch, 35 and 55 °C, not stirred, 45 days of incubation before BPA addition, France | Digested sludge | 0% (327 d) | [18] |
| Semi-continuous, 37 °C, stirred, 130 days of incubation before BPA addition, Spain | Digested sludge | −39 ± 8% (20 d) | [25] |
| Semi-continuous, 37 and 55 °C, stirred, 20 days of incubation before BPA addition, Greece | Digested sludge | −80 ± 15% (20 d) | [26] |
| Continuous, anaerobic membrane bioreactor, 35 °C, recirculated, 4 months of incubation before BPA addition, Australia | Digested sludge | −99.9 ± 0.0% (4 d) | [27] |
Positive value: increase in BPA; negative value: removal of BPA; d: hydraulic retention time (incubation time for batches) in days.
Publisher’s Note: MDPI stays neutral with regard to jurisdictional claims in published maps and institutional affiliations. |
© 2021 by the authors. Licensee MDPI, Basel, Switzerland. This article is an open access article distributed under the terms and conditions of the Creative Commons Attribution (CC BY) license (https://creativecommons.org/licenses/by/4.0/).
Share and Cite
MDPI and ACS Style
Hardegen, J.; Braeutigam, P.; Abendroth, C.; Wichard, T. Bisphenol A: Quantification in Complex Matrices and Removal by Anaerobic Sludges. Pollutants 2021, 1, 194-206. https://0-doi-org.brum.beds.ac.uk/10.3390/pollutants1040016
AMA Style
Hardegen J, Braeutigam P, Abendroth C, Wichard T. Bisphenol A: Quantification in Complex Matrices and Removal by Anaerobic Sludges. Pollutants. 2021; 1(4):194-206. https://0-doi-org.brum.beds.ac.uk/10.3390/pollutants1040016
Chicago/Turabian StyleHardegen, Justus, Patrick Braeutigam, Christian Abendroth, and Thomas Wichard. 2021. "Bisphenol A: Quantification in Complex Matrices and Removal by Anaerobic Sludges" Pollutants 1, no. 4: 194-206. https://0-doi-org.brum.beds.ac.uk/10.3390/pollutants1040016