Article

A Fundamental Study on the Transient Stability of Power Systems with High Shares of Solar PV Plants

1
Department of Electrical Sustainable Energy, Delft University of Technology, Mekelweg 4, 2628CD Delft, The Netherlands
2
TenneT TSO B.V, Utrechtseweg 310, 6812AR Arnhem, The Netherlands
*
Author to whom correspondence should be addressed.
Submission received: 24 September 2020 / Revised: 22 October 2020 / Accepted: 9 November 2020 / Published: 12 November 2020

Abstract

:
The last decade has seen an immense growth in renewable energy sources such as solar photovoltaic (PV) plants due to environmental concerns. Due to this rapid growth, solar PV plants are starting to have a larger influence on power system stability and thus their dynamic behavior cannot be ignored in stability studies. The lack of well-established models and parameter sets is the primary reason solar PV plants are not modeled with dynamic characteristics. This paper presents a method to define a standard parameter set for representing large-scale and aggregated solar PV plants in stability studies from the perspective of the transmission system operator (TSO). The method takes into account primarily the conditions provided in the grid connection requirements; for illustrative purposes, the connection requirements of the Netherlands are used. Additionally, a relationship defined as short-circuit current (SCC) PV ratio is proposed to estimate the effect of solar PV plants on transient stability. To illustrate the workings of the proposed ratio, the transmission network of the TenneT TSO B.V. in the Netherlands is used. The analysis demonstrated that high values of SCC PV ratio are an indicator that solar PV plants affect the transient stability while low values of SCC PV ratio showed that solar PV plants have minimal effect on the transient stability. Additionally, methods to improve the transient stability are provided which include limiting the operation regions of critical generators, increasing short-circuit ratio by adding a synchronous condenser or static compensator (STATCOM) and decreasing the reactance between the critical synchronous generator and faulted bus.

1. Introduction

Over the last couple of years, the temperature of the surface of the earth has increased significantly. It is projected, if no additional measures are taken, an increase between 1.1 °C and 6.4 °C will take place of the global mean surface temperature over the coming 100 years [1]. To put this into perspective, the increase of global temperature from 1880 to 1980 is equivalent to 0.28 °C, while the last 20 years has seen an increase of 0.42 °C [2,3]. The emission of greenhouse gases (GHGs) is the root cause for soaring temperatures on the surface of the earth. These earth-damaging gases come from different sectors such as the energy sector, agriculture sector and waste sector, just to name a few. One of the biggest causes of emission of GHGs, and consequently climate change, is the energy sector, accounting for a whopping 82.7% of GHG emissions in 2017 in the Netherlands [4]. Fossil fuels (such as coal and natural gas) used for producing electrical energy are accountable for a huge part of GHG emissions in the energy sector [5].
Consequently, policies are now being introduced to reduce and eventually eliminate these earth-harming production units. The Paris agreement is a global warming change agreement implemented in November 2016 involving over 180 countries, striving mainly to limit the global temperature increase ’well below’ 2 °C compared to the pre-industrial time age [6]. To achieve this, the Netherlands, for example, has introduced a climate agreement which defines a certain set of measures to reduce the emission of GHGs by nearly half by 2030 compared to 1990 [7]. Due to establishment of these policies, thermal power plants consisting of synchronous generators (SGs) are gradually being replaced by mostly inverter-based generation (IBG) such as solar PV plants and wind systems. Consequently, solar PV plants have seen an immense growth in the last couple of years in the Netherlands. The installed capacity of solar PV plants over the years in the Netherlands is provided in Figure 1.
As the growth of PV generation units is constantly on the rise, these systems are starting to have a larger influence on the power system stability and thus their dynamic behavior cannot be neglected in stability studies [8,9]. According to [10], approximately 35% of network operators represent IBG by way of negative load for stability studies hence these systems are not contributing to the dynamic behavior. In a questionnaire it was revealed that negative load representation is used mainly because of lack of widely used IBG for specific stability studies, lack of widely accepted IBG models and lack of accepted range of parameter set for IBG models [9,10]. Furthermore, presently, methods to aggregate solar PV plants at distribution level and the usage of a standard parameter set for the accumulation of these systems are not well-defined [9].
Shifting to power system stability, higher penetration levels of IBG show that the transient stability shall initially improve due to reduced loading of synchronous generators. At a certain point, as synchronous generators are being phased out; however, the loading of the remaining synchronous generators will increase and the total reactive current injection during faults will reduce hence causing a decrease of transient stability [11,12,13]. Similar results were seen for a smaller network in [14].
This paper proposes a method for the selection of dynamic models for representing large-scale solar PV plants and aggregated solar PV plants from the point of view of a TSO. Additionally, development of a standard parameter set is proposed for the selected dynamic models with the illustrative example of the grid connection requirements in the Netherlands. Furthermore, the influence of solar PV plants on the transient stability is investigated and a relationship is proposed to estimate the impact of solar PV plants on the transient stability. In summary, the main contributions of this paper are:
  • Proposal of a method for the creation of a standard parameter set for representing a wide array of large-scale solar PV plants and aggregated solar PV plants from the perspective of the TSO.
  • A qualitative assessment of the influence of solar PV plants on transient stability when represented with different modeling representations.
  • Provision of a relationship to determine the influence of solar PV plants on the transient stability.
The remainder of the paper has the following structure. Section 2 shall provide the discussion of dynamic models which can represent solar PV plants, a brief discussion of the grid connection requirements in the Netherlands and the proposal of the standard parameter set to represent solar PV plants. Section 3 provides the assessment methods used for the transient stability analysis. Additionally, the simulation results and analysis are discussed. The high voltage network of the TSO of the Netherlands, TenneT TSO B.V., is analyzed based on transient stability by evaluating areas of interest. Lastly, Section 4 shall provide the concluding remarks of this paper.

2. Methodology

2.1. Generic Modeling of Solar PV Plants

As discussed in Section 1, approximately 35% of network operators currently represent IBG as negative load and thus such systems are not providing a dynamic response in stability studies. Proper representation of IBG is becoming more important than ever because of the rapid growth of these energy sources. Consequently, IBG such as solar PV plants can no longer be ignored and must be modeled adequately when carrying out dynamic studies. Conventional generation sources such as synchronous generators have well-defined models to perform stability studies [15]. This, however, is not the case (yet) for IBG, since the development is still ongoing for generic models and typical parametrization [15]. Instead manufactures have the task of creating detailed and specific models for their solar PV plants. In recent times, a lot of energy and resources have gone towards the development of generic IBG models. In other words, research is being done on developing generic models to represent a broad spectrum of IBG models. Generic models for wind power plants are currently more widely accepted compared to generic models for solar PV plants [16,17]. However, in recent years, several generic PV models have been proposed, especially by the Western Electricity Coordinating Council (WECC), alongside extensive validation studies [18,19,20,21,22].
When modeling solar PV plants, two distinct types of solar PV plants shall be taken into account i.e.,
  • Large-scale solar PV plants
  • (Aggregation of) Distributed solar PV plants
Large-scale solar PV plants refer to single large solar PV parks which are usually connected at transmission level. The large-scale solar PV plants are modeled in power system stability studies by the large-scale PV model as this has been the standard for modeling large-scale solar PV plants in recent years. An alternative is the IEC 61400-27-1 which is used to represent wind turbines; however, this model has not been officially released at the time of writing and the models are not present in current software, thus it will not be taken into account.
Distributed solar PV plants are solar PV parks which are connected at distribution level, usually implying smaller capacity ranges. In this paper, the aggregation of distributed solar PV plants shall be evaluated, which offers an approximate representation of the accumulated behavior of smaller distribution-connected PV units that are modeled at a transmission bus [23]. The representation of aggregated distribution-connected solar PV plants will be achieved with the use of the DER_A model (Distributed energy resource model version A), as this model is the latest published model for representing aggregation of distributed solar PV plants with ample flexibility to take into grid connection requirements and potential changes [24]. Since this model represents the aggregation of multiple distributed solar PV plants, validation with measured data is not possible; however, in [25] validation has been conducted based on the expected knowledge of the dynamic behavior.
From the perspective of a TSO, large-scale solar PV plants are defined by solar PV plants which are connected to the transmission domain, while distributed solar PV plants are defined as solar PV plants connected to lower voltage levels. To this end, solar PV plants connected at transmission domain are represented by the large-scale PV model, while solar PV plants connected at distribution domain are represented by the DER_A model.

2.2. Large-Scale PV Model

The Large-scale PV model (also referred to as the Central Station PV Plant Model or Western Electricity Coordinating Council (WECC) Generic PV Model) is a positive-sequence model that represents the important dynamic behavior of large-scale solar PV plants with a single connection point at transmission level. This model has been developed by the WECC Renewable Energy Modeling Task Force (REMTF) and has been largely based on the Type 4 Wind Turbine Model (also developed by the WECC REMTF) due to the characteristic that both types are connected to the grid by a power electronics interface [26]. The large-scale PV model consists of 3 modules i.e., [26],
  • REGC_A—Renewable Energy Generator/Converter Module
  • REEC_B—Renewable Energy Electrical Control Module
  • REPC_A—Renewable Electrical Plant Level Control Module
The interconnection between the 3 modules is provided in Figure 2.
The Plant Level Control (REPC_A), which is an optional module, uses the values provided by the network solution to generate active- and reactive power references for the electrical control module. If the plant level controller is excluded, the active- and reactive power references are provided directly by the network solution [27]. The electrical control module receives the power references from the plant level controller and converts these into current commands for the generator/converter module. The produced current commands are received by the generator/converter module. This module is ultimately responsible for the injection of currents [26].

2.3. DER_A Model

Besides the rapid increase of inverter-based generation at transmission level, solar PV plants connected at distribution level have also seen an immense growth [28]. The requirements that these solar PV plants should adhere to, depends where they fall in the classification of power-generating modules (PGMs) shown in Table 1. To represent distributed solar PV plants in dynamic case studies, distributed PV models are used. Additionally, these models are also used to represent the aggregation of distributed solar PV plants by using aggregation techniques and modeling the aggregated system at transmission level to obtain an acceptable representation of the gross distributed solar PV plants [9]. In the last decade, several distributed PV models have been proposed such as the PVD1 model and the DER_A model. The DER_A model is the latest iteration of the distributed PV model and is the successor to the PVD1 model [28]. The DER_A model stands for the Distributed Energy Resource Model Version A, and is a model used for modeling the positive-sequence dynamic behavior of aggregated distributed solar PV plants. This aggregation provides a representation of all the small- and medium solar PV plants scattered at lower- to medium voltage levels [28]. This model is derived from the large-scale PV model, discussed previously, which includes the models REPC_A, REEC_B and REGC_A [24]. The large-scale PV model contains 121 parameters and 16 states, thus is too complex for representation of aggregated solar PV plants. Moreover, this model was developed to depict the behavior of a single large renewable plant and thus may not be easily adaptable to incorporate the aggregation of distributed generators [28]. Therefore, the DER_A model was developed to provide a straightforward approach to modeling the aggregation of distributed solar PV plants, and also a reduction in parameters and states was established without diminishing the core functionalities to adequately represent the dynamic behavior.

2.4. Grid Connection Requirements

The grid connection requirements (GCR) play an important role in the behavior of solar PV plants. The important grid connection requirements of the Netherlands shall be discussed in this section relating to transient stability. The grid connection requirements are a set of technical regulations which provide specific conditions for grid connected PGMs in order to maintain and preserve power system security, to smoothen the transition to renewable energy sources and to provide equitable conditions for competition on the electricity market [29,30].
In [30,31], a distinction is made between power-generating modules based on their voltage level and capacity range. The distinction consists of five types i.e., type 0, A, B, C and D. The classification of these different types is provided in Table 1.
In Table 1, the different types of generators are shown based on their voltage level and capacity range. The type 0 power-generating modules will not be considered in this paper and will not be discussed further, as their capacity is negligible and there are no requirements for these type of power-generating modules to provide support in case of contingencies [31]. An important note to highlight is that the classification provided in Table 1 has made a distinction between type D power-generating modules below 110 kV (type D1) and higher than or equal to 110 kV (type D2) since certain requirements provide different conditions for type D1 and type D2. When referring to type D units in the remainder of the text, this includes both type D1 and D2. The important requirements regarding transient stability are presented in Table 2.
Fault-ride-through capability of generators connected below 110 kV: Fault-ride-through (FRT) is the ability of power-generating modules to remain connected (should the voltage of the generation unit remain above the given profile) to the network during voltage deviations due to occurrence of a fault. The FRT capability of power-generating modules connected below 110 kV is a requirement for type B, C and D1 power-generating modules. A voltage-against-time-profile is specified by Dutch Netcode at the point of connection for contingencies. The FRT profile applicable to type B, C and D1 units is provided in Figure 3.
Fault-ride-through capability of generators connected at 110 kV or above: The FRT capability of power-generating modules connected at 110 kV or above is a requirement for type D2 generators. The FRT profile applicable to type D2 units is provided in Figure 4.
Provision of fast fault current (for IBG): This requirement states that power park modules of type B, C and D should be able to provide fast fault current when a symmetric (three-phase) or asymmetric fault occurs. For this requirement (Article 3.19 point 10), the latest proposal of Netbeheer Nederland has been used (this proposal still awaits approval and thus this requirement has not been officially adopted yet) since this proposal provides a clearly defined additional reactive current gain value for power park modules (PPMs) depending on their voltage level [32]. Fast fault current should be provided at the connection point under the following conditions,
  • Additional reactive current is provided when the voltage deviation at the terminals of the individual power-generating modules is either larger than 10% of the effective value or when a sudden change in the instantaneous voltage occurs of at least 5% of the peak value of the nominal voltage.
  • The additional injected reactive current Δ Ib is the difference of the reactive current during the fault and the reactive current before the fault and is proportional to the voltage deviation as indicated in Equation (1). A graphical representation of Equation (1) for the values 2 and 5 of k is shown in Figure 5. When the voltage deviation is within the limits of the deadband, no additional reactive current is injected by the solar PV plants; the assigned deadband values will be discussed subsequently.
    Δ I b = ( U U 0 ) U N × I N × k
    where
    Δ I b = additional reactive current injection
    U U 0 U N = Δ U = relative voltage deviation in pu
    U = voltage during fault
    U 0 = voltage before the fault
    U N = nominal voltage
    I N = nominal current
    k = slope for additional reactive current injection
  • The range of k or Kqv (additional reactive current gain) shall be between 2 and 6, where the value of 2 is assigned for power park modules connected to a network with a nominal voltage lower than 66 kV and the value of 5 is assigned for power park modules connected to a network with a nominal voltage of 66 kV and higher.

2.5. Generic Model Parameters

For PV generic models, the parameter set is essential to (satisfactorily) represent the dynamic behavior of specific solar PV plants. For models which represent specific solar PV plants, a very detailed parameter set can be assigned based on most significantly the converter/inverter specifications [15]. However, when developing a PV generic model with a parameter set to portray a wide array of solar PV plants, the goal is to capture important behavior of these systems and not necessarily the minute details. The assignment of values to the parameter set is shown in Figure 6.
Parameters in accordance with GCR: The parameters which coincide with the grid connection requirements are assigned values stated in the specific requirements. The important parameters for transient stability relating to the reactive current injection of the solar PV plants are shown in Table 3—the parameters with an asterisk (*) exist only for the large-scale PV model. It should be mentioned that the GCR states that for a sudden change in voltage, the deadband for voltage control should be in the range of ±5%. However, this value was assigned to the parameter set but yielded convergence problems for large networks hence the deadband for voltage control has been set to ±10%. Additionally, the assignment of the parameter Kqv is dependent on the type of solar PV plants which are represented. For solar PV plants of type B, C and D1 (connected < 110 kV), the assigned value is 2, while for type D2 solar PV plants (connected ≥ 110 kV), the assigned value is 5.
Parameters highly dependent on manufacturer: Certain parameters such as the proportional integral (PI) gains in the dynamic models determine how assertive a PV system responds to a particular fault. Such parameters have been taken from the parameter set of current existing solar PV plants in the Dutch high voltage network.
Parameters which do not affect simulations results: The large-scale PV model and DER_A model consist of several modules and logic’s which are not of importance as the grid connection requirements do not define such obligations [23,24]. An example of such a module is the high voltage reactive current management module present in the large-scale PV model, which functions to decrease the reactive current injection of the PV system if the voltage at the terminals of the PV system exceeds a certain threshold. As there are no such requirements in the grid connection requirements of the Netherlands, this module has been turned off and hence the surrounding parameters of this module, which will not influence the behavior, have been assigned typical values [23,25].
Remaining parameters: The remaining parameters have been assigned values based on a parametric sensitivity analysis and literature research. The parametric sensitivity analysis is conducted by changing one parameter within the range of typical values while all other parameters remain fixed. An example of an important remaining parameter is the active power ramp-up rate Rrpwr. The parameter Rrpwr provides an upper limitation for the active current ramp-up rate after fault clearance, essentially limiting the increase of active power per time unit. The behavior of different values of Rrpwr is provided in Figure 7.
As shown in Figure 7, the speed of the active current injection after fault clearance is strongly determined by the parameter Rrpwr. Additionally, it can also be seen that the ramp rate limit does not apply to instantaneous and very sudden changes—this explains the behavior right after the occurrence of the fault and the sudden increase in active current injection the moment the fault is cleared. According to [15], higher ramp rates increase the speed of voltage recovery. Using low values for Rrpwr instigates slow voltage recovery and could result into decrease of voltage beyond FRT profile as illustrated in [15]. In contrast, too high of a value for Rrpwr could potentially result in frequency problems due to high frequency sensitivity [15]. Another important aspect which the value Rrpwr influences is the critical clearing time (CCT), larger values of Rrpwr increase the CCT [15,33]. In [15,23], the value of 10 pu/s is used for Rrpwr, this is seen as a typical value to represent solar PV plants. Additionally, the Netcode proposal handed in by Netbeheer Nederland states that the maximum permissible recovery of active power should be between 0.5 and 10 s, translating to a minimum value for Rrpwr between 2 pu/s and 0.1 pu/s [32]. However, this does not provide the whole picture, since this wide range takes into account all PPMs including wind turbines not fully connected via power electronics, which need additional time to provide active current recovery. To this end, the value of 10 pu/s shall be assigned to Rrpwr as this is consistent with literature and falls well within the limits set by the proposed requirements.
As presented in Table 2, type A PPMs are not required to provide reactive current injection during a fault, while type B, C and D PPMs are. To this end, two parameter sets are proposed for representing aggregated PV system with the DER_A model, where one represents type A PPMs while the other represents type B, C and D1 PPMs. The difference between these two parameter sets is that for type A PPMs the additional reactive current gain (Kqv) should be set to 0 while for type B, C and D1 PPMs this value should be 2 or 5 depending on the voltage levels of the solar PV plants—since all aggregated solar PV plants are of type B, C and D1 (connected < 110 kV), the assigned value to Kqv is 2. Additionally, the flags VtripFlag and FtripFlag in the DER_A model should be set to ‘1’ for the type A parameter set as this corresponds to the provided requirements.
Lastly, the provided FRT profiles presented in Section 2.4, cannot be assigned to the different models as neither the large-scale PV model nor the DER_A model have a logic for this purpose.
The full proposed parameter set for the large-scale PV model and DER_A model is provided in Appendix A.

3. Simulation Results

3.1. Tools Used

The software tools to carry out the simulations are Power System Simulator for Engineering abbreviated as PSS/E version 34.7 aided by Python 2.7. The specifications of the computer used to carry out the simulations are Windows 10 64-bit operating system, Intel Core i5-7200U @2.50 Ghz CPU and 8 GB of installed RAM.

3.2. TenneT Network Case Study

To evaluate the transient stability, a synthetic model of the Netherlands (TenneT network) is taken as a case study. Due to confidentiality concerns only the areas of interest shall be shown. For the analysis, a scenario of the future is taken which contains a high penetration of solar PV plants in the network with reference year 2030. For this scenario, several snapshots are evaluated with their main difference being variance in dispatch, demand and the in-service synchronous generators. Different snapshots are evaluated to see the impact of various short-circuit levels on the transient stability. Consequently, the snapshots with most synchronous generators connected possess the highest short-circuit levels while low short-circuit levels are present in the snapshots with fewer synchronous generators connected. Four cases are selected and can be divided in (the synchronous generators refer to those in the Netherlands at transmission domain):
  • Case 1—100% of SGs connected
  • Case 2—64% of SGs connected
  • Case 3—59% of SGs connected
  • Case 4—17% of SGs connected
The percentage of connected SGs has been determined based on the capacity of the synchronous generators. The above-discussed cases shall be evaluated subsequently.

3.3. Assessment Method and Definitions

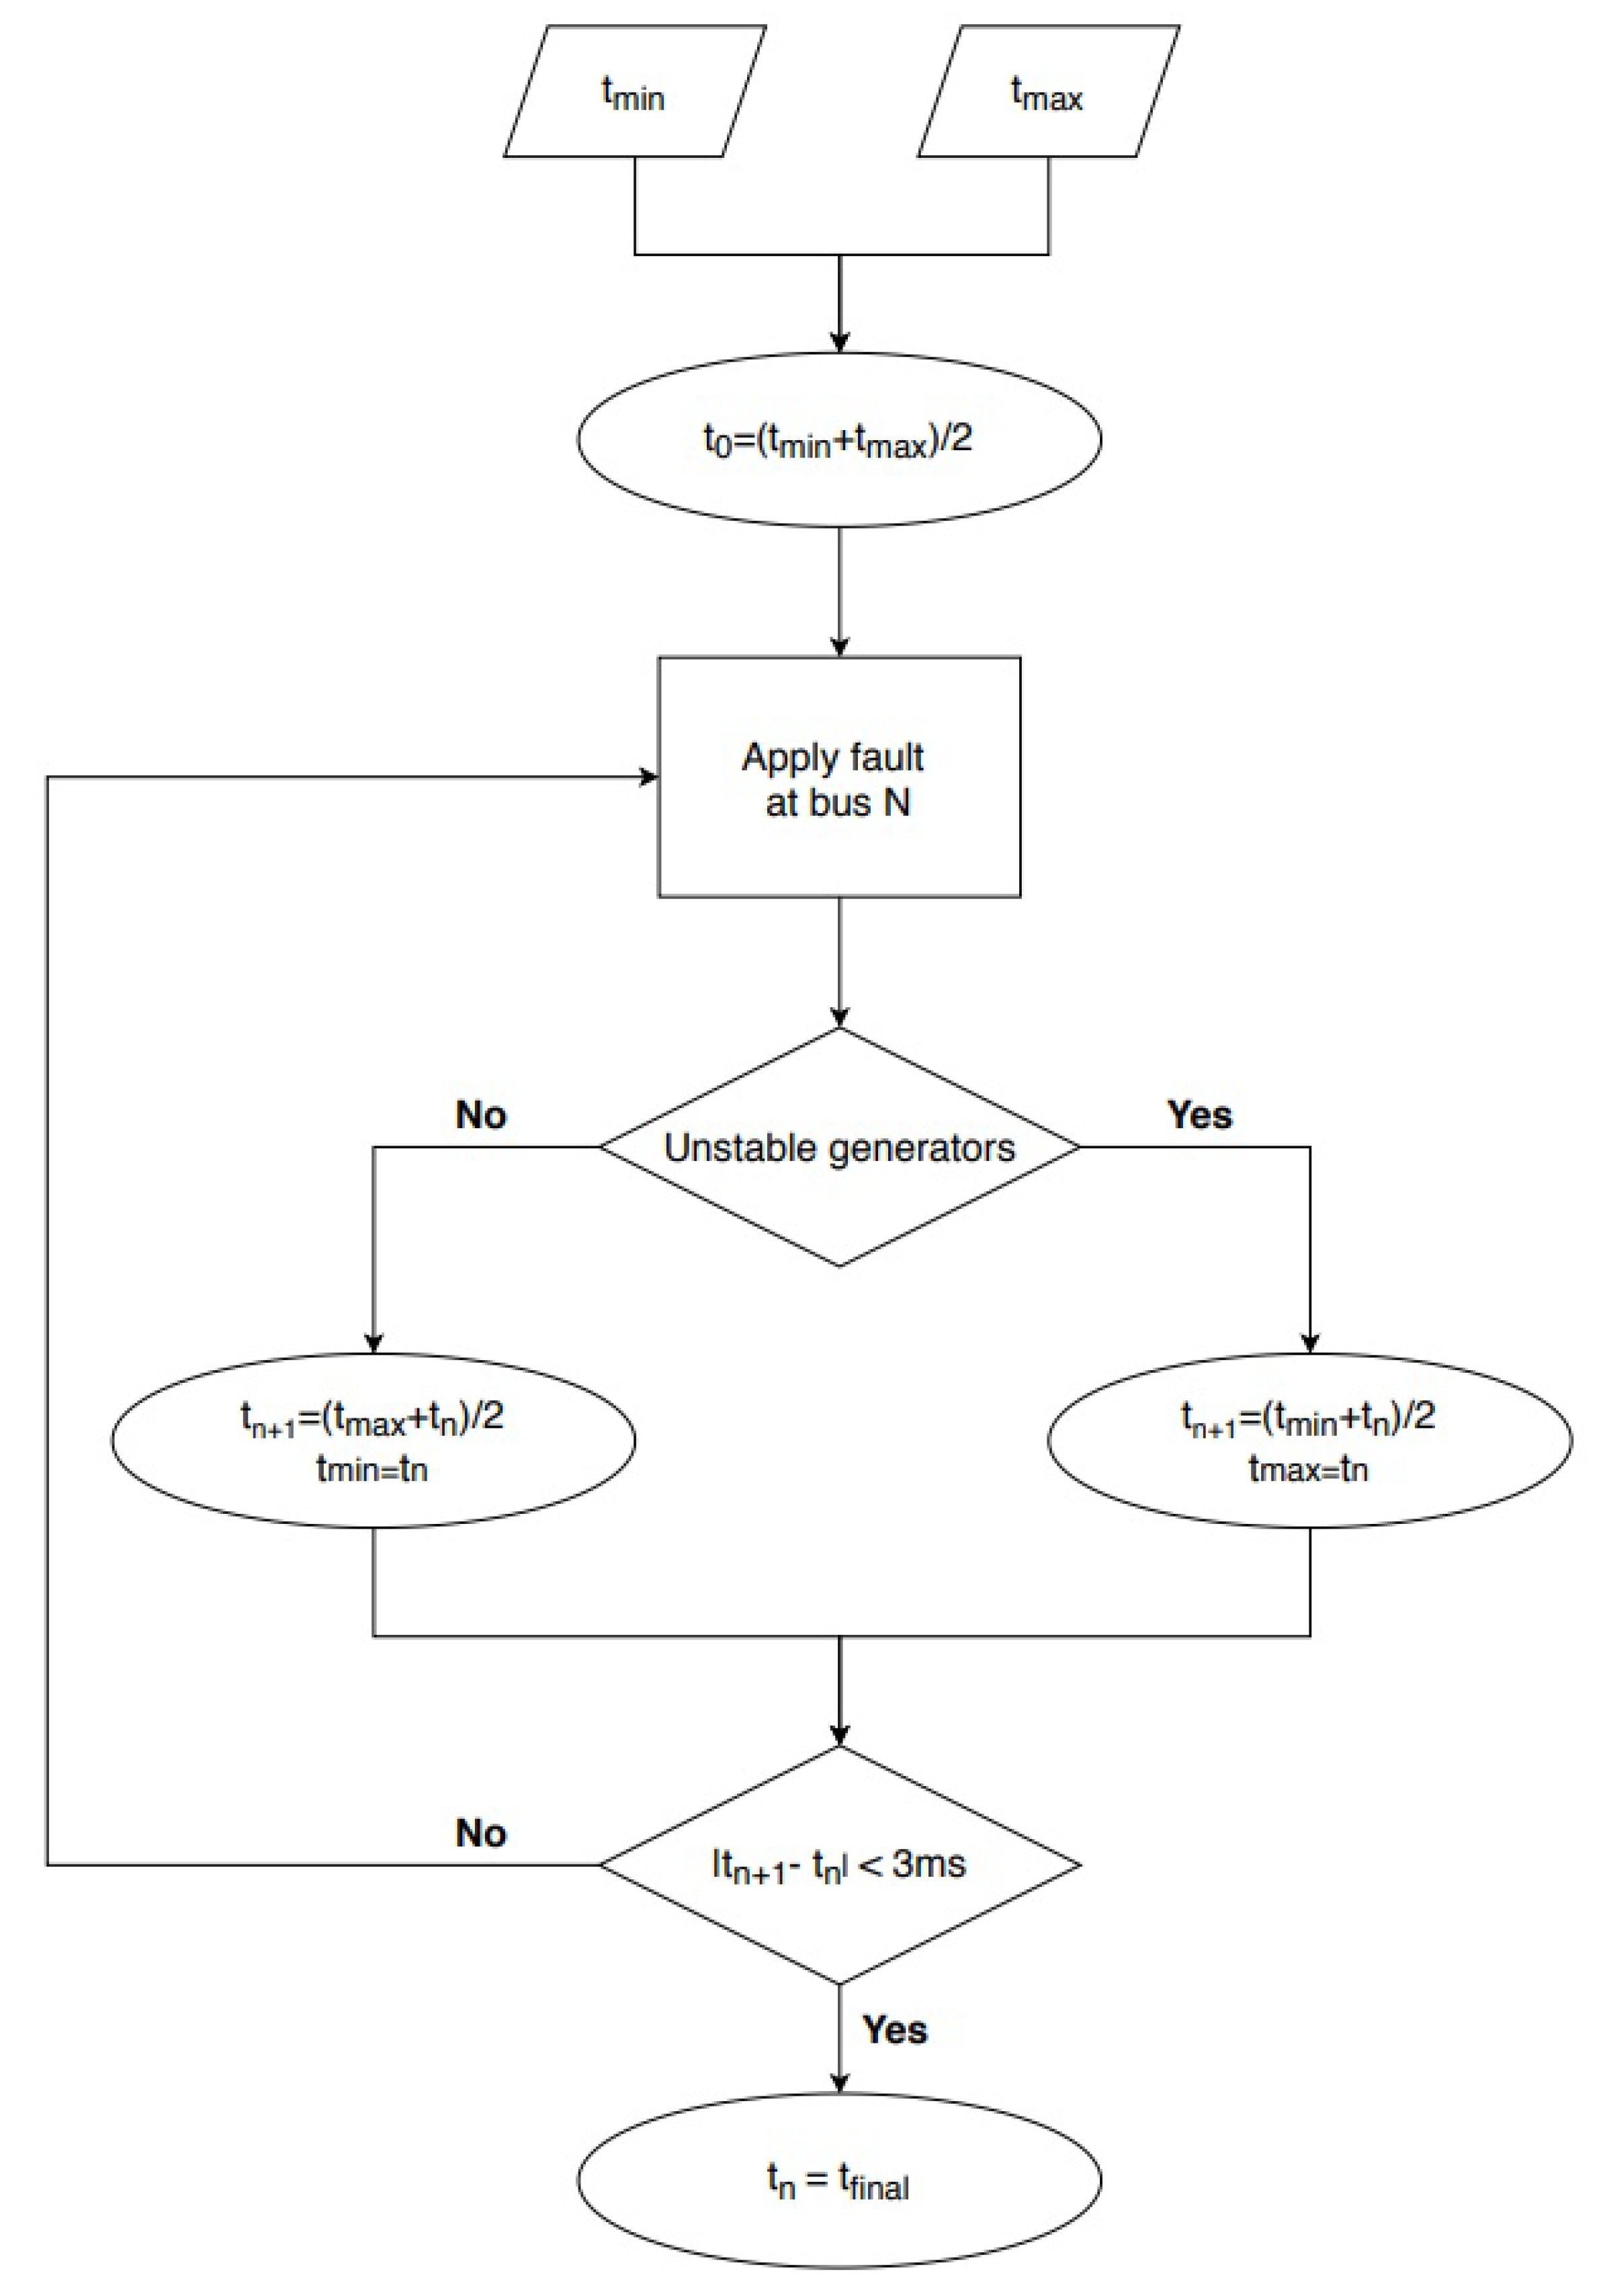
The critical clearing time shall be used to assess the transient stability. The method of determining the critical clearing time with Python 2.7 is shown in the flowchart provided in Figure 8.
As shown in Figure 8, there are two inputs for the critical clearing time script i.e., t m a x and t m i n . These two inputs indicate the time interval in which the simulation will search for the critical clearing time. The first clearing time ( t 0 ) of the fault is calculated as shown in Equation (2).
t 0 = t m a x + t m i n 2 ( n = 0 )
Following this, the fault is applied at a particular bus for t 0 seconds and then the fault is cleared and the simulation continues to run till 5 s. The rotor angles of all synchronous generation units are then scanned to evaluate if the rotor angle exceeds a certain threshold. If there are unstable generators present then the fault clearing time (FCT) is decreased as shown in Equations (3) and (4).
t n + 1 = t m i n + t n 2
t m a x = t n
If no unstable generators are present then the fault clearing time is increased as shown in Equations (5) and (6).
t n + 1 = t m a x + t n 2
t m i n = t n
This iterative process is repeated until Equation (7) holds, yielding the critical clearing time as provided in Equation (8).
| t n + 1 t n | < 3 m s
Critical   clearing   time = t n
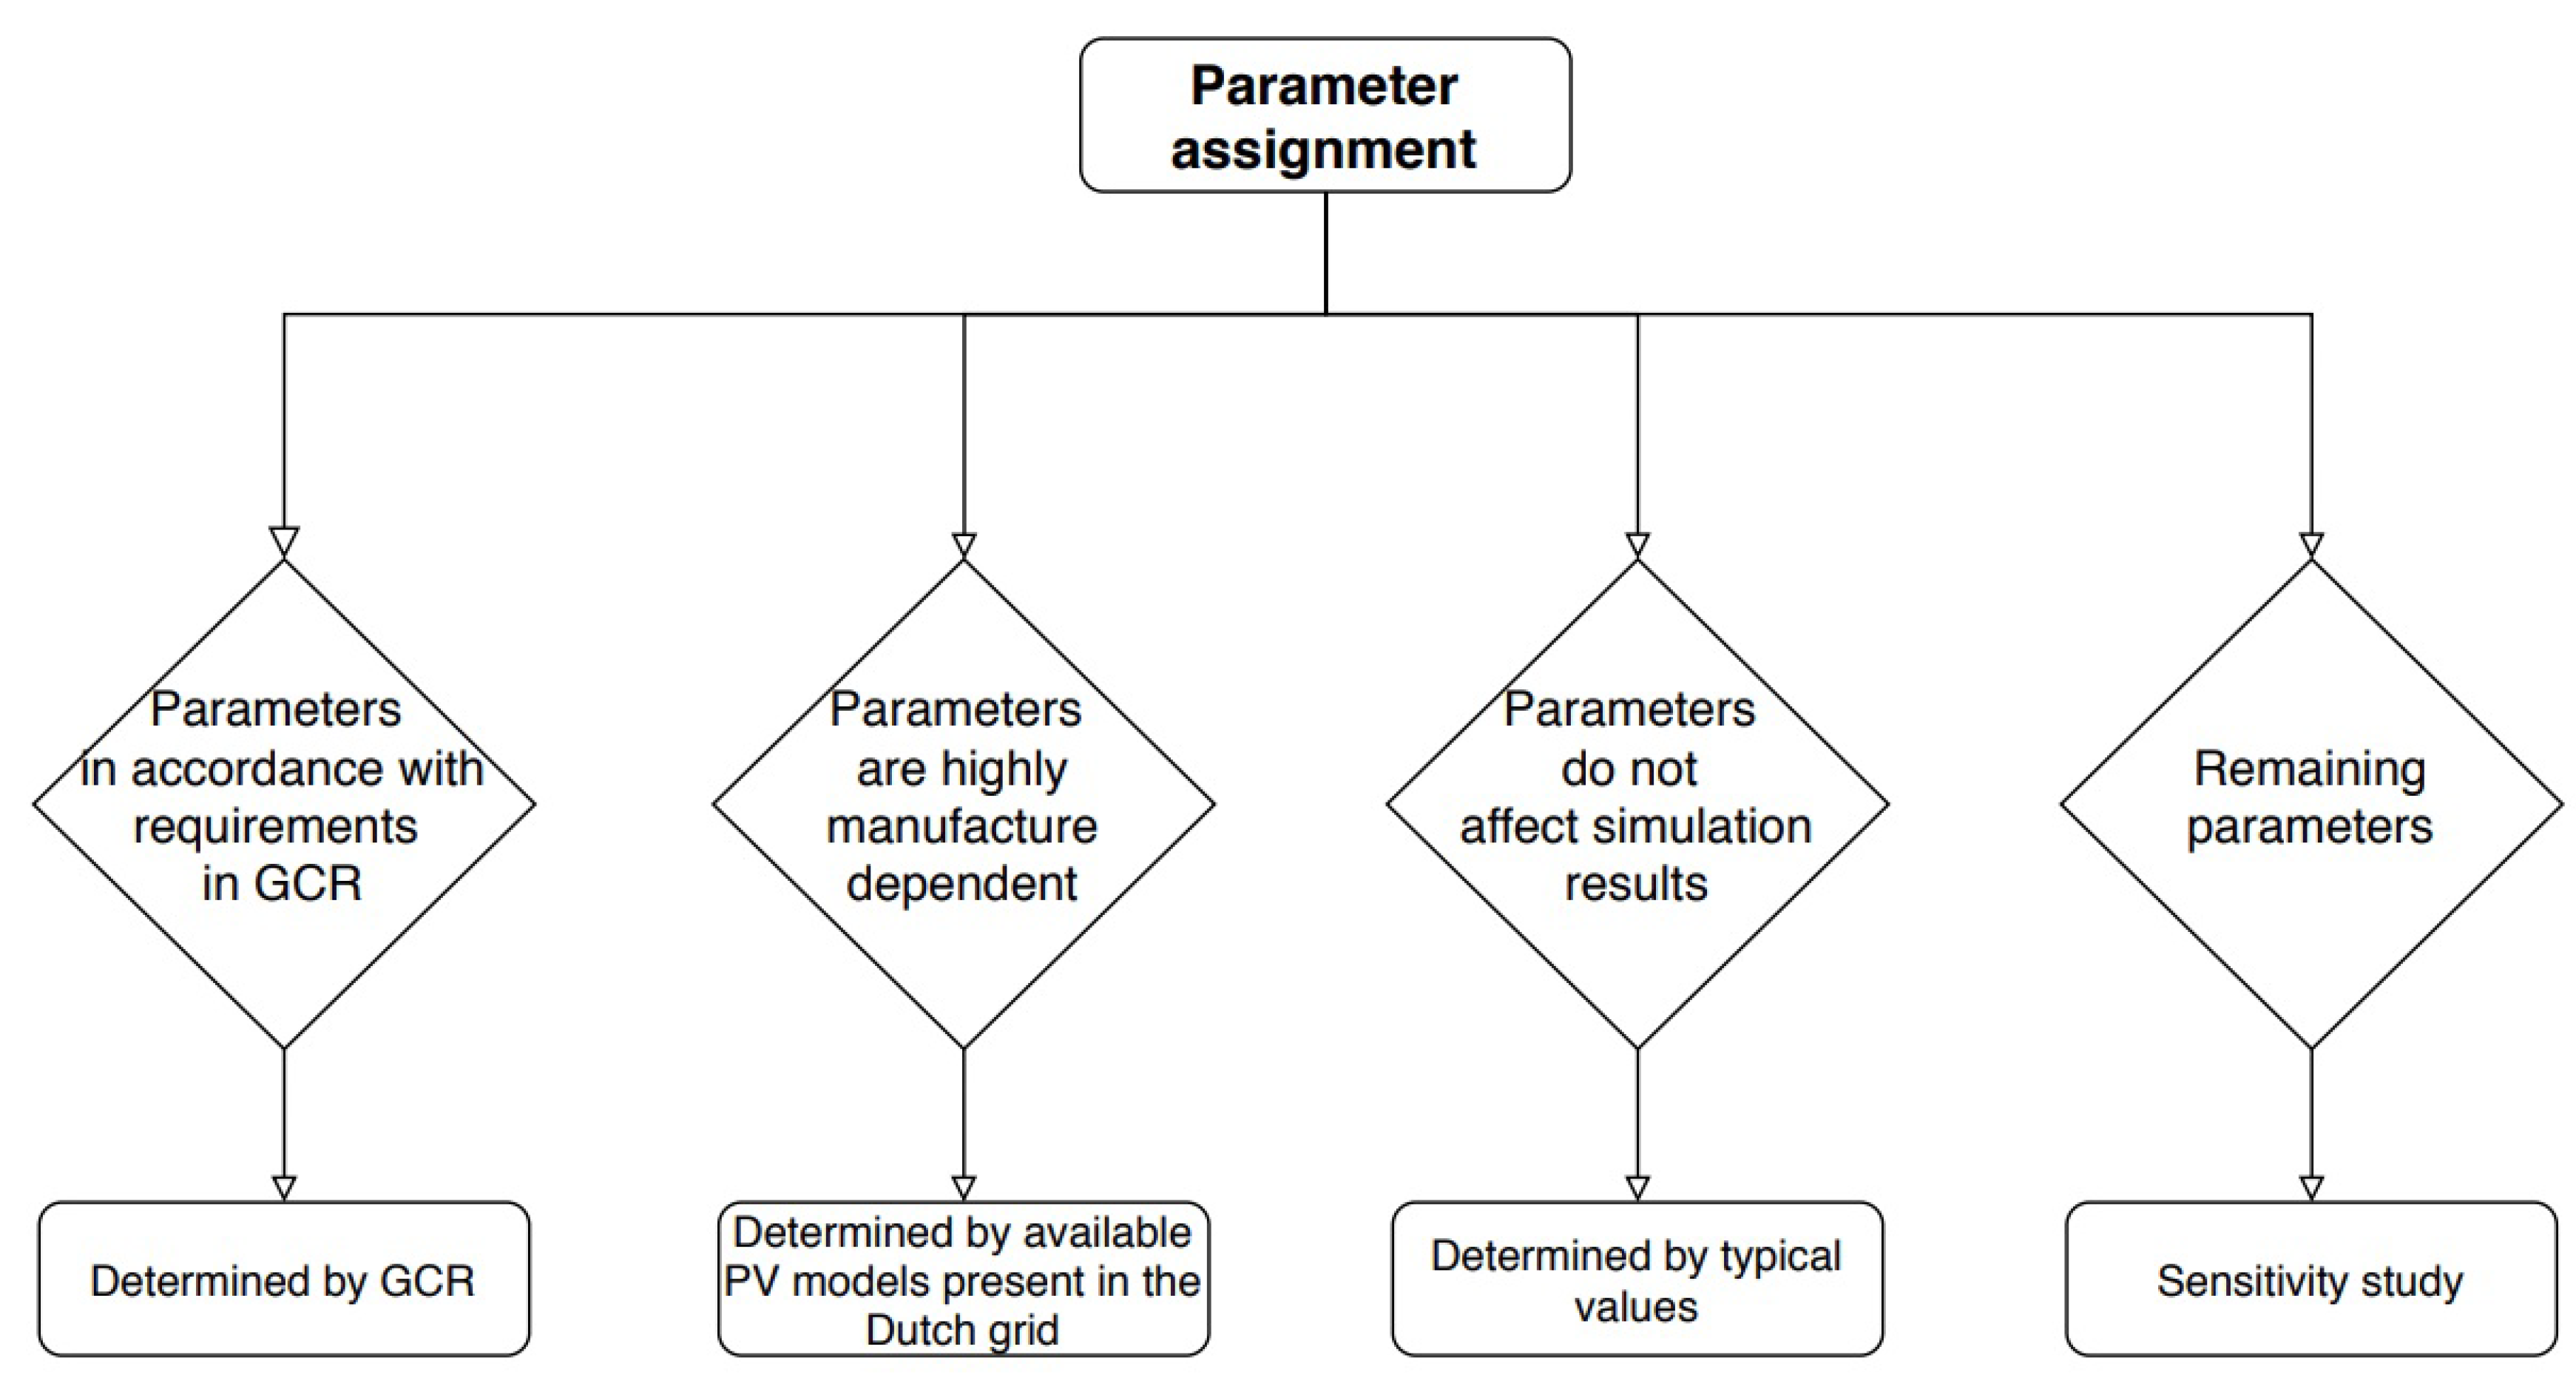
Additionally, for the analysis it is important to define the various methods of PV representation which will be used subsequently. This distinction is made to clearly identify the factors in play which influence the impact of PV penetration on transient stability. The four different modeling representations which shall be studied are:
  • Representation of all solar PV plants with their respective dynamic models. This representation shall be referred to as All dynamic models.
  • Representation of all solar PV plants with negative load. This representation shall be referred to as All negative load.
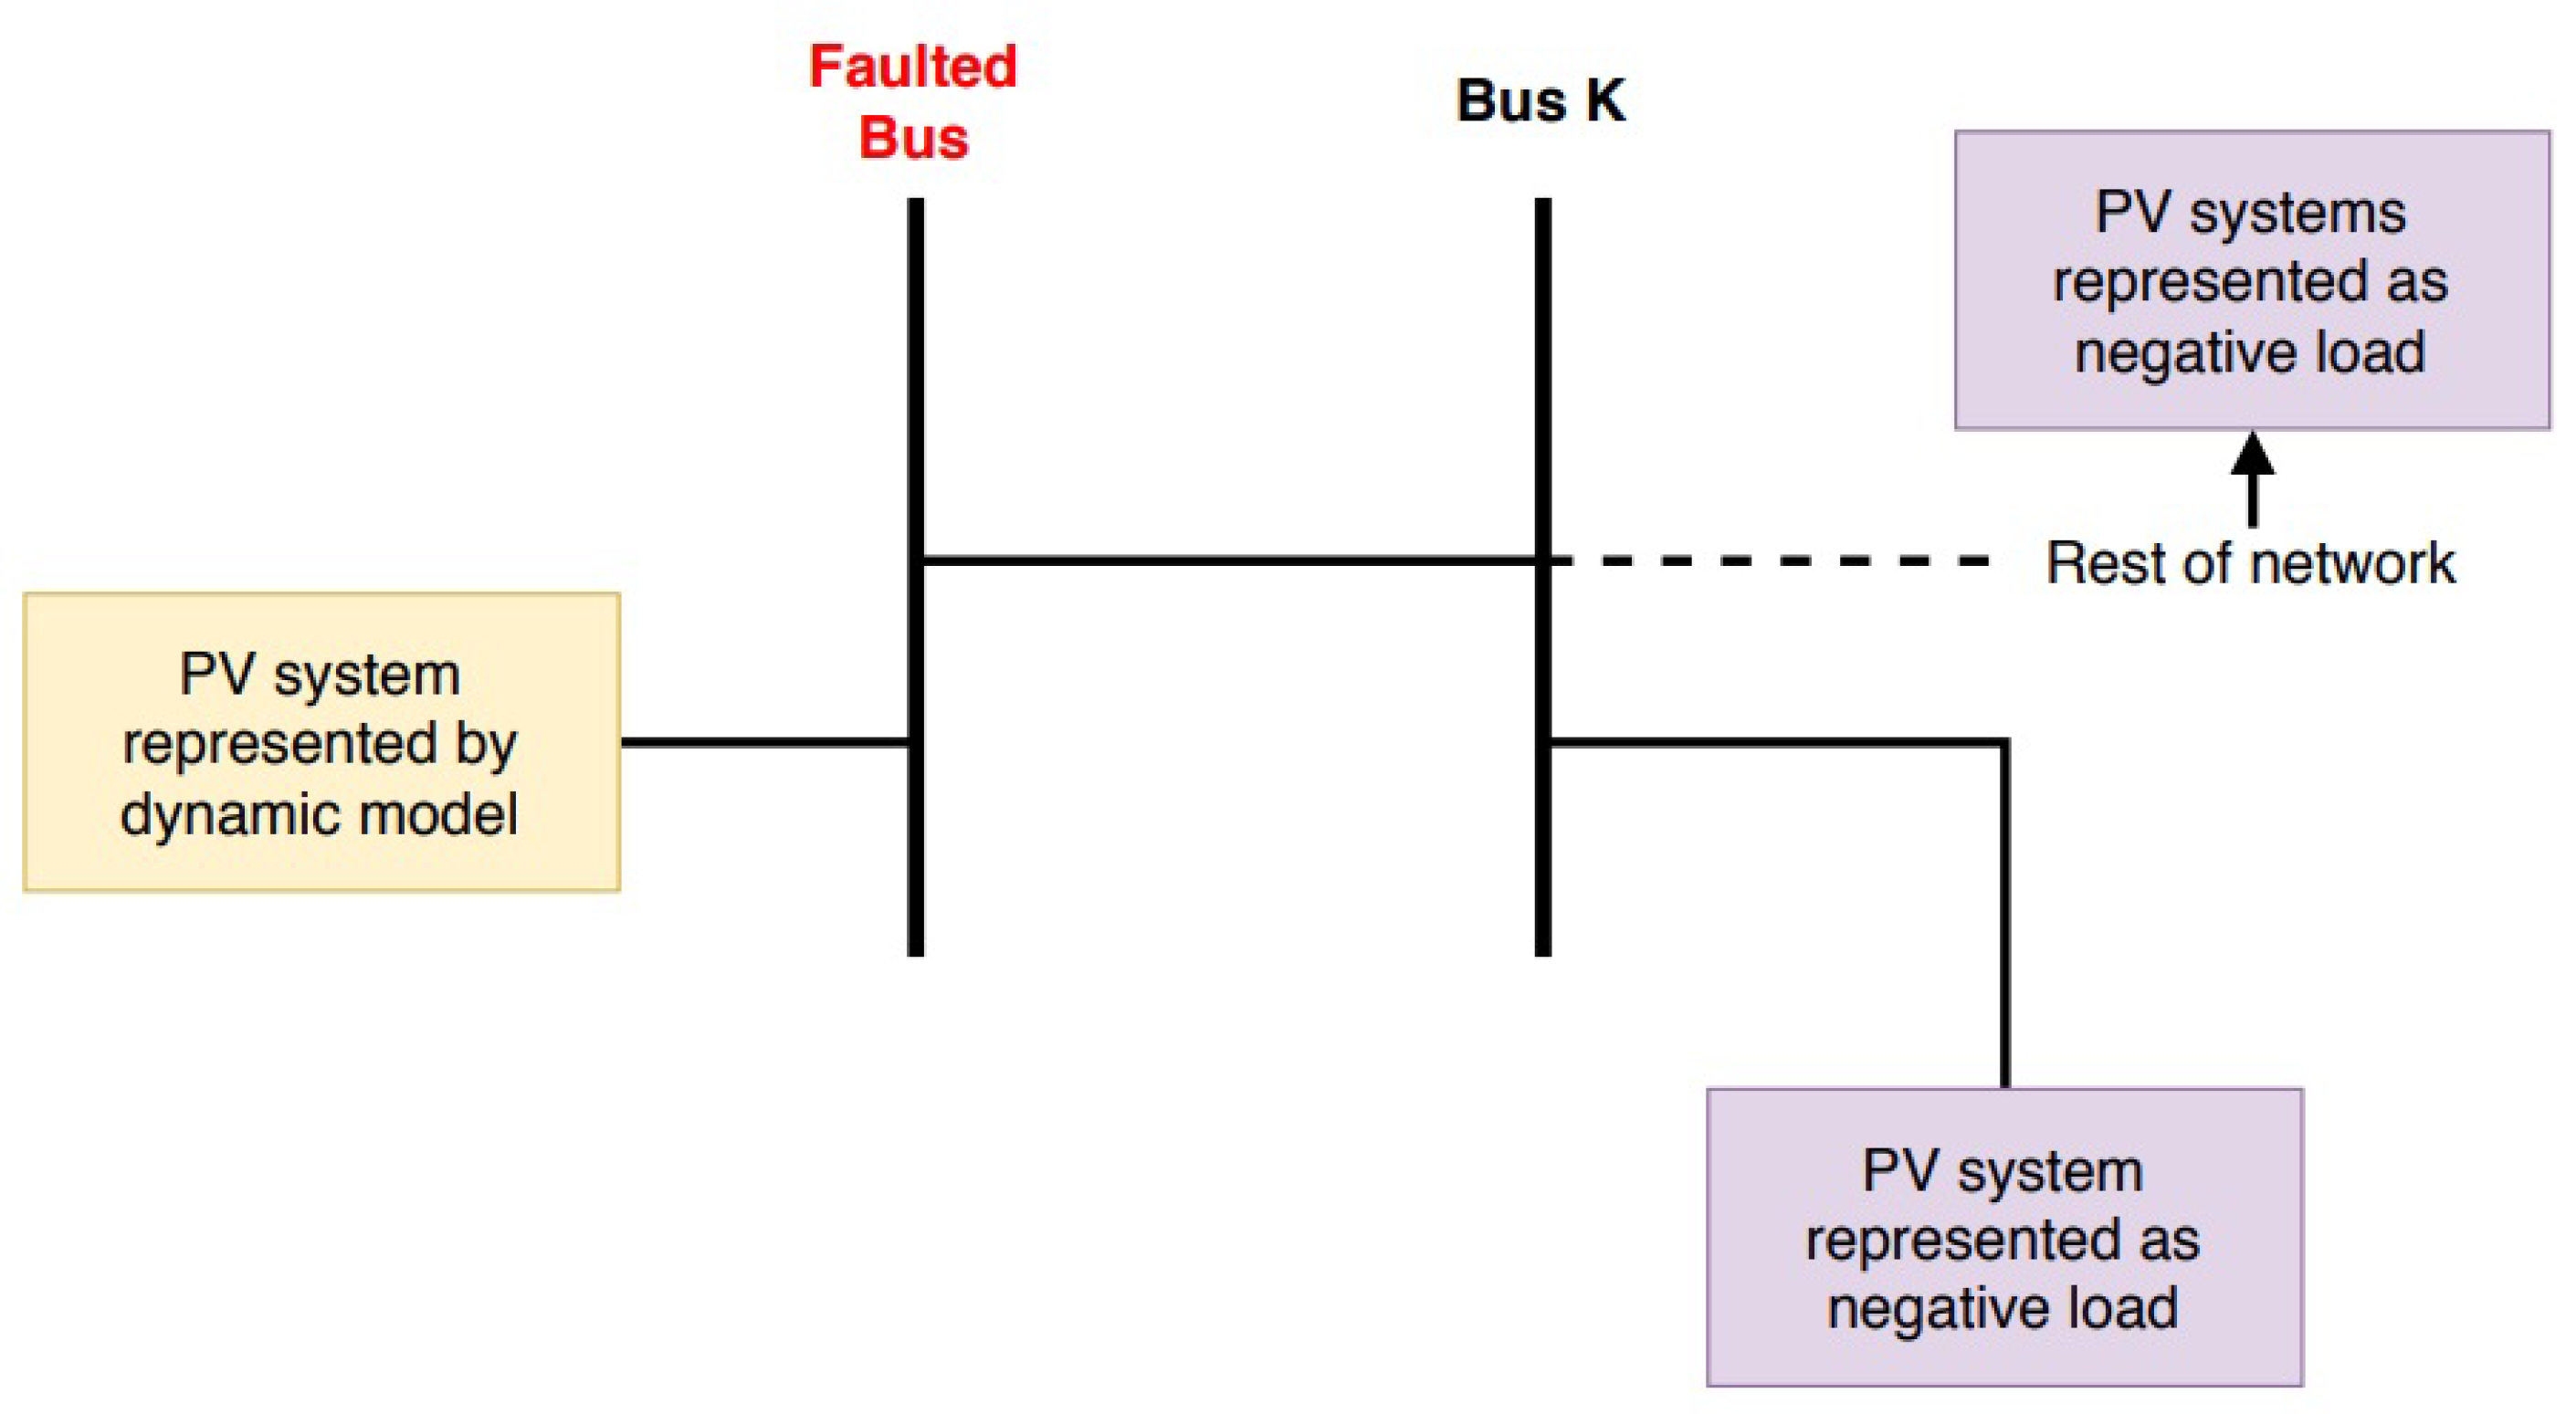
  • Representation of the solar PV plants connected at the faulted bus with dynamic models while all others are represented by negative load. This representation shall be referred to as Dynamic local 1. A further elaboration of this representation is shown in Figure 9 (The underlying elements of the PV system have been omitted in the figure for simplicity purposes).
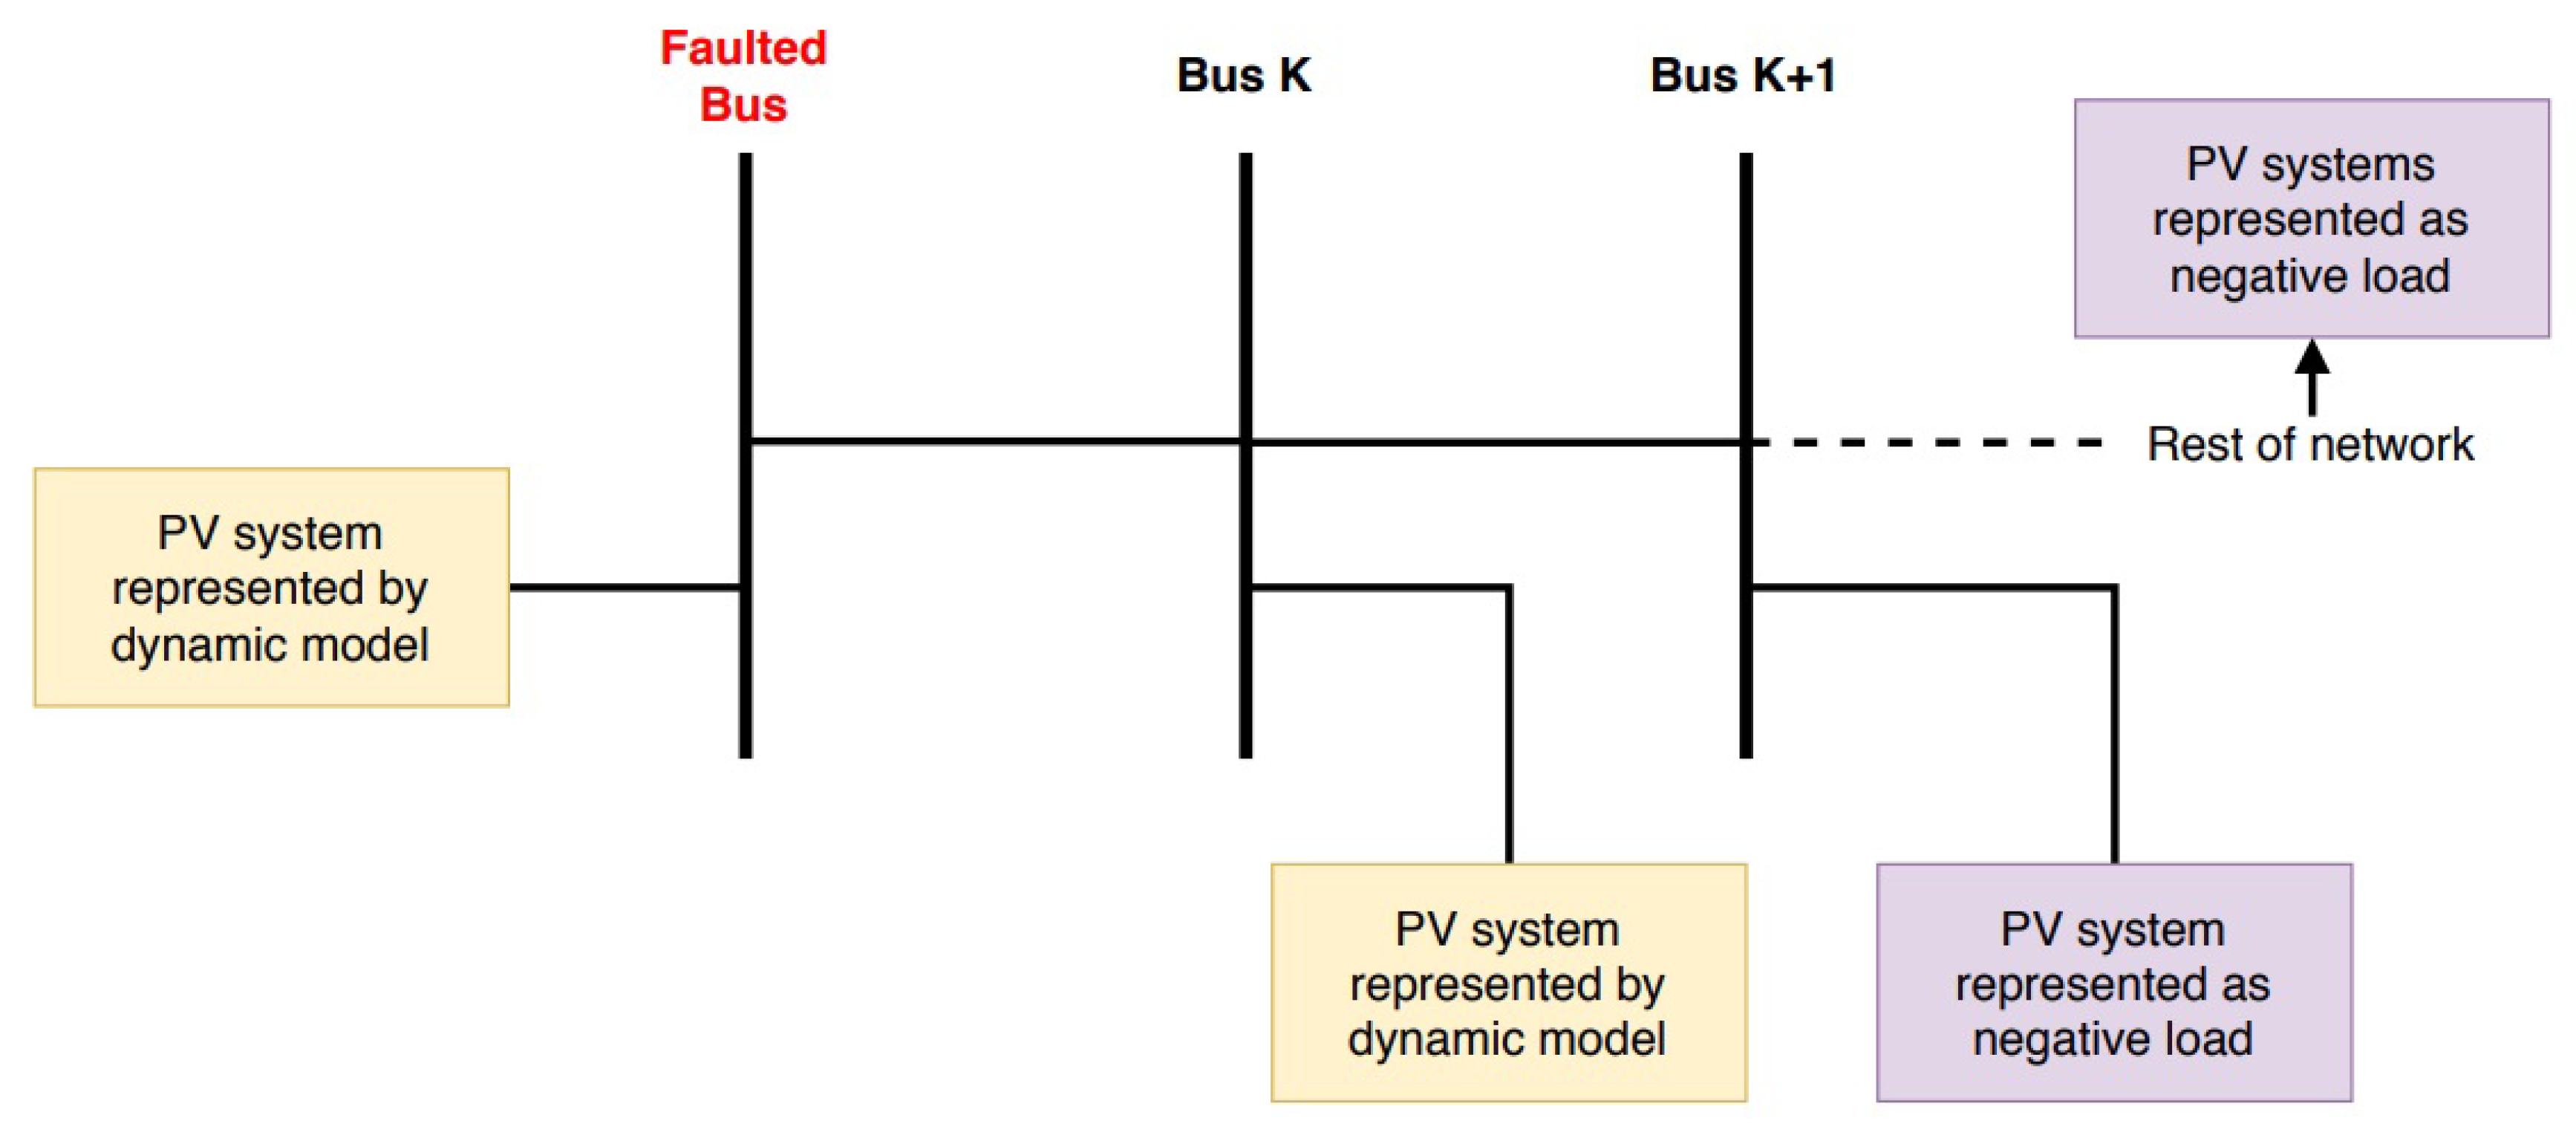
  • Representation of solar PV plants connected to at the faulted bus and solar PV plants connected at a bus directly connected to the faulted bus are represented with dynamic models. All other solar PV plants are represented with negative load. This representation shall be referred to as Dynamic local 2. A further elaboration of this representation is provided in Figure 10.
Furthermore, in the figures which shall be discussed, the following abbreviations will be used:
  • SG        — Synchronous generator
  • A-PV Type A    — Aggregated solar PV plants of type A
  • A-PV Type BCD1— Aggregated solar PV plants of type B, C, D1
  • L-PV       — Large-scale PV system
  • A-Wind     — Aggregated wind systems

3.4. Transient Stability Analysis

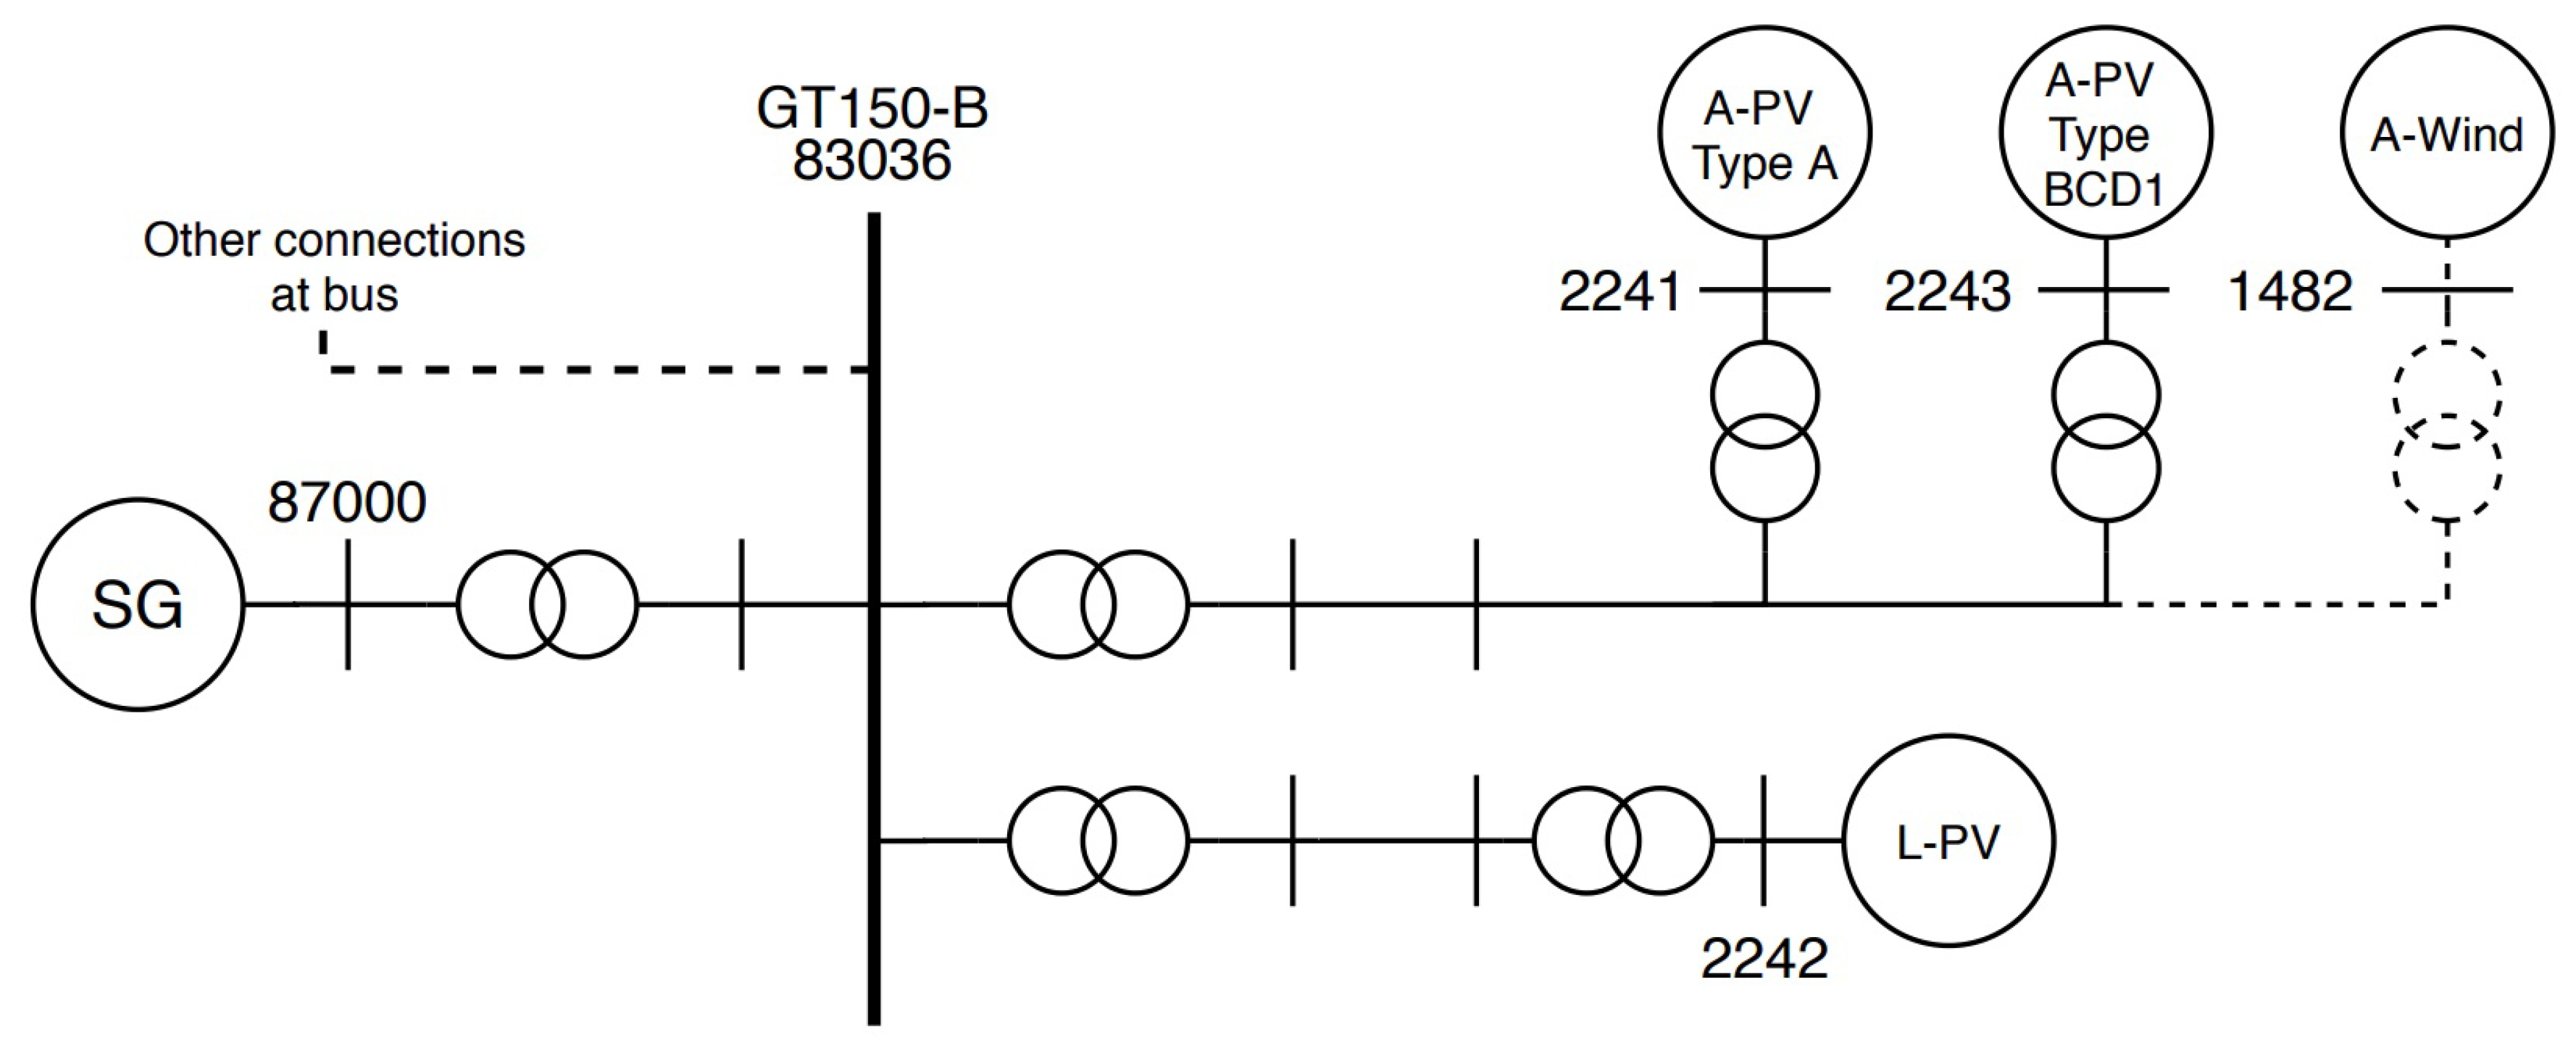
The first bus which will be examined is the bus at Geertruidenberg with a voltage level of 150 kV also referred to as GT150-B. This bus was chosen since there are solar PV plants and a synchronous generator in close proximity. Additionally, the distinction between the short-circuit current (SCC) at this bus can be clearly seen between the various cases. An overview of the relevant connections at this bus is shown in Figure 11. An aggregated wind system was also connected to this bus, but has been put out of service to solely evaluate the impact of solar PV plants.
To isolate the behavior of short-circuit current on the transient stability, the synchronous generator near the bus of interest (in the case of GT150-B the synchronous generator at bus 87000) has been given a fixed operating point across all cases and the generator bus voltage has been brought within a range of 0.01 pu across all cases. This modification has been made for all the buses which are evaluated. Moreover, the impact of the total system inertia on the transient stability for the different cases is neglected as the network is widely interconnected to European countries and thus the disconnection of certain SGs within the Netherlands has an insignificant influence on the total system inertia. After making the necessary changes as described above in all cases, a fault has been introduced at GT150-B bus 83036 and the critical clearing time for all cases is evaluated and shown in Table 4.
When first comparing the representation All dynamic models for the different cases provided in Table 4, it is shown that the critical clearing time is nearly identical for all cases. The minor difference witnessed in case 1 is due to the increased short-circuit current at the faulted bus. Additionally, the difference witnessed in case 4 is due to the reduction of short-circuit current at the faulted bus as several synchronous generators are put out of service for this case. The short-circuit current (calculated with the IEC 60909 method in PSS/E) of the different cases is shown in Table 5. The equation used to calculate SCC PV ratio in Table 5 is provided in Equation (9) and shows the percentage of short-circuit contribution of all the solar PV plants in the network relative to the total short-circuit contribution at the faulted bus.
SCC   PV   ratio = SCC   provided   by   all   solar   PV   plants   at   faulted   bus Total   SCC   at   faulted   bus × 100 %
As shown in 
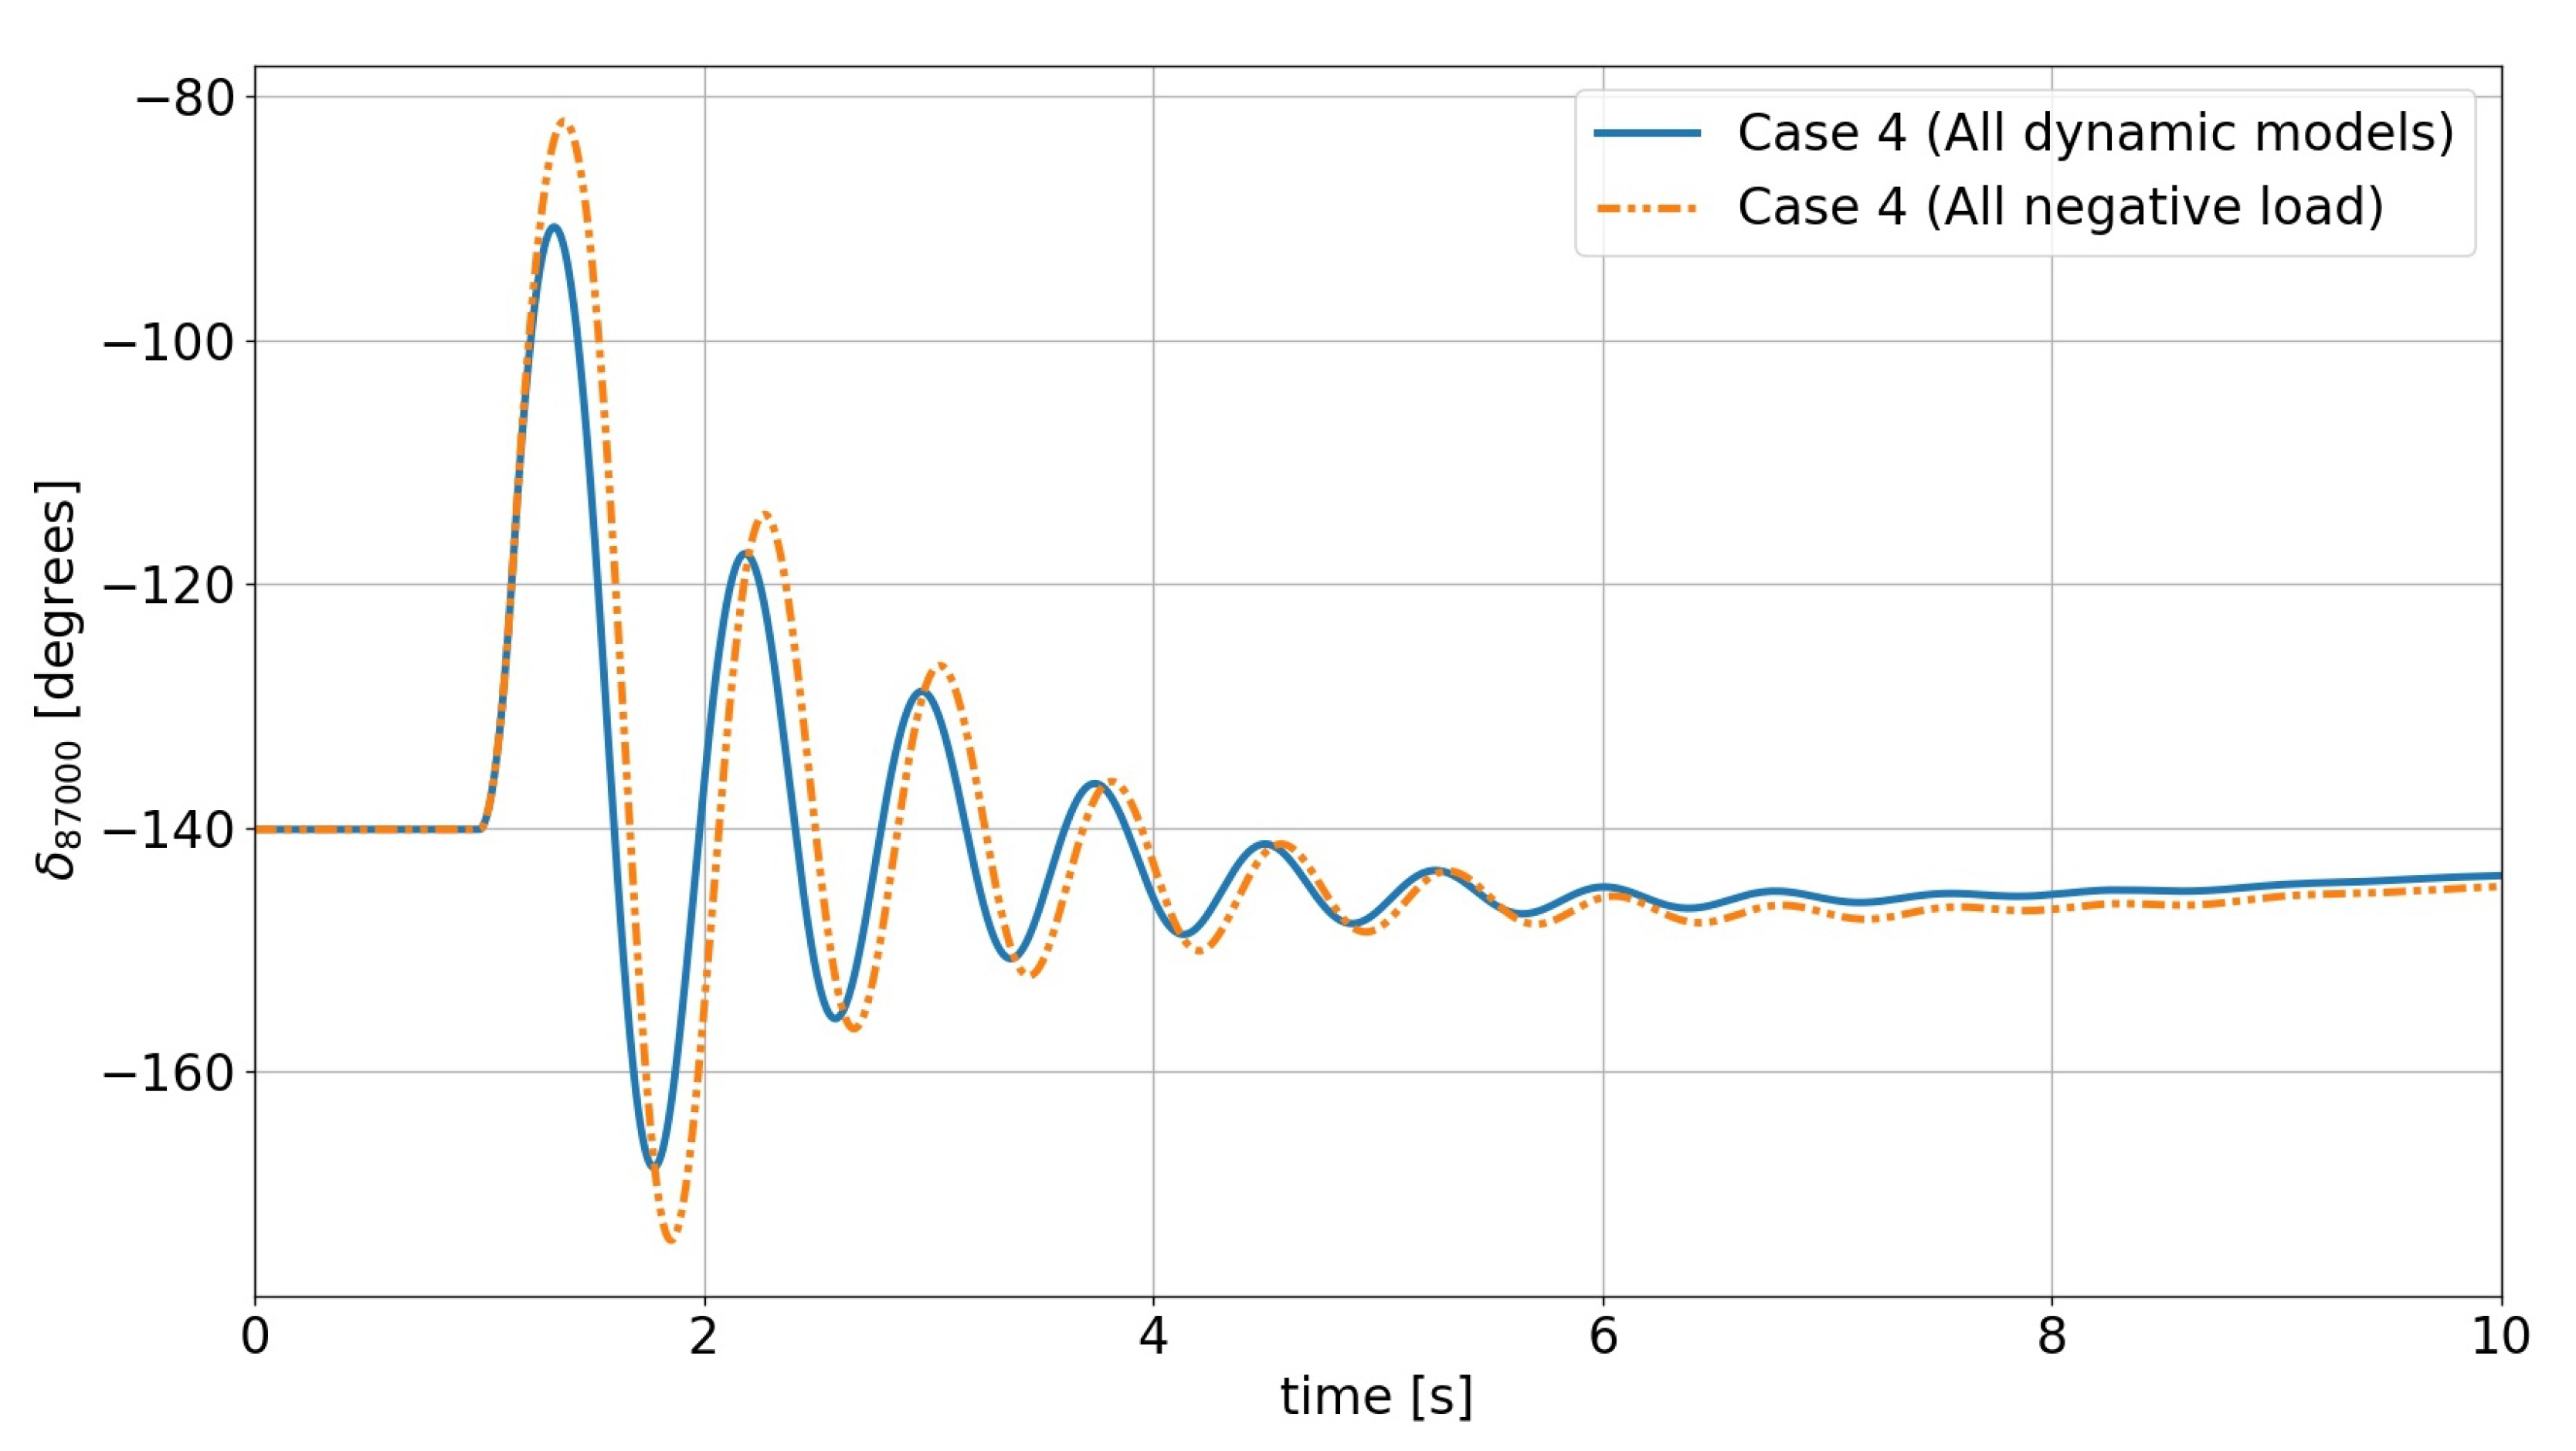
Table 5, the short-circuit current for case 1 is the highest. For this case it is also seen that the SCC PV ratio is the lowest. Hence for the four cases presented, the solar PV plants contribute the least for case 1 relative to the total short-circuit current. This is also reflected when looking at the critical clearing time of case 1 when comparing the representations All dynamic models and All negative load, as the lowest decrease is seen for this case. In other words, the solar PV plants have the smallest effect on the transient stability due to the lowest SCC PV ratio in case 1. Additionally, for cases 2 and 3, similar results are witnessed for the different representations as for these cases the SCC PV ratio is approximately identical. For case 4, a notable decrease in transient stability is seen when comparing the representations All dynamic models and All negative load—the rotor-angle response is provided in Figure 12, where it is shown that the amplitude of the rotor angle swings for the All negative load case is higher compared to the All dynamic models case. This increased difference stems from the fact that the short-circuit current in this case has decreased (due to out of service of certain synchronous generators) and thus the contribution of the solar PV plants to the total short-circuit current is more prevalent, as indicated by the SCC PV ratio for this case.
From the results provided in Table 4, it is shown that the solar PV plants do have an effect on the transient stability for this particular bus as the transient stability reduces when removing the dynamic behavior of the solar PV plants. Additionally, it is shown that the impact of the solar PV plants increase when their short-circuit current contribution increases with respect to the total short-circuit current at the faulted bus—this is expressed by an increasing SCC PV ratio.
Furthermore, when comparing the critical clearing time of the various representations, it is shown that the solar PV plants located at the faulted bus and to another bus nearby, do provide a significant contribution to the transient stability, but not a predominant one. As the remaining solar PV plants also aid the transient stability. This distinction between the contribution of local solar PV plants and solar PV plants located electrically further away from the fault is highly dependent on the capacity and the distribution of the solar PV plants in the two different areas.
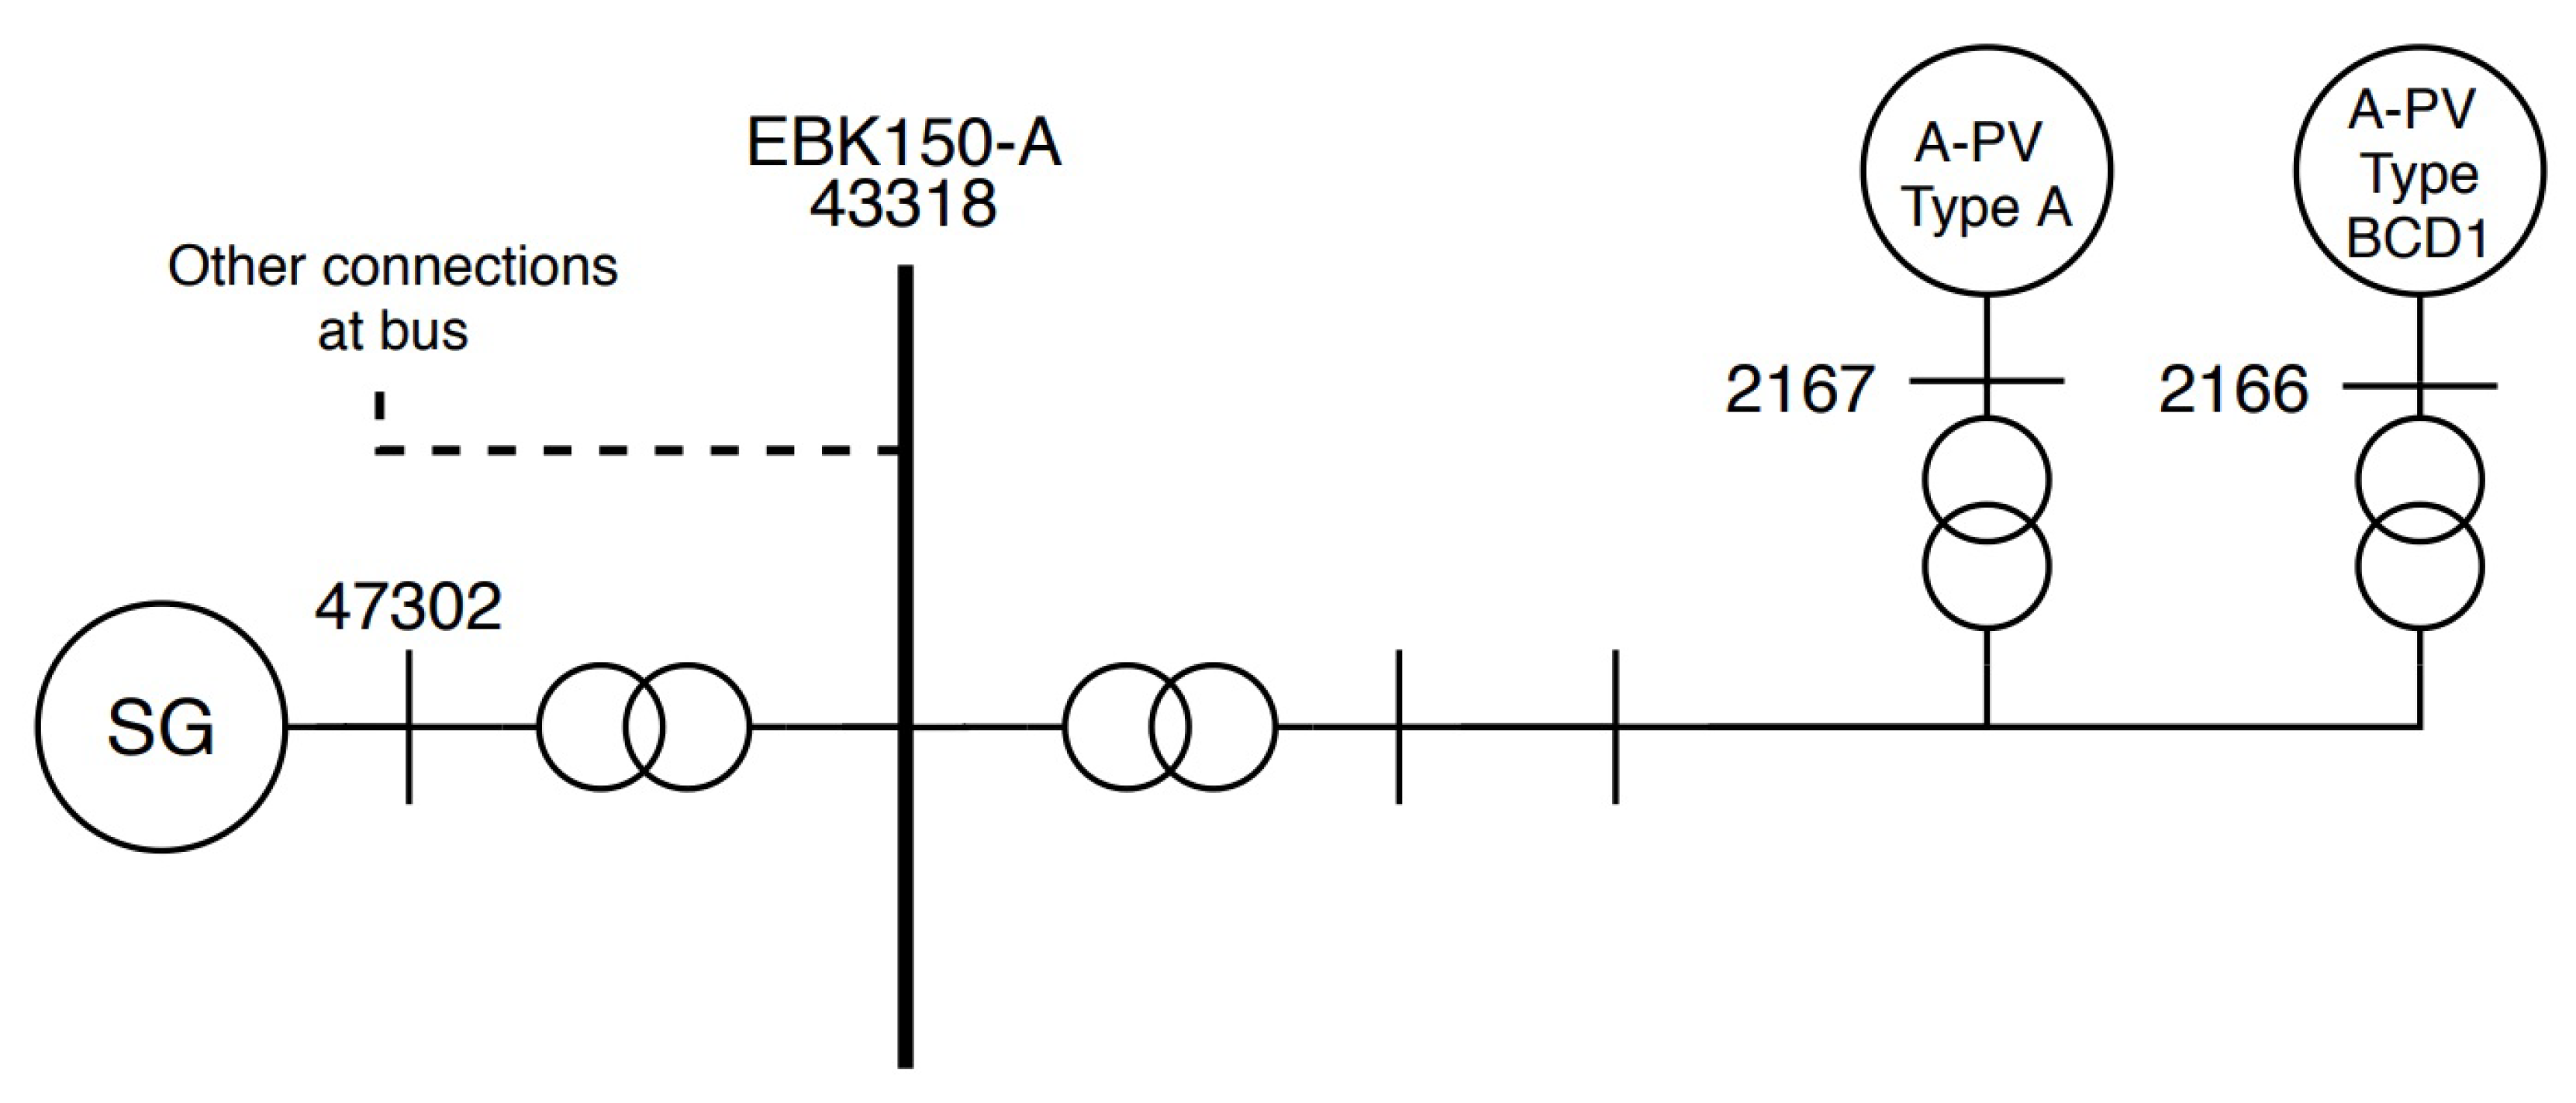
The second bus of interest is Eerbeek abbreviated by EBK150-A. This bus has an aggregated PV system connected and a synchronous generator connected to it but no large-scale PV system. The relevant connections of bus EBK150-A are provided in Figure 13. Similar to the case study of GT150-B, the synchronous generator close to EBK150-A has been provided with a fixed operating point across all cases and the generator bus voltage has been brought within a range of 0.01 pu across all cases. The critical clearing times for the various cases at this bus are shown in Table 6.
The results provided in Table 6 are contrastingly different compared to the results presented for GT150-B. In Table 6, it is seen that the critical clearing time changes slightly or not at all for the different representations and different cases presented. To obtain better insight as to why this is the case, the short-circuit current at the faulted bus is presented in Table 7.
First, it is seen that the short-circuit current presented in Table 7 for the different cases does not vary significantly. From this it can be concluded that the synchronous generators which are out of service for the varying cases do not provide any significant contribution to the faulted bus. Moreover, in Table 6, it is shown that the critical clearing times vary slightly or not at all for the presented representations and cases. This is due to the fact that the short-circuit contribution of the solar PV plants at this bus is low—this is expressed in the low percentages of the SCC PV ratio. In other words, this area is not populated densely by solar PV plants in close vicinity hence leading to a small contribution to the short-circuit current by the solar PV plants which in consequence leads to the solar PV plants having a limited role in the transient stability for this faulted bus.
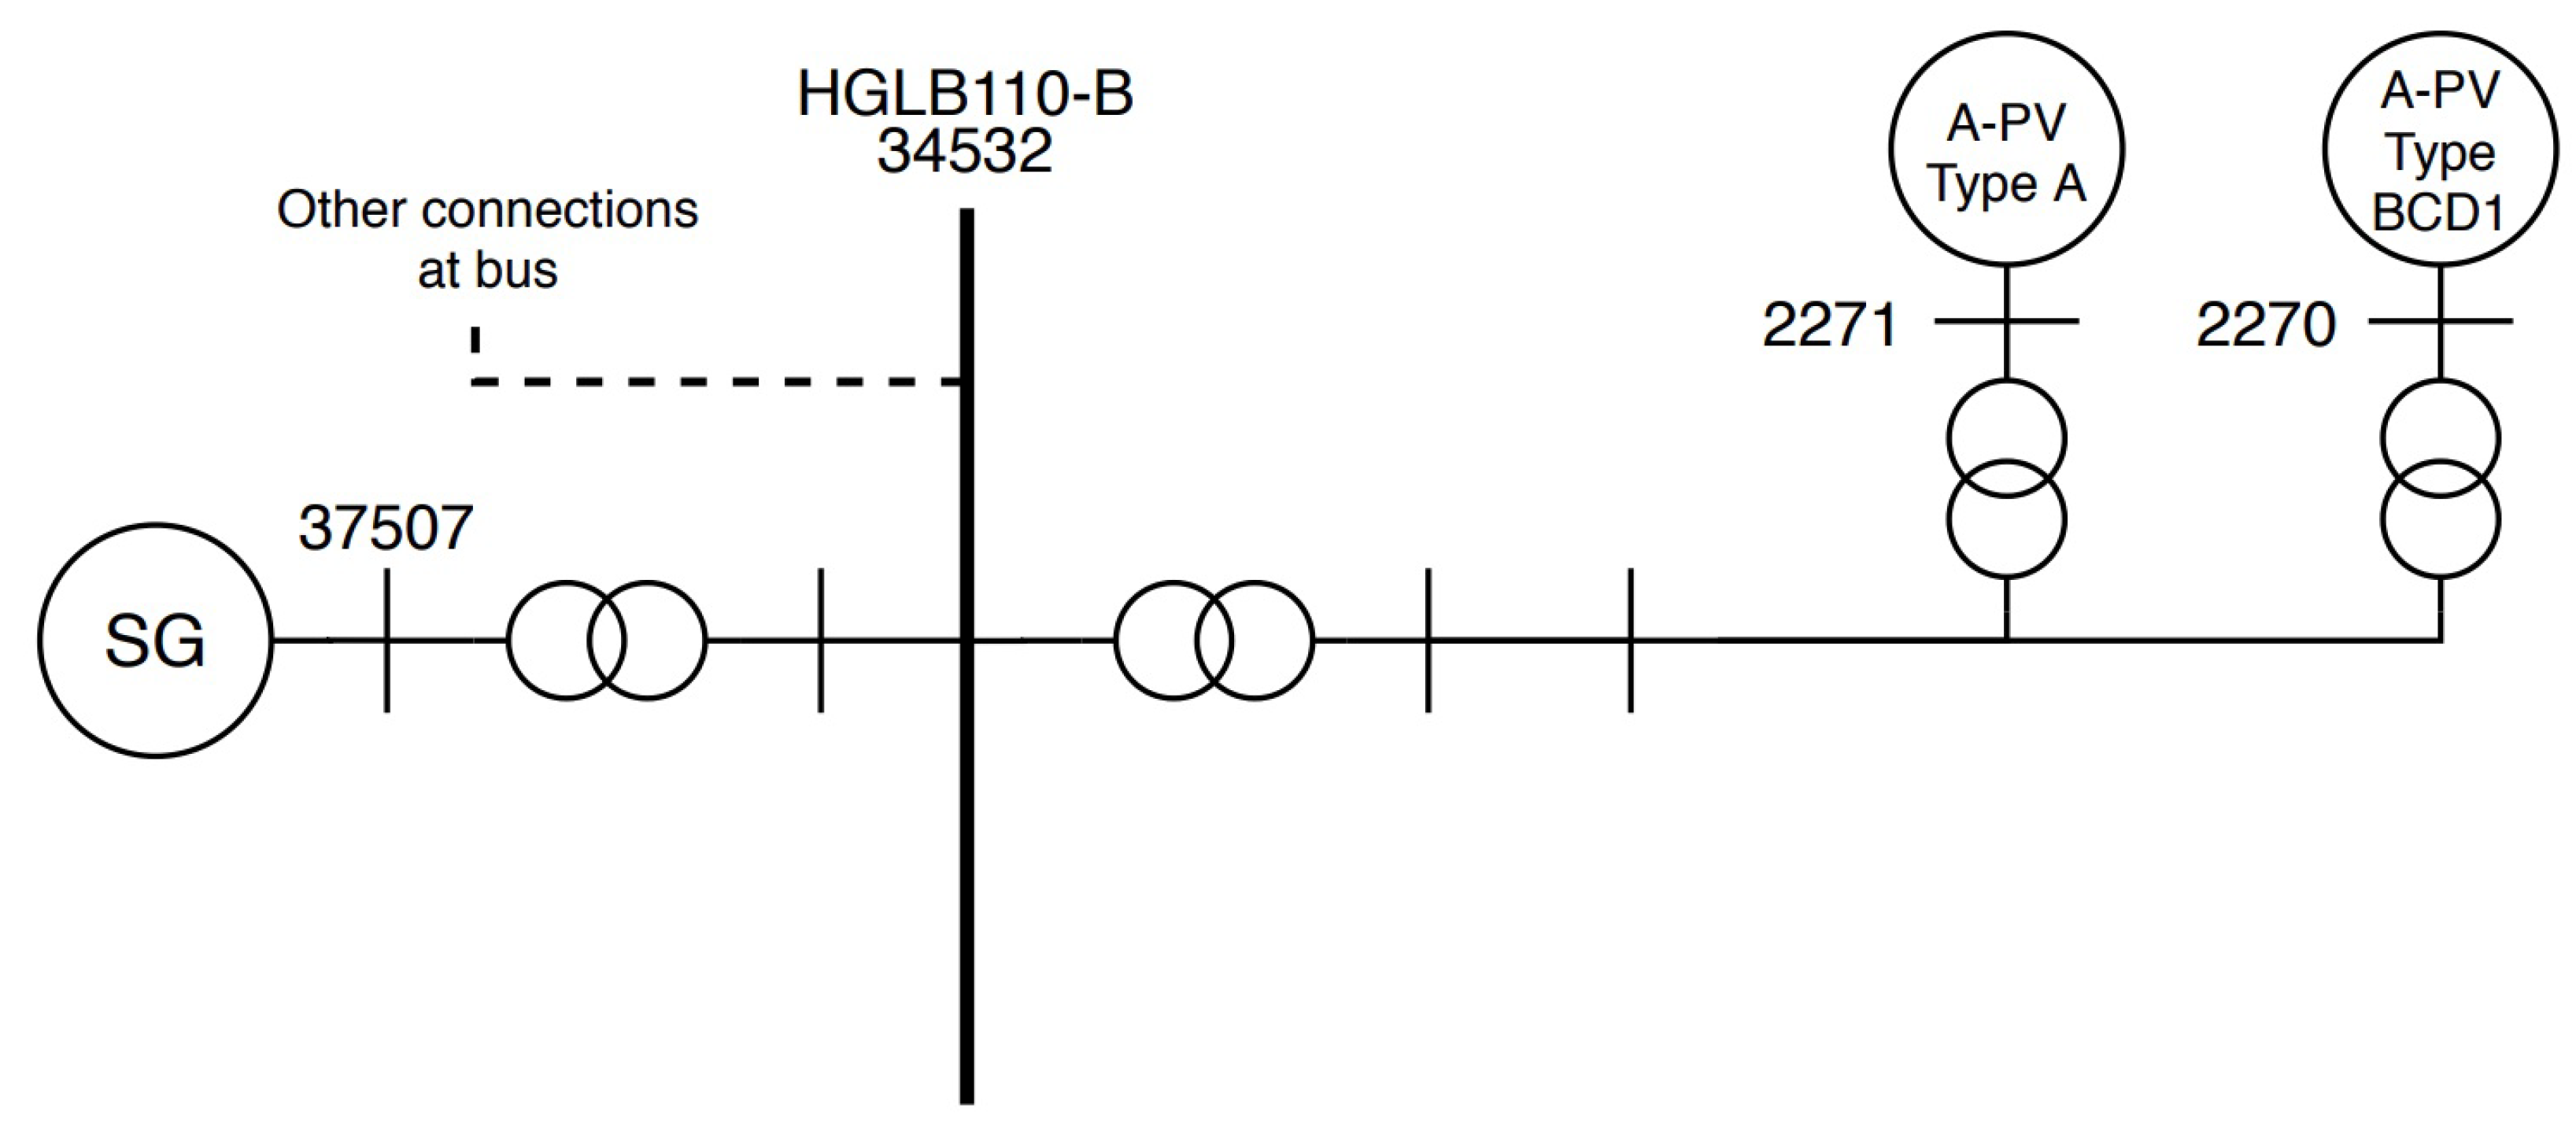
The third case which will be analyzed is the bus at Hengelo Boldershoek at a voltage level of 110 kV, this bus is also referred to as HGLB110-B. An overview of the important connections at this bus is provided in Figure 14.
The critical clearing times for the four cases are provided in Table 8. At this bus the representation Dynamic local 1 is equivalent to Dynamic local 2 as no solar PV plants are connected to neighboring buses of bus HNGL110-B.
The results provided in Table 8 are in line with the results provided for EBK150-A as the critical clearing time contains very minor changes for the various representations. This can explained, again, by looking at the amount of short-circuit current provided in different cases and the amount provided by the solar PV plants as shown in Table 9.
Similarly as the results provided for EBK150-A, it is shown for a fault at bus HGLB110-B, the critical clearing time is impacted barely by the presence of solar PV plants. For this bus, however, the short-circuit current contribution is higher compared to that seen in EBK150-A. Relative to the total short-circuit current, the average contribution of solar PV plants is slightly less—as expressed by the SCC PV ratios. In similar fashion, the solar PV plants have a limited say in the transient stability at this bus due to the small short-circuit contribution by the solar PV plants.
In the analysis, certain variables which influence the transient stability (e.g., voltage at generator bus, operating point of synchronous generator) were set to fixed values or within a certain range to try and isolate the behavior of solar PV plants on the transient stability. From the analysis it was shown that solar PV plants play an important role in one of the variables affecting transient stability i.e., the short-circuit current at the faulted bus. Two main distinctions in terms of the relation between the total short-circuit current and short-circuit current contribution by the solar PV plants can be made, these are:
  • High SCC PV ratio—The first distinction which can be made is for a faulted bus which possesses a high SCC PV ratio, this entails that the amount of short-circuit contribution of solar PV plants is high relative to the total short-circuit current at the faulted bus. Such an example was presented when evaluating the bus at GT150-B. In this studied case, the solar PV plants affected the transient stability notably. Additionally, for higher SCC PV ratios as case 4, it was shown that the transient stability was affected the most for this case when removing the dynamic behavior of the solar PV plants as the SCC PV ratio was the highest.
  • Low SCC PV ratio—The second distinction which can be made is for an area or faulted bus which possesses a low SCC PV ratio, meaning that the amount of short-circuit contribution of solar PV plants is low compared to the total short-circuit current at the faulted bus. Examples of cases with low SCC PV ratios are EBK150-A and HGLB110-B. For these cases it was shown that the low contribution to the total short-circuit current by the solar PV plants led to them having little to no influence on the transient stability.
Looking into the future, power system networks shall continue to phase out synchronous generators and add renewable energy sources such as solar PV plants. Consequently, the short-circuit current in the various regions shall decline as synchronous generators provide significantly more short-circuit current compared to renewable energy sources. This overall decline in short-circuit current and increase of short-circuit current contribution by solar PV plants shall progress a lot of areas towards higher SCC PV ratios and thus solar PV plants (and other RES) shall have a continuingly increasing influence on the transient stability.
The remarks above state the impact which solar PV plants have on the transient stability. It is also important to highlight when significant decrease in transient stability is witnessed. If the total short-circuit current at a faulted bus is highly contributed by synchronous generation units, then for certain situations in which synchronous generation units are put out of service, the short-circuit current at such a bus might decrease significantly henceforth potentially leading to harmful effects for the transient stability. Also, if a fault occurs at a bus near a synchronous generation unit which contains a low short-circuit current, transient stability problems might arise when such a synchronous generation unit is operating at a high operating point (close to its active power limit and under-excited).

3.5. Improving Transient Stability

In this section, methods to improve transient stability shall be proposed. The methods which will be discussed are:
  • Limiting operation region of synchronous generator
  • Addition of reactive compensation devices
  • Decreasing reactance between synchronous generator and faulted bus
Operating point of synchronous generator: The operating point of the synchronous generator plays an important role in the transient stability. To illustrate this point, GT150-B shall be evaluated (connections at this bus are shown in Figure 11) and the operating point of the synchronous generator nearby will be varied. To examine the impact of operating point of the synchronous generator on the transient stability, case 2 has been used. The maximum active power output (Pmax) and the MVA base of the generator at bus 87000 near GT150-B are equal to 650 MW and 812.50 MVA, respectively. The different operating points and the respective critical clearing times are provided in Table 10.
In Table 10, it is seen that the critical clearing time for operating point 1 till 3 yields the lowest critical clearing times compared to the other cases. For these operating points only the reactive power output of the synchronous generator has been varied, while the active power output is close to its limit. These operating points yield the lowest critical clearing times because the rotor angle is at a higher operating point yielding less margin for transient stability. In these cases, it is due to the high amount of active power being generated relative to the Pmax of the generator. Additionally, it is also seen that the critical clearing time for operating point 3 is the worst. Thus, the synchronous generator is at its most critical when a combination of high amount of active power generation and an under-excited generator is present. Similar conclusions can be drawn when looking at operating point 4 and 5, where it is seen that the under-excited generator decreases the critical clearing time significantly. On the other hand, it is seen that the active power generation is not as high compared to operating points 1 till 3 and hence the critical clearing time is not as low. Concludingly, it is illustrated that the transient stability is highly dependent on the operating point of the synchronous generator. Furthermore, the operating point of the generator has the most significant effect on the transient stability when the active power generation is close to its limits and the generator is under-excited. Consequently, for critical areas where synchronous generators are in danger of losing synchronism, limitations can be set on the synchronous generators near such relevant areas regarding the active power production and reactive power output to improve the transient stability.
Addition of reactive compensation device: As shown in the analysis, the short-circuit current at the faulted bus has a significant say in the transient stability. To illustrate this phenomenon, case 2 at the bus of EBK150-A is looked at without and with the addition of a reactive compensation device. The reactive compensation device has been added to the high voltage bus, in this case bus EBK150-A. The added reactive compensation device has a rating of 500 MVA. The critical clearing time of these two cases is shown in Table 11.
As shown in Table 11, the critical clearing time for the case with reactive compensation device has increased compared to the case without. This is due to the added short-circuit current contribution of the added device. An example of such devices are synchronous condensers or static compensators (STATCOM). Conclusively, it was shown that by adding a reactive compensation device such as a synchronous condenser or STATCOM, the total short-circuit current at the faulted bus increases hence improving the transient stability. Additionally, such devices also contribute to the voltage support.
Decrease reactance: Another method to improve the transient stability, albeit a very cost intensive one, is decreasing the reactance of the lines/cables or transformer in between the critical synchronous generator and the faulted bus. To demonstrate this point, bus GT150-B and case 2 has been looked at. A modification has been made by decreasing the reactance of the line between the synchronous generator at bus 87000 and the faulted bus GT150-B. The initial and modified reactance and the obtained critical clearing times for the two cases is provided in Table 12.
As shown in Table 12, by decreasing the reactance between the synchronous generator and the faulted bus, the critical clearing time increases. This can be explained by looking at the power flow transfer equation shown in Equations (10) and (11).
P = V r × V s X · s i n δ
Q = V r X ( V s · c o s δ V r )
As shown in Equations (10) and (11), the reactance is inversely proportional to the amount of active and reactive power transferred. Hence, when decreasing the reactance of the line from the synchronous generator to the faulted bus, less losses occur in terms of reactive power when the reactance is decreased, hence leading to a higher short-circuit contribution at the faulted bus and thus improving the transient stability. Realistically, this can be achieved by two methods,
  • By replacing the line/cable from the synchronous generator to the faulted bus with a line/cable with lower reactance. This alternative is very costly and does not provide any direct benefits other than an improved robustness and transfer capacity of added line. However, since the line will be completely replaced, the replacing line/cable can yield a low reactance.
  • By adding a parallel line from synchronous generator to the faulted such that the equivalent reactance is hence decreased. This alternative offers redundancy and the ability to spread the transfer over two lines. However, as the equivalent reactance is also a function of the existing line/cable, this poses a limitation for the decrease in equivalent reactance.

4. Conclusions

This paper proposes a method for obtaining a standard parameter set for representing large-scale and aggregated solar PV plants to address the research gap concerned with a lack of accepted parameters sets for representation of solar PV plants.
The selection of dynamic models for representing the generic behavior of large-scale PV and aggregated solar PV plants has been appointed to the large-scale PV model and DER_A model, respectively. The parameters of the models which align with the grid connection requirements were determined by the specified requirements—such important parameters are the reactive current gain and the reactive current injection deadband. Parameters which are manufacturer dependent were assigned values of existing solar PV plants in the Dutch grid. Furthermore, certain parameters did not have influence on the dynamic behavior of the PV system, these were assigned by typical values. Finally, for the remaining parameters, a parametric sensitivity study and literature research were combined to assign these values. With the above-mentioned steps a full parameter set was attained for the large-scale PV model and DER_A model. It is worth noting that the parameter sensitivity analysis can be done in a more intricate manner, by way of optimization-based tuning; such a method can be carried out as an extension of this research.
The analysis of the transient stability was conducted in such a manner as to isolate the behavior of the short-circuit current on the transient stability. This was achieved by evaluating a certain bus and setting the synchronous generator near that bus to a fixed operating point across all cases. Additionally, the voltage of this generator bus was brought within a range of 0.01 pu across the cases. These changes have been made to solely evaluate the impact of short-circuit current at the faulted bus on the transient stability. The analysis concluded that the impact of solar PV plants (at a bus near a synchronous generator) on the transient stability is predominantly determined by the SCC PV ratio equation defined. This relationship defined the amount of short-circuit contribution by the solar PV plants relative to the total short-circuit current at the faulted bus. As this ratio became higher, the solar PV plants started to have a bigger impact on the transient stability. On the other hand, when the SCC PV ratio was low, it was shown that solar PV plants had minimal impact on the transient stability. As solar PV plants are being added to power systems and synchronous generation units are being decommissioned, more areas will tend towards high SCC PV ratios hence the impact of the solar PV plants on the transient stability will only increase.
Moreover, proposed methods to improve the transient stability are limiting the operating region of critical synchronous generators, increasing the short-circuit current at a certain bus or region by adding a synchronous condenser or STATCOM and decreasing the reactance between the critical synchronous generator and the faulted bus.

Author Contributions

Conceptualization, N.K., J.B., J.R.T. and M.v.d.M.; methodology, N.K., J.B., J.R.T. and M.v.d.M.; formal analysis, N.K., J.B. and J.R.T.; investigation, N.K.; data curation, N.K.; writing—original draft preparation, N.K.; writing—review and editing, N.K., J.B., J.R.T., M.v.d.M. and P.P.; visualization, N.K. and J.B.; supervision, J.B., J.R.T. and M.v.d.M.; project administration, J.R.T. All authors have read and agreed to the published version of the manuscript.

Funding

This research received no external funding.

Conflicts of Interest

The authors declare no conflict of interest.

Appendix A

The proposed parameter set for the large-scale PV model is shown below in Table A1, Table A2 and Table A3.
Table A1. Parameters of REGC_A module of large-scale PV model.
ParameterDescriptionUnitValue
TgConverter time constants0.005
RrpwrLow Voltage Power Logic (LVPL) ramp rate limitpu10.0
BrkptLVPL characteristic voltage 2pu0.70
ZeroxLVPL characteristic voltage 1pu0.10
Lvpl1LVPL gainpu0
VolimVoltage limit for high voltage reactive current managementpu2
Lvpnt1High voltage point for low voltage active current managementpu0.8
Lvpnt0Low voltage point for low voltage active current managementpu0
IolimCurrent limit for high voltage reactive current management
(specified as a negative value)
pu−1.1
TfltrVoltage filter time constant for low voltage active current managements0.01
KhvOvervoltage compensation gain used in the high voltage reactive current0
IqrmaxUpper limit on rate of change for reactive currentpu99.0
IqrminLower limit on rate of change for reactive currentpu99.0
Accelacceleration factor (0 < Accel ≤ 1)1
Table A2. Parameters of REEC_B module of large-scale PV model.
ParameterDescriptionUnitValue
VdipLow voltage condition trigger voltagepu0.90
VupHigh voltage condition trigger voltagepu1.10
TrvVoltage filter time constants0.01
dbd1Overvoltage deadband for reactive current injectionpu−0.1
dbd2Undervoltage deadband for reactive current injectionpu0.1
KqvReactive current injection gainpu5
Iqh1Maximum reactive current injectionpu1
Iql1Minimum reactive current injectionpu−1
Vref0User defined reference (if 0, model initialises it to initial
terminal voltage)
pu0
TpFilter time constant for electrical powers0.01
QMaxlimit for reactive power regulatorpu0.6
QMinlimit for reactive power regulatorpu−0.6
VMAXMax. limit for voltage controlpu1.1
VMINMin. limit for voltage controlpu0.9
KqpReactive power regulator proportional gainpu10
KqiReactive power regulator integral gainpu0.1
KvpVoltage regulator proportional gainpu0.1
KviVoltage regulator integral gainpu0
TiqReactive current regulator time constants0.01
dPmax(>0) Power reference max. ramp ratepu/s10
dPmin(<0) Power reference min. ramp ratepu/s−10
PMAXMax. power limitpu1
PMINMin. power limitpu0
ImaxMaximum limit on total converter currentpu1.1
TpordPower filter time constants0.01
Table A3. Parameters of REPC_A module of large-scale PV model.
ParameterDescriptionUnitValue
TfltrVoltage or reactive power measurement filter time constants0.01
KpReactive power PI control proportional gainpu0.1
KiReactive power PI control integral gainpu0.15
TftLead time constants0.05
TfvLag time constants0
VfrzVoltage below which State s2 is frozenpu0
RcLine drop compensation resistancepu0
XcLine drop compensation reactancepu0
KcReactive current compensation gainpu0.33
emaxupper limit on deadband outputpu1
eminlower limit on deadband outputpu−1
dbd1lower threshold for reactive power control deadband (≤0)pu−0.005
dbd2upper threshold for reactive power control deadband (≥0)pu0.005
QmaxUpper limit on output of V/Q-controlpu0.4
QminLower limit on output of V/Q-controlpu−0.4
KpgProportional gain for power controlpu0.04
KigProportional gain for power controlpu0.08
TpReal power measurement filter time constants0.05
fdbd1Deadband for frequency control, lower threshold (≤0)Hz0
fdbd2Deadband for frequency control, upper threshold (≥0)Hz0
femaxfrequency error upper limitpu1
feminfrequency error lower limitpu−1
Pmaxupper limit on power referencepu1
Pminlower limit on power referencepu0
TgPower Controller lag time constants0.1
Ddndroop for over-frequency conditionspu20
Dupdroop for under-frequency conditionspu0
The proposed parameter set for the DER_A model is shown below in Table A4.
Table A4. Parameter set DER_A model.
ParameterDescriptionUnitValue
Trvvoltage measurement transducer time constants0.01
Trffrequency measurement transducer time constants0.01
dbd1lower voltage deadband (≤0)pu−0.1
dbd2upper voltage deadband (≥)pu0.1
Kqvproportional voltage control gainpu[0 2 5]
Vref0user specified voltage set-pointpu0
Tppower measurement transducer time constants0.01
TiqQ-control time constants0.01
Ddnreciprocal of droop for over-frequency conditions (<0)pu20
Dupreciprocal of droop for under-frequency conditions (>0)pu0
fdbd1deadband for frequency control, lower thresholdHz0
fdbd2deadband for frequency control, upper thresholdHz0
femaxfrequency error upper limitHz1
feminfrequency error lower limitHz−1
PMAXMaximum power limitpu1
PMINMinimum power limitpu0
dPmaxPower reference maximum ramp rate (>0)pu/s99
dPminPower reference minimum ramp rate (<0)pu/s−99
TpordPower filter time constants0.01
KpgPI controller proportional gainpu0.1
KigPI controller integral gainpu10
ImaxMaximum converter currentpu1.1
vl0inverter voltage break-point for low voltage cut-outpu0.7
vl1inverter voltage break-point for low voltage cut-out (vl1 ≥ vl0)pu0.7
vh0inverter voltage break-point for high voltage cut-outpu1.1
vh1inverter voltage break-point for high voltage cut-out (vh1 ≤ vh0)pu1.1
tvl0low voltage cut-out timer corresponding to voltage vl0s0.2
tvl1low voltage cut-out timer corresponding to voltage vl1s0.2
tvh0high voltage cut-out timer corresponding to voltage vh0s2
tvh1high voltage cut-out timer corresponding to voltage vh1s2
Vrfracfraction of device that recovers after voltage comes back to within
vl1 < V < vh1 (0 ≤ Vrfrac ≤ 1)
1
flinverter frequency break-point for low frequency cut-outHz47.5
fhinverter frequency break-point for high frequency cut-outHz51.5
tfllow frequency cut-out timer corresponding to frequency fls2
tfhhigh frequency cut-out timer corresponding to frequency fhs2
Tgcurrent control time constant (to represent behavior of inner
control loops) (>0)
s0.005
rrpwrramp rate for real power increase following a faultpu/s10
Tvtime constant on the output of the multipliers0.01
Vprvoltage below which frequency tripping is disabledpu0.3
Iqhlupper limit on reactive current injectionpu1
Iqlllower limit on reactive current injectionpu−1

References

  1. Qin, D.; Manning, M.; Chen, Z.; Marquis, M.; Averyt, K.; Tignor, M.; Miller, H. Contribution of Working Group I to the Fourth Assessment Report of the Intergovernmental Panel on Climate Change. In Climate Change 2007: The Physical Science Basis; Cambridge University Press: New York, NY, USA, 2007; pp. 12–17. [Google Scholar]
  2. NASA Team. Global Surface Temperature. 2019. Available online: https://climate.nasa.gov/vital-signs/global-temperature/ (accessed on 13 August 2020).
  3. Butler, C.D. Climate change, health and existential risks to civilization: A comprehensive review (1989–2013). Int. J. Environ. Res. Public Health 2018, 15, 2266. [Google Scholar] [CrossRef] [PubMed] [Green Version]
  4. Ruyssenaars, P.; Coenen, P.; Zijlema, P.; Arets, E.; Baas, K.; Dröge, R.; Geilenkirchen, G.; T Hoen, M.; Honig, E.; Huet, B. Greenhouse Gas Emissions in the Netherlands 1990–2017: National Inventory Report 2019; National Institute for Public Health and the Environment: Bilthoven, The Netherlands, 2019; pp. 58–59.
  5. Akpan, U.; Akpan, G. The contribution of energy consumption to climate change: A feasible policy direction. Int. J. Energy Econ. Policy 2011, 2, 21–33. [Google Scholar]
  6. United Nations. Paris Agreement. UNFCCC. 2015. Available online: https://unfccc.int/sites/default/files/english_paris_agreement.pdf (accessed on 12 August 2020).
  7. Klimaatakkoord. 2019. Available online: https://www.klimaatakkoord.nl/documenten/publicaties/2019/06/28/klimaatakkoord (accessed on 13 August 2020).
  8. Eguia, P.; Etxegarai, A.; Torres, E.; Martín, J.; Albizu, I. Use of generic dynamic models for photovoltaic plants. Renew. Energy Power Qual. J. 2015, 368–373. [Google Scholar] [CrossRef]
  9. Yamashita, K.; Renner, H.; Martinez Villanueva, S.; Vennemann, K.; Martins, J.; Aristidou, P.; Van Cutsem, T.; Song, Z.; Lammert, G.; Pabon, L.; et al. Modelling of Inverter-Based Generation for Power System Dynamic Studies. 2018, Volume 298, pp. 81–87. Available online: http://cired.net/uploads/default/files/727-web.pdf (accessed on 17 August 2020).
  10. Lammert, G.; Yamashita, K.; Renner, H.; Martinez, S.; Pourbeik, P.; Ciausiu, F.; Pabon, L.; Braun, M. International industry practice on modelling and dynamic performance of inverter based generation in power system studies. CIGRE Sci. Eng. 2017, 8, 25–37. [Google Scholar]
  11. Breithaupt, T.; Herwig, D.; Hofmann, L.; Mertens, A.; Meyer, R.; Farrokhseresht, N.; Tuinema, B.; Wang, D.; Rueda Torres, J.; Ruberg, S.; et al. Deliverable D1.1 Report on Systemic Issues; MIGRATE Project Consortium: Bayreuth, Germany, 2016; p. 137. [Google Scholar]
  12. Boemer, J.; Burges, K.; Nabe, C.; Pöller, M. All Island TSO Facilitation of Renewables Studies; Eirgrid: Dublin, Ireland, 2010. [Google Scholar]
  13. Oh, S.; Shin, H.; Cho, H.; Lee, B. Transient impact analysis of high renewable energy sources penetration according to the future korean power grid scenario. Sustainability 2018, 10, 4140. [Google Scholar] [CrossRef] [Green Version]
  14. Mohamed, S.R.; Jeyanthy, P.A.; Devaraj, D. Investigation on the impact of high-penetration of PV generation on transient stability. In Proceedings of the 2017 IEEE International Conference on Intelligent Techniques in Control, Optimization and Signal Processing (INCOS), Srivilliputhur, India, 23–25 March 2017; pp. 1–6. [Google Scholar]
  15. Lammert, G. Modelling, Control and Stability Analysis of Photovoltaic Systems in Power System Dynamic Studies. Ph.D. Thesis, University of Kassel, Kassel, Germany, 2019. [Google Scholar]
  16. Göksu, Ö.; Sorensen, P.; Fortmann, J.; Morales, A.; Weigel, S.; Pourbeik, P. Compatibility of IEC 61400-27-1 Ed 1 and WECC 2nd Generation Wind Turbine Models. In Proceedings of the International Workshop on Large-Scale Integration of Wind Power into Power Systems as well as on Transmission Networks for Offshore Wind Power Plants, Vienna, Austria, 15–17 November 2016. [Google Scholar]
  17. Pourbeik, P.; Sanchez-Gasca, J.J.; Senthil, J.; Weber, J.D.; Zadehkhost, P.S.; Kazachkov, Y.; Tacke, S.; Wen, J.; Ellis, A. Generic dynamic models for modeling wind power plants and other renewable technologies in large-scale power system studies. IEEE Trans. Energy Convers. 2017, 32, 1108–1116. [Google Scholar] [CrossRef]
  18. WECC Renewable Energy Modeling Task Force. Central Station PV Plant Model Validation Guideline. 2015. Available online: https://www.wecc.org/Reliability/Central%20Station%20Photovoltaic%20Power%20Plant%20Model%20Validation%20Guideline%20June%2017%202015.pdf (accessed on 24 August 2020).
  19. WECC Renewable Energy Modeling Task Force. Solar Photovoltaic Power Plant Modeling and Validation Guideline. 2019. Available online: https://www.wecc.org/Reliability/Solar%20PV%20Plant%20Modeling%20and%20Validation%20Guidline.pdf (accessed on 24 August 2020).
  20. Lammert, G.; Ospina, L.D.P.; Pourbeik, P.; Fetzer, D.; Braun, M. Implementation and validation of WECC generic photovoltaic system models in DIgSILENT PowerFactory. In Proceedings of the 2016 IEEE Power and Energy Society General Meeting (PESGM), Boston, MA, USA, 17–21 July 2016; pp. 1–5. [Google Scholar] [CrossRef]
  21. Eguia, P.; Etxegarai, A.; Torres, E.; San Martin, J.I.; Albizu, I. Modeling and validation of photovoltaic plants using generic dynamic models. In Proceedings of the 2015 International Conference on Clean Electrical Power (ICCEP), Taormina, Italy, 16–18 June 2015; pp. 78–84. [Google Scholar] [CrossRef]
  22. Machlev, R.; Batushansky, Z.; Soni, S.; Chadliev, V.; Belikov, J.; Levron, Y. Verification of utility-scale solar photovoltaic plant models for dynamic studies of transmission networks. Energies 2020, 13, 3191. [Google Scholar] [CrossRef]
  23. WECC Renewable Energy Modeling Task Force. Generic Solar Photovoltaic System Dynamic Simulation Model Specification; Sandia National Laboratories: Albuquerque, NM, USA; Livermore, CA, USA, 2012.
  24. Ramasubramanian, D.; Alvarez-Fernandez, I.; Mitra, P.; Gaikwad, A.; Boemer, J.C. The New Aggregated Distributed Energy Resources (der_a) Model for Transmission Planning Studies: 2019 Update; Electric Power Research Institure (EPRI): Washington, DC, USA, 2019. [Google Scholar]
  25. North American Electric Reliability Corporation (NERC). Reliability Guideline Parameterization of the DER_A Model; North American Electric Reliability Corporation (NERC): Atlanta, GA, USA, 2019. [Google Scholar]
  26. Elliott, R.T.; Ellis, A.; Pourbeik, P.; Sanchez-Gasca, J.J.; Senthil, J.; Weber, J. Generic photovoltaic system models for WECC—A status report. In Proceedings of the IEEE PES General Meeting, Denver, CO, USA, 26–30 July 2015; pp. 1–5. [Google Scholar] [CrossRef]
  27. WECC Renewable Energy Modeling Task Force. WECC Solar Plant Dynamic Modeling Guidelines. 2014. Available online: https://www.wecc.org/reliability/wecc%20solar%20plant%20dynamic%20modeling%20guidelines.pdf (accessed on 28 August 2020).
  28. Pourbeik, P.; Weber, J.; Ramasubramanian, D.; Sanchez-Gasca, J.; Senthil, J.; Zadkhast, P.; Boemer, J.; Gaikwad, A.; Green, I.; Tacke, S.; et al. An Aggregate Dynamic Model for Distributed Energy Resources for Power System Stability Studies. CIGRE Sci. Eng. 2019, 14, 38–48. [Google Scholar]
  29. Boemer, J. On Stability of Sustainable Power Systems: Network Fault Response of Transmission Systems with Very High Penetration of Distributed Generation. Ph.D. Thesis, Delft University of Technology, Delft, The Netherlands, 2016. [Google Scholar] [CrossRef]
  30. Commission Regulation (EU). Establishing a network code on requirements for grid connection of generators. Off. J. Eur. Union 2016, 112, 1–68. [Google Scholar]
  31. De Autoriteit Consument en Markt. Netcode Elektriciteit. 2016. Available online: https://wetten.overheid.nl/BWBR0037940/2018-12-22 (accessed on 2 September 2020).
  32. Netbeheer Nederland. Netcode Elektriciteit met Onderhanden Zijnde Codewijzigingenvoorstellen. 2019. Available online: https://www.netbeheernederland.nl/_upload/Files/E02_-_Netcode_elektriciteit_112.pdf (accessed on 2 September 2020). (In Dutch).
  33. Lammert, G.; Premm, D.; Ospina, L.D.P.; Boemer, J.C.; Braun, M.; Van Cutsem, T. Control of photovoltaic systems for enhanced short-term voltage stability and recovery. IEEE Trans. Energy Convers. 2019, 34, 243–254. [Google Scholar] [CrossRef] [Green Version]
Figure 1. Installed PV capacity in the Netherlands.
Electricity 01 00005 g001
Figure 2. Interconnection of large-scale PV modules.
Electricity 01 00005 g002
Figure 3. FRT curve for type B, C and D1 PGMs.
Electricity 01 00005 g003
Figure 4. FRT curve for type D2 PGMs.
Electricity 01 00005 g004
Figure 5. Additional reactive current injection and voltage deviation relationship.
Electricity 01 00005 g005
Figure 6. Flowchart assignment parameters of proposed parameter set.
Electricity 01 00005 g006
Figure 7. Active current injection of solar PV plant for varying values of Rrpwr.
Electricity 01 00005 g007
Figure 8. Flowchart for obtaining critical clearing time.
Electricity 01 00005 g008
Figure 9. Dynamic local 1 representation.
Electricity 01 00005 g009
Figure 10. Dynamic local 2 representation.
Electricity 01 00005 g010
Figure 11. Connections at GT150-B bus.
Electricity 01 00005 g011
Figure 12. Rotor angle of SG at bus 87000 (FCT = 150 ms).
Electricity 01 00005 g012
Figure 13. Connections at EBK150-A bus.
Electricity 01 00005 g013
Figure 14. Connections at HGLB110-B bus.
Electricity 01 00005 g014
Table 1. Definition of generator types.
Generator TypeVoltage LevelOperatorCapacity Range
Type 0<110 kVand0–0.0008 MW
Type A<110 kVand0.0008 MW–1 MW
Type B<110 kVand1 MW–50 MW
Type C<110 kVand50 MW–60 MW
Type D1<110 kVand≥60 MW
Type D2≥110 kVandall
Table 2. Relevant grid connection requirements.
RequirementType AType BType CType D
Fault-ride-through capability of generators connected below 110 kVxxxD1
Fault-ride-through capability of generators connected at 110 kV or abovexxxD2
Provision of fast fault current (for IBG)xxxx
Table 3. Reactive current injection parameters.
ParameterDescriptionValue
Vdip* (pu)Low voltage condition trigger voltage0.9
Vup* (pu)High voltage condition trigger voltage1.1
dbd1 (pu)Overvoltage deadband for reactive current injection−0.1
dbd2 (pu)Undervoltage deadband for reactive current injection0.1
KqvReactive current injection gain[2 5]
Iqhl (pu)Maximum reactive current injection1
Iqll (pu)Minimum reactive current injection−1
Table 4. CCTs for fault at bus GT150-B.
RepresentationCCT Case 1 (ms)CCT Case 2 (ms)CCT Case 3 (ms)CCT Case 4 (ms)
All dynamic models279274274272
All negative load268256256237
Dynamic local 1270256261242
Dynamic local 2274261265247
Table 5. Short-circuit current at bus GT150-B.
CaseSCC Case 1 (kA)SCC Case 2 (kA)SCC Case 3 (kA)SCC Case 4 (kA)
Total SCC59.6457.2657.3254.25
Total SCC PV9.099.389.469.97
SCC PV ratio15.25%16.37%16.50%18.37%
Table 6. CCTs for fault at bus EBK150-A.
RepresentationCCT Case 1 (ms)CCT Case 2 (ms)CCT Case 3 (ms)CCT Case 4 (ms)
All dynamic models272268270270
All Negative load272268268268
Dynamic local 1272268268268
Dynamic local 2272268268268
Table 7. Short-circuit current at bus EBK150-A.
CaseSCC Case 1 (kA)SCC Case 2 (kA)SCC Case 3 (kA)SCC Case 4 (kA)
Total SCC25.3525.3425.2825.06
Total SCC PV2.462.482.512.61
SCC PV Ratio9.70%9.80%9.94%10.41%
Table 8. CCTs for fault at bus HNGL110-B.
RepresentationCCT Case 1 (ms)CCT Case 2 (ms)CCT Case 3 (ms)CCT Case 4 (ms)
All dynamic models322320320322
All negative load320315317317
Dynamic local 1320315317317
Dynamic local 2320315317317
Table 9. Short-circuit current at bus HNGL110-B.
CaseSCC Case 1 (kA)SCC Case 2 (kA)SCC Case 3 (kA)SCC Case 4 (kA)
Total SCC32.2332.1432.0432.14
Total SCC PV2.532.592.632.70
SCC PV Ratio7.86%8.05%8.20%8.41%
Table 10. Operating points of synchronous generator at bus 87000.
SG at Bus 87000P (MW)Q (Mvar)CCT (ms)
Operating Point 162090.00274
Operating Point 26200.00256
Operating Point 3620−45.00242
Operating Point 445030.00387
Operating Point 5450−30.00359
Operating Point 62500>400
Table 11. CCT with and without synchronous condenser.
CaseCCT (ms)
Without SC268
With SC293
Table 12. Modified reactance and CCT of studied cases.
CaseX (pu)CCT (ms)
Initial reactance0.001430274
Modified reactance0.0004279
Publisher’s Note: MDPI stays neutral with regard to jurisdictional claims in published maps and institutional affiliations.

