
A Study of Load Imbalance Influence on Power Quality Assessment for Distribution Networks


Department of Energy Technology, Aalborg University, 9220 Aalborg, Denmark
*
Author to whom correspondence should be addressed.
Electricity 2021, 2(1), 77-90; https://0-doi-org.brum.beds.ac.uk/10.3390/electricity2010005
Submission received: 18 December 2020
/
Revised: 16 January 2021
/
Accepted: 17 February 2021
/
Published: 1 March 2021
(This article belongs to the Special Issue Advances in Electrical Engineering from EU-Funded Horizon 2020 Projects)
Abstract
:Power quality studies for distribution networks are very important for future network expansions realized by utility companies, so the accuracy of such studies is critical. Load data, including information on load imbalance, could have in many situations a significant influence on the correct estimation of many power quality indicators. This paper investigates the impact of load imbalance on several phase imbalance indicators and voltage quality indicators by comparing the values of these indicators, as calculated in a power quality study using, sequentially, different sets of load data characterized by different load imbalances. The results of this study confirm the original hypothesis, showing that the use of inaccurate consumption profiles for loads leads to an inaccurate estimation of some power quality indicators. In addition, the results highlight the difficulty of approximating the actual consumption profiles of electrical loads so that this approximation does not affect the correctness of the estimation of phase imbalance and voltage quality indicators.
1. Introduction
The electric power consumed by household customers varies over time and depends on many factors, such as the nature of the component loads and the operating schedule of each load. Most of these loads are single-phase, e.g., light sources, household appliances, air-conditioning systems and electronic products, while three-phase loads are rare on residential premises. Daily consumption profiles are different for each customer and depend on his/her daily activities, thus being characterized by randomness and unpredictability. Power quality in electrical networks is closely related to the consumption profiles of electrical loads, therefore power quality studies require information on load consumption as input data, which are also referred to as load data in this paper.
The availability of load data is often scarce, so in many power quality studies, it is assumed that electrical loads are either balanced, i.e., all phases are loaded equally, or characterized by a predefined imbalance level, i.e., the phases are unevenly loaded [1,2]. This assumption is not always correct and consequently the results of such studies could be inaccurate [1,2]. For example, the voltage level at the end of a radial low voltage (LV) feeder could be significantly different from the voltage level estimated by the distribution system operator (DSO) due to the use of an unrealistic imbalance level for electrical loads. Obviously, the estimation of the voltage imbalance and current imbalance levels suffers in this case. The difference between the estimated and the actual quantities, including the voltage magnitude, will be more pronounced for networks that are more sensitive to power fluctuations, such as weak grids [3].
As mentioned already, many power quality studies make all sort of suppositions regarding the load imbalance level. For example, in [3], the impact of the resolution of wind speed data and solar irradiance data on the estimation of voltage fluctuations in LV feeders with distributed solar and wind generation was investigated, with the assumption that all loads on feeders are three-phase loads and balanced. In [4,5], the authors investigated how much power can be injected into a three-phase LV network by single-phase solar inverters without violating the imbalance limits. Meanwhile, in [4], it was assumed that all phases are loaded equally, and in [5], it was assumed that the second phase and the third phase are twice and three times as loaded, respectively, as the first phase. In [6], the effect of load imbalance level on power losses of distribution networks was investigated, and the authors considered several scenarios for electrical loads. Accordingly, all loads were assumed to be balanced in one of the scenarios, but in other scenarios, the loading of the second phase was decreased by a certain percentage, while the loading of the third phase was either increased by the same percentage or decreased by twice the percentage of the second phase, with the considered percentage ranging from 2.5% to 15% [6]. In [7], the authors analyzed the impact of unbalanced line configurations and unbalanced phase loading on phase voltage drops and voltage imbalance levels in distribution networks. The analysis worked with different load suppositions, including equal phase loading and unequal phase loading, namely, one phase is 15% percent more loaded, while another phase is 15% less loaded than the remaining phase [7].
In other power quality studies, the authors have had, to some extent, access to load data. For example, in [8], a probabilistic load model was developed based on actual consumption data and was then used to statistically estimate voltage drops and voltage imbalance levels for larger LV distribution networks. Other authors have used power measurements [9] or voltage and current measurements [10] from a single location, e.g., the substation end of an LV feeder, to estimate the aggregate imbalance level for an entire area, but no estimation is possible for other electrical nodes, such as a specific consumer or a specific junction box. Despite the last few examples, it can be argued that, more often than not, real load data are not available in power quality studies.
This paper aims to investigate the influence of load data on power quality studies, with a focus on load imbalance level and voltage quality for LV distribution feeders. For this reason, the results of a power quality study using real load data are compared with the results of similar studies, but which make the typical assumptions regarding the load data. The comparison targets several power quality indicators, such as voltage magnitude variation, feeder voltage drops and various phase imbalance factors, as precisely these indicators are relevant for DSOs when planning the connection of new consumers or prosumers to their networks. As will be shown in this paper, the differences between the results provided by the aforementioned studies are significant in some cases. The entire work is possible due to the availability of real load data provided by the smart meters of a Danish LV smart grid.
The rest of the paper is structured as follows. Section 2 briefly presents the causes and effects of phase imbalances in LV networks and some solutions for their mitigation, as well as the main quality indicators that are used to assess voltage and current imbalances or indicators that are affected by these imbalances. Section 3 describes the study conducted in this paper to investigate the impact of consumption profiles on power quality studies, specifically the effect of the load imbalance of an LV distribution network on the power quality indicators discussed in Section 2. Section 4 presents and then discusses the results of the conducted study, and Section 5 concludes this paper with the most important conclusions and takeaway ideas.
2. Phase Imbalance in Distribution Networks
2.1. Causes, Consequences and Mitigation Solutions
A set of three phasors, such as three-phase voltages or currents, is balanced if all phasors have the same magnitude and are phase-shifted symmetrically by 120° to each other. Any deviation of the magnitudes and/or phase-shifts from these conditions causes the considered set of phasors to be unbalanced. According to an alternative definition, a set of three voltages or currents is balanced if it decomposes only into positive-sequence voltages or positive-sequence currents, respectively, otherwise it is unbalanced [11]. System operators strive to supply a balanced set of voltages at the point of common coupling (PCC) between the LV network and the medium voltage (MV) network [12]. In this sense, it is convenient that synchronous generators, which are the main sources of electric power, are designed to produce only positive-sequence voltages, i.e., three-phase balanced voltages [11], and that the phase imbalance introduced by the grid equipment connecting the bulk generation and LV distribution is generally negligible [12]. In fact, under normal conditions, the phase imbalances at the PCCs between the LV network and the MV network have, in most cases, local causes within the LV network itself. These include unequal phase impedances, single-phase laterals and other structural asymmetries of LV networks, uneven allocation of single-phase consumers across the three phases, unbalanced three-phase loads and random variation of consumption over time [13]. In addition, the presence of single-phase distributed generation, e.g., single-phase solar inverters, also contributes to the phase imbalances occurring in LV networks [14]. However, load asymmetry represents the main cause of voltage and current imbalances in LV distribution networks [8,12]. Asymmetric faults are another source of voltage or current imbalances [11,15], but these are transient events and are usually cleared quickly from the grid, so will not be considered in this paper.
Depending on their level, phase imbalances can have negative consequences on LV networks and electrical equipment. Current imbalances lead to a reduction in the serviceable loading capacity of LV cables and distribution transformers, in the sense that some phases can no longer be used up to nominal ratings [10,12], thus becoming a limiting factor for the connection of loads and distributed generation [13]. Current imbalances also cause additional Joule losses in distribution transformers and LV cables, in both phase and neutral wires [13,16]. In fact, according to [16], in many countries, the imbalance-induced energy losses represent a significant part of the total losses occurring in LV networks. When supplied by unbalanced voltages, induction machines and power converters face adverse effects such as reduced efficiency, increased losses, potentially dangerous overheating and, in some situations, premature failures [17,18]. At severe voltage or current imbalance levels, some types of protection relays could malfunction, leading to miscoordination, nuisance tripping and lack of selectivity [15].
Due to the detrimental consequences of voltage and current imbalances on electrical equipment, attempts are being made to limit and reduce the imbalance level in LV networks. The most common solution is to redistribute single-phase loads and single-phase laterals in such a way that LV feeders become less unbalanced [13]. Further, the connection of single-phase solar inverters to LV networks is subject to regulations regarding the maximum installed power [19]. Other solutions for mitigating phase imbalances include replacing LV cables with cables with a larger cross-section [5], installing phase balancers in LV feeders [13,20], and implementing imbalance compensation techniques in solar inverters [17,21]. In [12], it is argued that load balancing is the responsibility of both DSOs and customers, and thus the authors propose an imbalance-based electricity tariff to stimulate the consumption of balanced currents from the LV network.
Ultimately, imbalance-sensitive equipment is protected by protection relays, so that dangerous levels of phase imbalances lead to relay tripping and grid disconnection, rather than damaging the equipment [15].
2.2. Power Quality Indicators of Phase Imbalances
Power quality issues, including phase imbalances, are mainly assessed by examining the quality of the voltage waveform at the PCC. Regarding the voltage imbalance, the commonly used quality indicators are those defined by the International Electrotechnical Commission (IEC), the Institute of Electrical and Electronics Engineers (IEEE) and the National Equipment Manufacturer’s Association (NEMA) of the United States [22].
The IEC defines the voltage unbalance factor (VUF), which corresponds to the so-called “true definition” of voltage imbalance, based on symmetrical components of the voltage. The VUF is given in Equation (1), where V1 and V2 represent the positive sequence and the negative sequence, respectively, of phase voltages [23].
The IEEE defines the phase voltage unbalance rate (PVUR) as the ratio between the maximum voltage deviation from the average phase voltage, denoted ΔVP_max, and the average phase voltage, denoted VP_avg [24]. The PVUR is given in Equation (2). The NEMA proposes a similar index, but using line voltage instead of phase voltage [22].
Various standards, including EN50160 and ANSI C84.1, recommend that VUF, PVUR or other equivalent indicators should not exceed 2–3% in LV distribution networks [25], [26], but many DSOs impose stricter limits for their installations.
Complementary current imbalance indicators can be obtained by replacing in Equations (1) and (2) the voltages with equivalent currents [12]. Thus, Equations (3) and (4) define the current unbalance factor (IUF) and the phase current unbalance factor (PIUR).
The literature includes some other quality indicators for the evaluation of voltage imbalances in electrical networks. For example, in [10], the authors propose an alternative indicator to VUF, arguing that the zero-sequence component of phase voltages should also be accounted for by an indicator of voltage imbalance. The proposed indicator, referred to in this paper as the alternative VUF (AVUF), is expressed in Equation (5), where V0 is the zero sequence of phase voltages.
Another indicator discussed in the literature is the complex VUF (CVUF), which represents an extension of the VUF by accounting for both the magnitudes and angles of the symmetrical components of phase voltages [18]. The CVUF is given in Equation (6), where φ1 and φ2 are the angles of the positive sequence and negative sequence, respectively, of phase voltages.
Phase imbalances could influence quantities that are not necessarily intended to assess phase imbalances. Voltage regulation (VR), for example, is used to quantify the ability of electrical systems to supply constant voltages at different loadings [27] and is affected by voltage imbalances due to the clear connection that the latter have with voltage variations. The VR formula is given in Equation (7), where VP_NoLoad is the phase voltage at no load and VP_Load is the phase voltage under load, measured at the same location in the electrical system [27]. Phase imbalances cause different voltage variations in each phase, which further cause different VRs in each phase.
VR is used in connection with equipment that can actively control voltage, such as transformers with tap changers, but also in connection with equipment without voltage control capabilities, such as tap-less transformers and electrical cables [27]. For the last category of equipment, and especially for radial feeders, voltage drops due to current flow are also relevant and therefore regulated. Voltage drops, denoted ΔV, are calculated using the formula given in Equation (8), where VP_Source is the phase voltage of the power source, e.g., the secondary winding of a transformer, VP_PCC is the phase voltage at the PCC of a given consumer and VP_rated is the rated phase voltage.
Voltage drops are limited to a maximum of 4–6% for most LV feeders [28]. Voltage magnitude variations, on the other hand, are limited to ±5% in the United States and ±10% in most European countries, while in the rest of the world, these limits are not much different. The permissible limits of voltage magnitude variations are expressed in relation to the nominal voltage of the country in question and are applicable at the customer’s PCC with the LV network [28].
3. Description of Conducted Study
3.1. Research Methodology
As mentioned in the Introduction, this paper aims to determine the importance of the accuracy of load imbalance data in power quality studies for LV distribution networks. In this sense, a power quality study for an exemplary LV network is performed, but using four different sets of load data to evaluate the same quality indicators. The results obtained for each data set are then compared and discussed in detail. The power quality indicators selected for evaluation are from those introduced in the previous section, namely, voltage magnitude variations, VR, VUF, PVUR, AVUF, IUF and PIUR. The exemplary LV network is modeled using MATLAB Simulink and simulated successively for each set of load data, and is based on the topology and electrical parameters of a LV smart grid from the rural area of northern Denmark, all loads having a three-phase connection. The modeling of this exemplary LV network is described in Section 3.2.
The first data set contains real load data, acquired by smart meters of the same Danish LV smart grid that underlies the exemplary LV network used in this study. Smart meters have recorded the power consumed by each phase of every household, so the loads are inherently unbalanced in this data set and have a random variation over time. The other data sets are generated by manipulating the real load data, as shown in Table 1. More precisely, data manipulation is performed in such a way that the total power consumed by every three-phase load at any given time instant is kept the same as for the first data set, i.e., as in the case of real loads. For data set 2, all loads are balanced, and for data set 3 and data set 4, all loads follow a certain imbalance pattern that is in line with the typical load imbalance assumptions existing in the literature and discussed in the Introduction. The loads in data set 1 are presented in Section 3.3.
3.2. Modeling of Exemplary LV Network
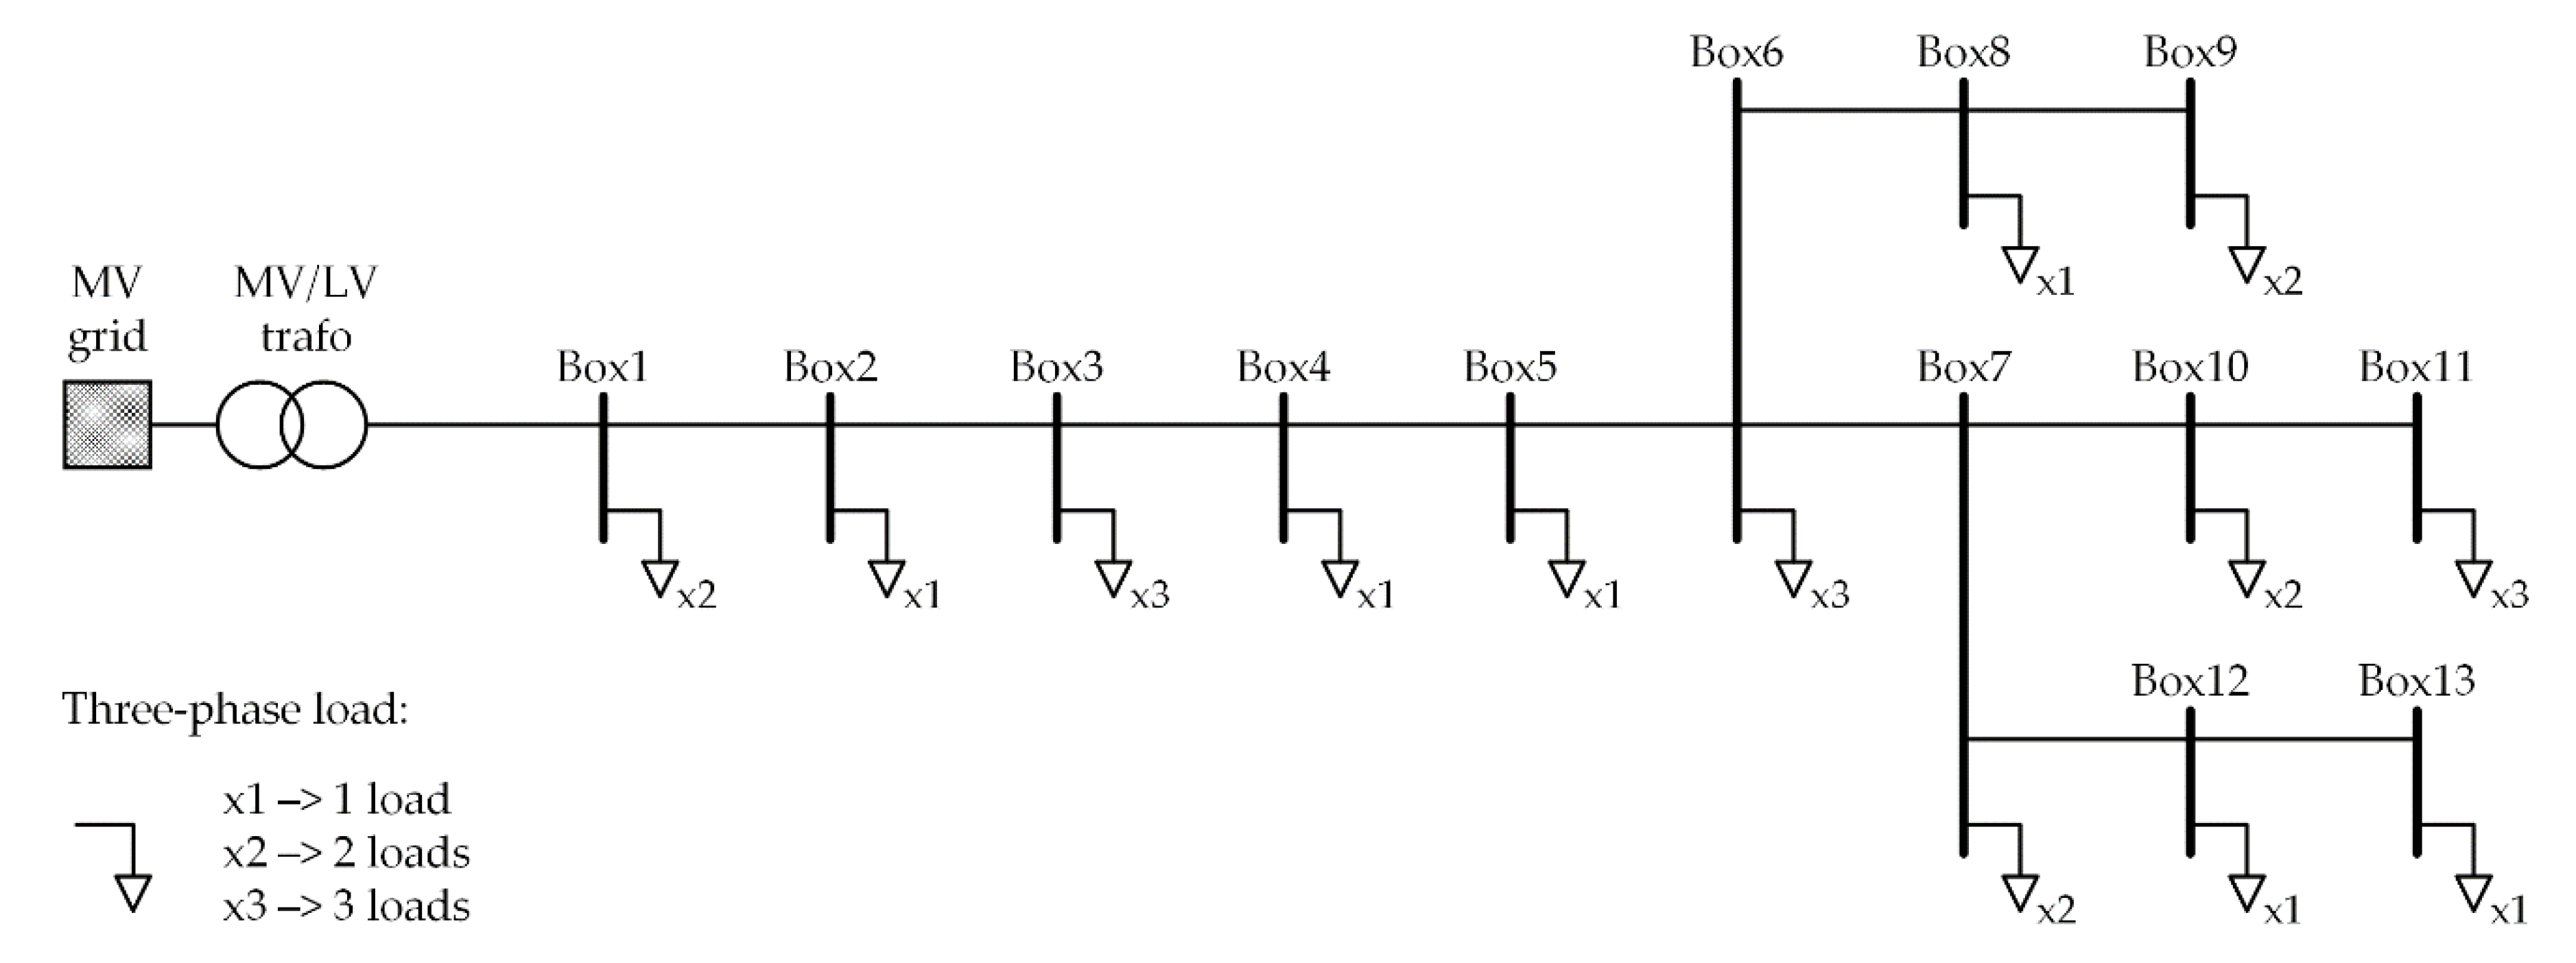
Figure 1 shows the single-line diagram of the LV network considered in this paper. It consists of a radial distribution feeder and 23 three-phase residential loads that are supplied via 13 distribution boxes, labeled Box1, Box2 and so on. There are one, two or three loads connected to each distribution box, as shown in Figure 1. The loads are fed from the medium voltage (MV) grid through an MV/LV power transformer and several distribution cables.
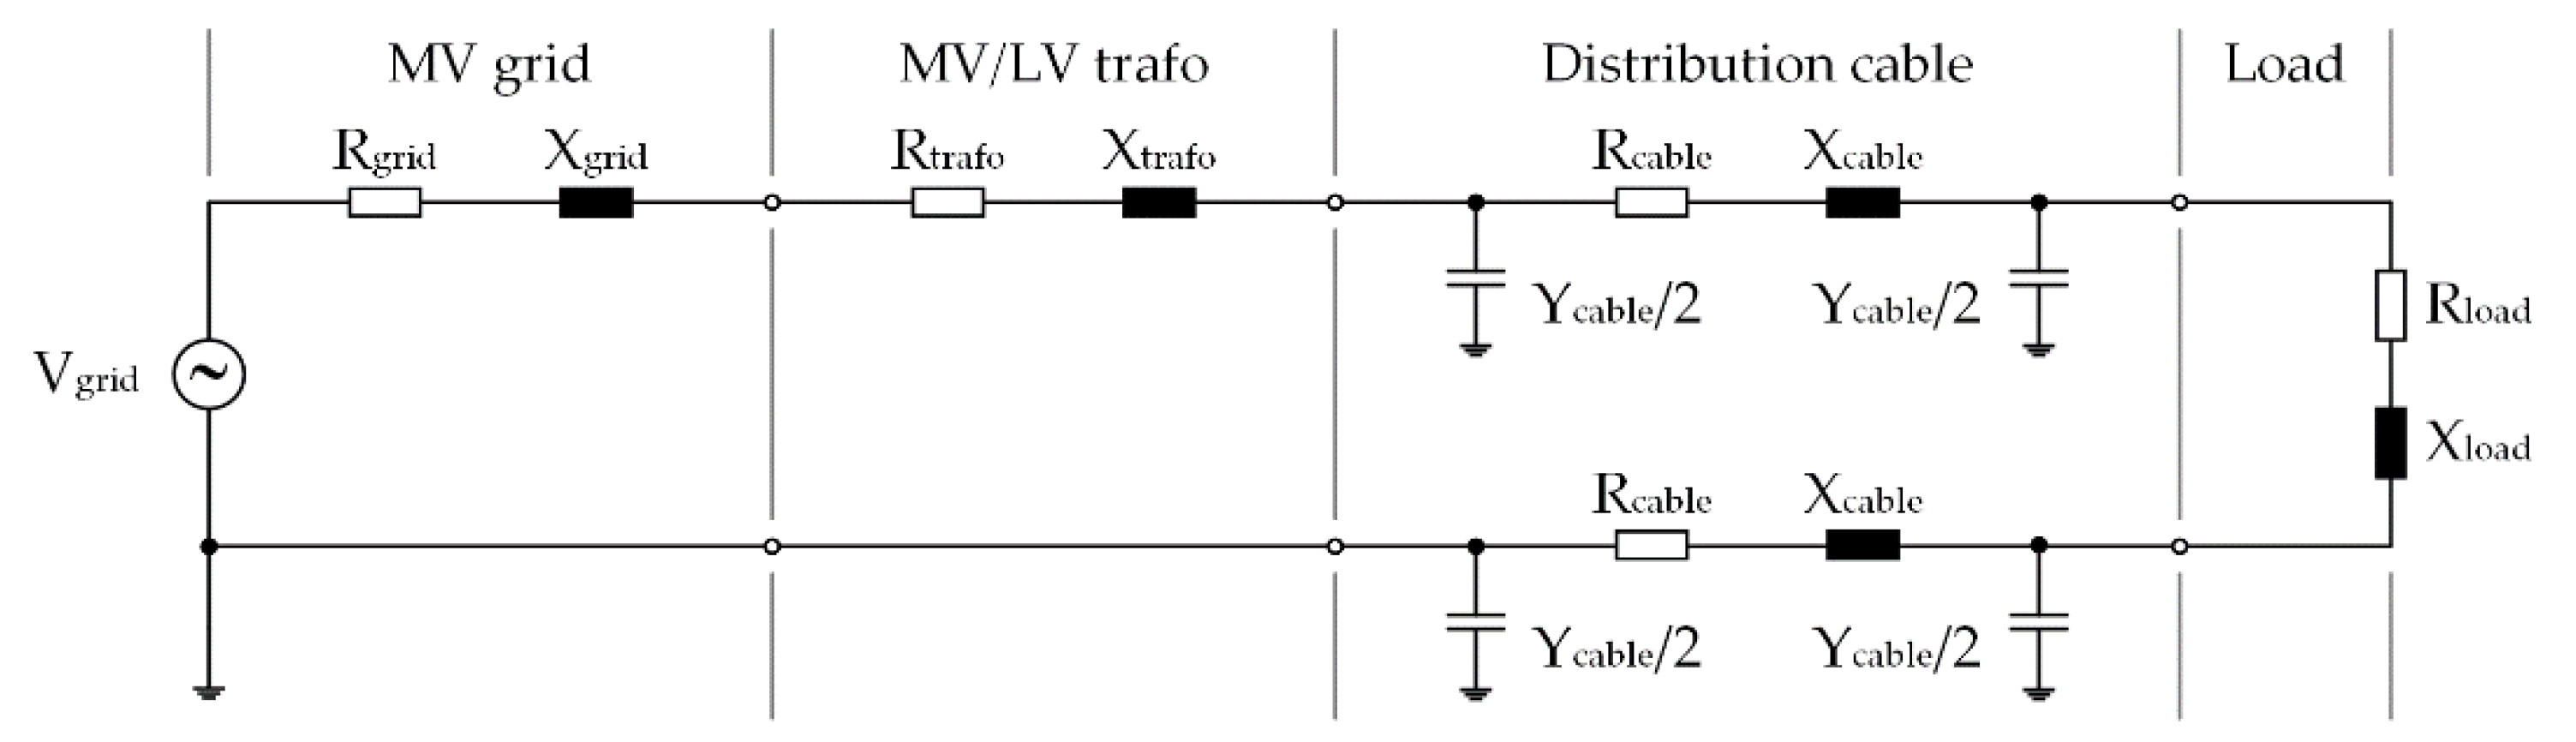
The MV grid and the MV/LV power transformer are modeled as a Thévenin equivalent circuit, i.e., an ideal voltage source behind an equivalent impedance, the distribution cables are modeled as a π-model equivalent and the loads are modeled as a load-equivalent impedance. Modeling of all this equipment is illustrated in Figure 2, with the mention that all distribution cables have four identical wires, of which three are for phases and one is neutral. The ideal voltage source, labeled Vgrid, has the same voltage as the LV network in no-load conditions.
Equivalent resistance and reactance of the MV grid are calculated in Equations (9) and (10) using the short circuit ratio (SCR) and the X/R ratio, which is a typical approach for such calculations in other similar studies [3,29].
The base impedance Zbase is expressed in Equation (11), where Strafo and Vtrafo are the rated apparent power and the secondary line voltage, respectively, of the MV/LV transformer.
Equivalent resistance and reactance of the MV/LV transformer are calculated in Equations (12) and (13) using its copper losses PCu and short-circuit percent impedance zsc% [29,30].
The relevant electrical parameters of the MV/LV transformer considered in this paper are given in Table 2.
For MV grid modeling, in this study, SCR = 10, X/R ratio = 3 and Vgrid = 242.5 V, as it is assumed that the MV/LV transformer has the tap changers set to +5%, which is a typical tap setting for rural distribution transformers.
The equivalent cable parameters, namely, resistance Rcable, reactance Xcable and admittance Ycable, are calculated using the parameters given in Table 3, with each cable labeled based on the name of the distribution boxes it connects, except for the first cable, which connects the MV/LV transformer to the first distribution box of the LV feeder, and is labeled MV/LV trafo-Box1.
The equivalent load parameters, namely, resistance Rload and reactance Xload, are calculated and adjusted during the simulation according to the consumed power by each load in each phase.
3.3. Consumption Profiles of Loads
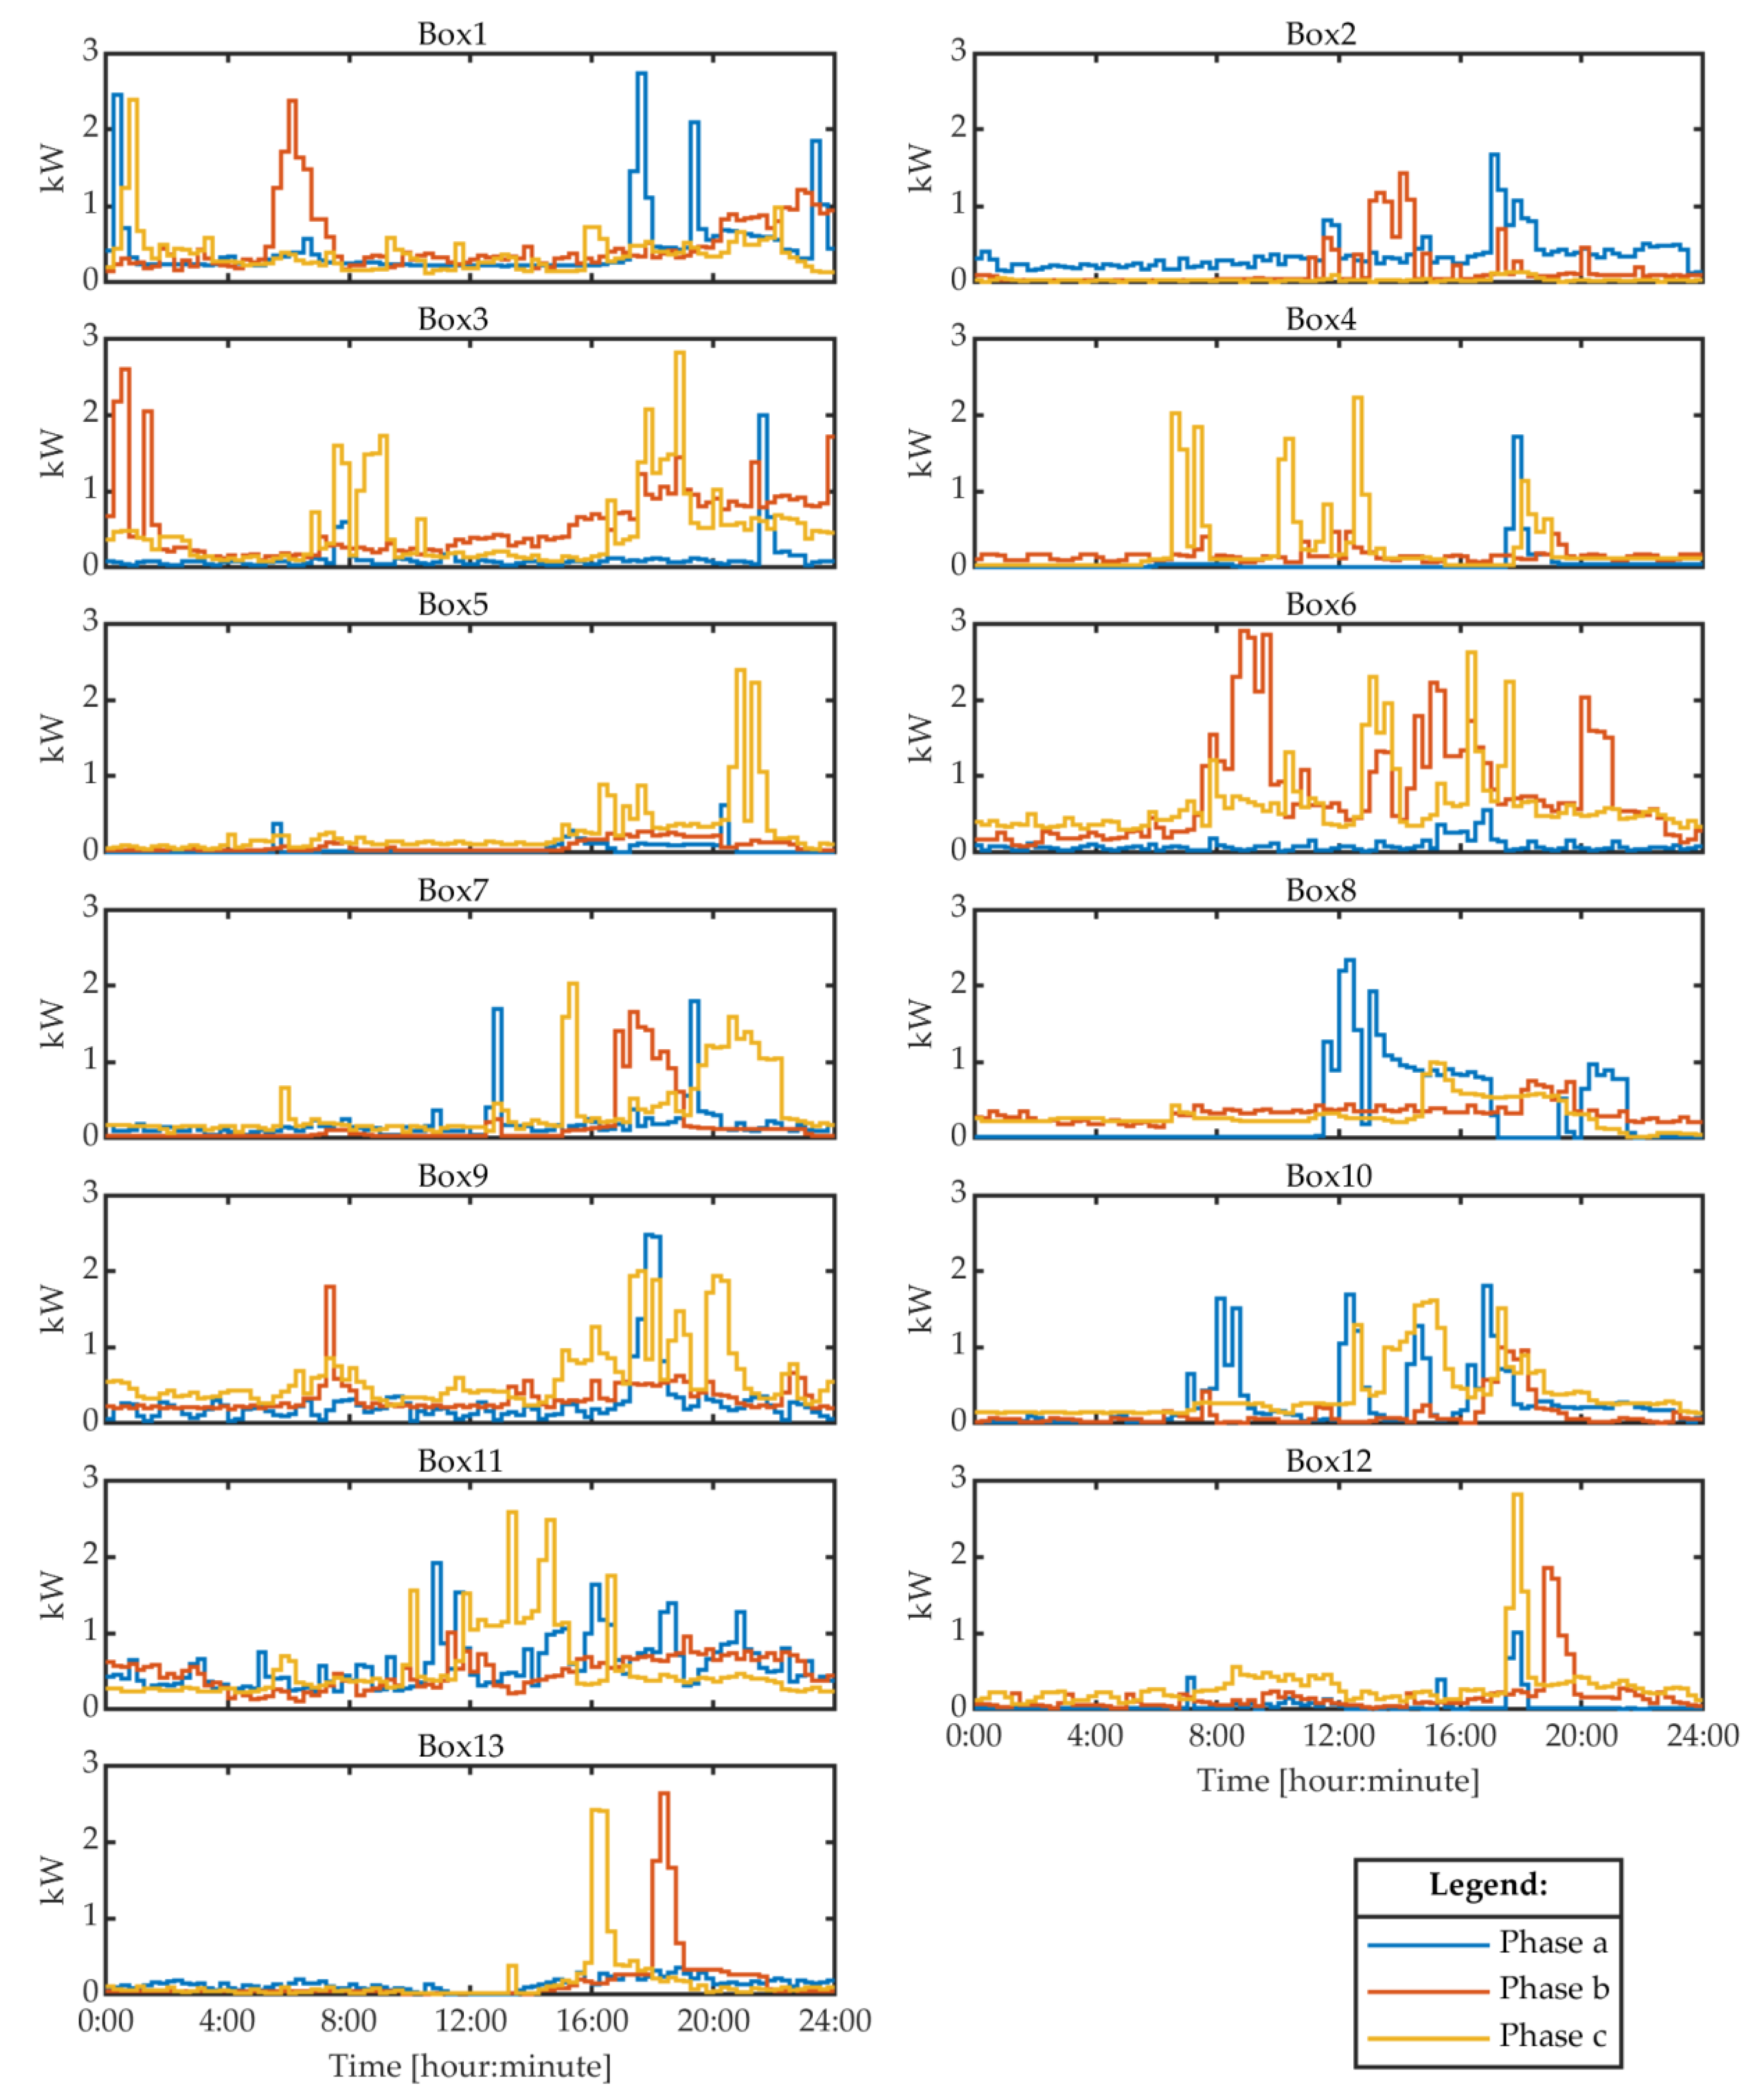
Figure 3 presents the 24 h aggregate load profiles and, more specifically, the active power profiles, for each distribution box of the LV network shown in Figure 1 for data set 1. As mentioned in previous sections, the load profiles have been acquired by smart meters and are stored in their internal memory on a 15 min average interval. Consequently, there are 4 samples per hour, and 96 samples for the entire 24 h profile duration. All loads are residential and therefore characterized by an almost unitary power factor, so their reactive power exchange with the grid is not significant. The reactive power of each load is still considered in this power quality study, but the reactive power load profiles are not shown in this paper.
The load profiles of the other three data sets are also not shown in this paper, as they can easily be determined using Table 1.
4. Results
4.1. Phase Imbalance Indicators
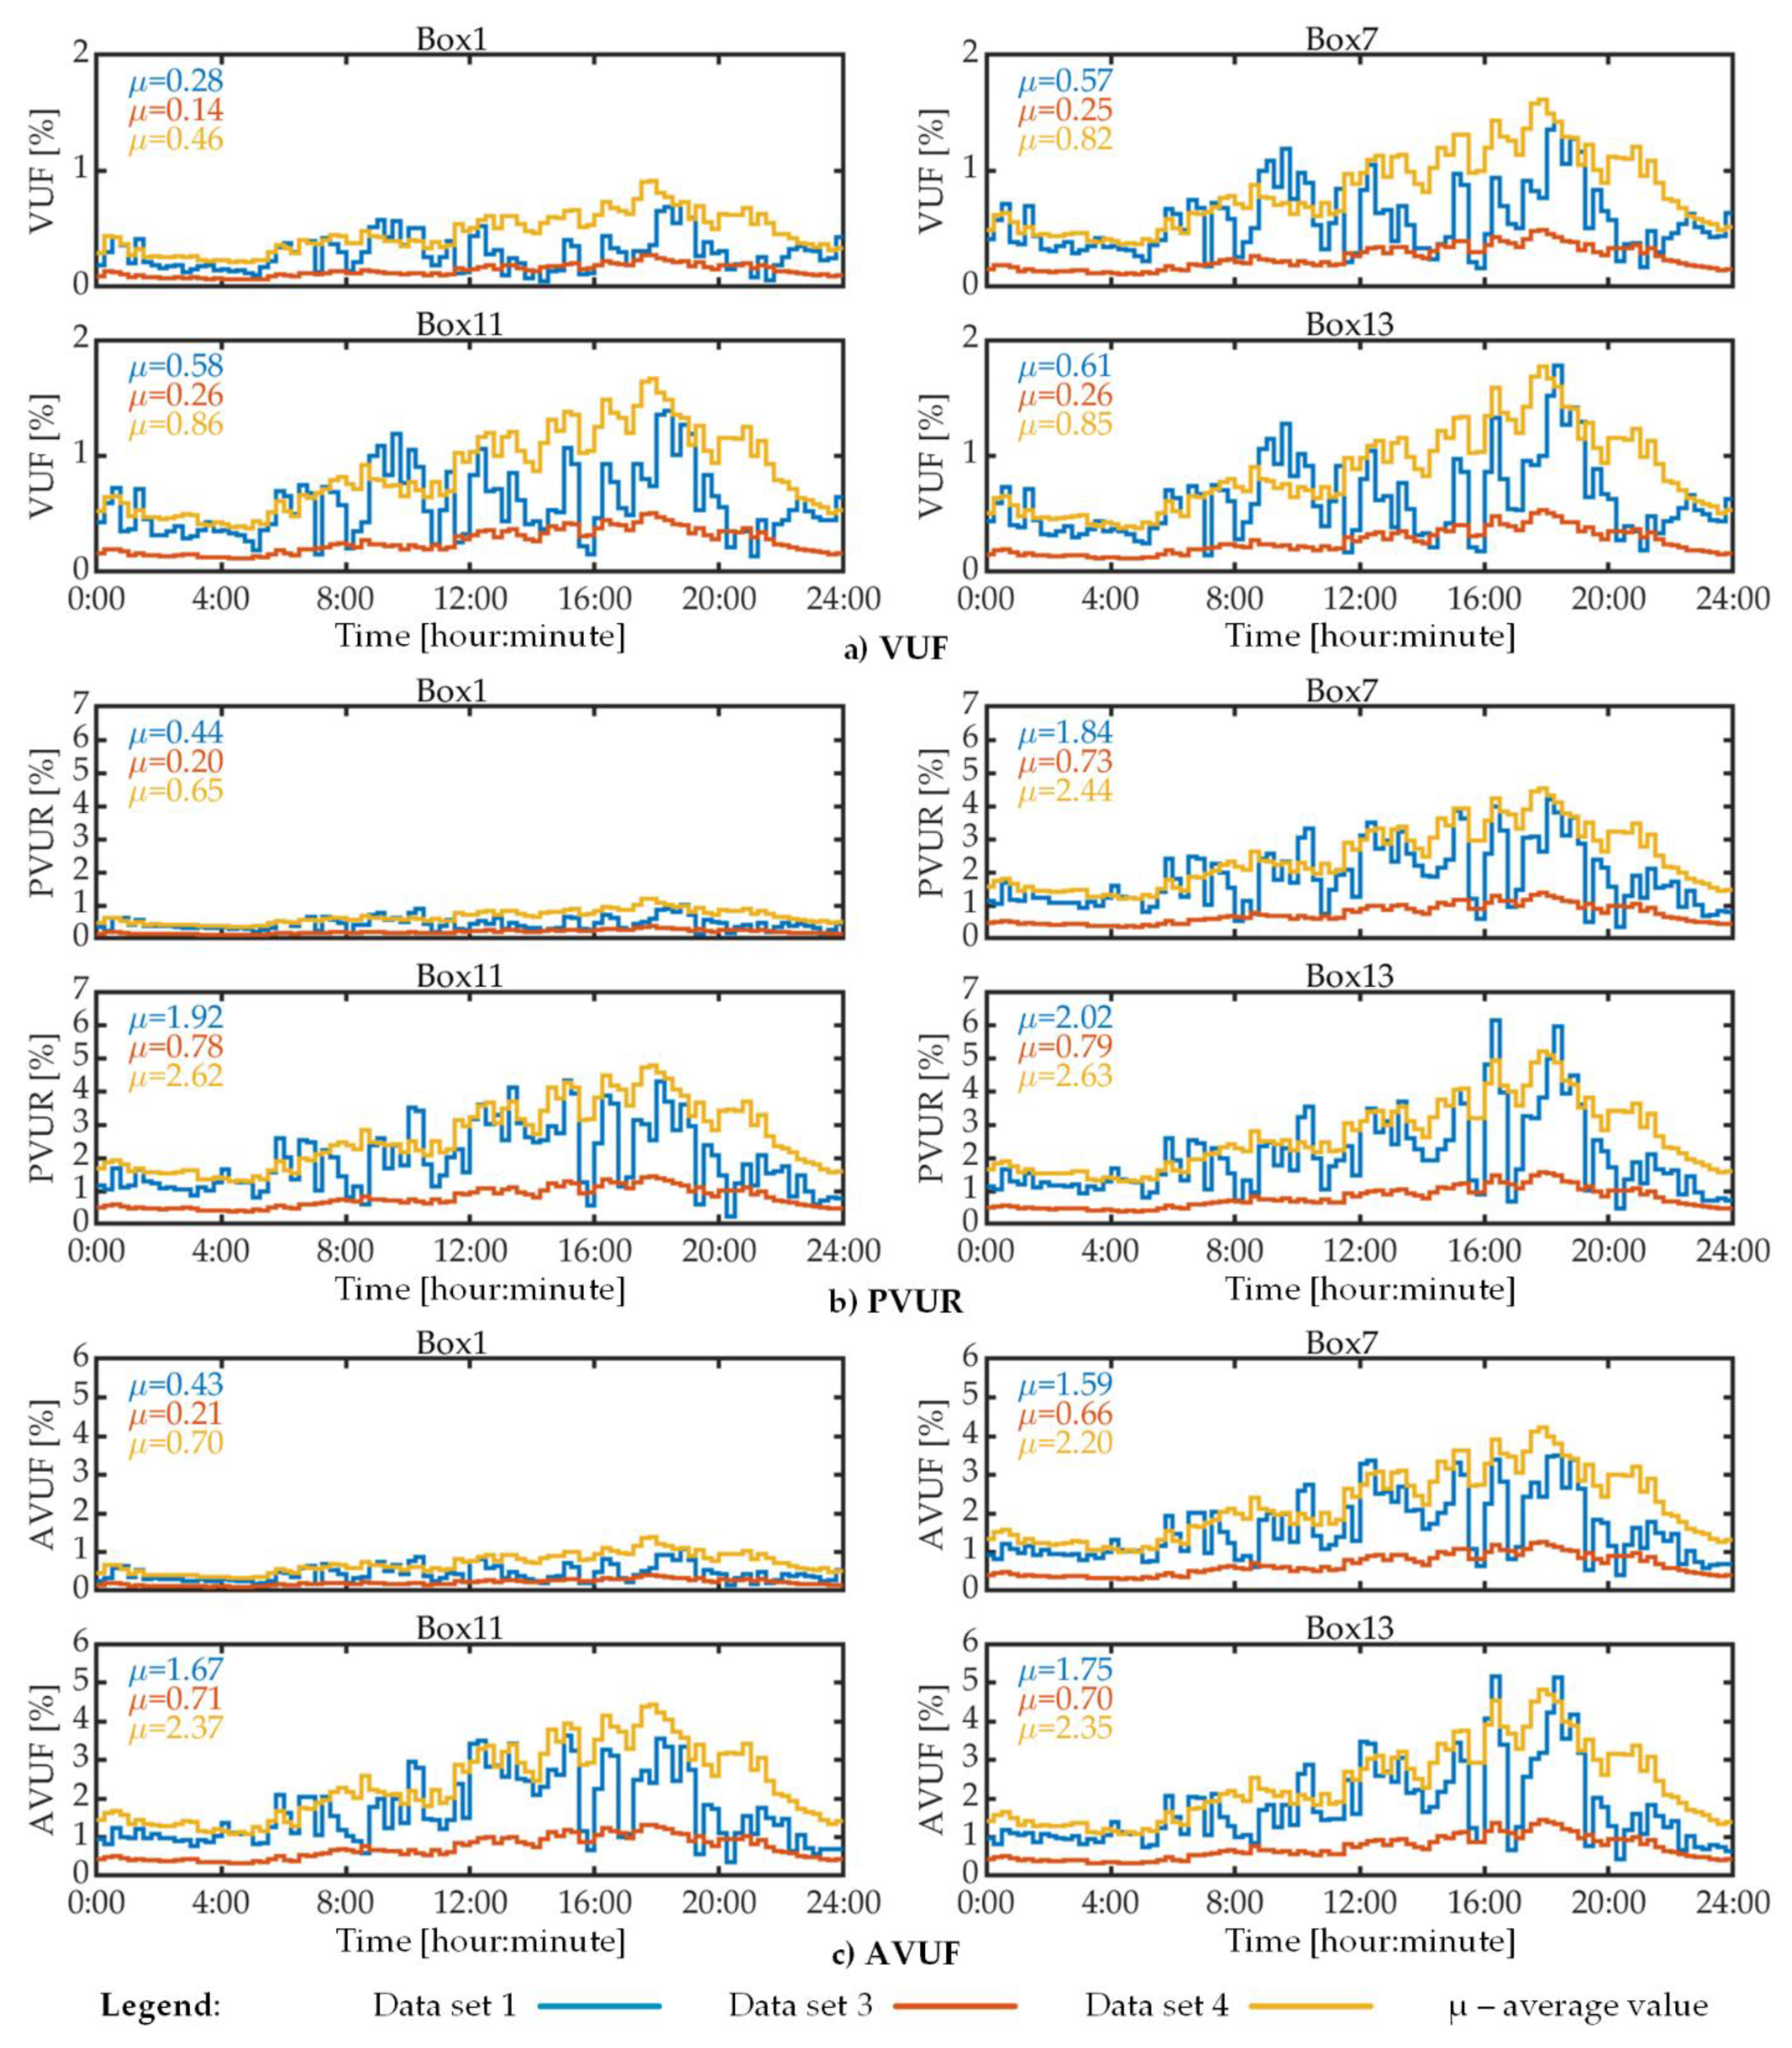
Figure 4 presents the VUF, PVUR and AVUF for four distribution boxes of the LV network. All these indicators are zero for data set 2 because in this case, all loads are balanced, so Figure 4 shows results only for the other three data sets. Figure 4 shows both the 24 h profiles of the mentioned voltage imbalance indicators and their 24 h average value, denoted by µ. The distribution boxes under observation have been selected so that they are spread over the entire length of the distribution feeder.
Given that data set 1 comprises the real load measurements, it can be argued based on the results shown in Figure 4 that, using data set 3 and data set 4, the voltage imbalance level is underestimated and overestimated, respectively. However, two other important observations can be made by analyzing the voltage imbalance results of this study. The first observation is that the load data have the least impact on VUF and the highest impact on PVUR. In fact, regardless of the data set used, the VUF is always less than 2%, while PVUR and AVUF exceed the 2% limit quite a lot, but only for data sets 1 and 4. The second observation is that load data have a higher impact on the distribution boxes that are further away from the distribution transformer. For example, the difference between the average AVUF of data set 1 and the average AVUF of data set 3 is 0.22% for distribution box 1 and 1.05% for distribution box 13. The same is true for the other voltage imbalance indicators and for the other data sets.
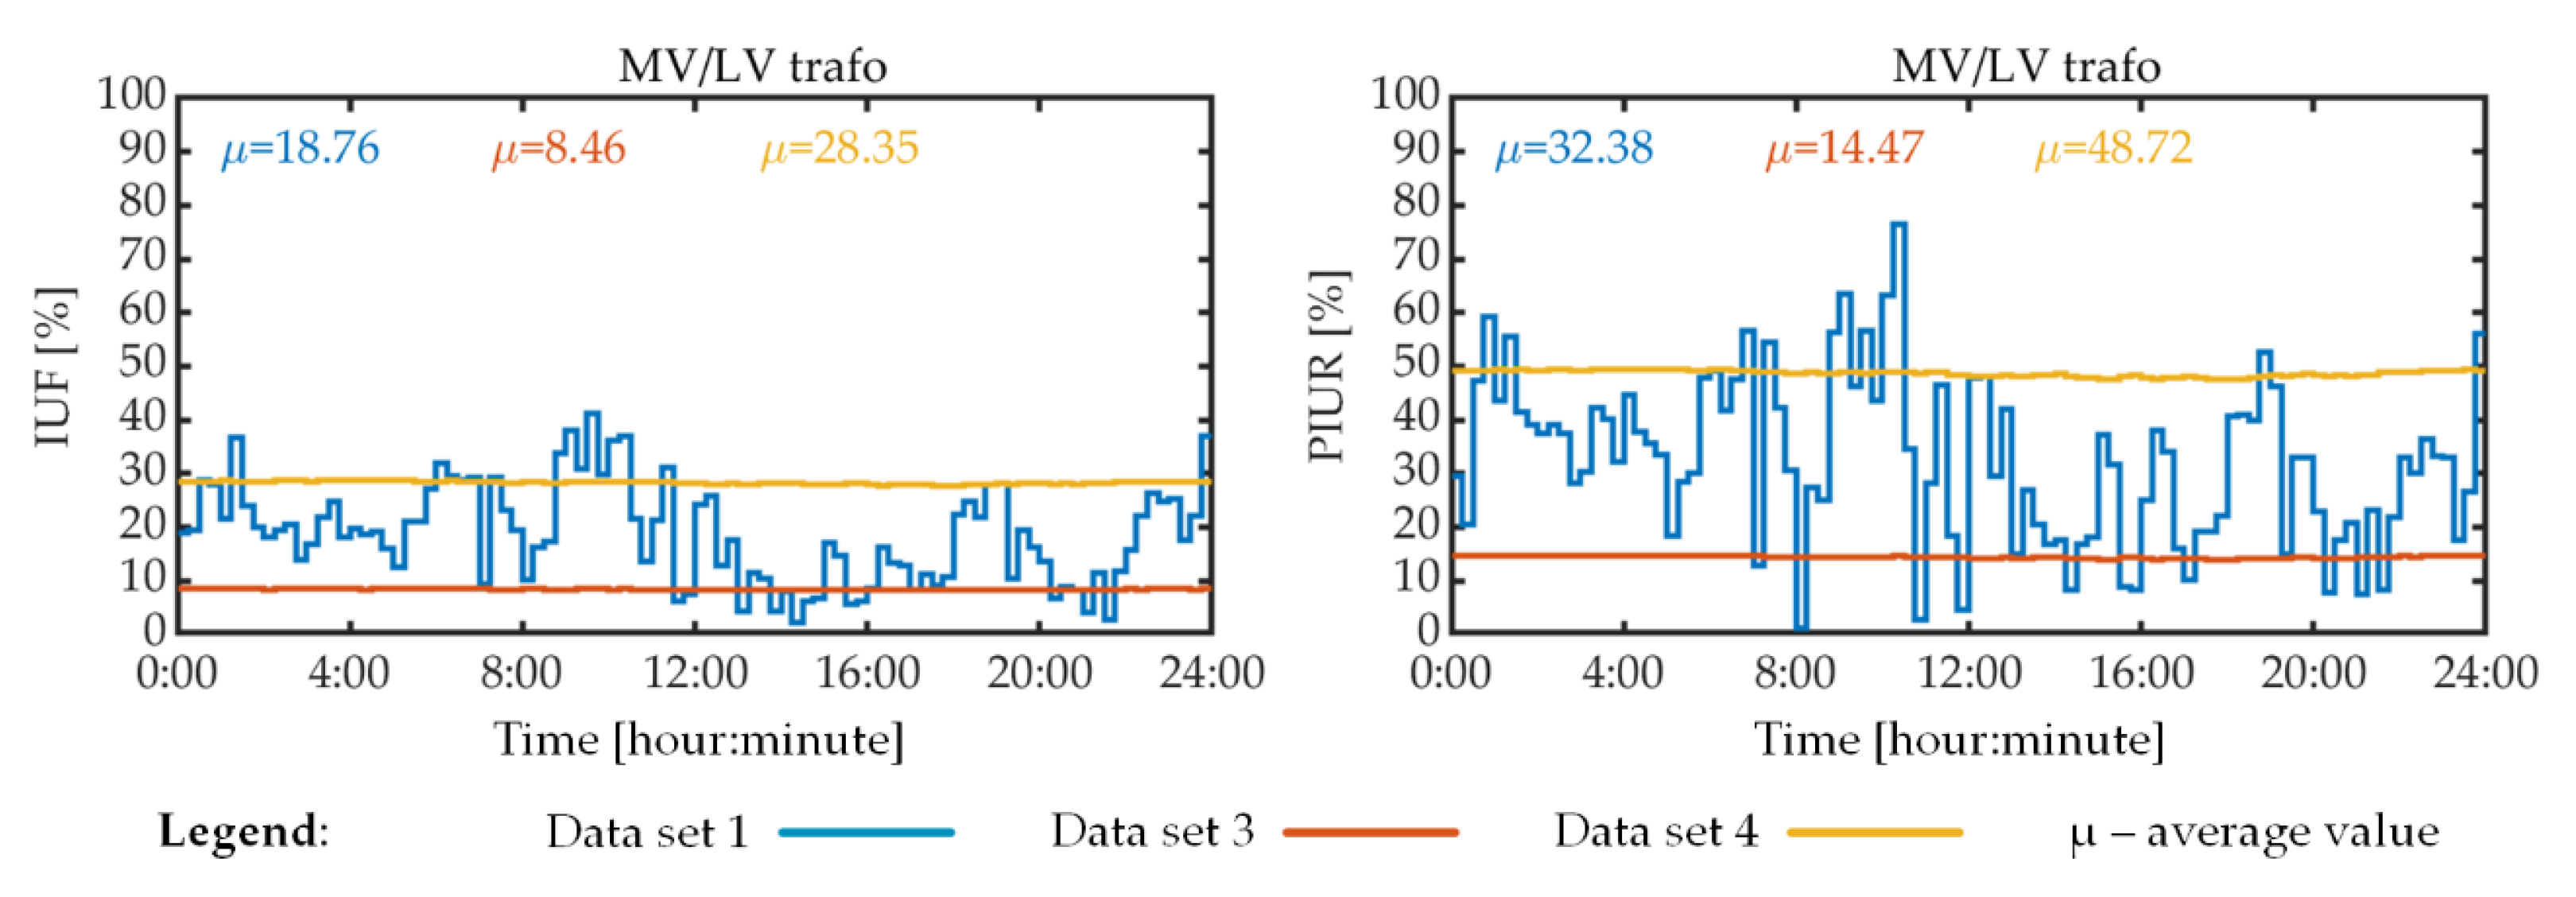
Figure 5 presents the IUF and PIUR, computed using the current through the MV/LV transformer for data sets 1, 3 and 4. Figure 5 shows both the 24 h profiles of these current indicators and their 24 h average value, denoted by µ. It was chosen to show the magnitudes of the IUF and PIUR for the MV/LV transformer because this is the most sensitive distribution equipment to current imbalances, so DSOs are more interested in it for the calculation of current imbalance indicators.
Examination of the results shown in Figure 5 reveals that the IUF and PIUR vary greatly over time for data set 1, but not for data sets 3 and 4. Furthermore, there is a significant difference between the average IUF or average PIUR computed for data set 1 and the same indicators computed for data sets 3 and 4. These results suggest that the load imbalance assumptions corresponding to data sets 3 and 4 do not provide an accurate estimation of the current imbalance indicators when the load profiles are as in data set 1. The relative lack of variability of IUF and PIUR for data sets 3 and 4 is explained by the constant phase-loading ratios of consumers, as seen in Table 1.
4.2. Voltage Quality Indicators
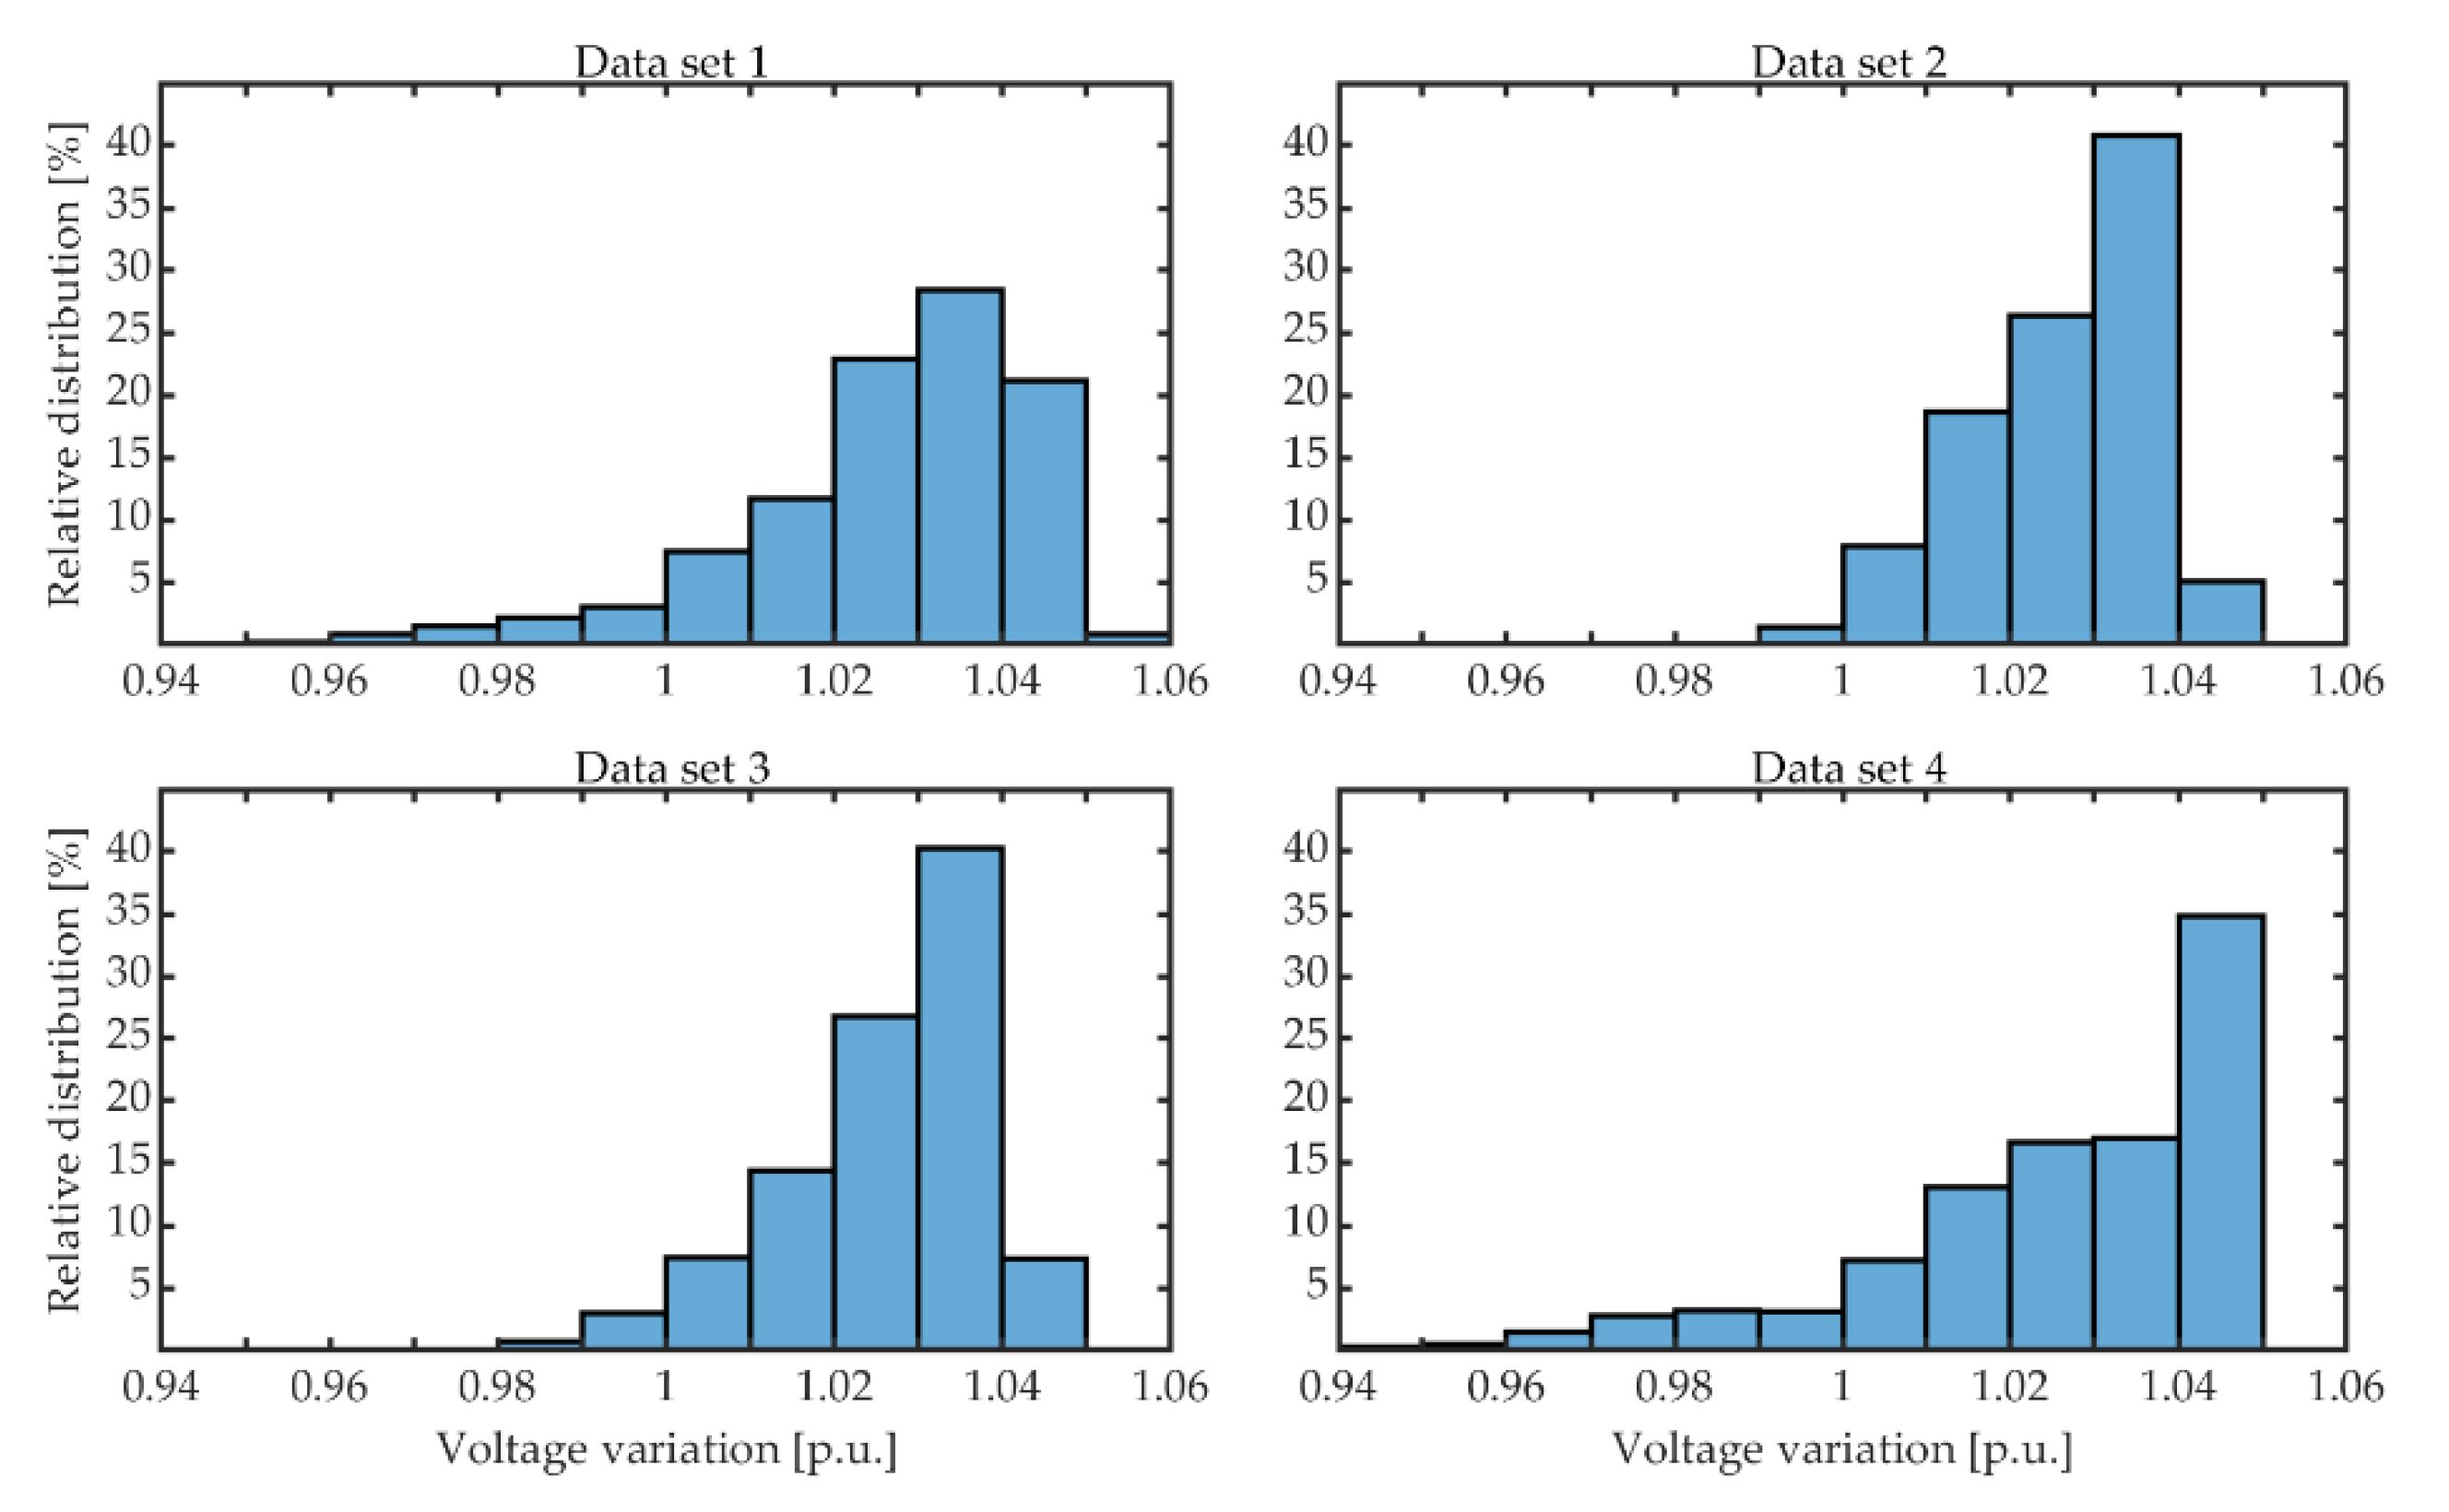
Figure 6 presents the relative distribution of phase-to-neutral voltage magnitude for the 23 loads of the considered LV distribution network for each set of load data. As can be seen in this figure, the relative distribution of voltage bins depends on the load data that are used. For example, the voltage variation is smaller for data set 2, i.e., when the loads are balanced, and for data set 3, whose relative distribution is not much different from that of data set 2. In comparison, the voltage varies more widely for data sets 1 and 4, as there are more voltage bins for these two sets of load data.
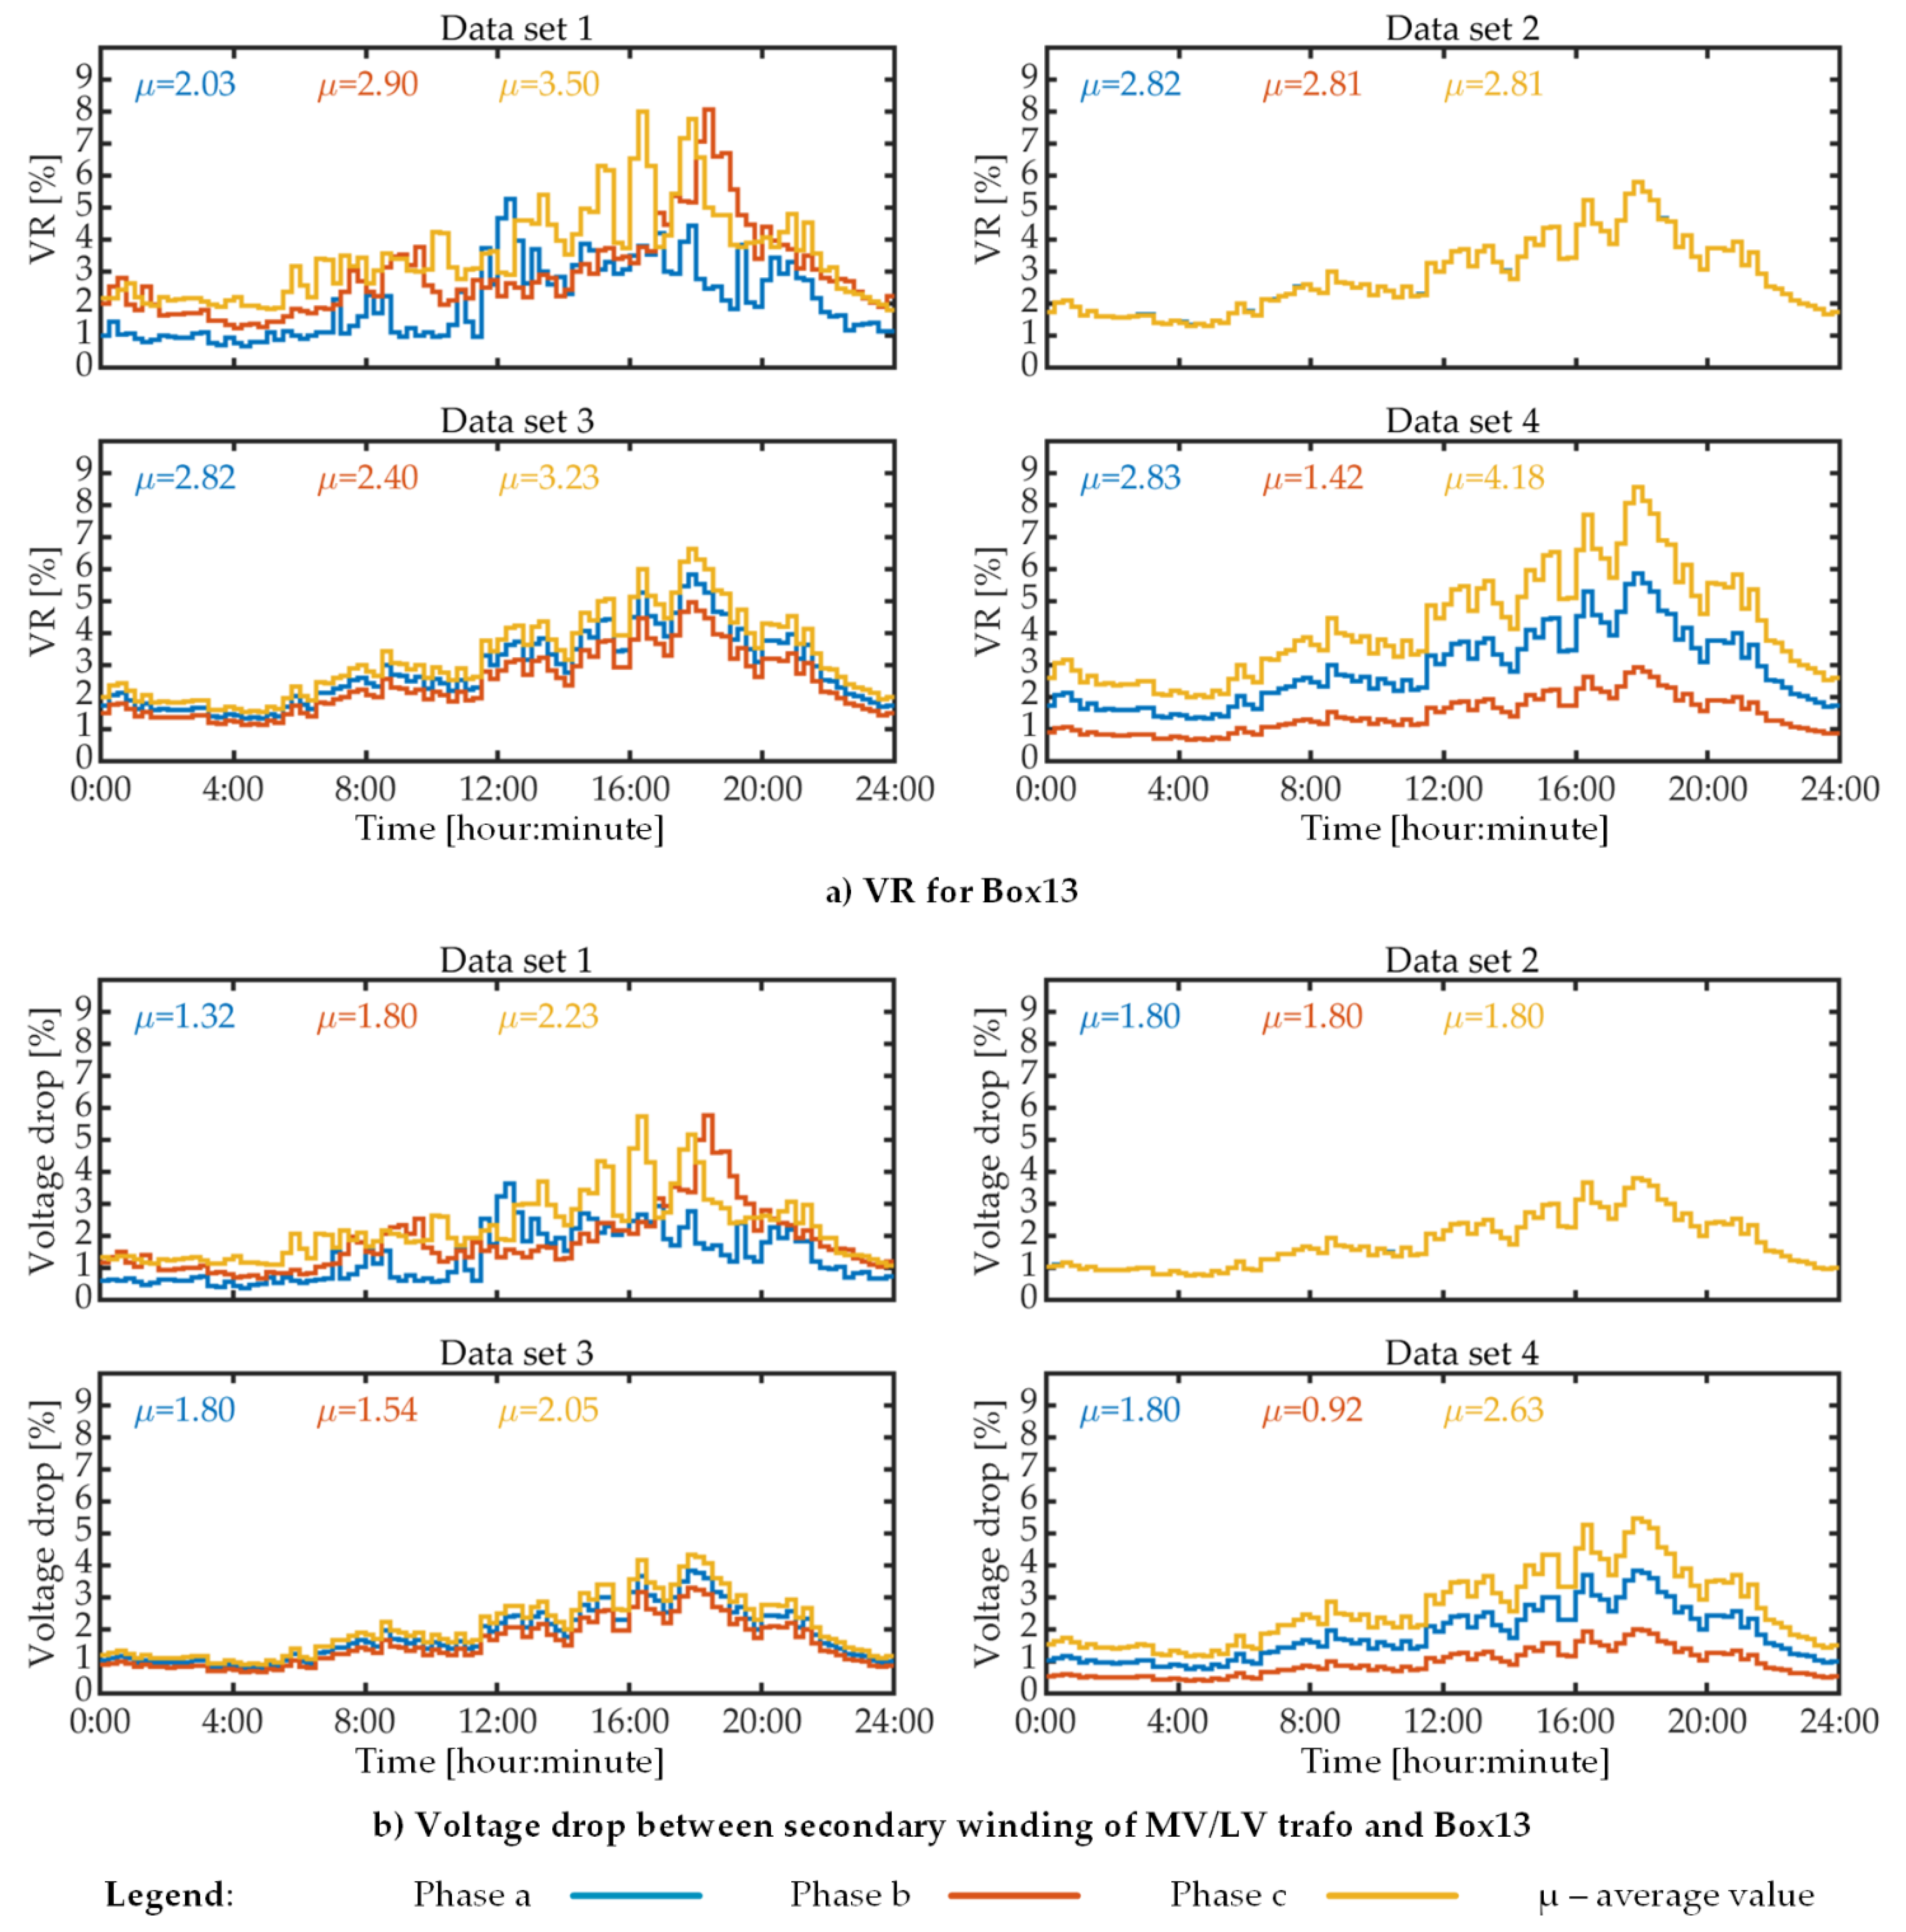
Another interesting result is represented by the comparison of the lowest voltage bin for each data set, which is 0.95–0.96 p.u. for data set 1, 0.99–1.00 p.u. for data set 2, 0.98–0.99 for data set 3 and 0.94–0.95 for data set 4. This result shows that inadequate load imbalance assumptions could lead to inaccurate estimates regarding the minimum voltage magnitude, especially at the end of LV feeders. This conclusion is also supported by observations on VR and voltage drops for distribution box 13, which are shown in Figure 7.
DSOs are mainly interested by the phase with the highest VR and voltage drop, and the results show that data set 2, namely, the assumption of balanced loads, provides the worst estimation of such indicators, at least when the mean values are examined. Data set 3 provide the closest results to data set 1 in terms of the highest average VR and highest average voltage drop, while data set 4 provides the closest result to data set 1 in terms of maximum instantaneous VR and maximum instantaneous voltage drop. However, the main takeaway conclusion of these results is that the load data have a big influence on the results of voltage quality studies. For example, by not using the real load data, i.e., data set 1, such studies may not reveal that the instantaneous voltage drops in phase b and phase c are around 6% for distribution box 13, thus possibly exceeding at this location the limits imposed by regulations.
The values of VR and voltage drop are the maximum for distribution box 13, as this is the furthest distribution box from the MV/LV transformer, so the values of these voltage quality indicators will not be shown for other locations of the LV network.
5. Conclusions
This paper investigated the influence of load data on power quality studies, with a focus on load imbalance level and voltage quality for LV networks. It has been shown that load imbalance has a significant influence on the correct estimation of some power quality indicators, such as the VUF, IUF, PVUR, PIUR, AVUF, VR and voltage drop. The differences between the estimated and actual values of these indicators could be significant in some cases, especially in networks that are more sensitive to power fluctuations, such as weak grids or towards the end of LV feeders. The work was possible due to the availability of real load data provided by the smart meters of an LV network, which allowed the comparison between the results corresponding to the real load data and the results corresponding to the data generated based on certain load imbalance assumptions. The paper was not intended to establish the most appropriate hypothesis regarding the load imbalance for power quality studies, but rather to compare the results of such studies obtained using the load imbalance hypotheses that already exist in the literature.
Ultimately, it can be concluded that it is difficult to approximate the actual load profiles in rural LV feeders in a way that this approximation does not affect the correctness of the phase imbalance and voltage quality indicators estimation. This difficulty lies in the fact that the load patterns are random and unpredictable in such networks, especially if the total number of consumers is relatively small. Consequently, the DSOs and planning engineers should be careful when making assumptions about the electricity load profiles for power quality studies. In this regard, the results of this study show that the assumption that three-phase loads are balanced or slightly unbalanced is not always appropriate and that a better practice is rather to assume that loads are highly unbalanced, e.g., two of the phases are twice or three times as loaded as the other phase, as has been assumed for data set 4. However, real load data should always be used when available to obtain the most accurate results in a power quality study.
Author Contributions
Conceptualization, C.I.C.; methodology, C.I.C.; software, C.I.C.; validation, C.I.C.; formal analysis, C.I.C.; investigation, C.I.C.; resources, C.I.C. and F.I.; data curation, C.I.C.; writing—original draft preparation C.I.C.; writing—review and editing, C.I.C. and F.I.; visualization, C.I.C.; supervision, F.I.; project administration, F.I.; funding acquisition, F.I. All authors have read and agreed to the published version of the manuscript.
Funding
This research was funded by the European Union’s Horizon 2020 research and innovation program under grant agreement No. 774145 for the Net2DG project.
Institutional Review Board Statement
Not applicable.
Informed Consent Statement
Not applicable.
Data Availability Statement
Not applicable.
Acknowledgments
The authors would like to thank for the support received from the Danish utility company Thy-Mors Energi.
Conflicts of Interest
The authors declare no conflict of interest.
References
- Carvalho, P.M.S.; Ferreira, L.A.F.M.; Santana, J.J.E.; Dias, A.M.F. Combined effects of load variability and phase imbalance onto simulated LV losses. IEEE Trans. Power Syst. 2018, 33, 7031–7041. [Google Scholar] [CrossRef]
- Peralta, J.; de Leon, F.; Mahseredjian, J. Assessment of errors introduced by common assumptions made in power system studies. In Proceedings of the IEEE Power and Energy Society General Meeting, Detroit, MI, USA, 24–28 July 2011. [Google Scholar]
- Ciontea, C.; Sera, D.; Iov, F. Influence of resolution of the input data on distributed generation integration studies. In Proceedings of the 14th International Conference on Optimization of Electrical and Electronic Equipment, Brasov, Romania, 22–24 May 2014. [Google Scholar]
- Lucas, A. Single-phase PV power injection limit due to voltage unbalances applied to an urban reference network using real-time simulation. Appl. Sci. 2018, 8, 1333. [Google Scholar] [CrossRef] [Green Version]
- Shahnia, F.; Majumder, R.; Ghosh, A.; Ledwich, G.; Zare, F. Voltage imbalance analysis in residential low voltage distribution networks with rooftop PVs. Electr. Power Syst. Res. 2011, 81, 1805–1814. [Google Scholar] [CrossRef]
- Ochoa, L.F.; Ciric, R.M.; Padilha-Feltrin, A.; Harrison, G.P. Evaluation of distribution system losses due to load unbalance. In Proceedings of the 15th Power Systems Computation Conference, Liege, Belgium, 22–26 August 2005. [Google Scholar]
- Yan, R.; Saha, T.K. Investigation of voltage imbalance due to distribution network unbalanced line configurations and load levels. IEEE Trans. Power Syst. 2013, 28, 1829–1838. [Google Scholar] [CrossRef]
- Valois, P.V.S.; Tahan, C.M.V.; Kagan, N.; Arango, H. Voltage unbalance in low voltage distribution networks. In Proceedings of the 16th International Conference and Exhibition on Electricity Distribution, Part 1: Contributions. CIRED (IEE Conf. Publ. No. 482), Amsterdam, The Netherlands, 18–21 June 2001. [Google Scholar]
- Meyer, J.; Möller, F.; Perera, S.; Elphick, S. General definition of unbalanced power to calculate and assess unbalance of customer installations. In Proceedings of the 2019 Electric Power Quality and Supply Reliability Conference (PQ) & 2019 Symposium on Electrical Engineering and Mechatronics (SEEM), Kärdla, Estonia, 12–15 June 2019. [Google Scholar]
- Tavakoli, B.M.; Kashefi, A. Three-phase unbalance of distribution systems: Complementary analysis and experimental case study. Electr. Power Energy Syst. 2011, 33, 817–826. [Google Scholar]
- Ciontea, C.I.; Bak, C.L.; Blaabjerg, F.; Madsen, K.K.; Sterregaard, C.H. Fault analysis for protection purposes in maritime applications. In Proceedings of the 13th IET International Conference on Developments in Power System Protection (DPSP), Edinburgh, UK, 7–10 March 2016. [Google Scholar]
- Arghavani, H.; Peyravi, M. Unbalanced current-based tariff. In Proceedings of the 24th International Conference & Exhibition n Electricity Distribution (CIRED), Glasgow, UK, 12–15 June 2017. [Google Scholar]
- Ma, K.; Fang, L.; Kong, W. Review of distribution network phase imbalance: Scale, causes, consequences, solutions, and future research directions. CSEE J. Power Energy Syst. 2020, 6, 479–488. [Google Scholar]
- Klonari, V.; Lobry, J.; Vallée, F.; Meersman, B.; Bozalakov, D.; Vandoorn, T.L. Long term assessment of a voltage unbalance mitigation scheme implemented by photovoltaic inverters. In Proceedings of the IEEE International Energy Conference (ENERGYCON), Leuven, Belgium, 4–8 April 2016. [Google Scholar]
- Ciontea, C.I. The use of symmetrical components in electrical protection. In Proceedings of the 72nd Conference for Protective Relay Engineers (CPRE), College Station, TX, USA, 25–28 March 2019. [Google Scholar]
- Fang, L.; Ma, K.; Li, R.; Wang, Z. A statistical approach to estimate imbalance-induced energy losses for data-scarce low voltage networks. IEEE Trans. Power Syst. 2019, 34, 2825–2835. [Google Scholar] [CrossRef]
- Shigenobu, R.; Nakadomari, A.; Hong, Y.Y.; Mandal, P.; Takahashi, H.; Senjyu, T. Optimization of voltage unbalance compensation by smart inverter. Energies 2020, 13, 8. [Google Scholar] [CrossRef]
- Anwari, M.; Hiendro, A. New unbalance factor for estimating performance of a three-phase induction motor with under- and overvoltage unbalance. IEEE Trans. Energy Convers. 2010, 25, 619–625. [Google Scholar] [CrossRef]
- Ruiz-Rodriguez, F.J.; Hernández, J.C.; Jurado, F. Voltage unbalance assessment in secondary radial distribution networks with single-phase photovoltaic systems. Electr. Power Energy Syst. 2015, 64, 646–654. [Google Scholar] [CrossRef]
- Fristot, P.; Constant, O.; Moncet, C. 3-phase low voltage network load balancer: A cost effective solution to line voltage variations. In Proceedings of the in 23rd International Conference on Electricity Distribution (CIRED 2015), Lyon, France, 15–18 June 2015. [Google Scholar]
- Bajo, C.G.; Hashemi, S.; Kjær, S.B.; Yang, G.; Østergaard, J. Voltage unbalance mitigation in LV networks using three-phase PV systems. In Proceedings of the IEEE International Conference on Industrial Technology (ICIT), Seville, Spain, 17–19 March 2015. [Google Scholar]
- Girigoudar, K.; Molzahn, D.K.; Roald, L.A. On the relationships among different voltage unbalance definitions. In Proceedings of the 2019 North American Power Symposium (NAPS), Wichita, KS, USA, 13–15 October 2019. [Google Scholar]
- IEC. IEC 61000-3-14: Assessment of Emission Limits for Harmonics, Interharmonics, Voltage Fluctuations and Unbalance for the Connection of Disturbing Installations to LV Power Systems; IEC: Geneva, Switzerland, 2011. [Google Scholar]
- IEEE. IEEE Standard 141-1993: Recommended Practice for Electric Power Distribution for Industrial Plants; IEEE: New York, NY, USA, 1994. [Google Scholar]
- CENELEC. EN 50160-2010: Voltage Characteristics of Electricity Supplied by Public Electricity Networks; CENELEC: Brussels, Belgium, 2010. [Google Scholar]
- ANSI. C84.1: Electric Power Systems and Equipment—Voltage Ratings (60 Hz); ANSI: Rosslyn, VA, USA, 2016. [Google Scholar]
- Todorovski, M. Transformer Voltage Regulation—Compact expression dependent on tap position and primary/secondary voltage. IEEE Trans. Power Deliv. 2014, 29, 1516–1517. [Google Scholar] [CrossRef]
- Lee, J.; Kim, G.H. Comparison analysis of the voltage variation ranges for distribution networks. In Proceedings of the IEEE International Conference on Environment and Electrical Engineering (EEEIC), Milan, Italy, 6–9 June 2017. [Google Scholar]
- Saadat, H. Power System Analysis, 2nd ed.; McGraw Hill: New York, NY, USA, 2004. [Google Scholar]
- Kasikci, I. Short Circuits in Power Systems. A Practical Guide to IEC60909; Wiley-VCH: Weinheim, Germany, 2002. [Google Scholar]
Figure 1.
Single-line diagram of exemplary low voltage (LV) distribution network, supplied from the medium voltage (MV) grid.
Figure 1.
Single-line diagram of exemplary low voltage (LV) distribution network, supplied from the medium voltage (MV) grid.

Figure 2.
Modeling of electrical equipment of exemplary LV distribution network.

Figure 3.
Twenty four-hour aggregated load profiles (active power) of data set 1.

Figure 4.
Voltage imbalance indicators, 24 h profile results.

Figure 5.
Current imbalance indicators, 24 h profile results.

Figure 6.
Phase-to-neutral voltage magnitude variation for the entire LV network.

Figure 7.
Voltage regulation (VR) and voltage drop, 24 h profile results.


Table 1.
Load data sets.
| Data Set | Phase A | Phase B | Phase C | Total Power | Nature of Loads |
|---|---|---|---|---|---|
| 1 | Pa | Pb | Pc | Pa + Pb + Pc = 3P | real loads |
| 2 | P | P | P | 3P | balanced loads |
| 3 | P | 0.85·P | 1.15·P | 3P | unbalanced loads |
| 4 | P | 0.50·P | 1.50·P | 3P | unbalanced loads |
Note: Loading is variable in time for each data set, even though for data sets 2, 3 and 4, the relations between phase-loadings are constant in time.
Table 2.
Electrical parameters of the MV/LV transformer [3].
Table 2.
Electrical parameters of the MV/LV transformer [3].
| Prim. Voltage [kV] | Sec. Voltage [kV] | Strafo [kVA] | PCu [kW] | zsc% [%] |
|---|---|---|---|---|
| 10 | 0.4 | 100 | 3.25 | 4 |
Table 3.
Main parameters of electric cables.
| Cable | Type | R [Ω/km] | X [Ω/km] | Y [S/km] | Length [km] |
|---|---|---|---|---|---|
| MV/LV trafo–Box1 | 4xAl150 | 0.2075 | 0.072 | 4897.1 | 0.081 |
| Box1–Box2 | 4xAl150 | 0.2075 | 0.072 | 4897.1 | 0.079 |
| Box2–Box3 | 4xAl150 | 0.2075 | 0.072 | 4897.1 | 0.183 |
| Box3–Box4 | 4xAl95 | 0.3208 | 0.075 | 5684.1 | 0.262 |
| Box4–Box5 | 4xAl95 | 0.3208 | 0.075 | 5684.1 | 0.143 |
| Box5–Box6 | 4xAl95 | 0.3208 | 0.075 | 5684.1 | 0.202 |
| Box6–Box7 | 4xAl95 | 0.3208 | 0.075 | 5684.1 | 0.120 |
| Box6–Box8 | 4xAl95 | 0.3208 | 0.075 | 5684.1 | 0.161 |
| Box8–Box9 | 4xAl95 | 0.3208 | 0.075 | 5684.1 | 0.062 |
| Box7–Box10 | 4xAl50 | 0.6417 | 0.079 | 6366.2 | 0.117 |
| Box10–Box11 | 4xAl50 | 0.6417 | 0.079 | 6366.2 | 0.060 |
| Box7–Box12 | 4xAl50 | 0.6417 | 0.079 | 6366.2 | 0.259 |
| Box12–Box13 | 4xAl50 | 0.6417 | 0.079 | 6366.2 | 0.223 |
Note: X and Y are given for a 50 Hz system.
Publisher’s Note: MDPI stays neutral with regard to jurisdictional claims in published maps and institutional affiliations. |
© 2021 by the authors. Licensee MDPI, Basel, Switzerland. This article is an open access article distributed under the terms and conditions of the Creative Commons Attribution (CC BY) license (http://creativecommons.org/licenses/by/4.0/).
Share and Cite
MDPI and ACS Style
Ciontea, C.I.; Iov, F. A Study of Load Imbalance Influence on Power Quality Assessment for Distribution Networks. Electricity 2021, 2, 77-90. https://0-doi-org.brum.beds.ac.uk/10.3390/electricity2010005
AMA Style
Ciontea CI, Iov F. A Study of Load Imbalance Influence on Power Quality Assessment for Distribution Networks. Electricity. 2021; 2(1):77-90. https://0-doi-org.brum.beds.ac.uk/10.3390/electricity2010005
Chicago/Turabian StyleCiontea, Catalin Iosif, and Florin Iov. 2021. "A Study of Load Imbalance Influence on Power Quality Assessment for Distribution Networks" Electricity 2, no. 1: 77-90. https://0-doi-org.brum.beds.ac.uk/10.3390/electricity2010005