Article

Optimized Strategic Planning of Future Norwegian Low-Voltage Networks with a Genetic Algorithm Applying Empirical Electric Vehicle Charging Data

1
Institute of Power Systems Engineering, University of Wuppertal, 42119 Wuppertal, Germany
2
Department of Smart Grids, Fraunhofer ISE, 79110 Freiburg, Germany
3
Department of Energy Systems, Sintef Energy Research, 7034 Trondheim, Norway
*
Author to whom correspondence should be addressed.
Submission received: 11 December 2020 / Revised: 28 January 2021 / Accepted: 23 February 2021 / Published: 16 March 2021

Abstract

:
This article outlines methods to facilitate the assessment of the impact of electric vehicle charging on distribution networks at planning stage and applies them to a case study. As network planning is becoming a more complex task, an approach to automated network planning that yields the optimal reinforcement strategy is outlined. Different reinforcement measures are weighted against each other in terms of technical feasibility and costs by applying a genetic algorithm. Traditional reinforcements as well as novel solutions including voltage regulation are considered. To account for electric vehicle charging, a method to determine the uptake in equivalent load is presented. For this, measured data of households and statistical data of electric vehicles are combined in a stochastic analysis to determine the simultaneity factors of household load including electric vehicle charging. The developed methods are applied to an exemplary case study with Norwegian low-voltage networks. Different penetration rates of electric vehicles on a development path until 2040 are considered.

1. Introduction

The planning of distribution networks is becoming an increasingly complex task. The traditional fit-and-forget approach based on worst-case assumptions does not take into account the transformation of the energy system [1] and may lead to over- or under-dimensioning of the network components in distribution networks [2]. Distributed generation (DG) and electric vehicles (EV) are significant drivers, whose influence on the power flow needs to be analyzed in studies in order to assess the potential requirements for reinforcements, ensuring a safe and reliable operation [3,4,5]. To also facilitate an economical network operation, the cost-effective reinforcement strategy is desired. Due to the complexity, such network studies can only be performed with an automated optimization approach.
Besides exact solving methods for optimization models, metaheuristic approaches are widely used for finding the optimal reinforcement strategy in network planning studies, also called expansion planning problem. The approaches mainly incorporate traditional reinforcements, such as installing new lines, upgrading existing ones or upgrading transformers [6,7,8,9]. Novel measures to keep the power flow and voltage within permissible limits are taken into account in [10,11]. An extensive review of existing research can be found in [12].
In this article, we are refining an optimization approach to strategic network planning at low-voltage (LV) level to include the increase in power demand resulting from EV charging. In [13] the original approach to automated, optimized network planning at LV level is published. There, the original methodology is outlined and applied to a reference network. The focus there lies on the effects of increasing power injection from DG and determining the cost-effective, technically feasible way to reinforce a constrained network. In continuation, for this article, a methodology to take into account the increasing power demand due to EV charging is developed and included in the planning approach. In contrast to existing research where modeled data is used, for instance in [5], the methodology to derive the power demand is based on empirical survey data of actual EV owners. The simulations of this work are based on 131 measured smart meter profiles of nine consecutive years and 12,665 EV empirical charging profiles from a questionnaire.
Using this data as input, two main contributions of this paper are:
  • Simultaneity factors and equivalent peak loads of Norwegian households are derived from a large dataset to serve as input for LV network planning purposes of network operators in Norway, for different EV shares and for status quo and future EV charging capacity;
  • A novel strategic network planning optimization, combining traditional network reinforcement with novel measures is developed and applied to calculate the minimal reinforcement costs of three representative rural Norwegian networks.
The assessment of the impact of EV charging on distribution networks is based on [14], but a more accurate approach is pursued here, as a stochastic analysis on how to calculate equivalent loads and simultaneity factors for EV charging based on the method of [15,16] is applied. A probabilistic approach to calculate possible network constraints caused by integrating EVs in Norwegian rural LV networks is also pursued in [16], but the associated network reinforcement costs are not calculated, nor are alternative novel reinforcement measures considered.
The measures to reinforce the network that are taken into account here comprise traditional and novel measures. Traditional measures include upgrading existing assets with higher-rated ones. Novel measures comprise assets or operational schemes that are not (yet) frequently used in LV network. Examples are the deployment of voltage regulators and the curtailment of demand or generation as part of an Active Network Management (ANM) scheme. Here, only the deployment of voltage regulators is considered to be a novel measure to reinforce an LV network.
The methodology of the derivation of the equivalent load for EV charging is outlined in Section 2.1., the methodology of the automated distribution network planning based on a genetic algorithm in Section 2.2. After that, the application of the approaches is demonstrated in case studies of exemplary Norwegian LV networks in Section 3. The article closes with Section 4, in which the conclusion derived from the results and an outlook of further investigation in the field are presented.

2. Materials and Methods

This section is divided into two subsections. In Section 2.1 the calculation of equivalent loads is described and in Section 2.2 the strategic network planning.

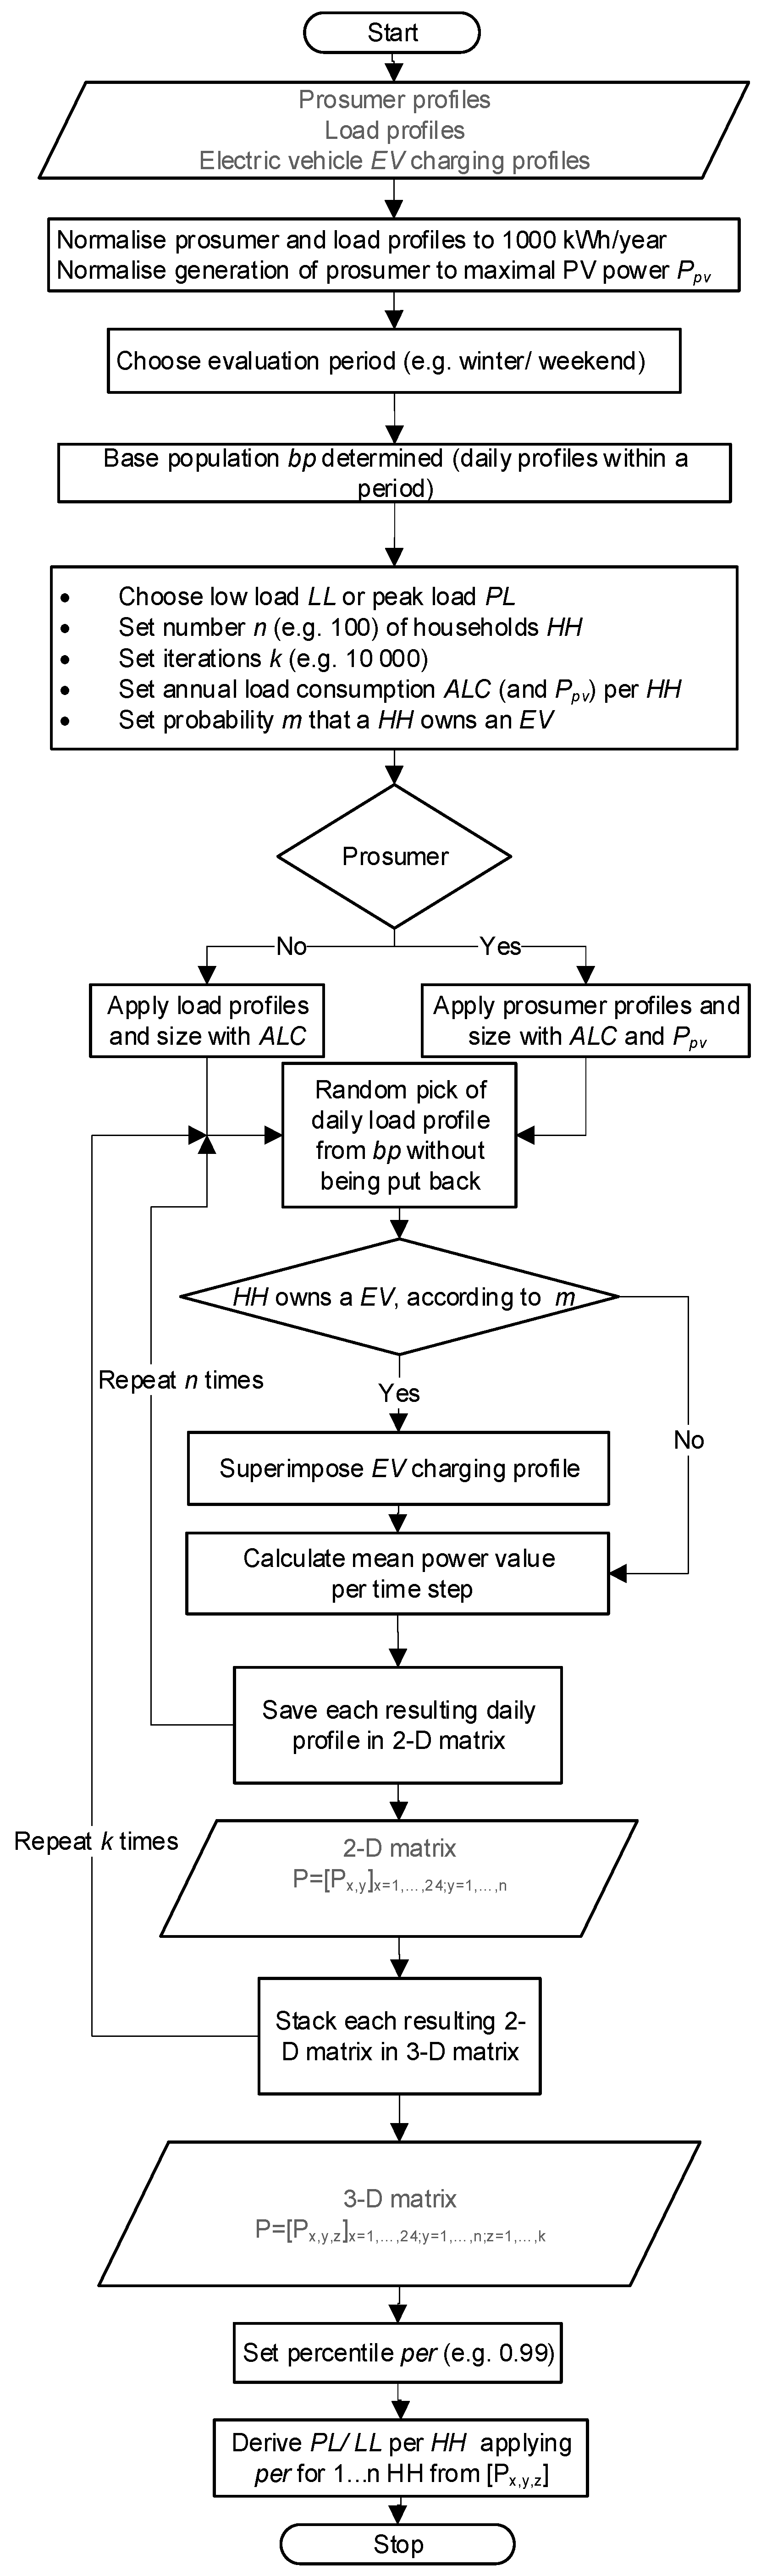
2.1. Stochastic Analysis of Smart Meter Data

In network planning, equivalent loads are applied in areas (e.g., LV networks), in which several end customers n, in this case households (HH), are supplied. In consumption-dominated networks, the expected peak load PL is used to size transformers and lines in order to supply this area at any given moment. In network sections with a high penetration of DG, as for instance photovoltaic (PV) systems, the expected low load/high generation conditions may become the more critical case and must be considered, too.
For the calculation of equivalent loads, two different methods can be followed: Direct derivation of equivalent loads from smart meter data or calculation of equivalent loads from simultaneity factors (SF) in combination with information on the installed load. In this section, only the methodology of the derivation of equivalent PL directly from smart meter data (and other datasets) is explained in detail (cf. Figure 1) and applied to a given data set (cf. Section 3). For each characteristic period (weekday or weekend for summer, spring/autumn, or winter), the equivalent peak and low load (LL) can be derived from a base population bp. The bp consists of daily active power profiles (e.g., for winter/weekend, every Saturday, Sunday, and holiday between December and February). These profiles are, for instance, historical smart meter data. The dataset in this article comprises 131 households over nine consecutive years, which is detailed in Section 3.1.1. For the above-mentioned example in the winter/weekend period, the dataset results in a bp of more than 28,000 single-day profiles (131 profiles × 2 weekend days × 12 weekends × 9 years). As these profiles are normalized to adjust them to the considered LV network, they have to be multiplied with the annual load consumption (ALC) of each household. In this case, the ALC for each household is not known individually, so a calculated value for the LV network is used instead. This is derived based on the measured aggregated ALC for the whole LV network. More details on the specific calculation of the ALC are given in Section 3.1.4. To show the dependency of the number of households n, a total of 10,000 profiles (n = 1, 2, …, 100) is randomly drawn from respective base population bp. Furthermore, drawn profiles are not put back to the base population within one iteration to avoid multiple considerations. If prosumers are considered (consumers with PV-systems), the respective profiles are used instead of pure load profiles. If EVs are considered, the calculated profile is superimposed to the prosumer or load profiles. The n resulting load profiles are accumulated and divided by n, to calculate the equivalent load value per household. These values are saved in a 2-D matrix:
P = [ P x , y ] x = 1 , , 24 ;   y = 1 , n
where P is the equivalent power, x is the time (in this case hours from 1 to 24) and y is the number of considered households n (y := n). This procedure is repeated k times (k = 10,000) for every number of n. Thus, 10,000 equivalent load values are available for each of the n considered households resulting in a 3-D matrix where z is equal to the number of iterations (z: = k), as given by:
P = [ P x , y ,   z ] x = 1 , , 24 ;   y = 1 , n ;   z = 1 , , k
By choosing the percentile of the 10,000 values per household, for instance, the 99%- percentile, the PL for each number n of households can be derived. To exclude unique situations and measurement failures the 99%-percentile is favored over the maximal value.

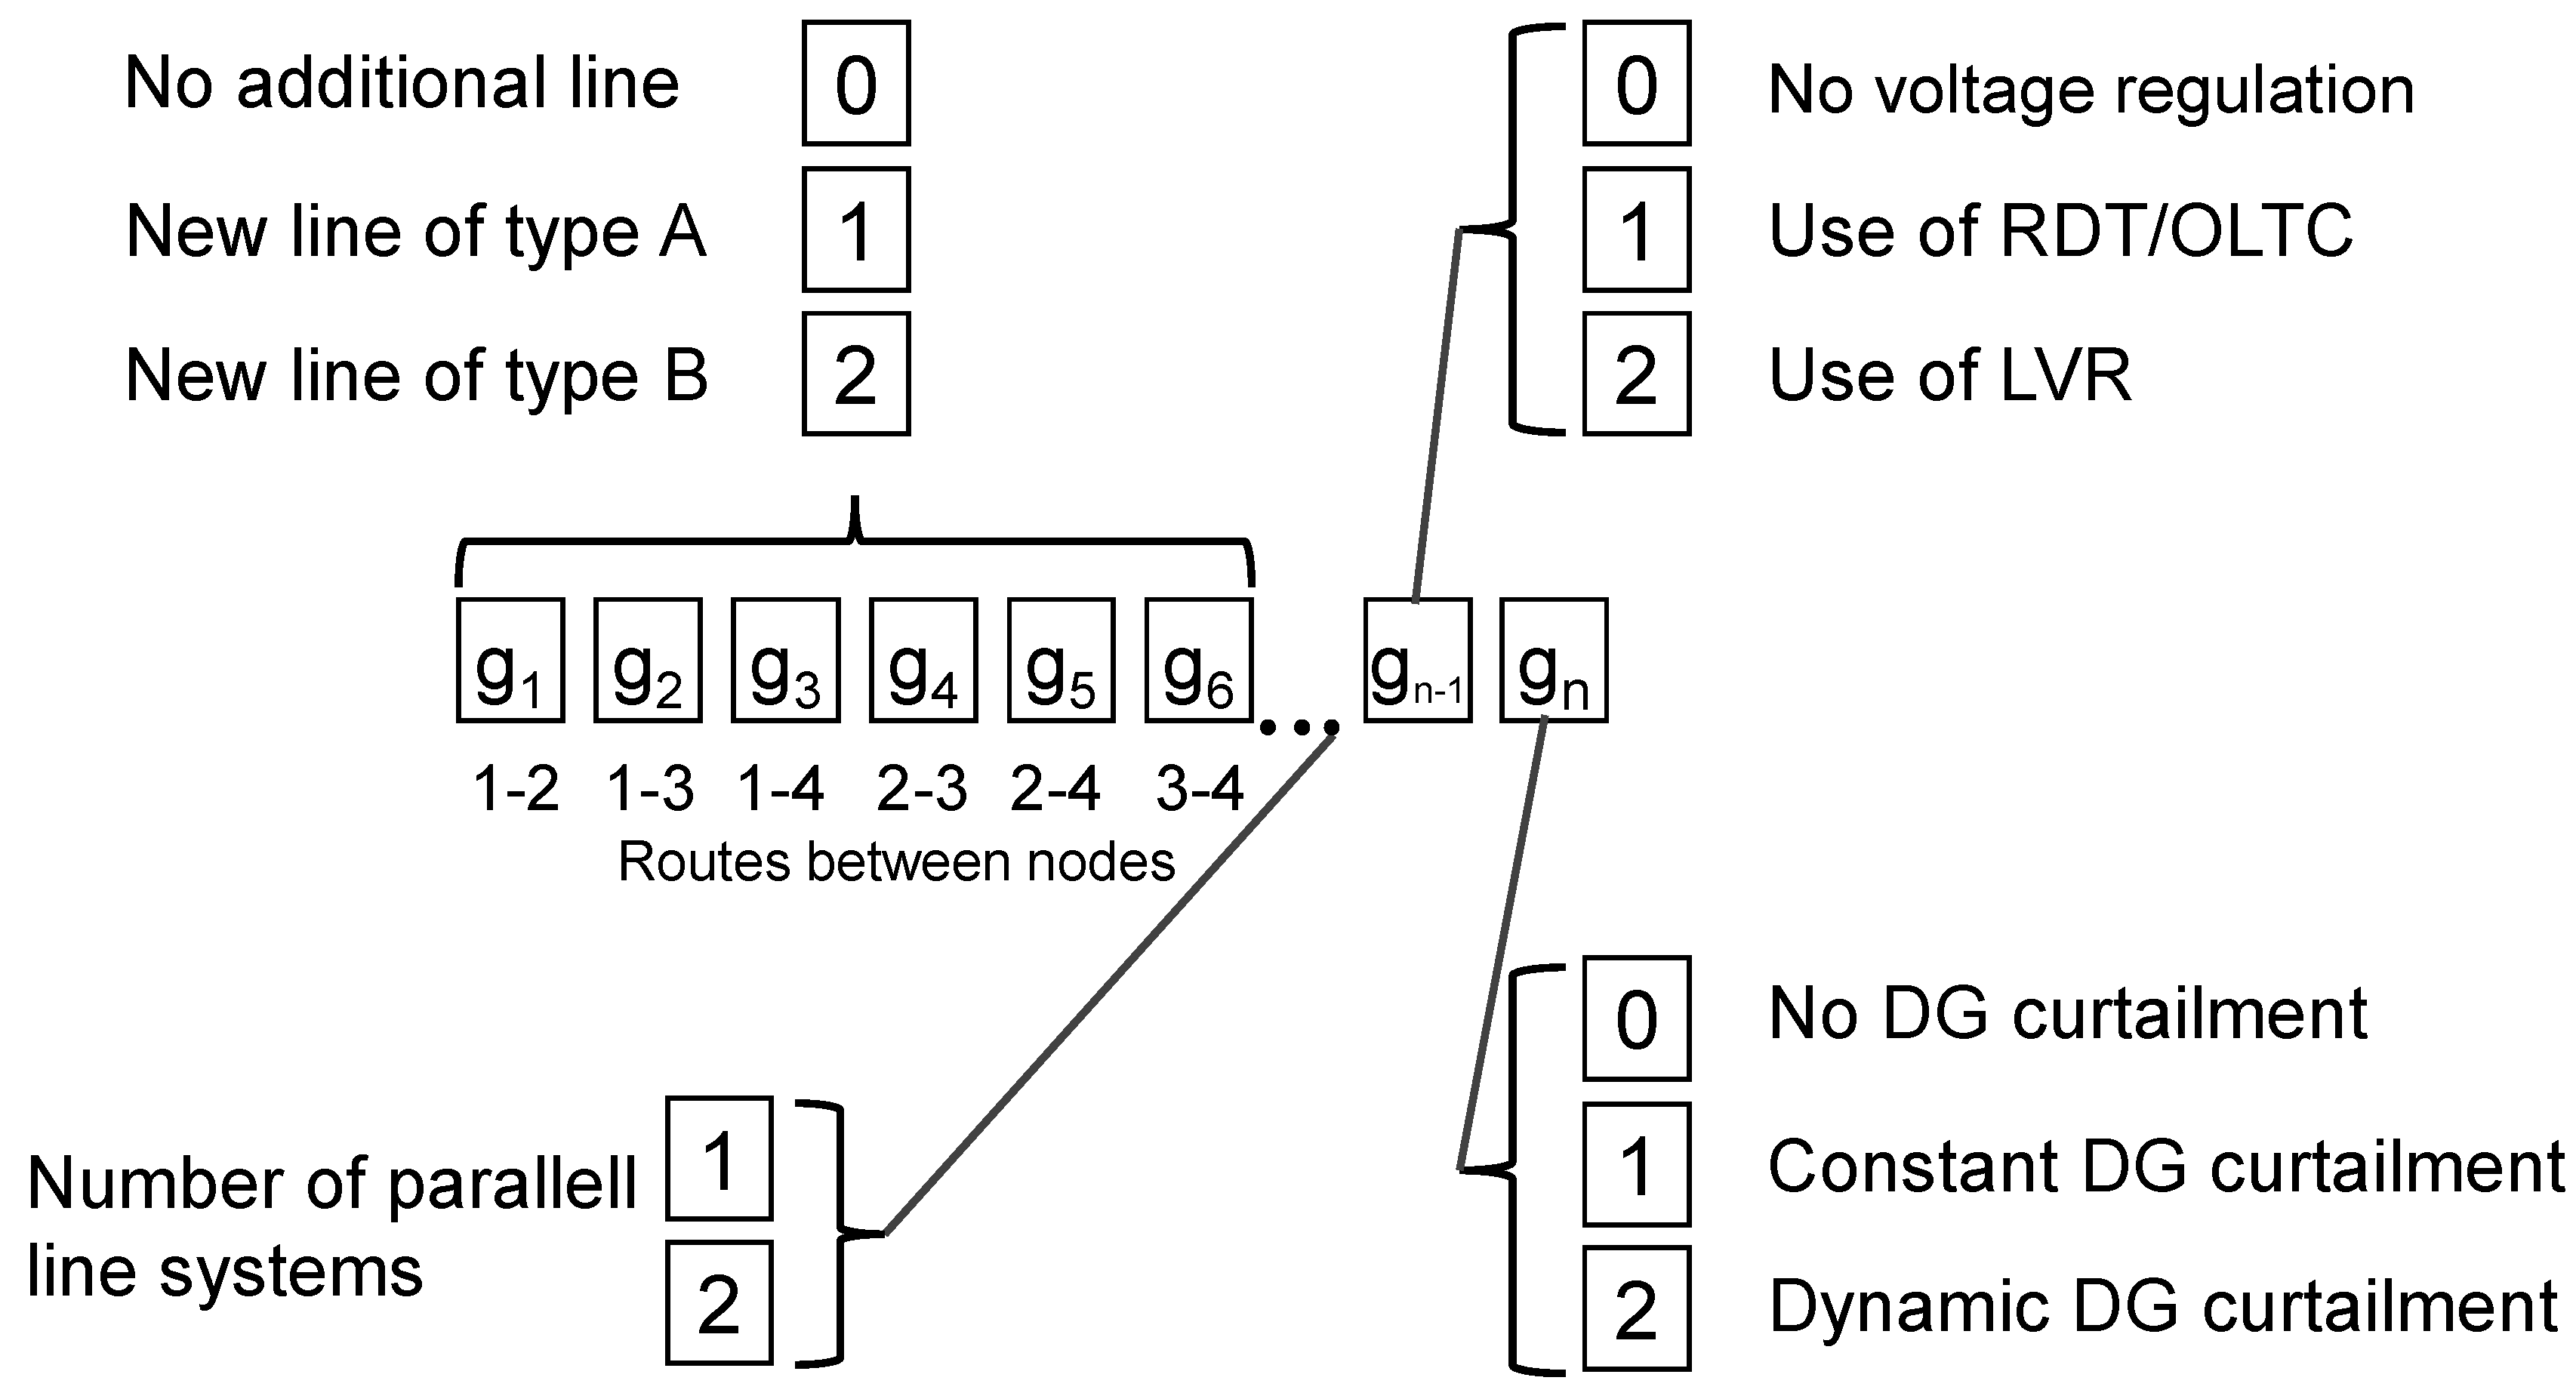
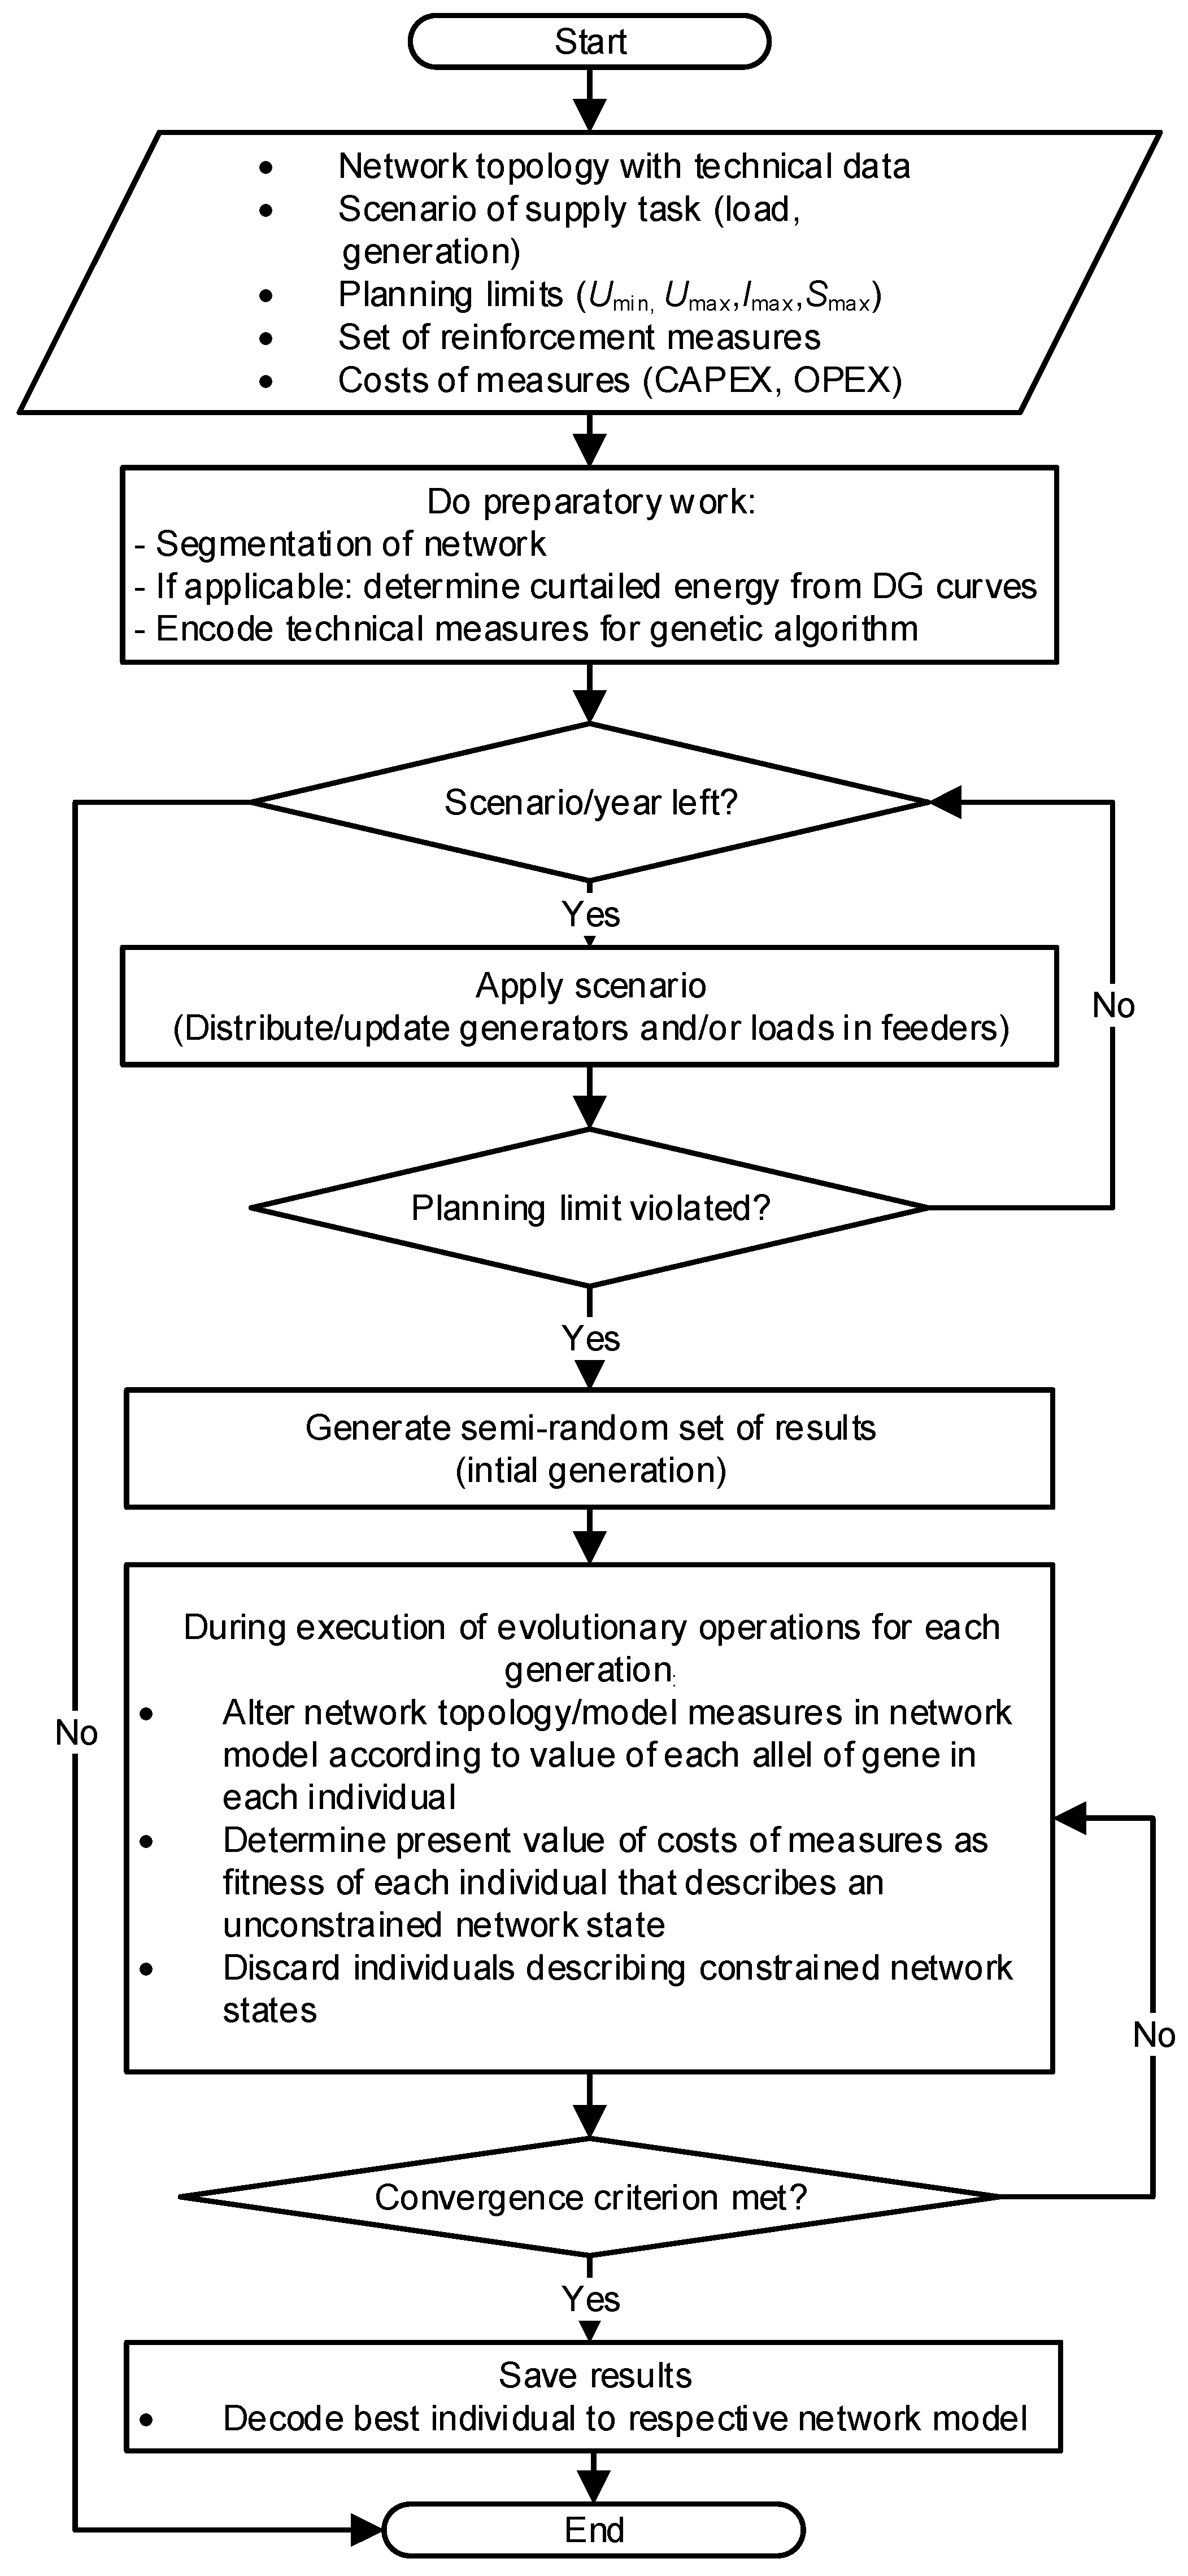
2.2. A Genetic Algorithm for Strategic Network Planning

During the current transition of the energy system, comprehensive network planning is becoming necessary, especially at LV level, and is also getting increasingly complex due to changing input factors and alternatives to traditional reinforcements. In the past, distribution networks, especially LV networks were planned based on the so-called fit-and-forget paradigm. They were designed based on conservative assumptions regarding power demand development, expecting the capacity to suffice until the end of the assets’ useful lives. On the one hand, regarding power demand, increasing numbers of new loads, such as EVs, with a relatively high electrical load compared to conventional ones are now connected at LV. Furthermore, now power generation also has to be taken into account in network planning at LV, as generators, such as based on solar power, are increasingly connected. Past network design has not considered these developments, which is why, based on technical planning limits, network constraints, such as voltage and thermal constraints, are expected. On the other hand, several novel technical measures are now available as alternatives to traditional reinforcement to cost-effectively eliminate arising constraints, and are therefore solutions to the planning problem.
The objective of such network planning is to determine the most cost-effective combination of measures to reinforce the analyzed network for the expected requirements concerning demand and generation development. The respective optimization problem can be formulated as described in the following.
min   c
with
c = i j τ A ˜ i j c i j τ · n i j + s τ A s c s τ + f A f c r τ · n r , f
subject to
P i = 0   i A i
Q i = 0   i A i
U min = 0.9 · U n U i   1.1   · U n = U max   i A i
I i j   I i j , max     i j A i j
S s   S s , max   s A s
S r   S r , max   r A r
with
| A ˜ i j | N 0
n i j { 1 , 2 }
A s = A trafo   A RDT
| A s | = 1 0
n r , f { 0 , 1 }
The objective function is given by the cost function c that aggregates all costs that accrue for the network reinforcement measures (cf. Equation (3)). The first part in Equation (4) represents the costs that accrue for additional lines, the second part those that accrue for substation upgrade and the third part for line voltage regulators (LVR) deployed in the network. Additional lines (cf. Equation (11)) can also have direct parallel lines (cf. Equation (12)). At maximum, one LVR can be deployed in each feeder (cf. Equation (15). The costs are given by the capital expenditures (CAPEX) and operational expenditures (OPEX) that are caused by the specific asset type τ that is used. For lines, the type refers to the conductor type, cross-section, and the way of insulation. For substation upgrades, it refers to, on the one hand, the apparent power capacity and, on the other hand, the functionalities. Apart from conventional distribution transformers, also regulated distribution transformers (RDT) that are equipped with an on-load tap changer (OLTC), are taken into account. However, only either of them can be deployed (cf. Equations (13) and (14)). Through tapping, the transformer control keeps the nodal voltages within the desired range while under load. The same principle applies to LVRs that regulate the voltage along a single feeder, e.g., originating from the LV bus bar in the secondary substation or a distribution cabinet.
A power flow in the network is caused by the assumed generation and demand at each node of the network. It is influenced by the electrical properties of the original network assets and is altered by the properties of the deployed measures for reinforcing the network to comply with the network planning limits. In regard to this, Equations (5) and (6) describe the load balance of active and reactive powers at each node. The planning limits are represented in the further constraints of the optimization problem. Equation (7) describes the compliance with minimum and maximum voltage at each node i , Equation (8) represents that each line i j is only loaded to the maximum current applying to the installed line type. Equations (9) and (10) verify that the maximum apparent power of the substation transformer (which can also be an RDT) and the LVRs in the network are not exceeded.
In the original approach published in [13] also the curtailment of generators is taken into account. Static curtailment constantly limits the injected power of generators at the connection point, while with dynamic curtailment the power injection from generators is only limited in critical situations. When such a scheme is deployed in the network in practice, the power injection of flexible network customers is then controlled according to the constantly monitored network state. By reducing power flows, the requirement for additional network capacity is reduced. Within the planning approach, curtailment is currently only available for generators. This is why the curtailment of loads, such as for regulated EV charging, is not in scope here.
The stated optimization problem is large, non-linear, mixed-integer, and combinatorial. This is due to the non-linear power flow equations, the integer-variables concerning the decision on the installation of a certain line (cf. Equation (11)) and its type, the number of parallel lines (cf. Equation (12)), the decision on either deploying a conventional transformer or an RDT, and the decision on whether to deploy an LVR in a feeder. This is why here the problem is solved based on a genetic algorithm (GA). This solving method has been demonstrated to be a good compromise between effort in model design and computation, on the one hand, and the quality of results, on the other (cf. [12,17]).
The approach focuses on LV networks with a high number of EVs and the respective charging demand. The GA chromosomes represent an alteration to the network model for its reinforcement. To represent the different reinforcement measures and to allow the variables to have more than two different states, integer values for the genes are favored over the classical binary representation. The logic of chromosome design is shown in Figure 2. Different groups of the chromosome with n genes represented by the vector ( g 1 , , g n ) encode certain reinforcement measures. The first group represents the installation of additional lines and the second the number of parallel lines. Then, one gene represents the voltage regulating assets RDT and LVR. The following gene encodes the curtailment of generators.
The fitness of each individual corresponds to the reinforcement costs defined above. The optimization approach that includes the execution of the GA is shown in Figure 3. First, all necessary data and parameters are read in. This includes, in particular, the concrete topology of the studied network with the technical data of its assets, the scenarios of demand and DG development expected in the network and the reinforcement measures whose technical feasibility concerning arising technical network constraints shall be assessed. For the case studies here, this EV charging power and SFs are read in. Subsequently, preparations for the efficient execution of the GA are carried out. First, this includes an analysis and segmentation of the network that yields its characteristics, such as the correspondence of nodes to feeders and the line length between all nodes. Second, in the general approach, the representative DG generation data are processed, which is not applied in the studies here. Third, based on the network topology and the choice at the beginning, the respective reinforcement measures are encoded for the GA.
Then, either a planning study for a single network with a specific scenario or a sequence of studies for various years can be executed. Planning studies are carried out until all desired studies based on the predefined combinations of year and scenario are completed. If the increased power demand based on EV charging leads to constraint conditions by violating planning limits, the optimization algorithm to solve the planning problem based on a GA is executed. In terms of the delivered EV studies, the expected network constraints are undervoltages caused by the larger voltage drop and thermal constraints. In case no constraints are detected, the next planning study for the next year or another scenario is executed. Within the optimization algorithm, an initial set of semi-random solutions is generated and then improved by executing genetic operators used in GAs. Individuals in a generation are selected with a tournament selection and are recombined with uniform crossover. Derived solutions that leave the network constrained are discarded. The algorithm is terminated when a predefined criterion that relates to the convergence of the solutions is met. Then, the final solution is given by the network model updated with the optimal combination of reinforcement measures. It is built upon the fittest individual after the evolution within the GA, delivering the reinforcement plan with the most cost-effective reinforcement measures.

3. Results and Discussion

In this section, the methods of Section 2 are implemented, with the purpose of:
  • quantifying the hosting capacity of EVs;
  • quantifying the optimized network reinforcement costs of a growing EV penetration pathway.
The quantification of the EV hosting capacity and the optimized reinforcement costs are calculated for three representative LV networks in southern Norway. For this task, this section is divided into four subsections. In Section 3.1 the equivalent PL for households with and without EV is determined, as an input parameter for the network planning. In Section 3.2 the results of the subsequent network planning are presented, while in Section 3.3 different variants are outlined. In Section 3.4 the results are summarized, discussed, and compared to existing research.

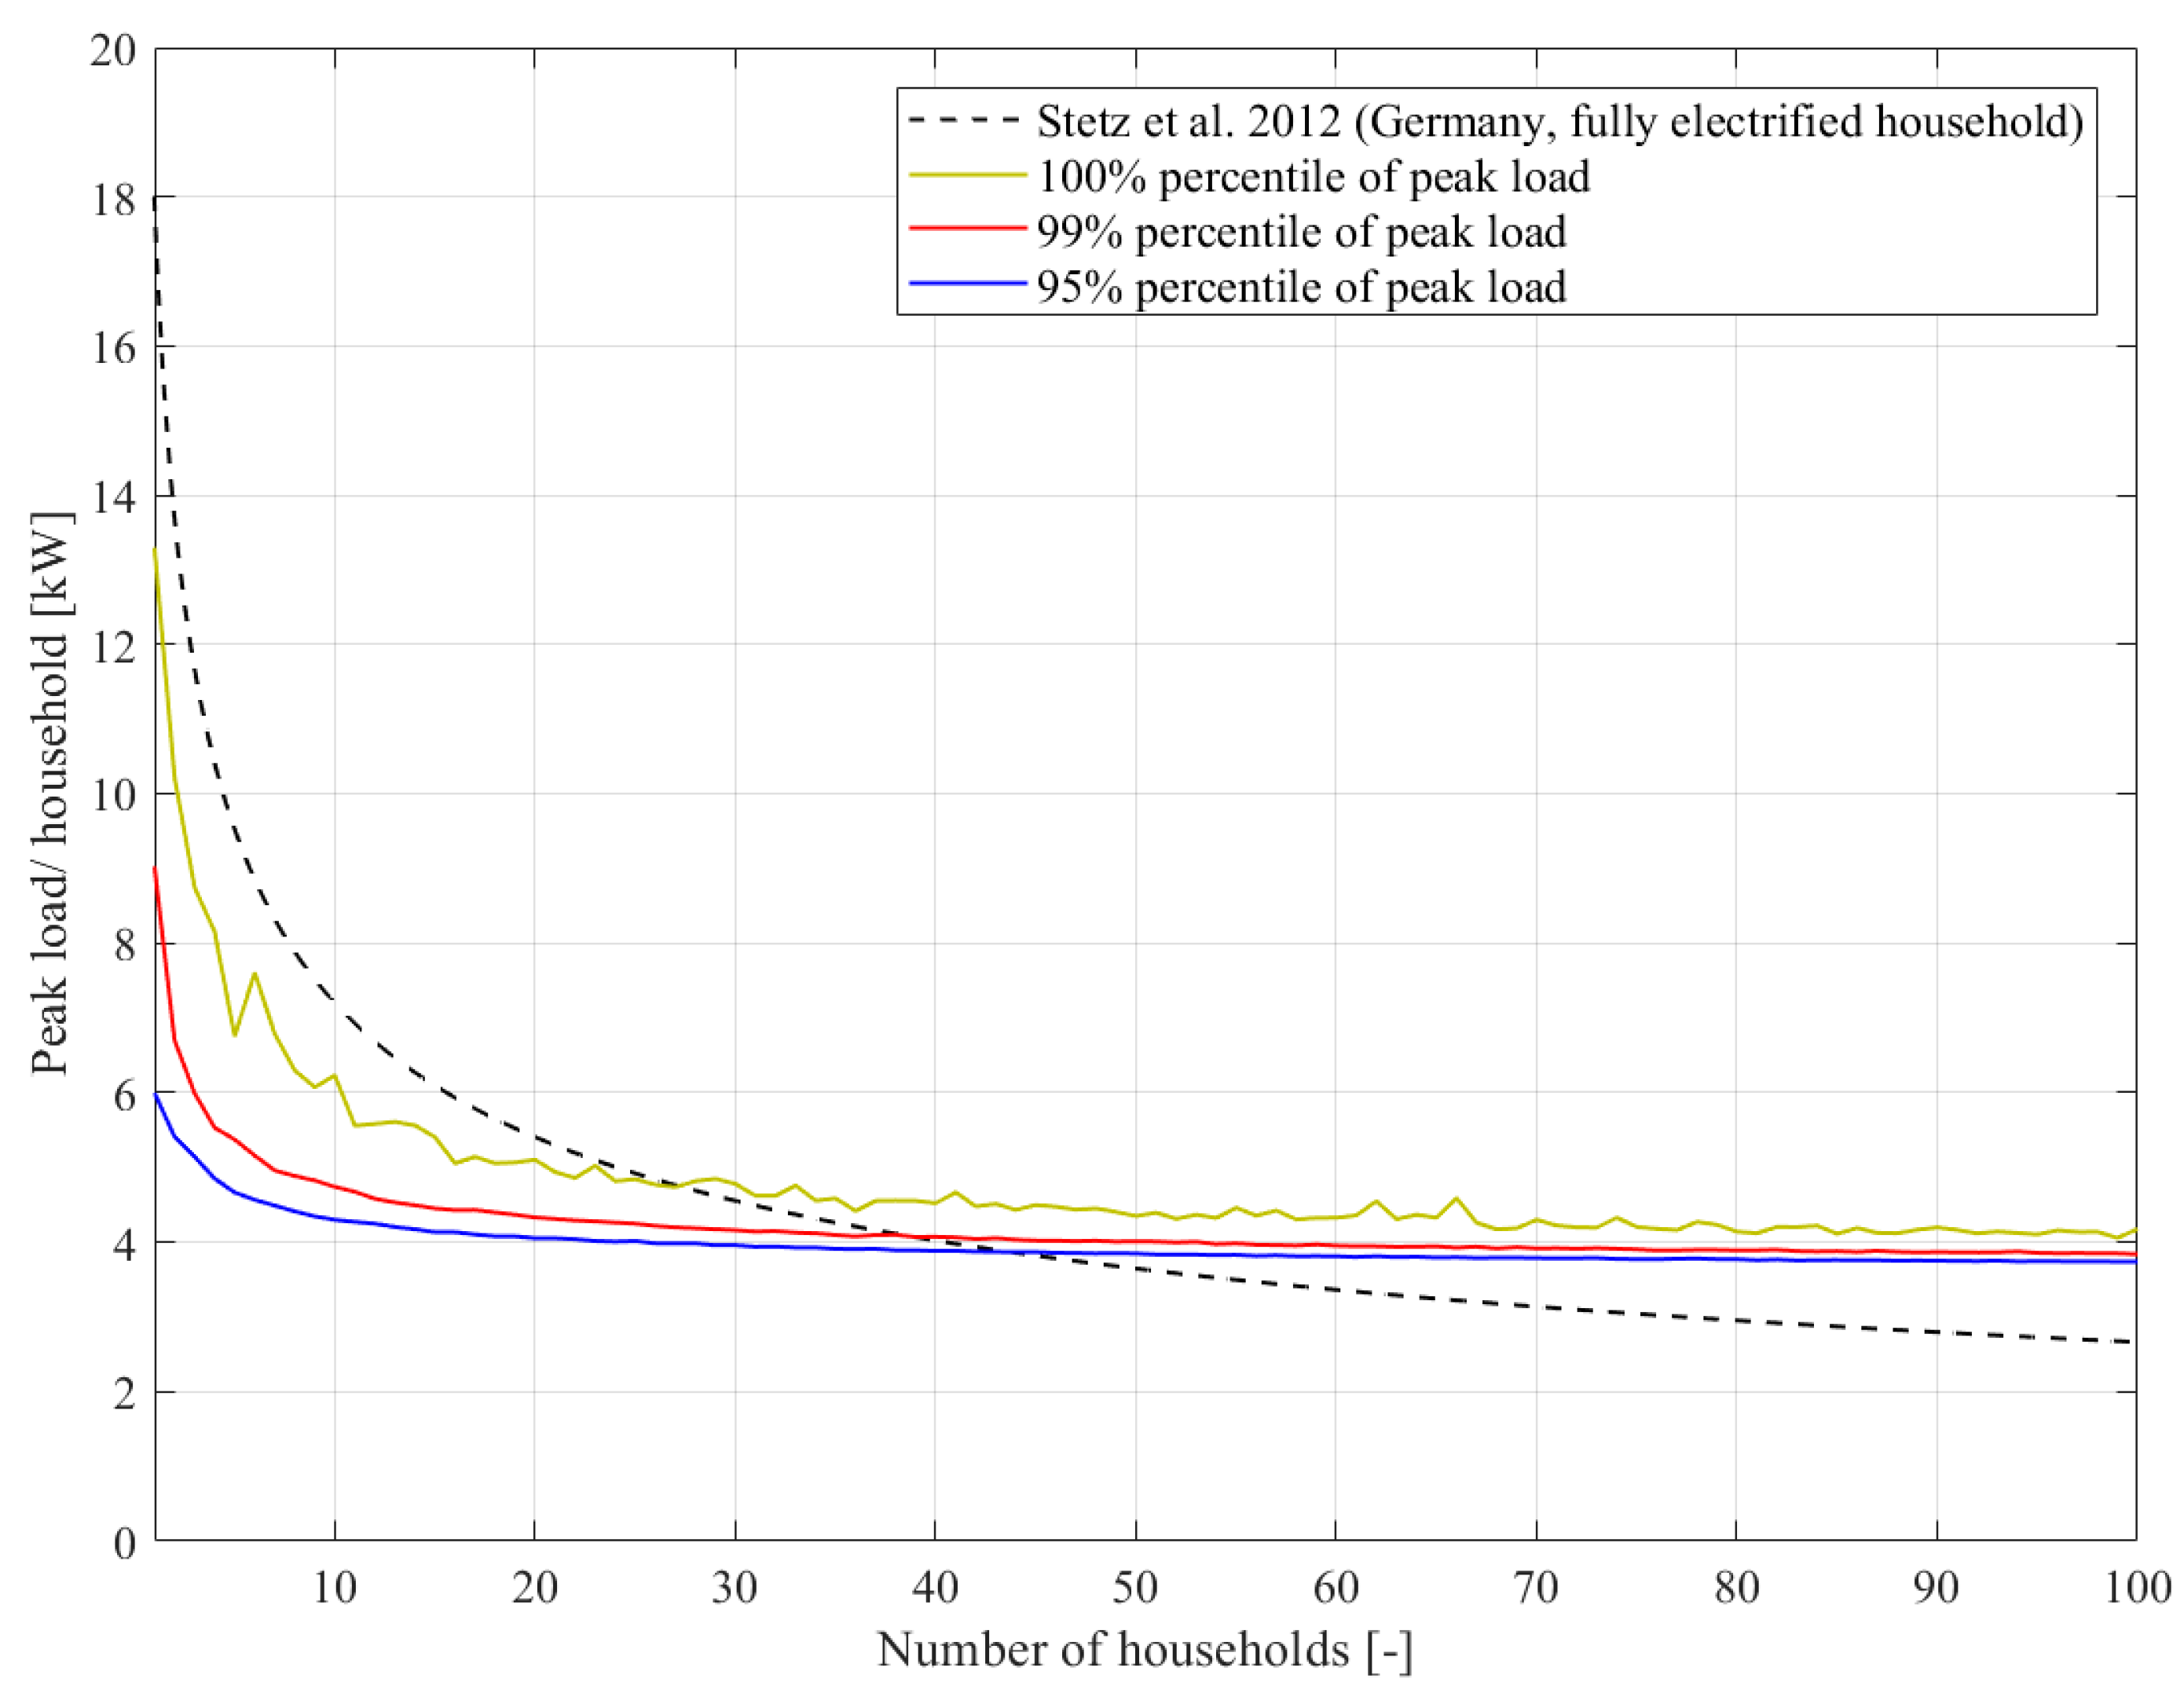
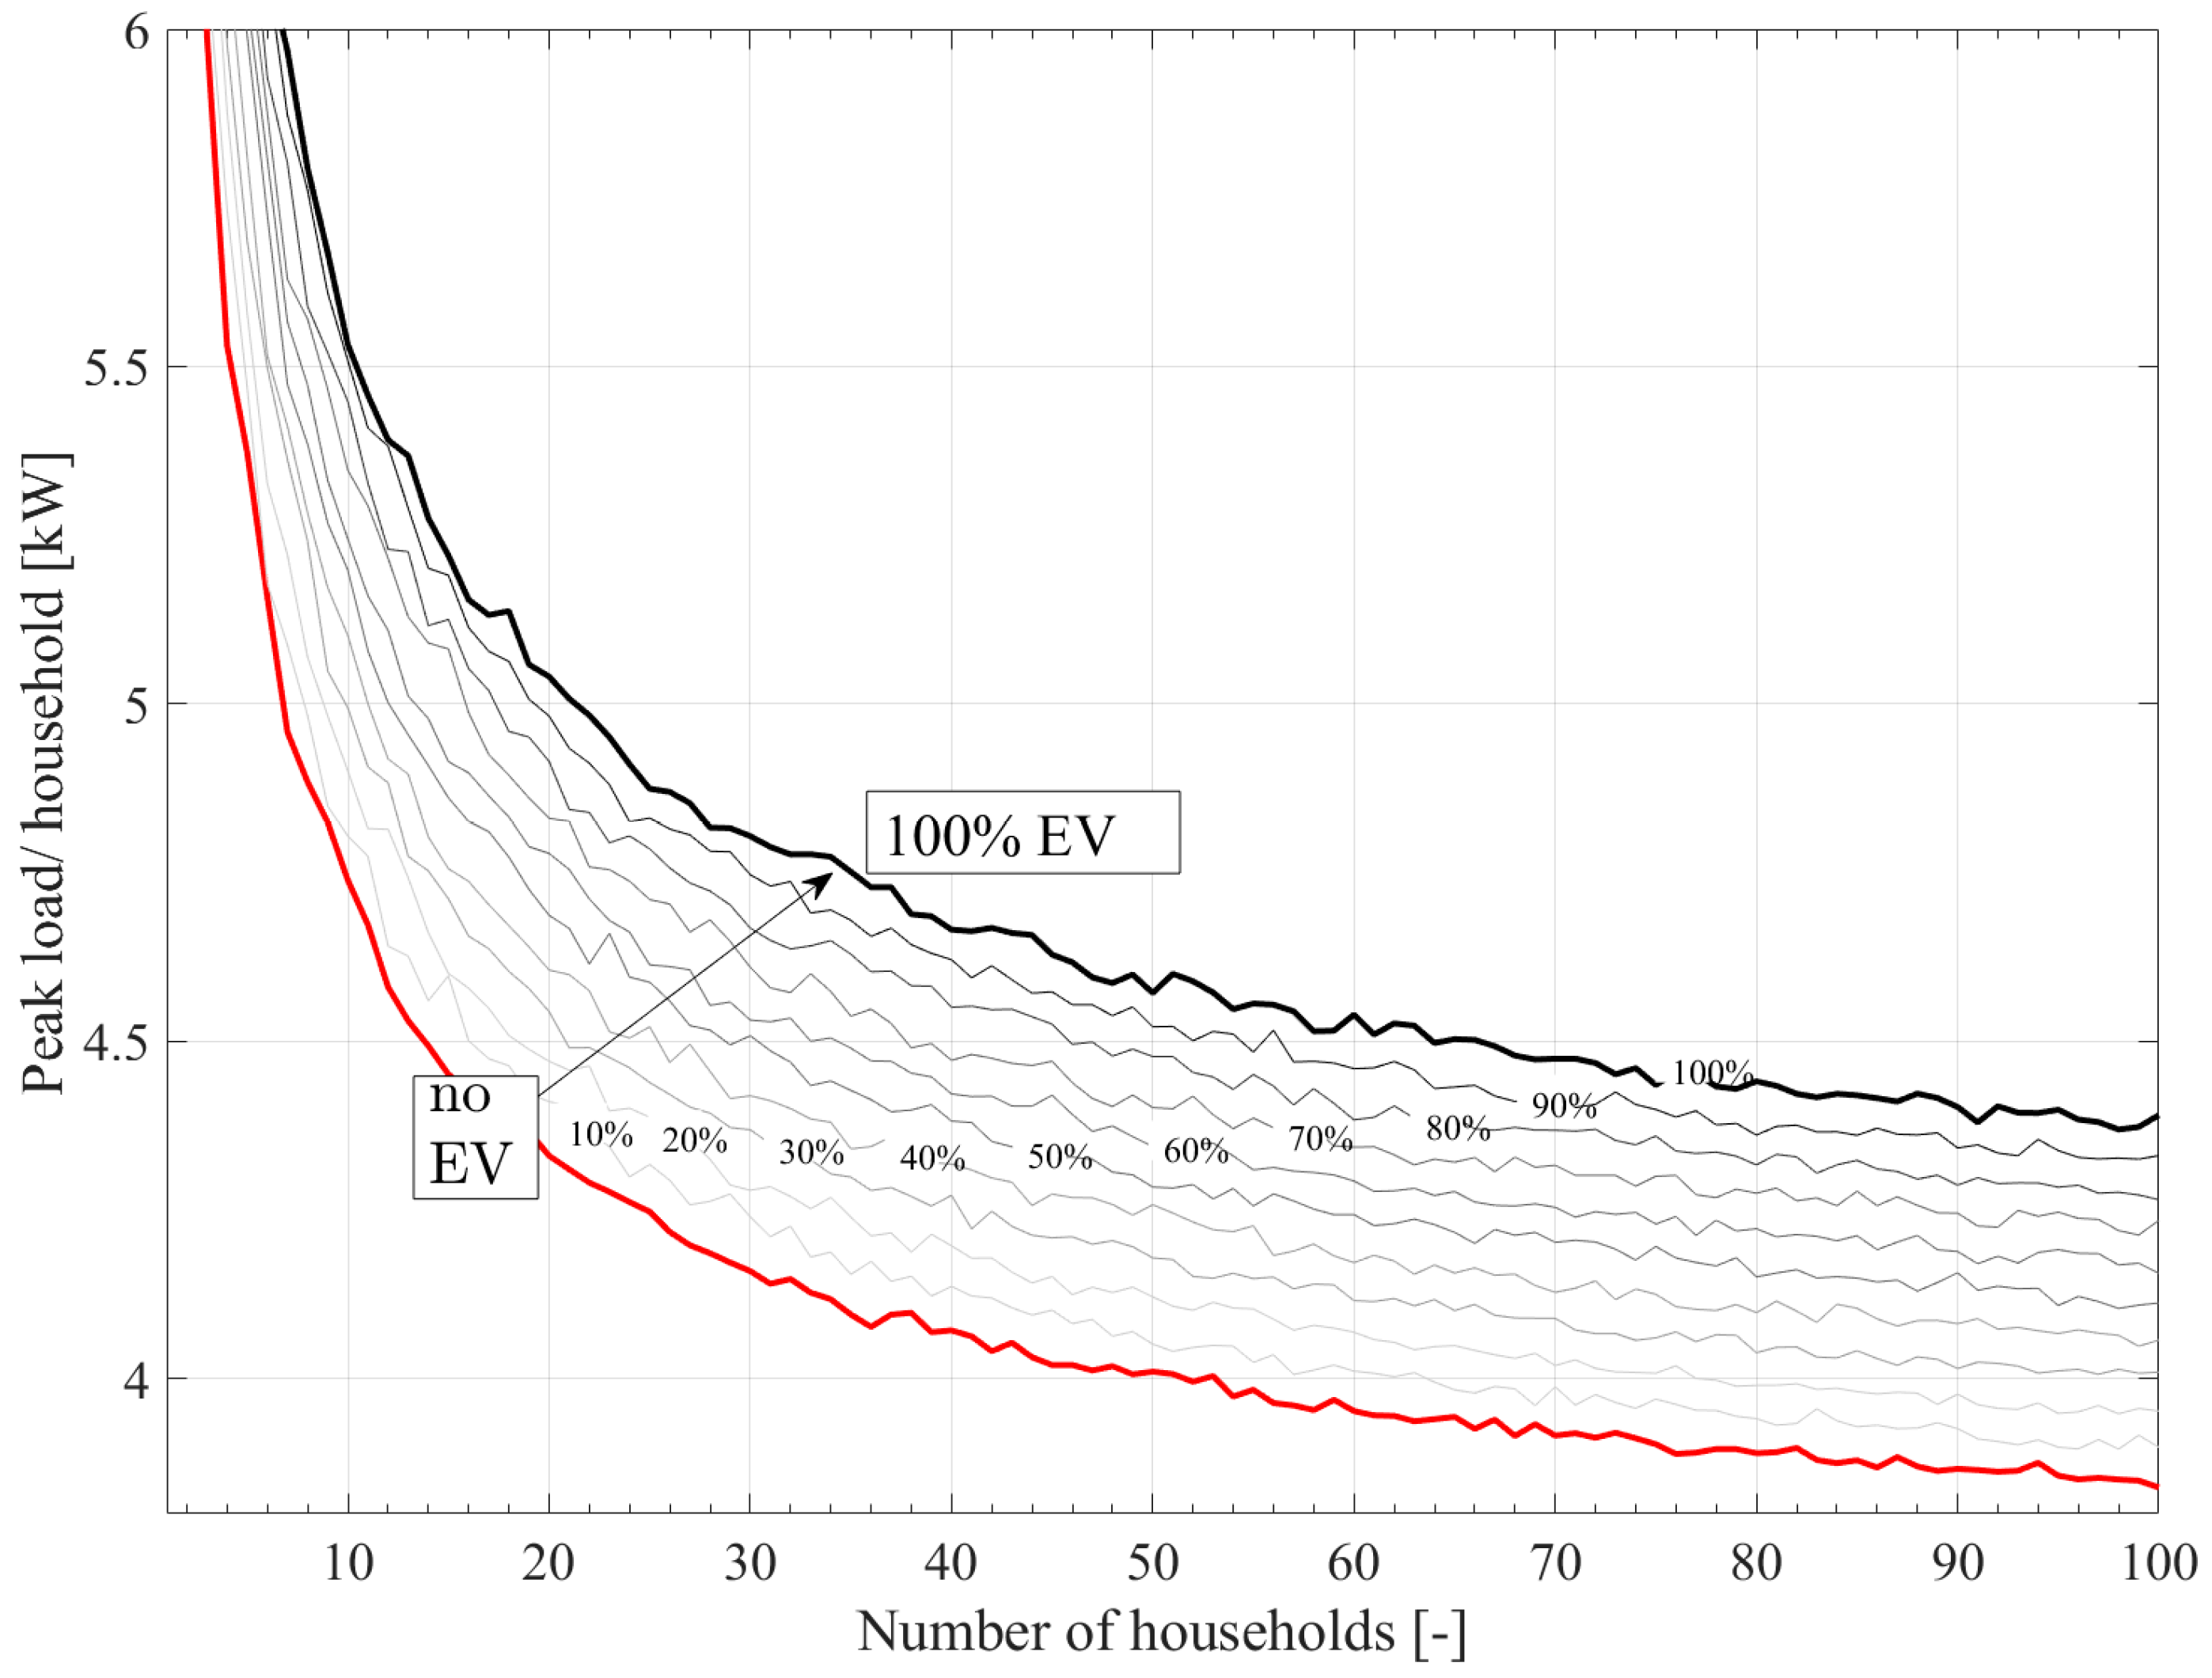
3.1. Calculation of Equivalent Loads and SFs for Households with and without EVs

In a first step, the method presented in Section 2.1 is applied to household data without EVs. In a second step, EV profiles are superimposed to these profiles to calculate equivalent loads for networks with different shares of EVs.

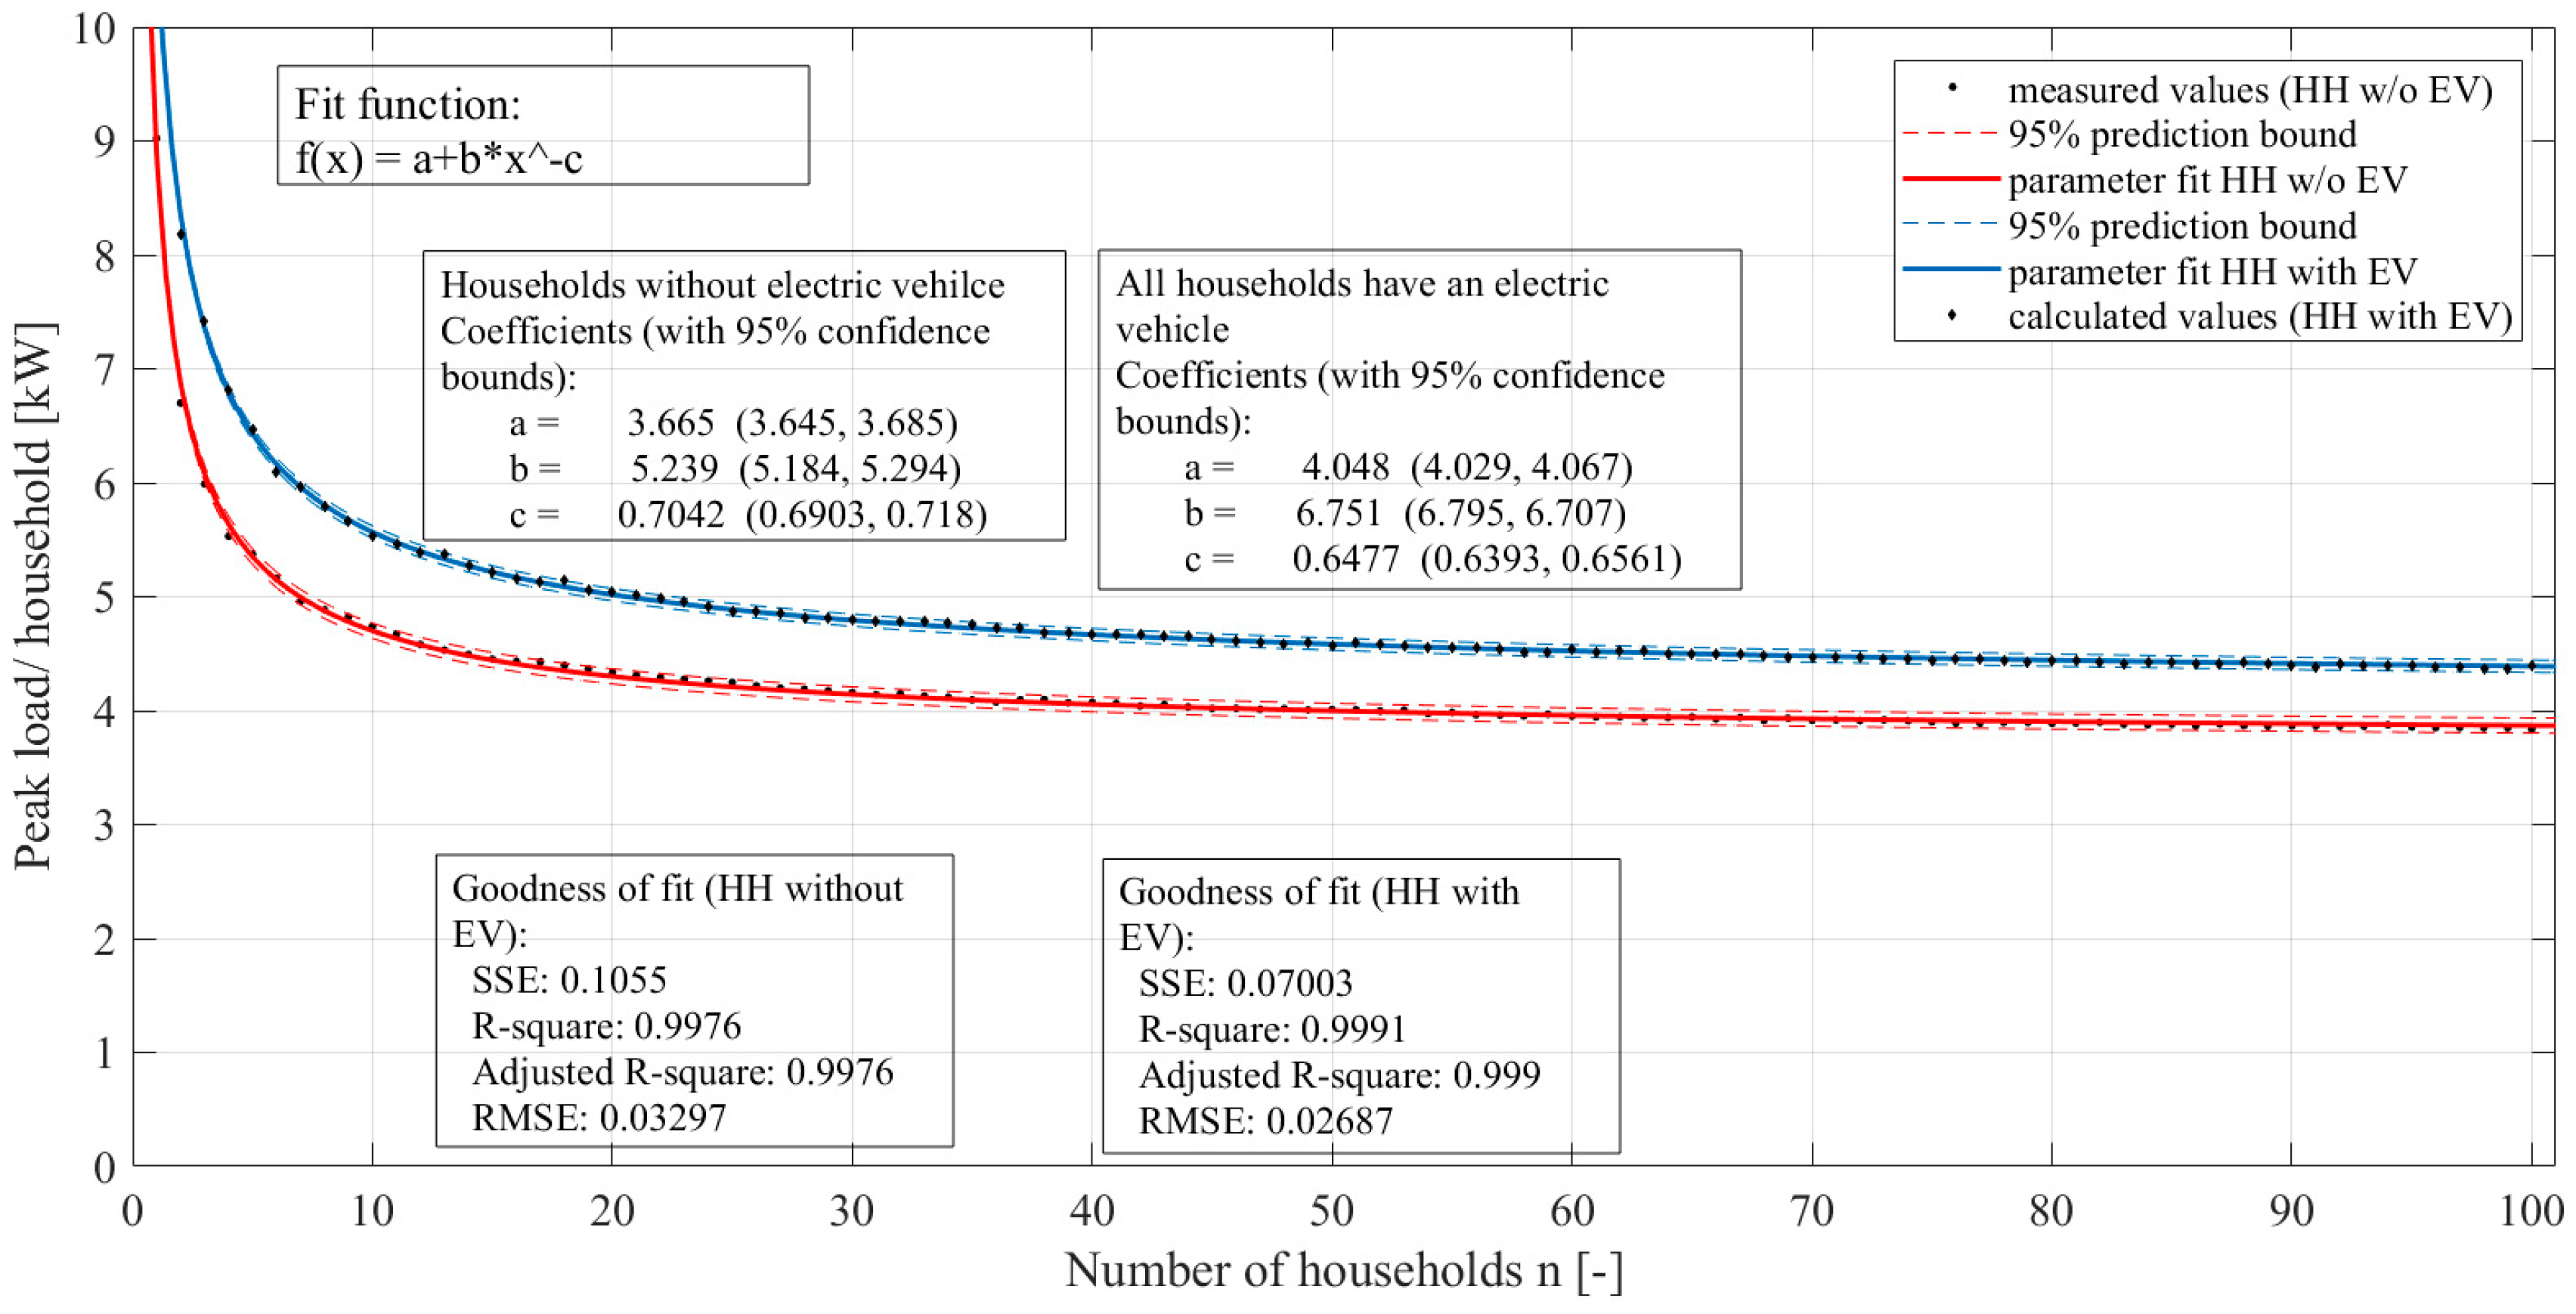
3.1.1. Equivalent Loads Based on Smart Meter Data of Households without EVs

The PL of households without EV is based on historical data of household costumers based on smart meter data within the area of Spillum (middle Norway). 131 different residential load profiles (hourly values) were handpicked for the period between 2007 and 2015 and normalized to provide consistent data without gaps that can be applied for different ALCs. For the calculation of the equivalent PL per household of Figure 4, an annual load consumption of 16 MWh per household (based on the Norwegian statistics bureau [18]) is assumed. It can be deduced from Figure 4 that the Norwegian PLs are close to the fully electrified German households, but show a slightly higher value for more than 40 households. The higher value could correlate with the lower temperatures in Norway, which lead to higher power demand for electric space heating and heating of tap water. The different percentiles are shown to see the smoothening effect and the reduction of PL per household if unlikely events are excluded. Following the recommendation of [16], here the 99 %-percentile is applied.

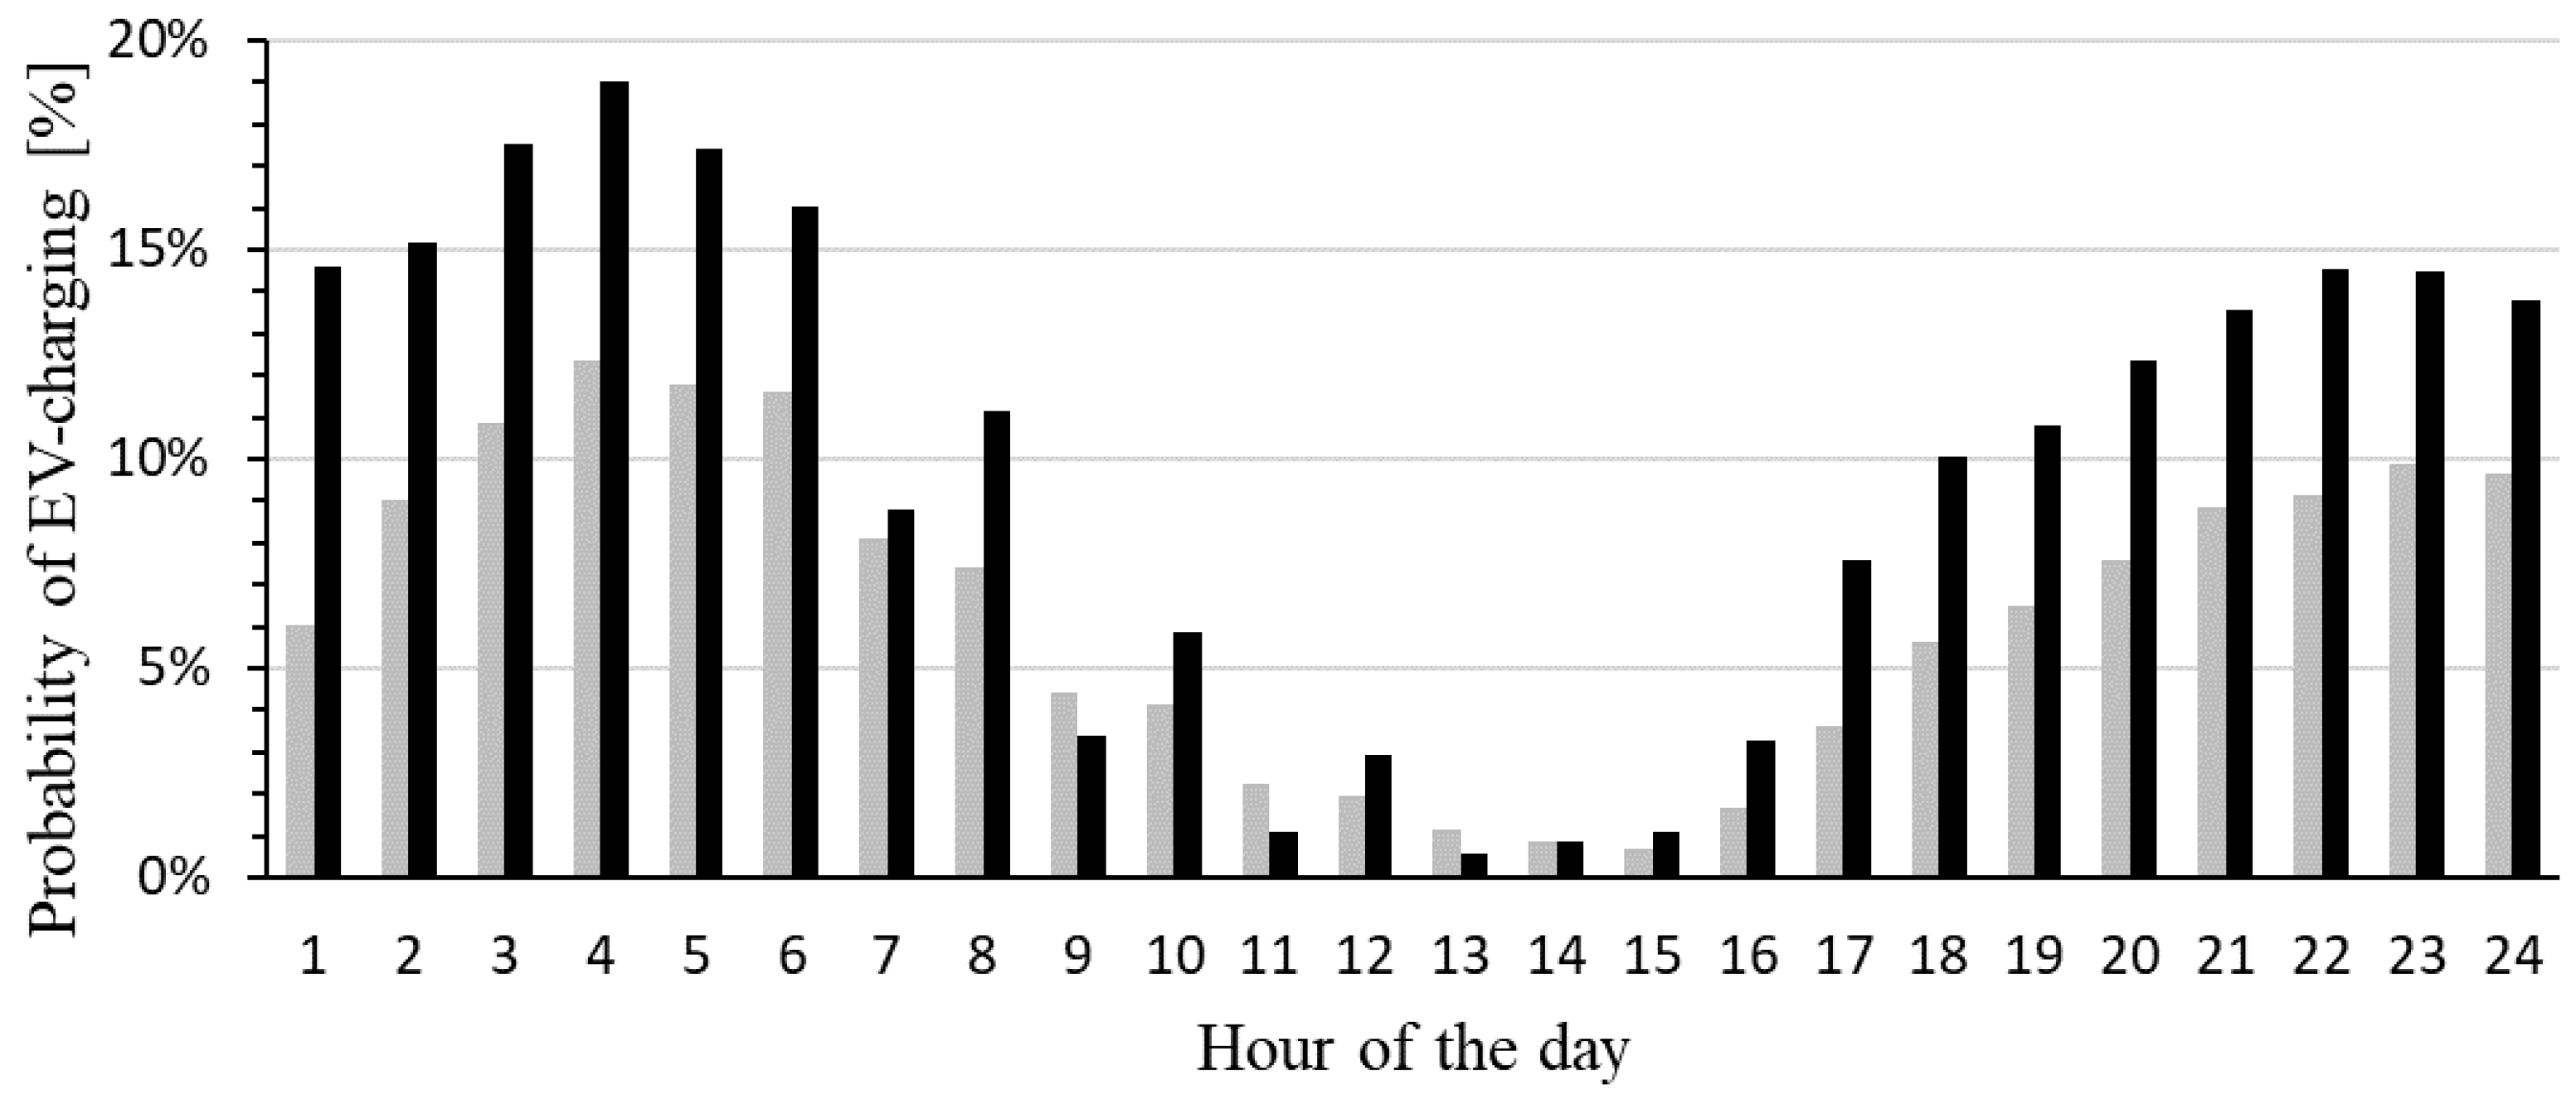
3.1.2. Equivalent Loads Based of Smart Meter Data of Households with EVs

The EV data is based on a survey for the whole of Norway with 12,665 participants (EV owners) [19]. The results of this survey and the deduced heuristics for this paper are listed hereafter and are used to calculate the status quo:
  • Charging power: 63% of the EVs are charged with 10 A (2.3 kW), 19% with 16 A (3.38 kW) and 12% with 32 A or more (7.36 kW); assumption: charging power is limited to 7.36 kW in this study for the status quo;
  • Daily charging profiles: 12,665 daily charging profiles (1 h steps) are based on the information of the EV owners (database is not public);
  • Behavior: 93% of the EVs charge at home; assumption: All electric vehicles charge at home;
  • Behavior: 70% of the EVs charge daily; assumption: All electric vehicles are charged daily;
The two behavioral assumptions reflect the worst case (especially the assumption that the EVs charge daily) and result in a high maximum charging power demand, which is in line with the generally conservative approach taken in network planning. Derived from the charging profiles, the probability of EV charging for the status quo mix of 2018 (black) and the future possibility that all cars charge with 11 kW (grey) are depicted in Figure 5.
For the calculation of the 11 kW charging profiles, the starting points of the charging process of the profiles of the status quo are kept. To calculate the duration of the charging, the initial state-of-charge of each battery is calculated using a probabilistic driving distance model and each EV is charged until the state-of-charge reaches 100%. The methodology is described in detail in [20].
At the beginning of 2019, there were 2.768 million private cars registered in Norway, out of which 195,351 were EVs [21]. To show (cf. Figure 6) and evaluate the impact of an increasing share of EVs on the equivalent PL in a supplied area (e.g., LV network), the status quo charging profiles and an average ALC of 16 MWh per household are applied.
Figure 6 shows how the calculated PL increases in case of increasing shares of EVs. It could be found that the PL per household increases linearly with the share of EV for the analyzed number of households if more than five households are considered (e.g., the coefficient of determination R² of a linear fit for the PL (for 50 households with an of EV share of 50%) is 0.9971). Thus, it is sufficient to calculate the PL for a scenario with several households n with no EV (red fit curve) and 100% EV (blue fit curve). This is done by applying Equation (16), using the parameters shown in Figure 7 and interpolate the PL linearly. The variables and form of Equation (16) are taken from [16], where it is applied for German PLs. The variables a, b, and c are fitted to the Norwegian case, showing that the fit function has excellent goodness of fit, also for the Norwegian dataset.
P L ( n ) = a + b n c
Two worst-case scenarios are depicted in Figure 7: None of the households have an EV (red fit curve) and all households do (blue fit curve).

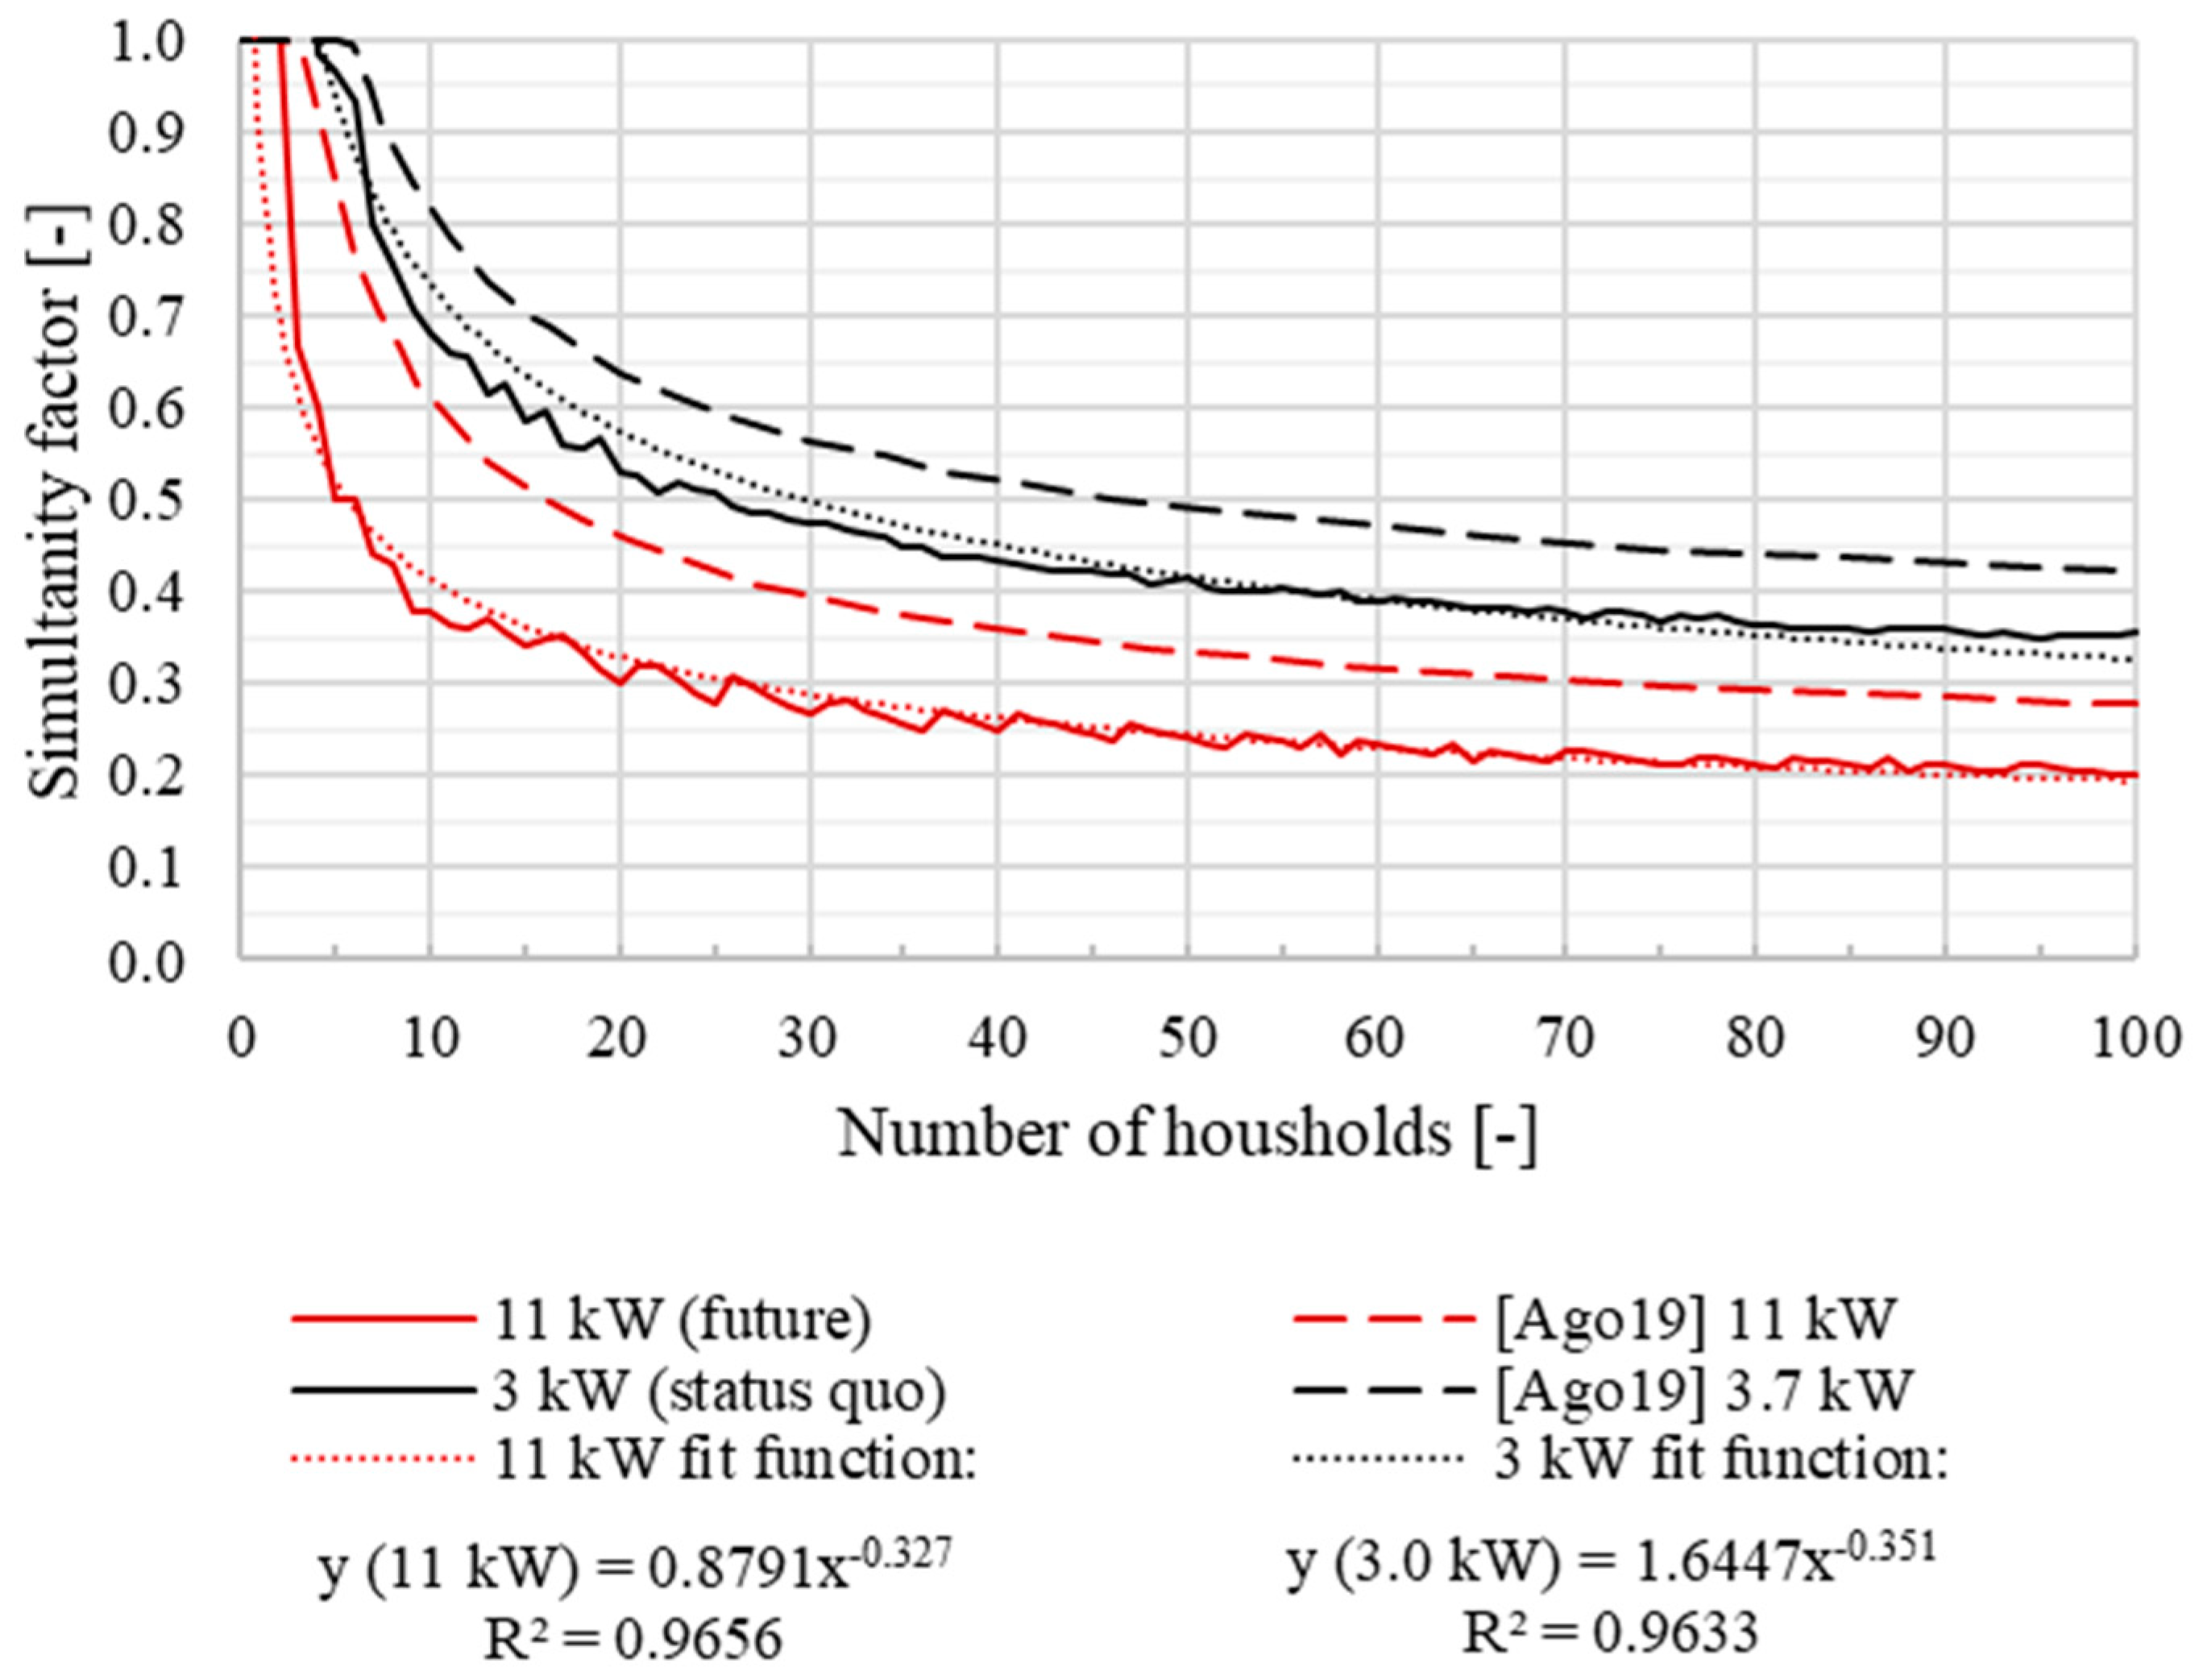
3.1.3. Simultaneity Factors: Status Quo and Possible Future

In this section, SF functions are depicted in Figure 8 and discussed. They are defined as follows [16]: “Simultaneity Factors a measure for the temporal correlation of the PL of n individual end customers, within a certain time interval (typically one day). They are expressed as the ratio of the maximum of the accumulated load demand over the sum of the respective individual maximum load demand of n customers”. The SF depends on the number of loads and therefore has to be calculated for different numbers of loads and households. In the literature, the values for the SF are normally calculated from 1 to 100 households. [16] To calculate the PLs for the status quo EV mix in Norway (red line) and the possible future (black line), the method described in Section 2.1 is applied. Expanding the definition of [16], SF for EV charging power is defined as the ratio of the PL if the load consists only of EV charging power and the nominal peak charging power. It is assumed that in the future all EV will charge with 11 kW and start charging at the same time as in the status quo. For both cases, only EV charging power is considered, an EV share of 100% is assumed, the Monte Carlo simulation is conducted with 10,000 iterations, and a 99%-percentile of the PL is chosen.
In contrast to [14], where the SFs for EV charging are set to certain values (1, 0.8, 0.15, 0.07), the SFs here are calculated as a function of the number of households and fitted to make it more applicable for Norwegian distribution system operators (DSOs) in their network planning (dotted lines, fit function, R2; cf. Figure 8).
For the status quo charging power mix, a weighted average power value is applied, resulting in a nominal power value of 3.04 kW. This is lower than the maximal charging power of 7.36 kW. Thus, in the case of applying a mix of charging powers (status quo mix) as the divisor to calculate the SF, it can be higher than 1. For the dataset used here, this phenomenon manifests itself for less than four households; if, for example, all four households charge with 7.36 kW at the same time, which is very unlikely, then the SF would be 4 × 7.36 kW divided by 4 × 3.04 kW, resulting in a SF of 2.4. Therefore, it cannot be applied in this range. Similar to [14,22], it can be seen that the SF decreases if EVs charge with 11 kW instead of 3.7 kW (Germany) or 3.0 kW (Norway). The decrease of the SF is 38% for 50 households for the Norwegian cases compared to the German cases of 30% for 50 households. The differences to [22] are due to the facts that:
  • in the status quo power charging mix, there is a variety of charging power ranging from 2.3 kW to 7.4 kW, whereas in [22] all EVs charge with 3.7 kW.
  • the charging distribution probability in Norway (cf. Figure 5) is relatively even, compared to [23], for instance. This effect is possibly caused by scheduled charging in the morning hours.
The SF of 0.07 and 0.15 of [14] are not reached, even with 11 kW charging power (SF(100 households) = 0.2) in Norway.

3.1.4. Scenario Application and of Input Parameters

The scenario parameters of household load development and EV share are calculated based on the results of the scenario report ENSTO TYNDP 2018 [24] for the years 2020 and 2040. Out of the three scenarios of [24], the scenario DG is the worst-case scenario with the highest increase of EVs in Norway. The number of EVs is assumed to increase from 116,000 in 2020 in the Best Estimate (BE) scenario (already exceeded in 2019) to 1,865,739 in 2040. To analyze the possible network impact, two urban networks and one rural representative network are chosen by the Norwegian DSO Skagerak (southern Norway). The yearly energy consumption of these LV networks is known. The ratio of the annual load demand of southern Norway and the annual load demand of a specific LV network (historical measured data) is applied to apportion the scenario assumptions for the whole of Norway (BE and DG) [24] to the specific LV networks in a top-down approach. By knowing the annual load demand and the number of households connected to the LV network, the ALC for each household can be calculated and is used as an input to calculate the daily power profiles required for the calculation of the equivalent PL by applying the methodology presented in Section 2.1. For every LV network, the installed and aggregated PV-system capacity, as well as the number of EVs are calculated, considering the probability that a household owns either. Applying the methodology presented in that section, the equivalent PL is calculated for each LV network and scenario and is applied in Section 3.2 hereafter.

3.2. Electric Vehicle Studies Based on Scenarios

Three case studies with Norwegian LV networks operated at 0.23 kV nominal voltage U n are presented in the following. The voltage at the LV/MV connection point is assumed to be at nominal voltage U n with the transformers tapped in the neutral position and without an OLTC. According to their location, one network can be considered rural, and the other two as urban networks. The automated network planning tool presented in Section 2.2 was used to perform the studies.
The characteristics of the analyzed networks are presented in Table 1. All three networks are currently operated without violating any voltage or thermal planning limits.

3.2.1. Application of EV Scenarios

According to the presented methodology, the average load pick-up caused by EV charging was determined. The two investigated scenarios of [24] are BE for 2020 and DG for 2040. Table 2 contains the resulting equivalent PL for each customer.

3.2.2. Planning Results

Already in BE2020 the higher PL due to EV charging leads to inadmissible power flows in the rural network, exceeding the transformer rating. Due to the thermal loading of I / I max = 109%, the transformer requires upgrading to a rating of S r = 250 kVA. Furthermore, with U / U n = 85 % the voltage drops below the minimally permissible value of U min / U n = 90 % in one feeder. With traditional measures, the most cost-effective way to eliminate this voltage constraint is to reinforce one line behind the LV bus bar with a parallel line, constituting a new feeder from the LV bus bar at the secondary substation. The necessary length is l = 0.51 km and the conductor cross-section at least d c = 95 mm2. The network graph including the reinforcement measure is shown in Figure 9.
However, the overall cost minimum can only be achieved by including novel network reinforcement measures. In this case, the most cost-effective measure is exchanging the transformer with an RDT, which allows boosting the voltage into the permissible range during operation when necessary. This leads to savings in the reinforcement strategy of approximately 80% compared to traditional reinforcement. Although the power flow increases further in DG2040, no further network constraints arise due to the positive effect of the measures taken for BE2020. For the two urban LV networks, no network constraints are expected for neither scenario BE2020, nor DE2040. The voltage does not drop below approximately U / U n = 93 %   and the transformers are loaded at 47% and 87% of the maximum value. Table 3 lists the absolute costs of the two different planning variants for the rural network. The reinforcement costs were assumed at Norwegian price level and are presented in €.

3.3. Variants of the EV Study

To further investigate the resilience of the three networks towards further load increase due to EV charging, two different variants are analyzed. On the one hand, a more progressive EV charging behavior is simulated. On the other hand, the EV hosting capacity is quantified.

3.3.1. 11 kW Fast Charging and 100% EV Penetration

When assuming that all LV customers possess an EV together with a fast-charging station rated P ch = 11 kW in 2040 the equivalent PL for each customer further increases. The determined values can be obtained from Table 4.
Concerning the rural network, in line with the growing power flow, further thermal and voltage constraints arise. When solely considering traditional reinforcements, the transformer requires upgrading to S r = 400 kVA and six additional line sections including two new feeders starting from the LV bus bar are required with a conductor cross-section of least d c = 95 mm2 compared to the pure DE2040 scenario. The line upgrade amounts to 35% of the network’s length to be reinforced. The network graph including the reinforcement measure is shown in Figure 10.
In accordance with the results in Section 3.2, deploying an RDT with an equivalent type rating would be the most cost-effective measure to eliminate all network constraints. Approximately 19% of costs can be saved by following the latter strategy compared to the traditional reinforcement. Also, in the urban networks the installed capacity is not sufficient anymore to host the amount of EV charging power. Although in the first network the voltage drops below the permissible lower limit, in the second urban network several lines and the transformer are overloaded. Table 5 summarizes the cost-effective traditional reinforcement measures to be taken.
In Urban 1, the maximum line loading is I / I max = 97%. It is conclusive that in Urban 1 undervoltages occur before thermal constraints in contrast to Urban 2, as the load density is much lower and the specific circuit length per feeder is higher. On the other hand, in dense urban networks, indeed the line sections closest to the transformer, those loaded most to supply the customers until the end of the branches of the networks, are expected to be overloaded first. The costs of the planning variants are listed in Table 6. In both urban networks, the costs of the novel planning variants consist only of cable costs, as no novel measures are more cost-effective. In contrast to the findings for the rural network, the traditional reinforcement is also the most cost-effective choice. This is mainly due to the very short line section to be installed. The relatively high construction costs do not weigh that much in this case.

3.3.2. EV Hosting Capacity

The maximum hosting capacity per customer, right before planning limits are violated, is calculated for the networks as well. The network Urban 1 can host up to 11.6 kW per customer and the network Urban 2 up to 4.5 kW per customer. Two variants with different charging powers are assumed. For each of the two networks the status quo mix charging power is assumed and a future scenario in which all EVs charge at 11 kW. For each of these four options, the arithmetic mean of EVs per household is calculated (number of EVs divided by the number of households). The results are listed in Table 7.
As it can be deduced from Table 7, the network Urban 1 can host almost two EVs for each household if the current EV mix is assumed. For all the other variants, the hosting capacity is reached before each household owns one EV. The network Urban 2 reaches its hosting capacity for EVs at relatively low EV penetration rates of 30% to 40% of all network customers. For this network, the difference between the variant status quo mix and 11 kW charging is not as high as in the network Urban 1. This can be attributed mainly to the different network topologies and arising network constraints.

3.4. Summary and Comparison of the Results

The presented methodologies could be verified, and some general indications strengthened, as the results are in line with the literature. The resulting EV hosting capacity is higher than in [25] where the altered IEEE-34-network with 30% EV share and uncoordinated charging-based data for Belgium is assumed. The findings of this article are also comparable to [26] which calculated an EV hosting capacity of 31–100% for 3.7 kW charging and 29–35% for 11 kW charging and indicates that urban networks show more thermal constraints than rural networks do. The higher EV penetration rates of this article compared to [25,26] can be explained with the high PL in Norway for residential customers and the resulting dimensioning of the network assets for higher loads. This can be clearly seen as the uncoordinated charging of [25] leads to an increase of 36% of the PL, whereas in this article the PL (with the same EV share and the status quo EV mix) leads to an increase of less than 5%. With this study, it was confirmed that with a conservative charging behavior with mainly 3.7 kW and at a low integration rate of EVs, only a few or minor network constraints are expected at LV level. (cf. [20,26,27]) More frequent network constraints can be expected for the period towards 2030 with scenarios expecting a higher penetration of EVs (cf. [28,29]) or when assuming higher charging capacity of at least 11 kW (cf. [22]). As in the analyzed rural network, it is usually the transformer that requires upgrading before any other equipment (cf. [27]). The findings of [14,26] that higher network investments are required in urban areas compared to rural areas—if only traditional reinforcement measures are taken into account—were confirmed. Nevertheless, not enough networks were analyzed to draw a general conclusion and it needs to remain an indication worth further investigation.

4. Conclusions

In this article, methods are presented to consider the growing penetration of EV charging in distribution networks planning at LV level. Based on measurements, the increase of the equivalent load of customers is determined and used within a GA, which executes automated network planning considering various reinforcement measures.
It becomes clear that the PL for network planning purposes grows linearly with the increasing share of EV in the analyzed network areas for more than five households. The PL of residential households for network planning purposes may rise by up to 13% if it is assumed that all households own an EV (100% EV share) and follow the charging pattern and power of the status quo EV mix in Norway in 2018.
In the near future, the further integration of electric mobility in rural networks will above all lead to transformer overloads and voltage constraints. For the rural networks, the use of a higher-rated RDT is suitable, since the voltage constraint and thermal overloading of the transformer can be solved cost-effectively with one measure. Following the ENTSO TYNDP 2018 scenarios, the studied urban Norwegian network are well prepared for electric mobility and reinforcements are not necessary. However, assuming a full penetration of EVs and all charging with 11 kW, voltage constraints are expected arise. Due to thermal overloading of cables, traditional measures are also competitive here and represent an economically viable solution. This leads to the assumption that network-specific individual planning decisions have to be made, which can be facilitated by using automated planning, taking into account the load development caused by EVs.

Author Contributions

Conceptualization, J.W., K.C. and M.R.; Methodology, J.W., K.C. and M.R.; Project administration, H.S. and M.Z.; Resources, H.S and M.Z.; Software, J.W., K.C. and M.R.; Supervision, H.S. and M.Z.; Validation, J.W., K.C. and M.R.; Writing—original draft, J.W., K.C. and M.R.; Writing—review & editing, H.S. and M.Z. All authors have read and agreed to the published version of the manuscript.

Funding

This research was funded by within the projects SmartGuide (grant no 64603) and FuChar (grant no 295133/E20).

Institutional Review Board Statement

Not applicable.

Informed Consent Statement

Not applicable.

Acknowledgments

Thanks to M. Degefa the authors could also apply the 11 kW EV charging profiles.

Conflicts of Interest

The authors declare no conflict of interest.

Notations

A f Set of all feeders (starting at LV bus bar)
A i Set of all nodes
A i j Set of all lines
A ˜ i j Set of additional lines
A s Set of substation upgrades
A trafo Set of substation upgrades with conventional transformer
A RDT Set of substation upgrades with regulated distribution transformer (RDT)
b p Base population
c Cost of network reinforcement
c i j τ Cost of installing a line from node i to j with line type τ
c s τ Cost of upgrading the substation with a transformer of type τ
c r τ Cost of installing a line voltage regulator of type τ
c Aggregated cost of network reinforcement
f Feeder
I i j Current running through the line from node i to node j
I i j , max Maximum permitted current for the line from node i to node j
n Number of (end customers, genes)
n i j Number of parallel lines of line ij
n r , f Number of LVRs in feeder f
P Equivalent (active) power
P i Active power injected at node i
Q i Reactive power injected at node i
P L Peak load
S F Simultaneity factors
S r Apparent power rating of an LVR
S r , max Maximum apparent power loading of an LVR
S s Apparent power rating of substation transformer
S s , max Maximum apparent power loading of substation transformer
U i Nodal voltage at node i
U max Maximum permitted voltage
U min Minimum permitted voltage
U n Nominal voltage of the network
τ Type (of line, substation upgrade, voltage regulator)

References

  1. CIGRE. Technical Brochure 591, Planning and Optimization Methods for Active Distribution Systems; Working Group C6.19. 2014. Available online: https://d1wqtxts1xzle7.cloudfront.net/51777692/2014_CIGRE_Brochure_591_-_Planning_and_Optimization_Methods_for_Active_Distribution_Systems.pdf?1487001402=&response-content-disposition=inline%3B+filename%3DPlanning_and_Optimization_Methods_for_Ac.pdf&Expires=1615802157&Signature=duLYQoc4mTuuQacrt0V-JmI2nCm8FPfClRp7VMHQ~WUb77z-KyeSS00RvENXUN7EFfJvbb-fsu41eQ~buLvNbl-CmoHM7dIeAAbmWpirZPfrCw16xWKbnoMNvbd4iHA3vy-1AF6pTCapKG5VqliNY2sCpIsG54NZGv~lV7IINFgPplDfosjvS82pNlb2se27qPsJDgJmqpRgTy8aeJo6KLRom-XyFx701QJqsWJOrNMR5zhtoPQjA8ITanJJOlvcl12QNzVRcQoc6GiZKdfS6U6gyV8~jJ9ghKbKGBZdT3O2MNCquFRmrYva4rCYoqH3oL-57zU7j1WqVdTPnhGCIg__&Key-Pair-Id=APKAJLOHF5GGSLRBV4ZA (accessed on 15 January 2020).
  2. Patzack, S.; Vennegeerts, H.; Moser, A. Determination of relevant network planning cases. In Proceedings of the 24th International Conference on Electricity Distribution (CIRED), Glasgow, UK, 12–15 June 2017. [Google Scholar]
  3. Yao, W.; Zhao, J.; Wen, F.; Dong, Z.; Xue, Y.; Xu, Y.; Meng, K. A Multi-Objective Collaborative Planning Strategy for Integrated Power Distribution and Electric Vehicle Charging Systems. IEEE Trans. Power Syst. 2014, 29, 1811–1821. [Google Scholar] [CrossRef]
  4. Yao, W.; Chung, C.Y.; Wen, F.; Qin, M.; Xue, Y. Scenario-Based Comprehensive Expansion Planning for Distribution Systems Considering Integration of Plug-in Electric Vehicles. IEEE Trans. Power Syst. 2015, 31, 317–328. [Google Scholar] [CrossRef]
  5. Wang, X.; Nie, Y.; Cheng, K.-W.E. Distribution System Planning Considering Stochastic EV Penetration and V2G Behavior. IEEE Trans. Intell. Transp. Syst. 2020, 21, 149–158. [Google Scholar] [CrossRef]
  6. da Silva, E.L.; Gil, H.A.; Areiza, J.M. Transmission network expansion planning under an improved genetic algorithm. In Proceedings of the 21st International Conference on Power Industry Computer Applications, Santa Clara, CA, USA, 16–21 May 1999; IEEE: Piscataway, NJ, USA, 1999; pp. 315–321. ISBN 0-7803-5478-8. [Google Scholar]
  7. Diaz-Dorado, E.; Cidras, J.; Miguez, E. Application of evolutionary algorithms for the planning of urban distribution networks of medium voltage. IEEE Trans. Power Syst. 2002, 17, 879–884. [Google Scholar] [CrossRef]
  8. Camargo, V.; Lavorato, M.; Romero, R. Specialized genetic algorithm to solve the electrical distribution system expansion planning. In Proceedings of the IEEE Power and Energy Society General Meeting (PES), Vancouver, BC, Canada, 21–25 July 2013; IEEE: Piscataway, NJ, USA, 2013; ISBN 978-1-4799-1303-9. [Google Scholar]
  9. Ramirez-Rosado, I.; Bernal-Agustin, J. Genetic algorithms applied to the design of large power distribution systems. IEEE Trans. Power Syst. 1998, 13, 696–703. [Google Scholar] [CrossRef]
  10. Scheidler, A.; Thurner, L.; Braun, M. Heuristic optimisation for automated distribution system planning in network integration studies. IET Renew. Power Gener. 2018, 12, 530–538. [Google Scholar] [CrossRef] [Green Version]
  11. Celli, G.; Pilo, F.; Pisano, G.; Soma, G. Optimal Planning of Active Networks. In Proceedings of the 16th Power Systems Computation Conference (PSCC), Glasgow, UK, 14–18 July 2008; Curran: Red Hook, NY, USA, 2008; ISBN 9781617388576. [Google Scholar]
  12. Jordehi, A.R. Optimisation of electric distribution systems: A review. Renew. Sustain. Energy Rev. 2015, 51, 1088–1100. [Google Scholar] [CrossRef]
  13. Wruk, J.; Cibis, K.; Zdrallek, M.; Landsverk, H. Automated planning of smart low voltage networks using an evolutionary algorithm. In Proceedings of the 25th International Conference on Electricity Distribution (CIRED), Madrid, Spain, 3–6 June 2019. [Google Scholar]
  14. Fernandez, L.P.; Roman, T.G.S.; Cossent, R.; Domingo, C.M.; Frias, P. Assessment of the Impact of Plug-in Electric Vehicles on Distribution Networks. IEEE Trans. Power Syst. 2011, 26, 206–213. [Google Scholar] [CrossRef]
  15. Stetz, T.; Wolf, H.; Probst, A.; Eilenberger, E.; Drenan, Y.-M.S.; Kämpf, E.; Schöllhorn, D.; Schmidt, S. Stochastic Analysis of Smart-Meter Measurement Data. In Proceedings of the VDE-Kongress, Stuttgart, Germany, 5–6 November 2012. [Google Scholar]
  16. Stetz, T. Autonomous Voltage Control Strategies in Distribution Grids with Photovoltaic Systems: Technical and Economic Assessment. Master’s Thesis, University of Kassel, Kassel, Germany, 2014. [Google Scholar]
  17. Georgilakis, P.S.; Hatziargyriou, N.D. A review of power distribution planning in the modern power systems era: Models, methods and future research. Electr. Power Syst. Res. 2015, 121, 89–100. [Google Scholar] [CrossRef]
  18. Norwegian Statistics Bureau. Energy Consumption in Households. Available online: https://www.ssb.no/en/energi-og-industri/statistikker/husenergi/hvert-3-aar (accessed on 15 January 2020).
  19. Norwegian Electric Vehicle Association. Norwegian EV Owners Survey. 2017. Available online: https://elbil.no/ (accessed on 15 January 2020).
  20. Degefa, M.Z.; Sæle, H.; Andresen, C. Analysis of Future Loading Scenarios in a Norwegian LV Network. In Proceedings of the International Conference on Smart Energy Systems and Technologies (SEST), Porto, Portugal, 9–11 September 2019; IEEE: Piscataway, NJ, USA, 2019; ISBN 978-1-7281-1156-8. [Google Scholar]
  21. Norwegian Statistics Bureau. Statistics Norway. Available online: https://www.ssb.no/ (accessed on 15 January 2020).
  22. Navigant; Kompetenzzentrum Elektromobilität; RE-xpertise. Verteilnetzausbau für die Energiewende, Commissioned by Agora Verkehrswende, Agora Energiewende and The Regulatory Assistance Project (RAP). 2019. Available online: https://static.agora-energiewende.de/fileadmin2/Projekte/2018/Netzausbau_Elektromobilitaet/Agora-Verkehrswende_Agora-Energiewende_EV-Grid_WEB.pdf (accessed on 15 January 2020).
  23. Olivella-Rosell, P.; Villafafila-Robles, R.; Sumper, A.; Bergas-Jané, J. Probabilistic Agent-Based Model of Electric Vehicle Charging Demand to Analyse the Impact on Distribution Networks. Energies 2015, 8, 4160–4187. [Google Scholar] [CrossRef]
  24. Entsog; Entso-E. TYNDP 2018 Scenario Report. Main Report; Brussels. 2018. Available online: https://www.entsog.eu/sites/default/files/files-old-website/publications/TYNDP/2018/entsos_tyndp_2018_Final_Scenario_Report.pdf (accessed on 15 January 2020).
  25. Clement-Nyns, K.; Haesen, E.; Driesen, J. The Impact of Charging Plug-In Hybrid Electric Vehicles on a Residential Distribution Grid. IEEE Trans. Power Syst. 2009, 25, 371–380. [Google Scholar] [CrossRef] [Green Version]
  26. Stoeckl, G.; Witzmann, R.; Eckstein, J. Analyzing the capacity of low voltage grids for electric vehicles. In Proceedings of the IEEE Electrical Power and Energy Conference (EPEC), Winnipeg, MB, Canada, 3–5 October 2011; IEEE: Piscataway, NJ, USA, 2011; pp. 415–420. ISBN 978-1-4577-0405-5. [Google Scholar]
  27. Probst, A.C.; Braun, M.; Backes, J.; Tenbohlen, S. Probabilistic analysis of voltage bands stressed by electric mobility. In Proceedings of the 2nd IEEE PES International Conference and Exhibition on Innovative Smart Grid Technologies (ISGT Europe), Manchester, UK, 5–12 December 2011; IEEE: Piscataway, NJ, USA, 2011; ISBN 978-1-4577-1421-4. [Google Scholar]
  28. Cross, J.D.; Hartshorn, R. My Electric Avenue: Integrating Electric Vehicles into the Electrical Net-works. In Proceedings of the 6th Hybrid and Electric Vehicles Conference (HEVC 2016), London, UK, 2–3 November 2016; Curran Associates Inc.: Red Hook, NY, USA, 2017; ISBN 978-1-78561-294-7. [Google Scholar]
  29. Papadopoulos, P.; Skarvelis-Kazakos, S.; Grau, I.; Cipcigan, L.; Jenkins, N. Electric vehicles’ impact on British distribution networks. IET Electr. Syst. Transp. 2012, 2, 91. [Google Scholar] [CrossRef]
Figure 1. Flow chart of the stochastic analysis of smart meter and EV data.
Electricity 02 00006 g001
Figure 2. Chromosome design of the GA.
Electricity 02 00006 g002
Figure 3. Flow chart of the automated network planning approach applying a genetic algorithm.
Electricity 02 00006 g003
Figure 4. Peak load variation for winter weekend data set. Application of different percentiles to the data set. Literature value: Stetz et al. 2012 [15] for fully electrified households in Germany.
Electricity 02 00006 g004
Figure 5. Probability of charging within a certain hour of the day, based on a survey of 12,665 EV owners in Norway for the status quo (black) [19]; and own simulated values for 11 kW charging (grey).
Electricity 02 00006 g005
Figure 6. Increase of the peak load caused by electric vehicle charging at home depending on the number of households, charging power, and share of electric vehicles for the considered households.
Electricity 02 00006 g006
Figure 7. Parameter fit using residential smart meter data and EV data for the characteristic period with highest peak load.
Electricity 02 00006 g007
Figure 8. Simultaneity factors for Norwegian MV/LV network planning for residential EV power based on status quo data of EV charging and power and a future scenario (solid lines). [Ago19] are values of [22] for German residential areas (dashed lines).
Electricity 02 00006 g008
Figure 9. Schematic graph of the traditionally reinforced rural network.
Electricity 02 00006 g009
Figure 10. Schematic graph of the traditionally reinforced rural network with 11kW fast charging and 100% EV penetration.
Electricity 02 00006 g010
Table 1. Characteristics of analyzed networks.
ClassificationTrafo Capacity in kVANumber of
Customers
Line Length in kmPL in kW
Rural200273.45.86
Urban 1315120.757.8
Urban 2500870.893.7
Table 2. Equivalent peak load in kW for each network and scenario.
NetworkScenarioPL in kW
Rural 1BE20206.7
DG20407.0
Urban1BE202010.0
DG204010.5
Urban 2BE20203.8
DG20404.3
Table 3. Absolute costs of planning variants of the rural network.
Networks/ScenariosTraditionalNovel
Rural BE202018.032 €3.693 €
Table 4. Equivalent PL per customer in the scenario variants.
NetworkScenarioVariantPL in kW
Rural 1DG2040Pch = 11 kW8.5
Urban 1DG2040Pch = 11 kW11.0
Urban 2DG2040Pch = 11 kW5.5
Table 5. Overview of planning implications.
ScenarioConstraintOptimal Measure
Urban 1, 100% EV at 11 kWUndervoltage
  • 1 parallel line section with (16 m) at the end of one feeder
Urban 2, 100% EV at 11 kWThermal
  • 1 parallel line section with (26 m) at the beginning of one feeder
  • Sr,trafo = 630 kVA
Table 6. Network reinforcement costs for 100 % EV and 11 kW charging stations.
Networks/ScenariosTraditionalNovel
Rural DG2040 11 kW41.438 €4.128 €
Urban 1 DG2040 11 kW2.084 €2.084 €
Urban 2 DG2040 11 kW533 €533 €
Table 7. Overview of EV hosting capacity.
NetworkVariantEVs per HH
Urban 1Status quo mix1.8
Urban 111 kW charging0.8
Urban 2Status quo mix0.4
Urban 211 kW charging0.3
Publisher’s Note: MDPI stays neutral with regard to jurisdictional claims in published maps and institutional affiliations.

