The Business Side of Ecosystem Services of Soil Systems
by
 ,
,
Elena A. Mikhailova
1,*, 
Christopher J. Post
1, 
Mark A. Schlautman
2,
Gregory C. Post
3 and
Hamdi A. Zurqani
1,4
1
Department of Forestry and Environmental Conservation, Clemson University, Clemson, SC 29634, USA
2
Department of Environmental Engineering and Earth Sciences, Clemson University, Anderson, SC 29625, USA
3
Economics Department, Reed College, Portland, OR 97202, USA
4
Department of Soil and Water Sciences, University of Tripoli, Tripoli 13538, Libya
*
Author to whom correspondence should be addressed.
Earth 2020, 1(1), 15-34; https://0-doi-org.brum.beds.ac.uk/10.3390/earth1010002
Submission received: 19 June 2020
/
Revised: 20 July 2020
/
Accepted: 20 July 2020
/
Published: 22 July 2020
Abstract
:Current applications of the Ecosystems Services (ES) framework to soils are narrowly defined (e.g., soil-based, pedosphere-based, etc.), and focus on soil properties while treating soil as a closed system. Because soil is an open system, it receives and loses matter across its boundaries within Earth’s spheres (atmosphere, biosphere, hydrosphere, lithosphere, ecosphere, and anthroposphere), which also need to be accounted for in economic analysis. In market economies, the market transforms resources from the Earth’s pedosphere and related spheres into goods and services for societal welfare with non-market institutions mediating human and environmental interactions. These transformations and mediations can result not only in welfare but damages as well. The concept of soil ES and ecosystem disservices (ED) is a human-centered framework, which can be a useful tool in business decision-making. Soil ES (e.g., provisioning, regulation/ maintenance, and cultural) are used to produce goods and services, but the value of these ES and ED are not always accounted for as a part of business decision-making. The objective of this review is to illustrate the monetary valuation of ecosystem services of soil systems (SS) with examples based on the organizational hierarchy of soil systems. The organizational hierarchy of soil systems can be used in economic valuations of soil ES by scale (e.g., world, continent), time (e.g., soil, geologic), qualitative and quantitative degrees of computation (e.g., mental, verbal, descriptive, mathematical, deterministic, stochastic), and degree of complexity (e.g., mechanistic, empirical). Soil survey databases, soil analyses, Soil Data Systems (SDS), and Soil Business Systems (SBS) provide tools and a wide range of quantitative/qualitative data and information to evaluate goods and services for various business applications, but these sources of soil data may be limited in scope due to their static nature. Valuation of soil resources based on soil and non-soil science databases (e.g., National Atmospheric Deposition Program (NADP) databases, etc.) is critically needed to account for these ES/ED as part of business decision-making to provide more sustainable use of soil resources. Since most ecosystems on Earth have been modified by human activity, “soil systems goods and services” (SSGS) may be a more applicable term to describe soil contributions (benefits/damages) to economic activity, compared to a term such as “soil ecosystem goods and services.”
1. Introduction
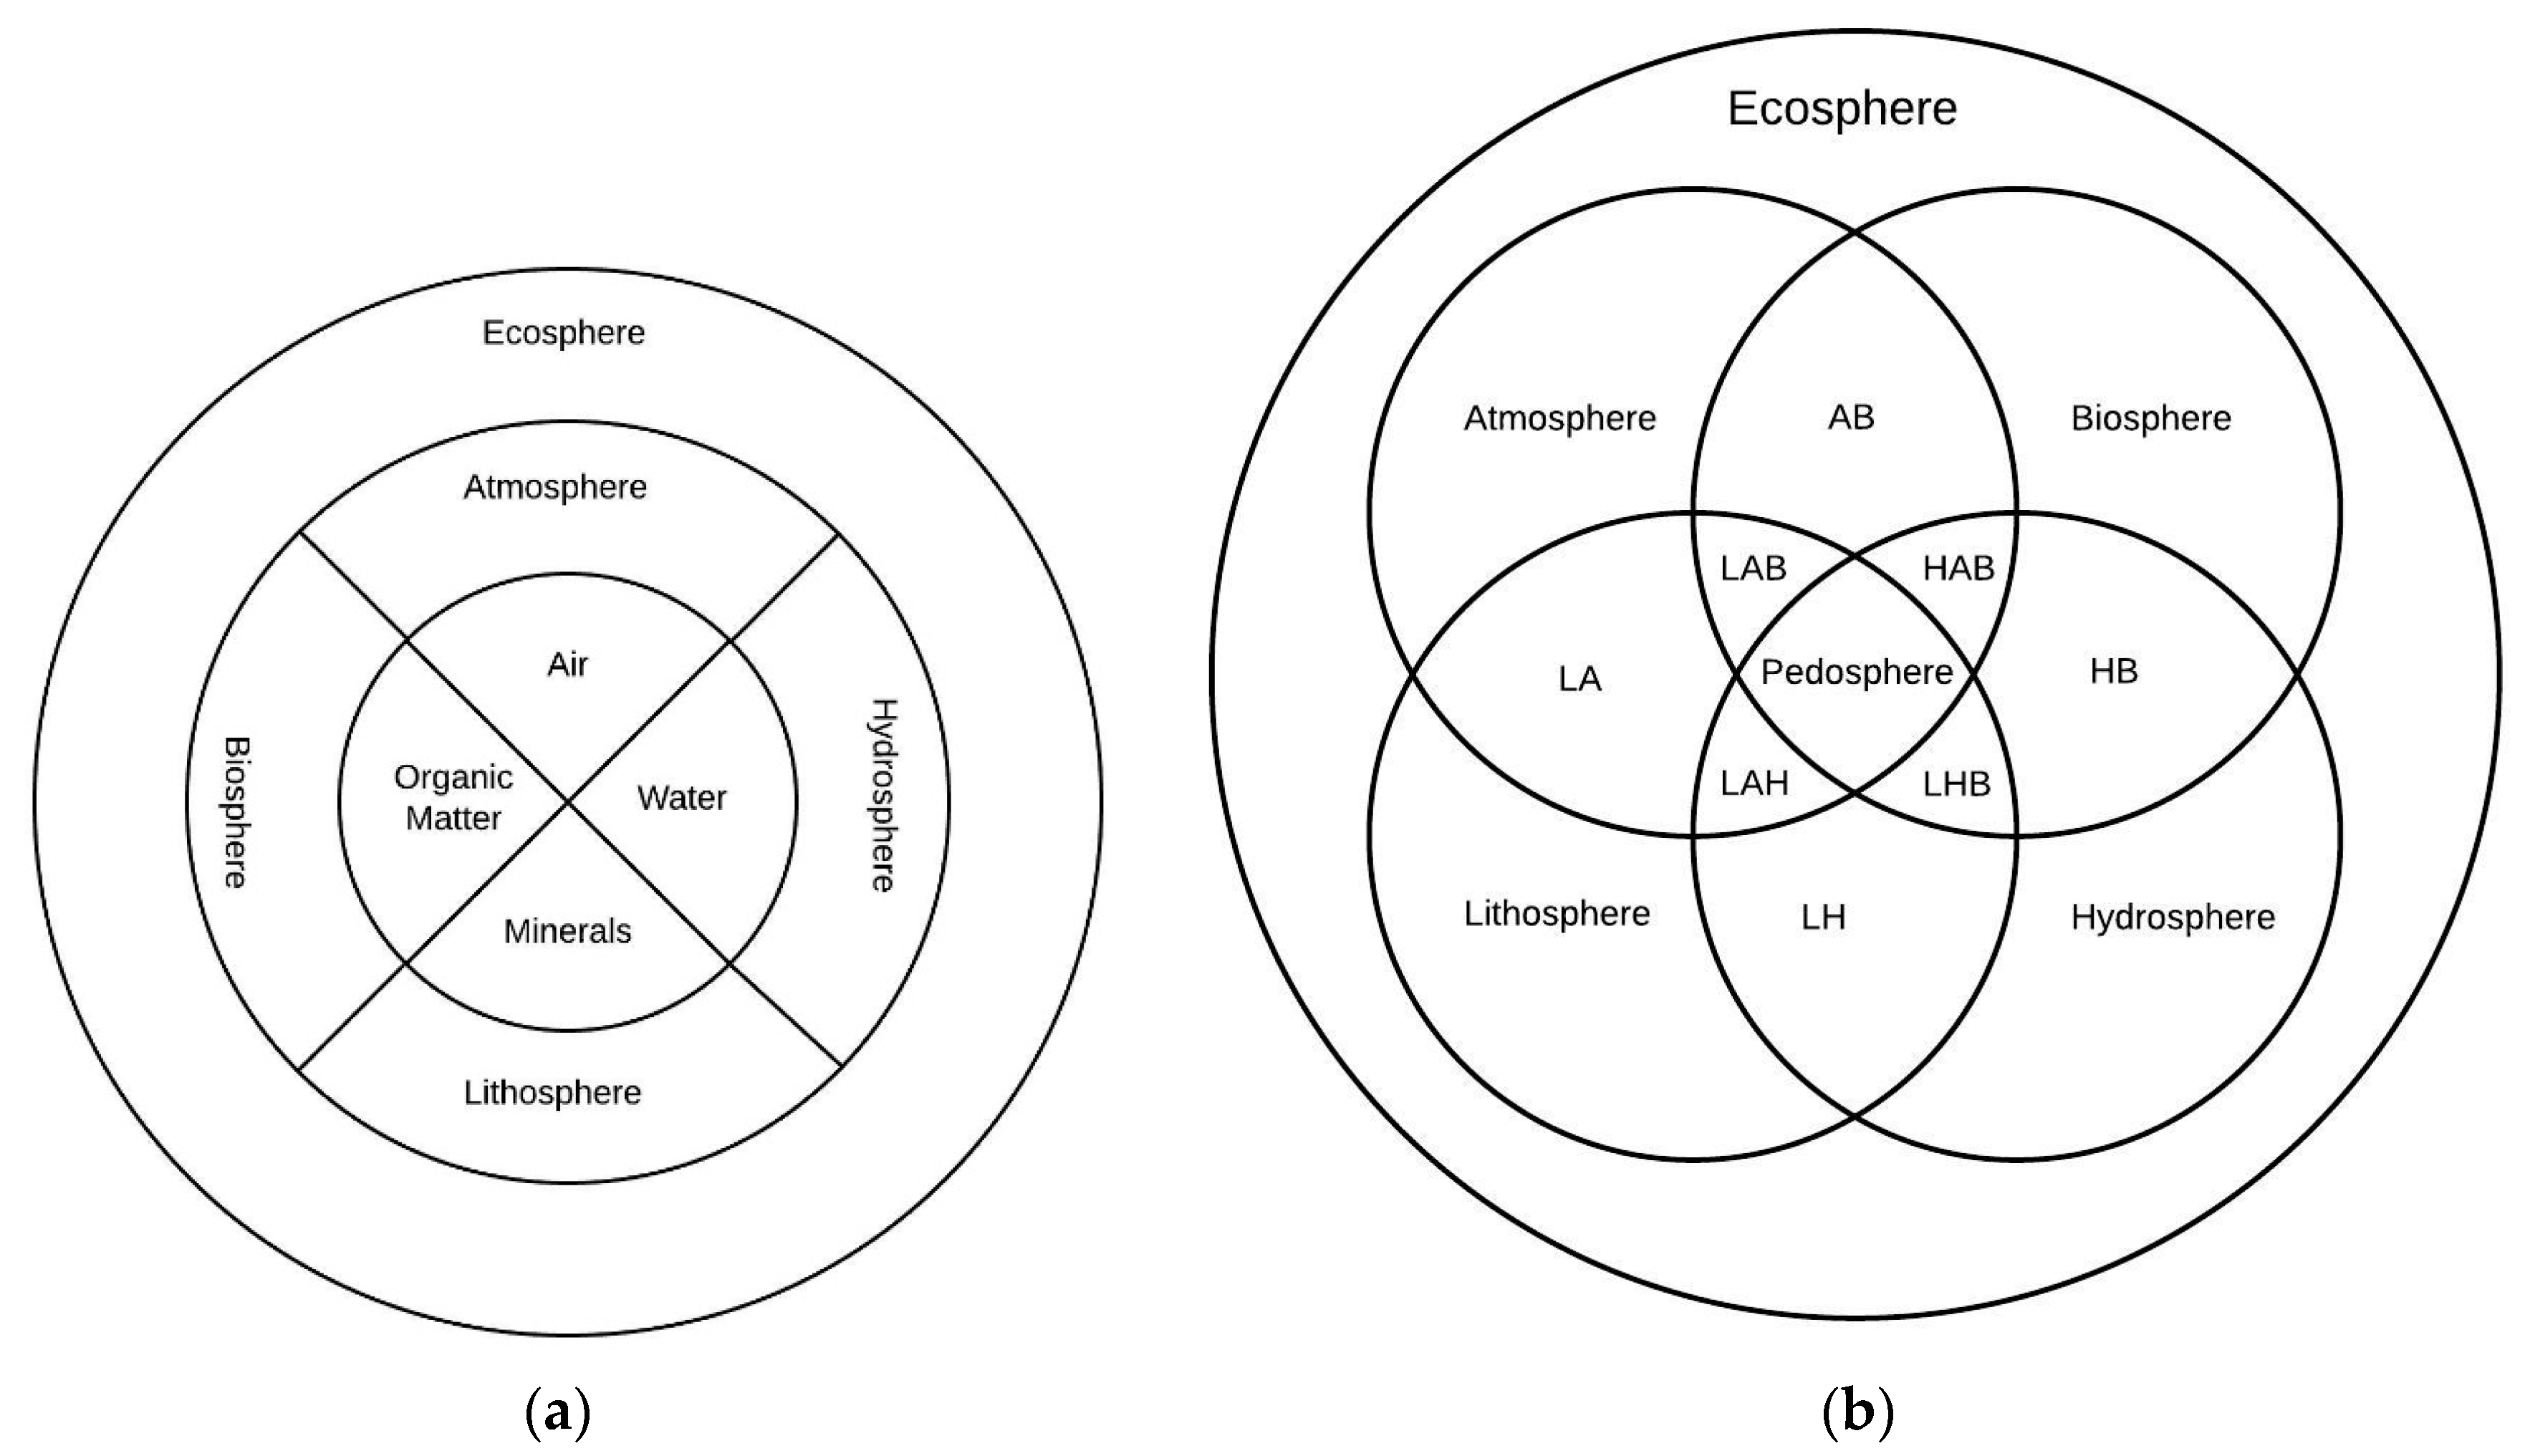
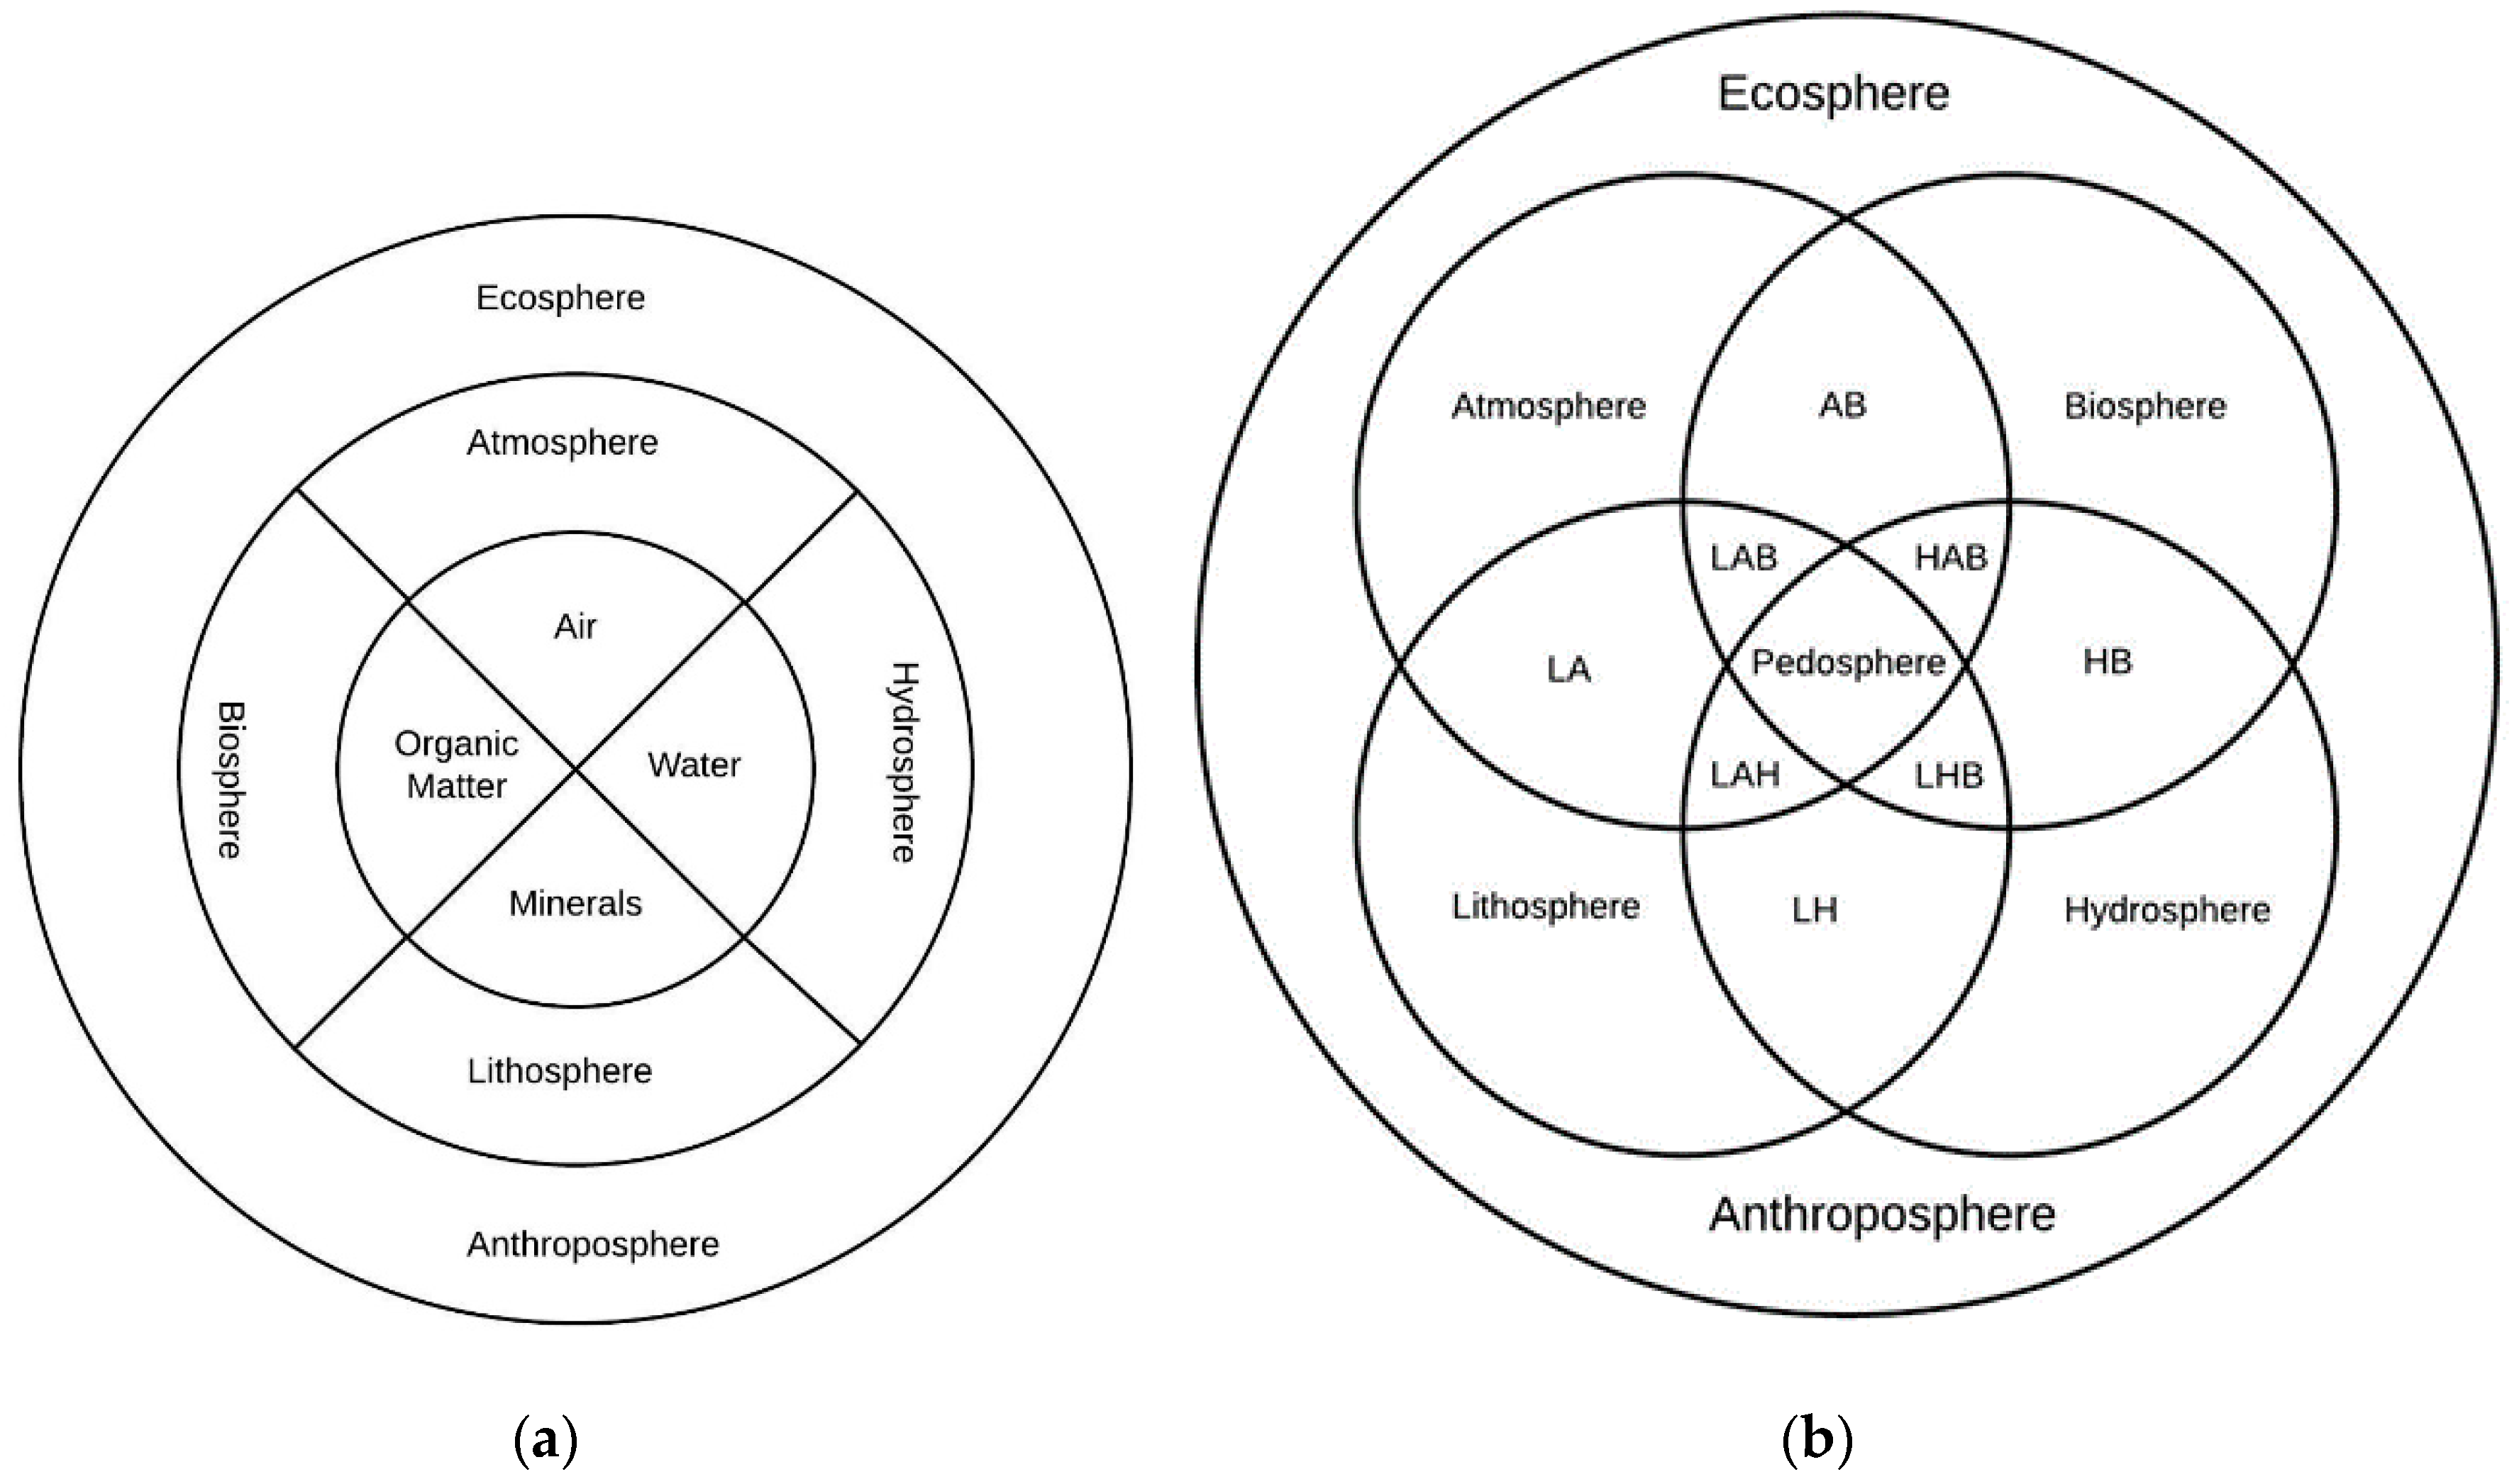
Ecological economics developed the concept of soil ecosystem services [1] (provisioning, regulation/maintenance, and cultural), which provide goods and services for various business systems [2], but its value often is not recognized due to the business community’s unfamiliarity with the importance of soil [3]. For example, Watson and Newton (2018) [2] conducted a survey of business dependencies on various Ecosystems Services (ES) (including soil) in the English county of Dorset, and found that many businesses indicated little or no dependence on soil. Indeed, the value of soil ES is difficult to measure and report for the business community because of the complex nature of soil [4]. While some may question the need to monetize soil [4], others advocate the use of monetary valuation as a means to engage the business community “to achieve scalable solutions” to soil and environmental degradation [2,3]. The word “scalable” is key to understanding the complexity of soil, both with its definition as well as its ES. The current definition of soil is “the layer(s) of generally loose mineral and/or organic material that are affected by physical, chemical, and/or biological processes at/or near the planetary surface and usually hold liquids, gases, and biota and support plants” [5] (Figure 1a). This definition is inclusive of soils on planet Earth and other planets [5]. Traditionally, the definition of soil is applied to Earth, which implies “the multi-phase dimension of soil” as a product of interaction of the Earth’s spheres (atmosphere, biosphere, hydrosphere, lithosphere) (Figure 1a). The pedosphere (from the Greek pedon = ground) is defined as “the soil mantle of the Earth” based on the “concept of soils as specific bodies in nature that developed in time and space in situ at the land surface due to processes resulting from interactions of soil-forming factors: parent material, climate, organisms, topography, and time” [6] (Figure 1b). According to Mattson, 1938 [7], not all soils form as a result of the interaction of the four of the Earth’s spheres, and two-sphere, and three-sphere combinations are possible. For example, some organic soils are formed from Earth’s three-sphere combinations (atmosphere, hydrosphere, and biosphere) (Figure 1b).
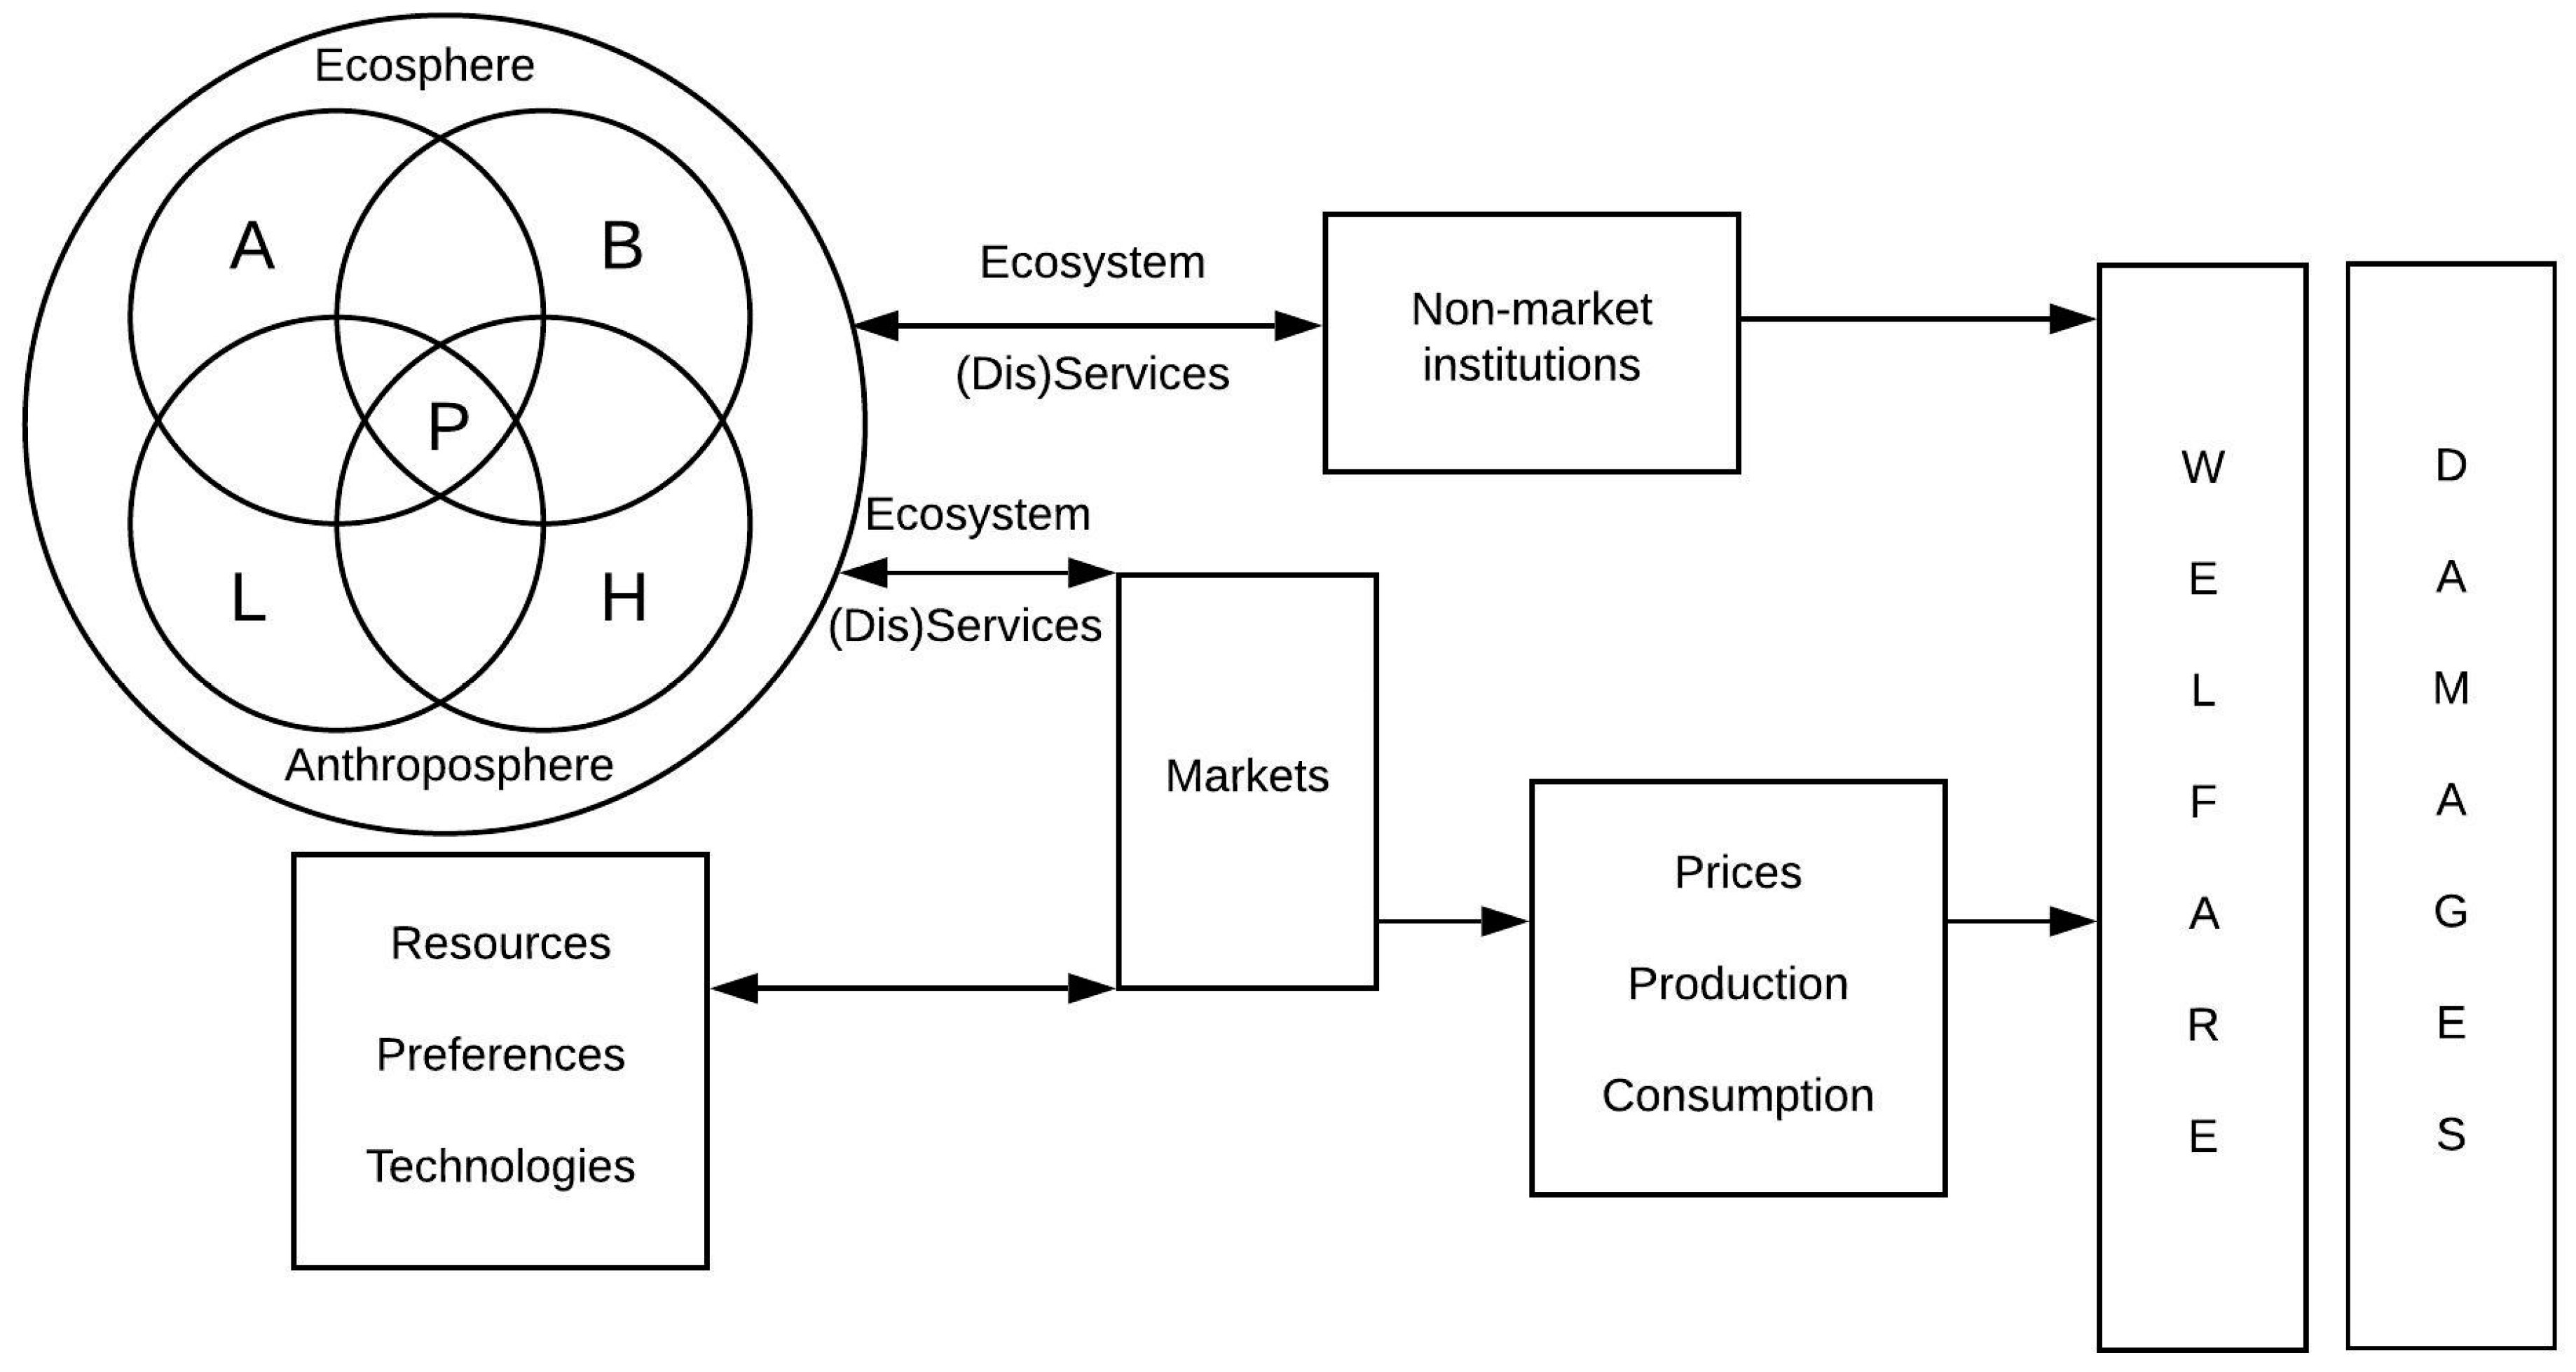
Humans use market and non-market tools to transform resources from the Earth’s spheres into goods and services for societal welfare, with non-market institutions mediating human and environmental interactions [8] (Figure 2). These transformations and mediations result not only in welfare but damages as well, adding another of Earth’s spheres—the anthroposphere (“realm of human society”) [6].
To understand the complex nature of soil, soil scientists have developed an organizational hierarchy of soil systems that is widely used for soil classification purposes [9,10]. Chandler et al. (2018) [11] proposed that frameworks for ES should be integrated with the organizational hierarchy of soil systems, which can be used for monetary valuation of soil ES by scale (e.g., world, continent), time (e.g., human, geologic), qualitative and quantitative degrees of computation (e.g., mental, verbal, descriptive, mathematical, deterministic, stochastic), and degree of complexity (e.g., mechanistic, empirical) (Table 1). According to Adhikari and Hartemink (2016) [12], soil scientists are reluctant to use the term “ecosystem services” [13] because many ecosystems on Earth have been modified by human activity. Therefore, soil systems goods and services (SSGS) may be a more acceptable term to describe soil benefits supplied to human societies compared to a term such as soil ecosystem goods and services (Table 1). The National Soil Survey Center (NSSC) provides a wide range of Soil Business Systems (SBS) tools to support the qualitative and quantitative assessment of soil systems business services. According to USDA/NRCS (2014) [14], SBS “application development includes, but is not limited to, NASIS (National Soils Database), Web Soil Survey, LIMS (Laboratory Management System), as well as 14 other soil applications and interfaces.” Soil survey databases and soil analyses provide a wide range of quantitative and qualitative data to evaluate SSGS for various business applications, but these sources of soil data may be limited in scope due to their static nature. Adhikari and Hartemink (2016) [12] provided a list of key soil properties related to ES, but this list is based on commonly used soil properties not originally intended for soil ES. Their list, therefore, may exclude important soil properties from ES valuations (e.g., calcium carbonates (%), which is a naturally present liming material in soils, soil organic matter (SOM), etc.) For example, soil inorganic carbon (SIC) and total soil carbon (TSC) currently are not included in Adhikari and Hartemink’s (2016) [12] list, but they do provide important ES [15,16,17]. Rawlins et al. [18] also documented the importance of inorganic carbon in soil carbon databases and stock estimates in England. The list of soil properties important for ES valuations may depend on individual/institutional preference (e.g., SOC versus SOM, etc.), and the availability of data in soil survey databases and field inventories.
Because soil is an open system, it receives and loses matter across its boundaries within Earth’s various spheres (atmosphere, biosphere, hydrosphere, lithosphere, ecosphere, and anthroposphere), which also need to be accounted for in business decision-making based on other databases (e.g., National Atmospheric Deposition Program (NADP) databases, etc.) The contribution of Earth’s spheres to the pedosphere and SSGSs also can be valued using the organizational hierarchy of soil systems (Table 1). Most studies on soil ES overlook the fact that soil is a product of the interactions of Earth’s spheres, which, therefore, make significant contributions to the pedosphere and SSGSs. Adhikari and Hartemink (2016) [12] stressed the importance of using holistic and interdisciplinary approaches to understanding soil ES. These approaches may require non-traditional methods of soil ES monetary valuations, which take into account the contribution of the Earth’s spheres to the pedosphere and SSGSs. The objective of this review is to illustrate the valuation of SSGS (including the contribution of Earth’s spheres to soil ES), with examples primarily from the U.S. based on the organizational hierarchy of soil systems, which may be applicable to other market economies.
2. Materials and Methods
2.1. Data Compilation
Examples of soil ES (including contribution of Earth’s spheres to soil ES), and its monetary valuations were obtained from various literature sources using the Web of Science (Clarivate Analytics, 2020 [19]). These examples encompass the three major groups of ES commonly used in the literature: provisioning, regulation/maintenance, and cultural [20].
2.2. The Accounting Framework
Table 2 provides a conceptual overview of the accounting framework for the market and non-market valuation of benefits/damages from three groups of ES (provisioning, regulation/maintenance, and cultural) based on biophysical and administrative accounts with examples primarily from the U.S. and its soils, as well as the related market-based information obtained from U.S. sources.
3. Results
3.1. Examples of Monetary Valuations Based on Soil Properties and Organizational Hierarchy of Soil Systems
3.1.1. Soil System (Scale)
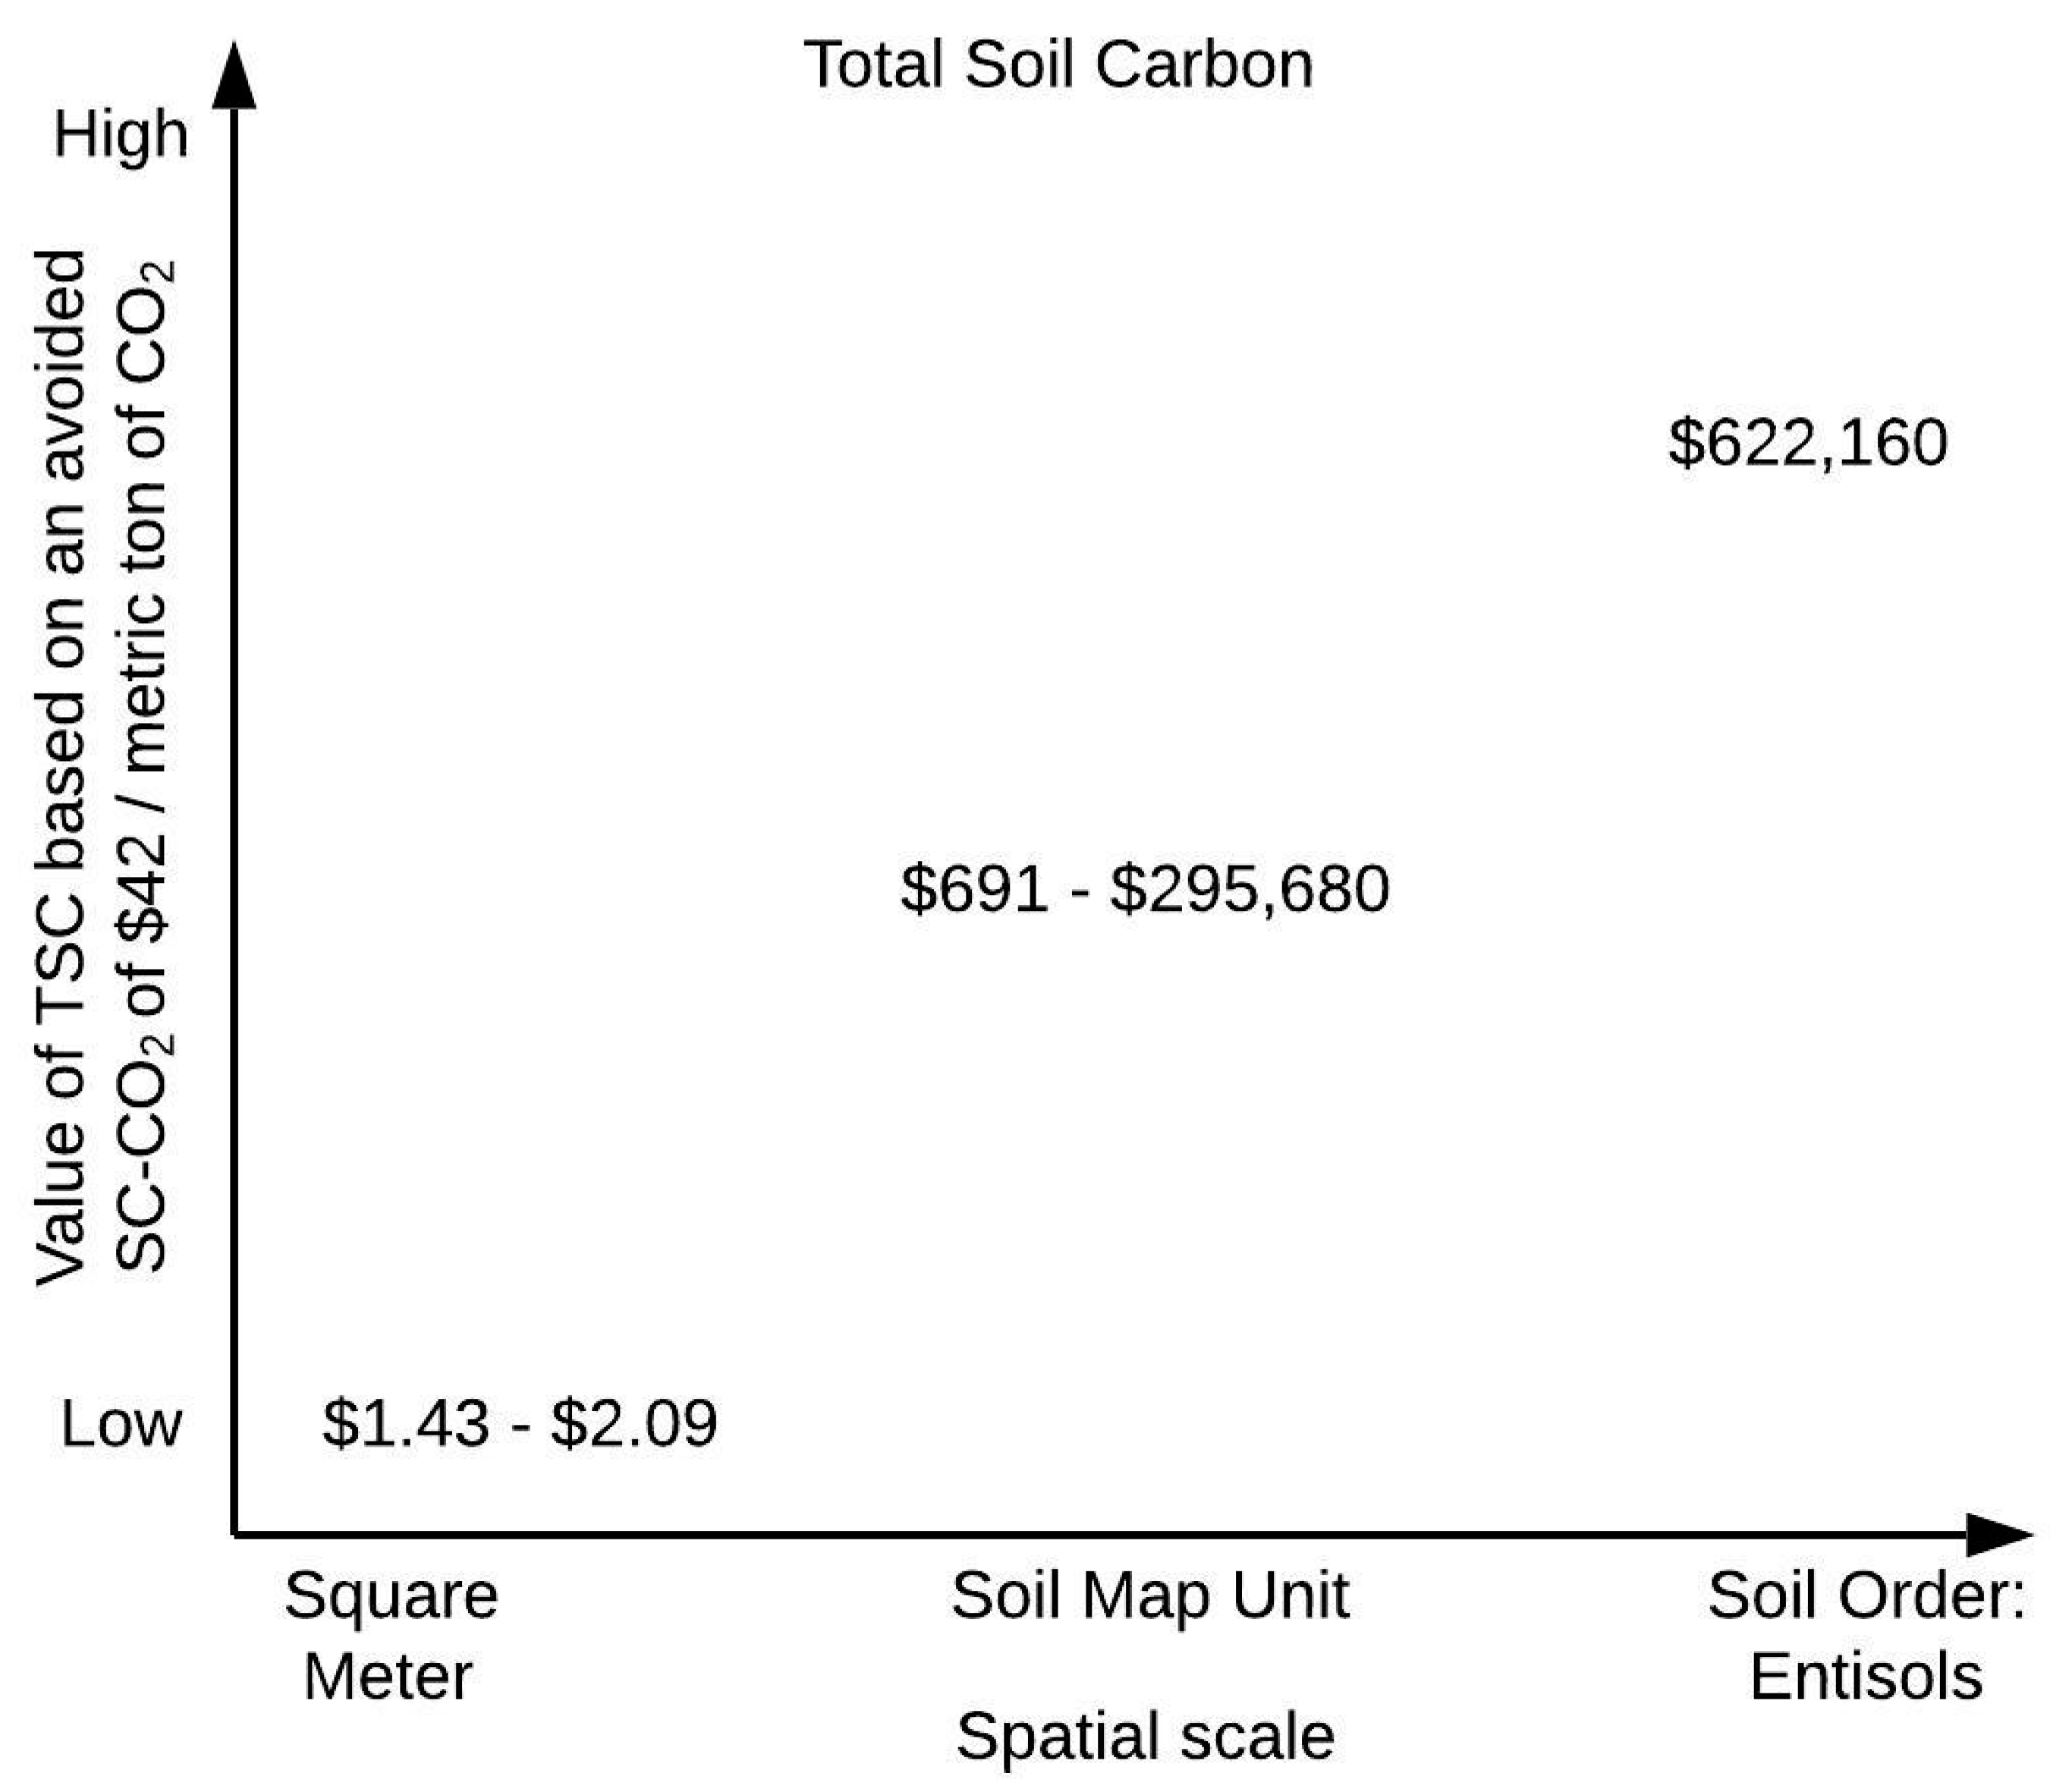
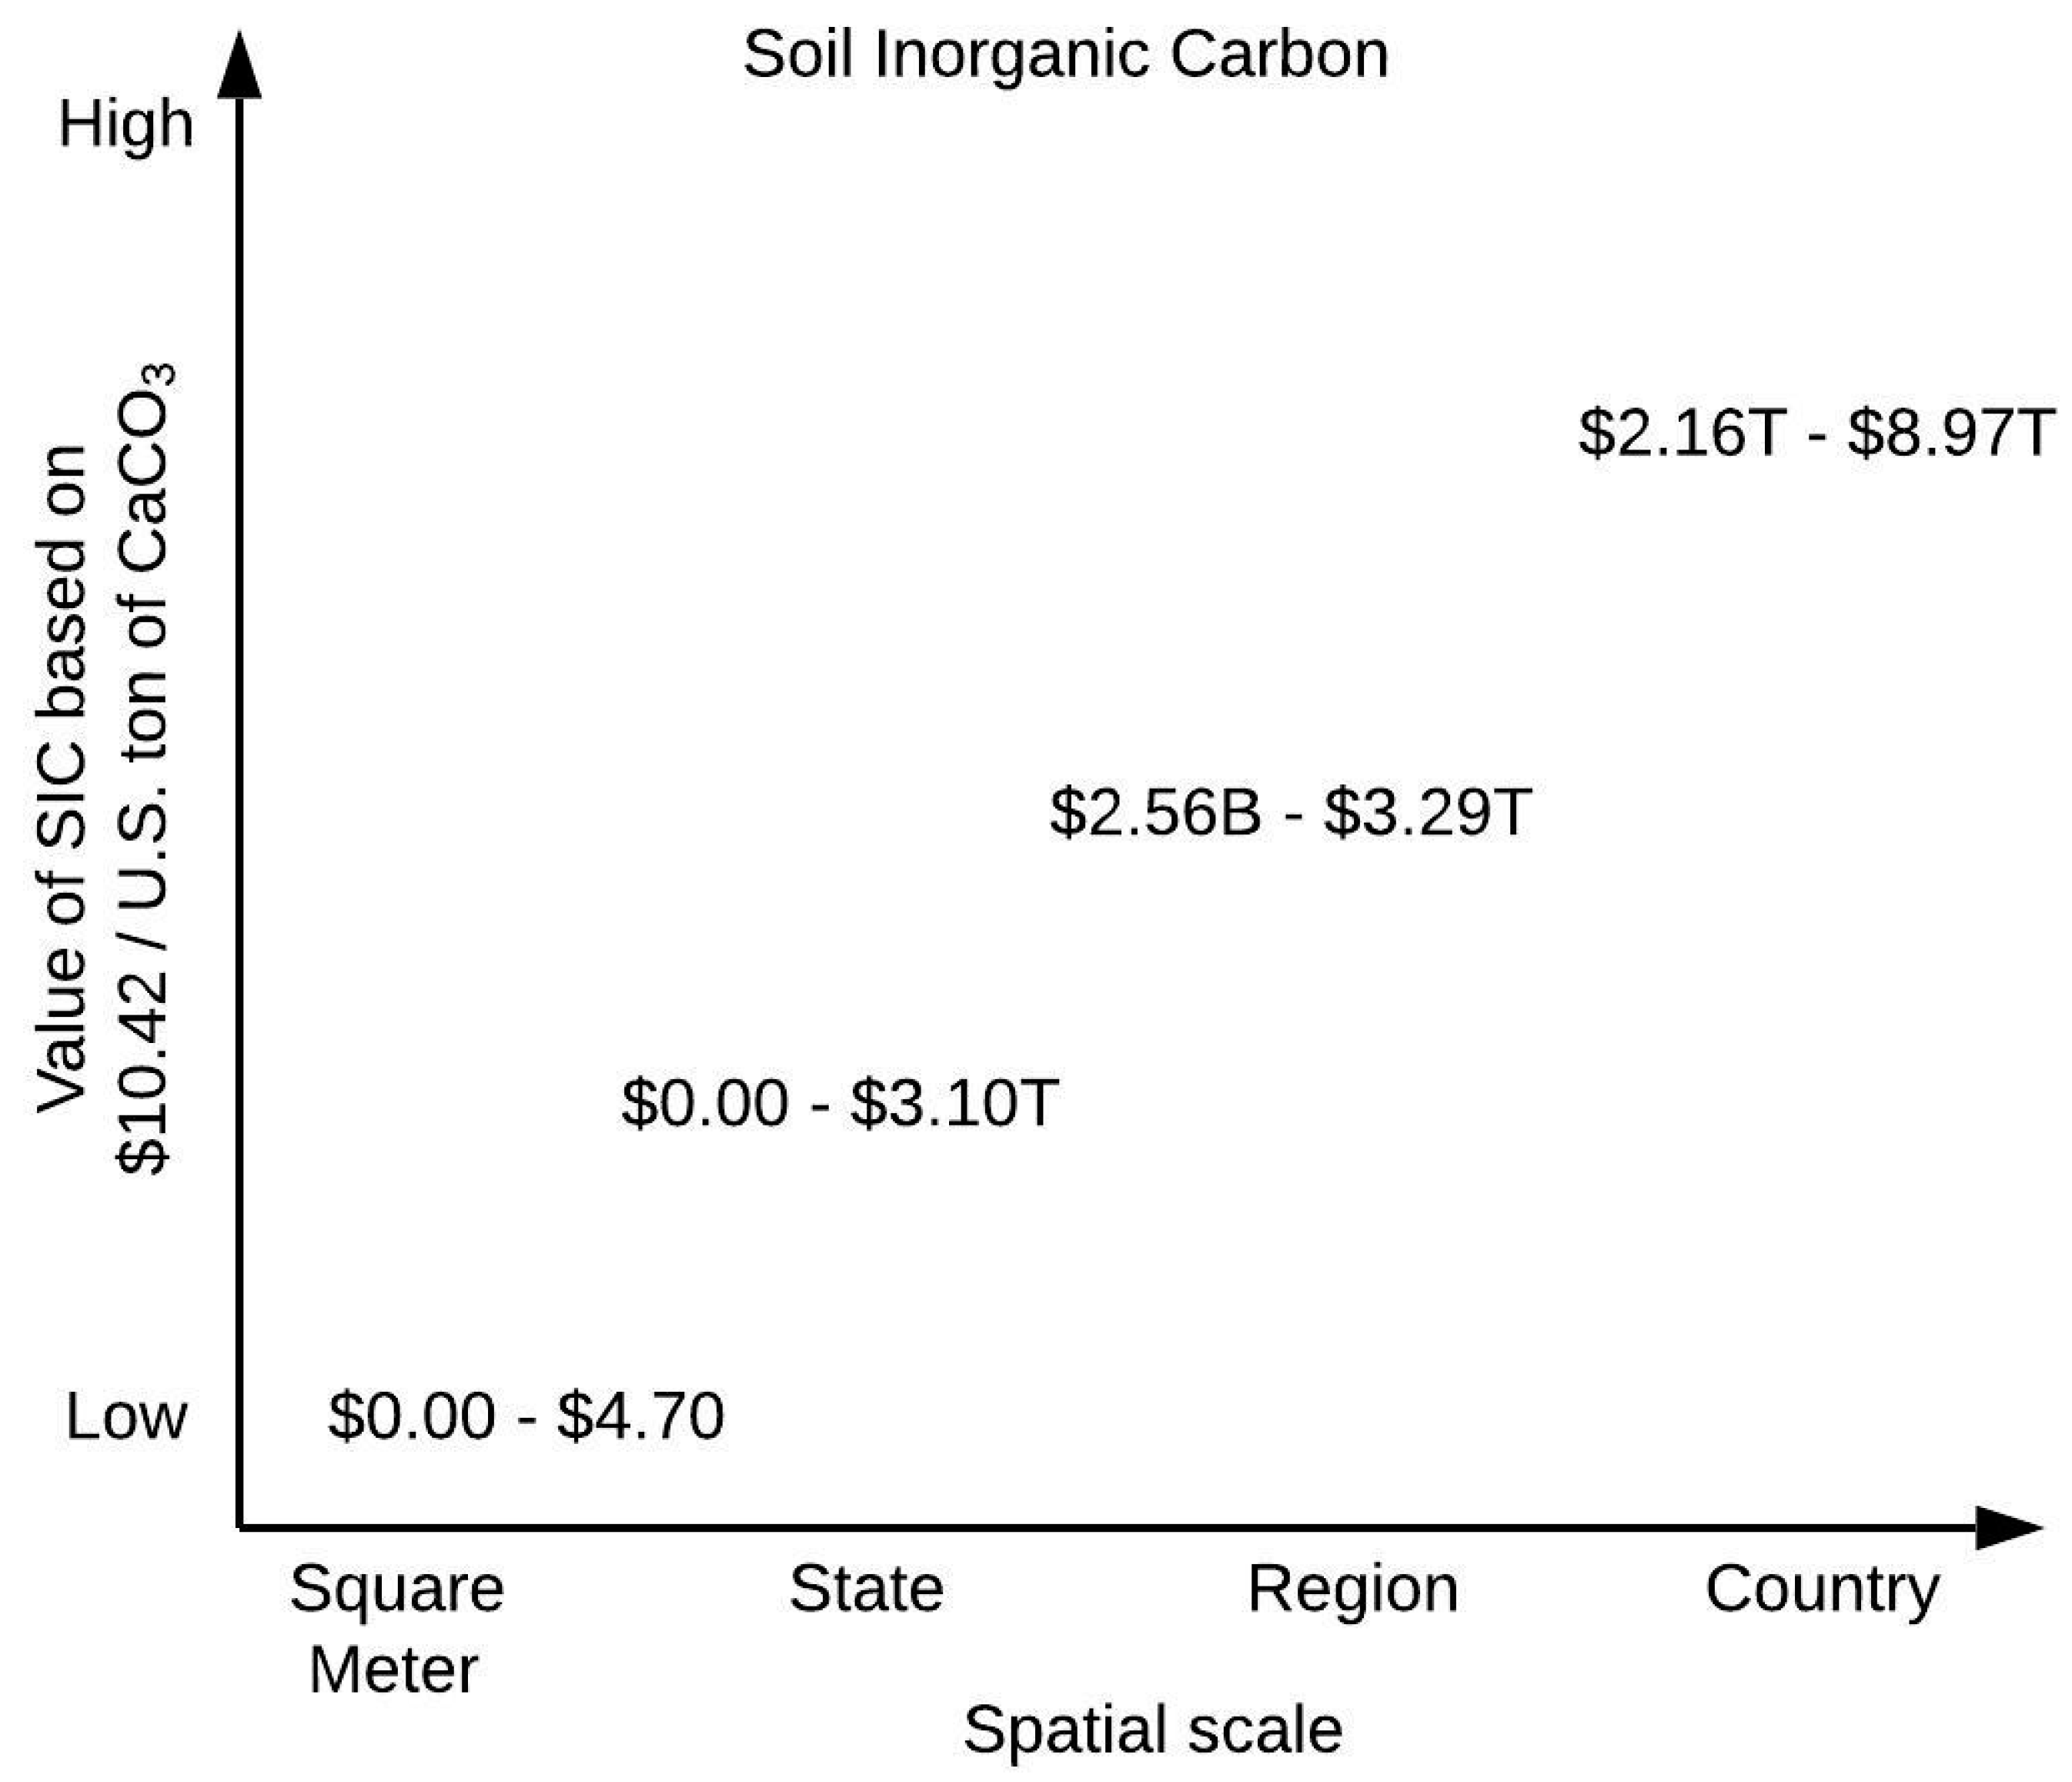
According to Pachepsky and Hill (2017) [21], scale is used as a central concept in the hierarchical organizations of Earth’s spheres (including the pedosphere), anthroposphere, and the world in general. Since soil ES is a human-centered framework, it requires the integration of soil systems and administrative scales used by humans. Figure 3 illustrates an example of using a soil systems scale at the farm to depict the regulating ES of total soil carbon (TSC) and its value based on an avoided social cost of carbon emission (SC-CO2) of USD 42 per metric ton of CO2, where soil map unit (SMU) and the soil order of Entisols represent science-based biophysical accounts within defined soil extent boundaries of the farm. Although useful for the science community, this type of valuation and presentation may not be applicable to the business community. Figure 4 illustrates the integration of soil systems and administrative scales, where a market-based valuation of a provisioning ES value (based on liming replacement cost) is used to demonstrate the soil inorganic carbon (SIC) replacement costs calculated from science-based accounts at the administrative scale: square meter, state, region, and country levels.
Zurek and Henrichs (2007) [26] suggested linking environmental assessment scenarios across different geographic scales to better understand linkages across scales. Environmental assessments will depend on the purpose of the scenario exercise [26]. For example, Figure 3 can be used to understand the implications of regulating ES, and how potential social costs of carbon emissions that are avoided at a small scale (starting point) are totaled at larger scales. In the case of provisioning ecosystem services (Figure 4), small scale estimates of SIC replacement costs can be used for larger multiscale scenarios at the state, region, and country extents for potential resource planning and acquisition to replace depleted ES provided by SIC.
Spatial scales are often used in conjunction with temporal scales for spatio-temporal analyses [27]. Different research approaches (experiments, observations, and models) are available at various spatio-temporal scales (Figure 5) to assess the range of potential environmental impacts from short-term, small-scale soil C emissions (e.g., per square meter) to the soil order extent (e.g., soil order of Gelisols on Earth), which can result in a potential tipping point of C emissions with implications to the global climate [27].
The soil order Gelisols is of particular concern regarding the tipping point in climate change because it contains large amounts of soil organic matter (SOM), which has been preserved in a frozen and relatively undecomposed state. Gelisols are widely spread in the world’s northern regions with permafrost (permanently frozen ground at 0 °C for at least two consecutive years) [29,30,31]. Climatic change (e.g., warming) in these regions causes the widespread degradation and thawing of permafrost with a subsequent release of carbon dioxide and methane to the atmosphere [30]. There are various model predictions of carbon losses as a result of thawing permafrost, but they typically do not include social cost estimates associated with these losses [32,33,34,35,36,37]. These predictions (and associated social costs based on an avoided social cost of carbon emissions (SC-CO2) of USD 42 per metric ton of CO2 [23]) have various ranges: 7 to 250 Pg C (USD 1.1T to USD 38.5T) by 2100; 121 to 302 Pg C (USD 18.6T to USD 46.5T) by 2200, and 180 to 380 Pg C (USD 27.7T to USD 58.5T) by 2300 for intermediate to high fossil fuel emission scenarios.
The social costs associated with thawing permafrost are not just model predictions but are increasingly being realized. For example, Streletskiy (2019) [29] estimated UDS 250B worth of potential damages to infrastructure and structures in northern and eastern Russia from melting permafrost. This estimate was partially realized when, in 2020, melting permafrost was identified as a major factor in a large Siberian fuel spill (15,000 metric tons of diesel fuel were released into the Ambarnaya River and 6000 into the surrounding soil), which caused at least USD 80M (where M = million = 106) in environmental damages [38].
3.1.2. Soil System (Time)
The concept of time in soil systems refers to the regolith, which is a layer of loose unconsolidated rock on top of a layer of bedrock [39]. According to Brantley (2008) [39], the interpretation and understanding of soil time depends on the field of study (e.g., geology, biology, etc.) For example, geologists study soil time within a geologic time scale compared to biologists and ecologists who are interested in ecosystem changes within tens to hundreds of years. In view of an ES framework, the concept of time in soil systems depends on the type of ES under consideration. Nutrient cycling and residence time in soils vary with the type of nutrient as well as other major and minor factors. For example, the residence time of soil organic matter (SOM) (global average of 18.5 years) is often life zone dependent, and tends to decrease with an increase in precipitation and temperature (e.g., tundra with an SOM residence time of 213 years compared to wet tropical forests with an SOM residence time of 5 years) [40].
Traditionally, the concept of time in soil systems refers to the degree of weathering and soil development (Table 3). Table 3 illustrates the science-based relationship between soil orders and the market-based valuation of the provisioning ES value (based on liming replacement cost) of SIC. There is a clear relationship between the degree of weathering/soil development and the value of SIC with strongly weathered soils having no SIC to replace because these are highly leached soils with low nutrient contents.
These biophysical accounts (science-based) can be integrated with administrative accounts (boundary-based) to show the relationship between weathering/soil development and administrative extent (e.g., state, region) (Table 4). For example, Table 4 reveals that states and regions dominated by slightly and highly weathered soils have no SIC to replace because these soils are either too young to accumulate SIC or too leached of SIC and other nutrients.
The degree of weathering/soil development places biological and physical constraints on soils, their ES, and any monetary values associated with these services. For example, Mikhailova et al. (2020) [41] have reported the reducing effect of soil-based constraints (e.g., high leaching, low pH, etc.) on the maximum potential SIC sequestration from atmospheric sources in the contiguous U.S. from non-constrained USD 135M/year to soil-based constrained USD 64.36M/year within 54% of the land area. The remaining USD 70.64M associate with Mollisols, Alfisols, and Vertisols will be further reduced to ≤10% due to economic (e.g., crop growth, trade etc.) and socio-political constraints [41,42].
The concept of time in a pedological sense usually applies to natural processes in soils, but anthropogenic (human-affected) changes (e.g., land disturbance, climate change, etc.) have been rapidly transforming soils into “human-natural” bodies [43] with implications for both the natural and human world. Trudgill (2006) [44] points out that modern cultural constructs (e.g., mechanization, urbanization, globalization, etc.) can result in the destruction of soil resources, which may not be renewable on a human time scale because soils are composed of biotic and abiotic components renewable at different timescales [45]. Composting can be used to somewhat regenerate the SOM (biotic) component in a human timescale [46], but the mineral fraction of soil is formed from the weathering of rocks and is governed by a geologic timescale [44]. For example, Mikhailova et al. (2018) [47] reported morphological/diagnostic changes, as well as changes in soil organic carbon (SOC) and SIC, in a 50-year period of cultivation of the Russian Chernozem. Some of the human-induced changes to soils are so profound that Drohan and Farnham (2006) [48] have proposed to recognize rare and threatened soils. Warming of the permafrost is reducing the area of Gelisols at a rapid pace and is threatening its existence as a soil order [49]. Plaza et al. (2019) [50] reported a loss of soil carbon of 5.4% per year at an experimental site in Alaska using direct measurements of permafrost thawing and carbon loss. Such changes have significant socio-economic and monetary consequences, which are not always reported through scientific data. The costs associated with climate change are often considered to be “invisible,” “far more distant,” and the markets have “a tough time” dealing with them [51]. Soils are at risk due to anthropogenic and climate changes, but businesses either “do not or are slow” at connecting these risks with market valuations [51]. The lack of orderly market corrections and “climate risk underpricing” can lead to a “correction all at once,” which can be detrimental for both the market and the environment [51]. This indicates the need for systematic monetary valuations of rapid changes in soil properties (e.g., SOC, SIC, nutrients, etc.) due to human activities using market- and non-market valuation methods. It should be noted that some climate-change-induced changes in the soils can reach thresholds (such as the disappearance of the soil order of Gelisols), which are likely irreversible [52], and, therefore, not correctable by the market. Monetary valuations, market- and non-market interventions cannot fix the physical world, but they can help human adaptation to its changes. Economic analysis regarding soil actual and/or potential change is important for sustainable soil management to sustain human wellbeing and aid adaptation to dynamic environmental conditions.
3.1.3. Soil System (Degree of Computation and Degree of Complexity)
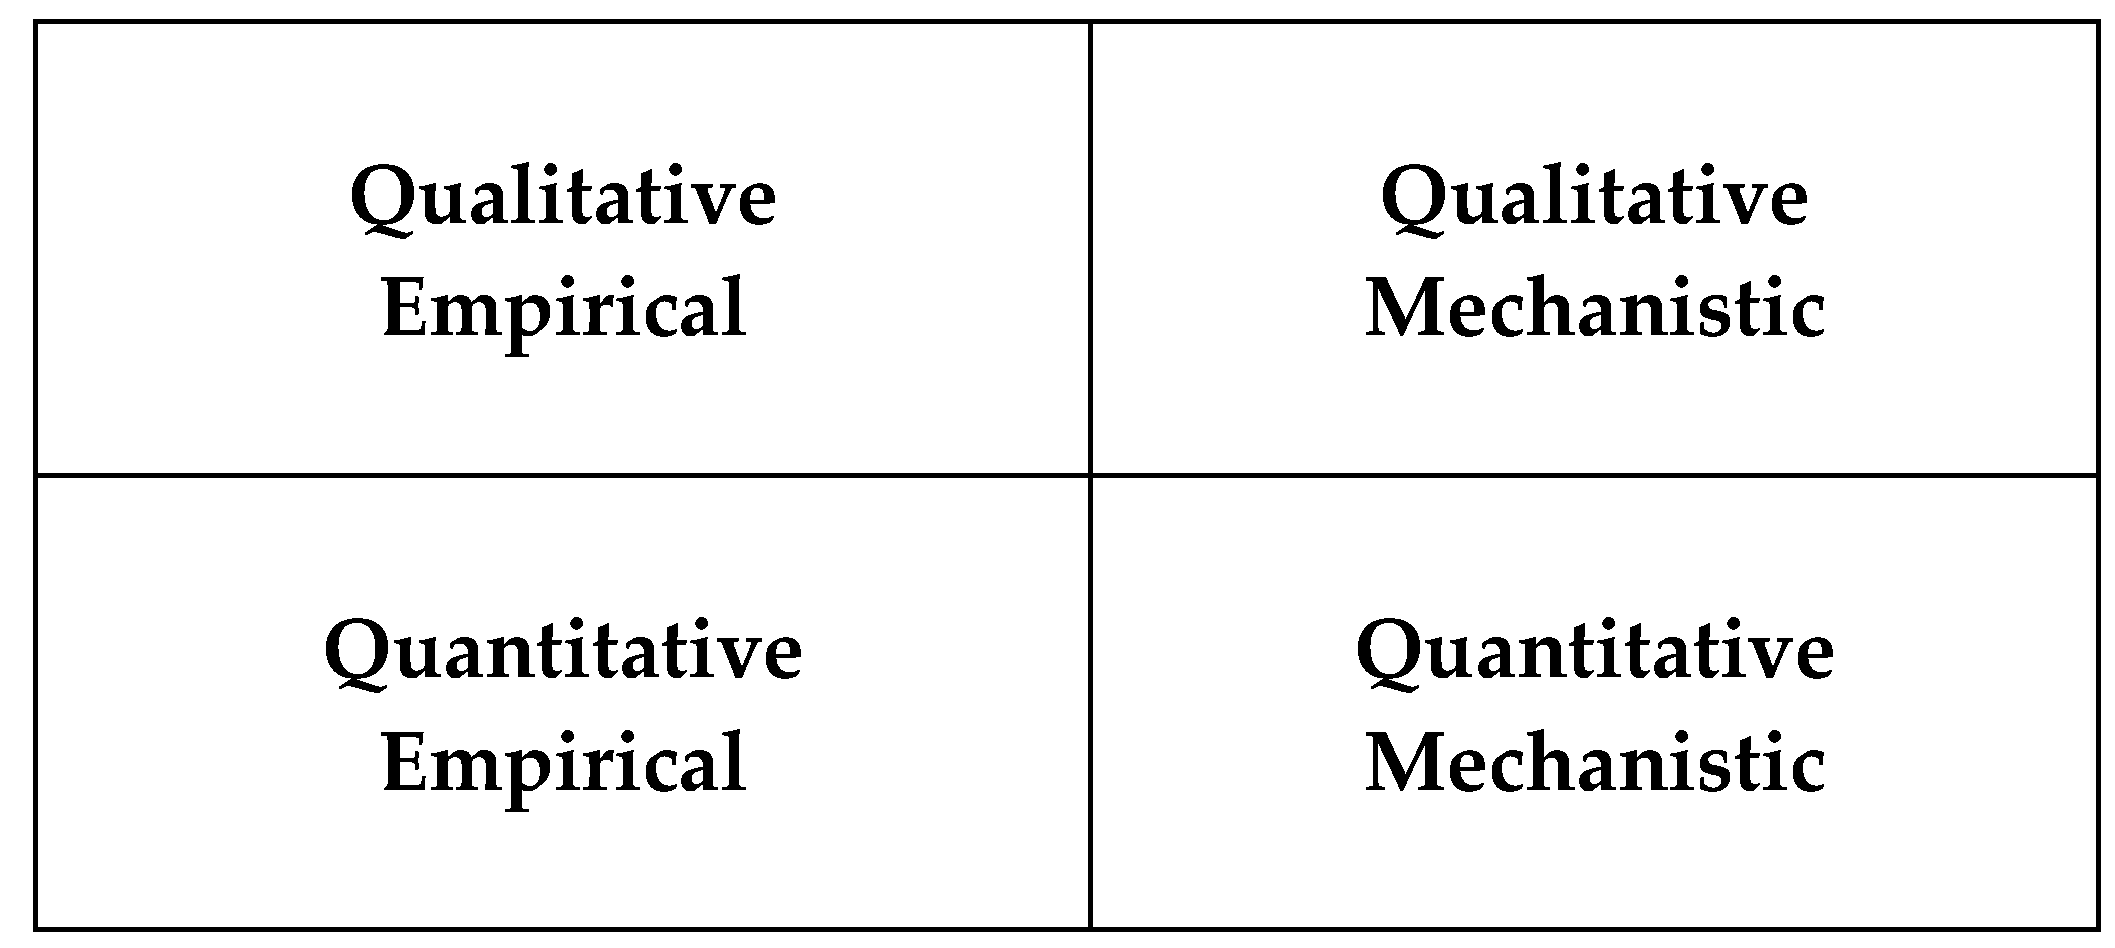
Valuation starts with the selection of a system (e.g., pedon, horizon, etc.) and soil property or properties to be evaluated. Valuation of soil ES can vary by the degree of computation (qualitative vs. quantitative) and the degree of complexity (mechanistic vs. empirical) [10,11] (Figure 6). Distinctions among these valuations provide examples of their possible use. The selection of an appropriate valuation method will depend on the stakeholders, scope, scale, and other factors. Qualitative models in soil science often use expert knowledge to extrapolate soil information across a landscape [10]. Quantitative models use mathematical models to abstract soil characteristics [10].
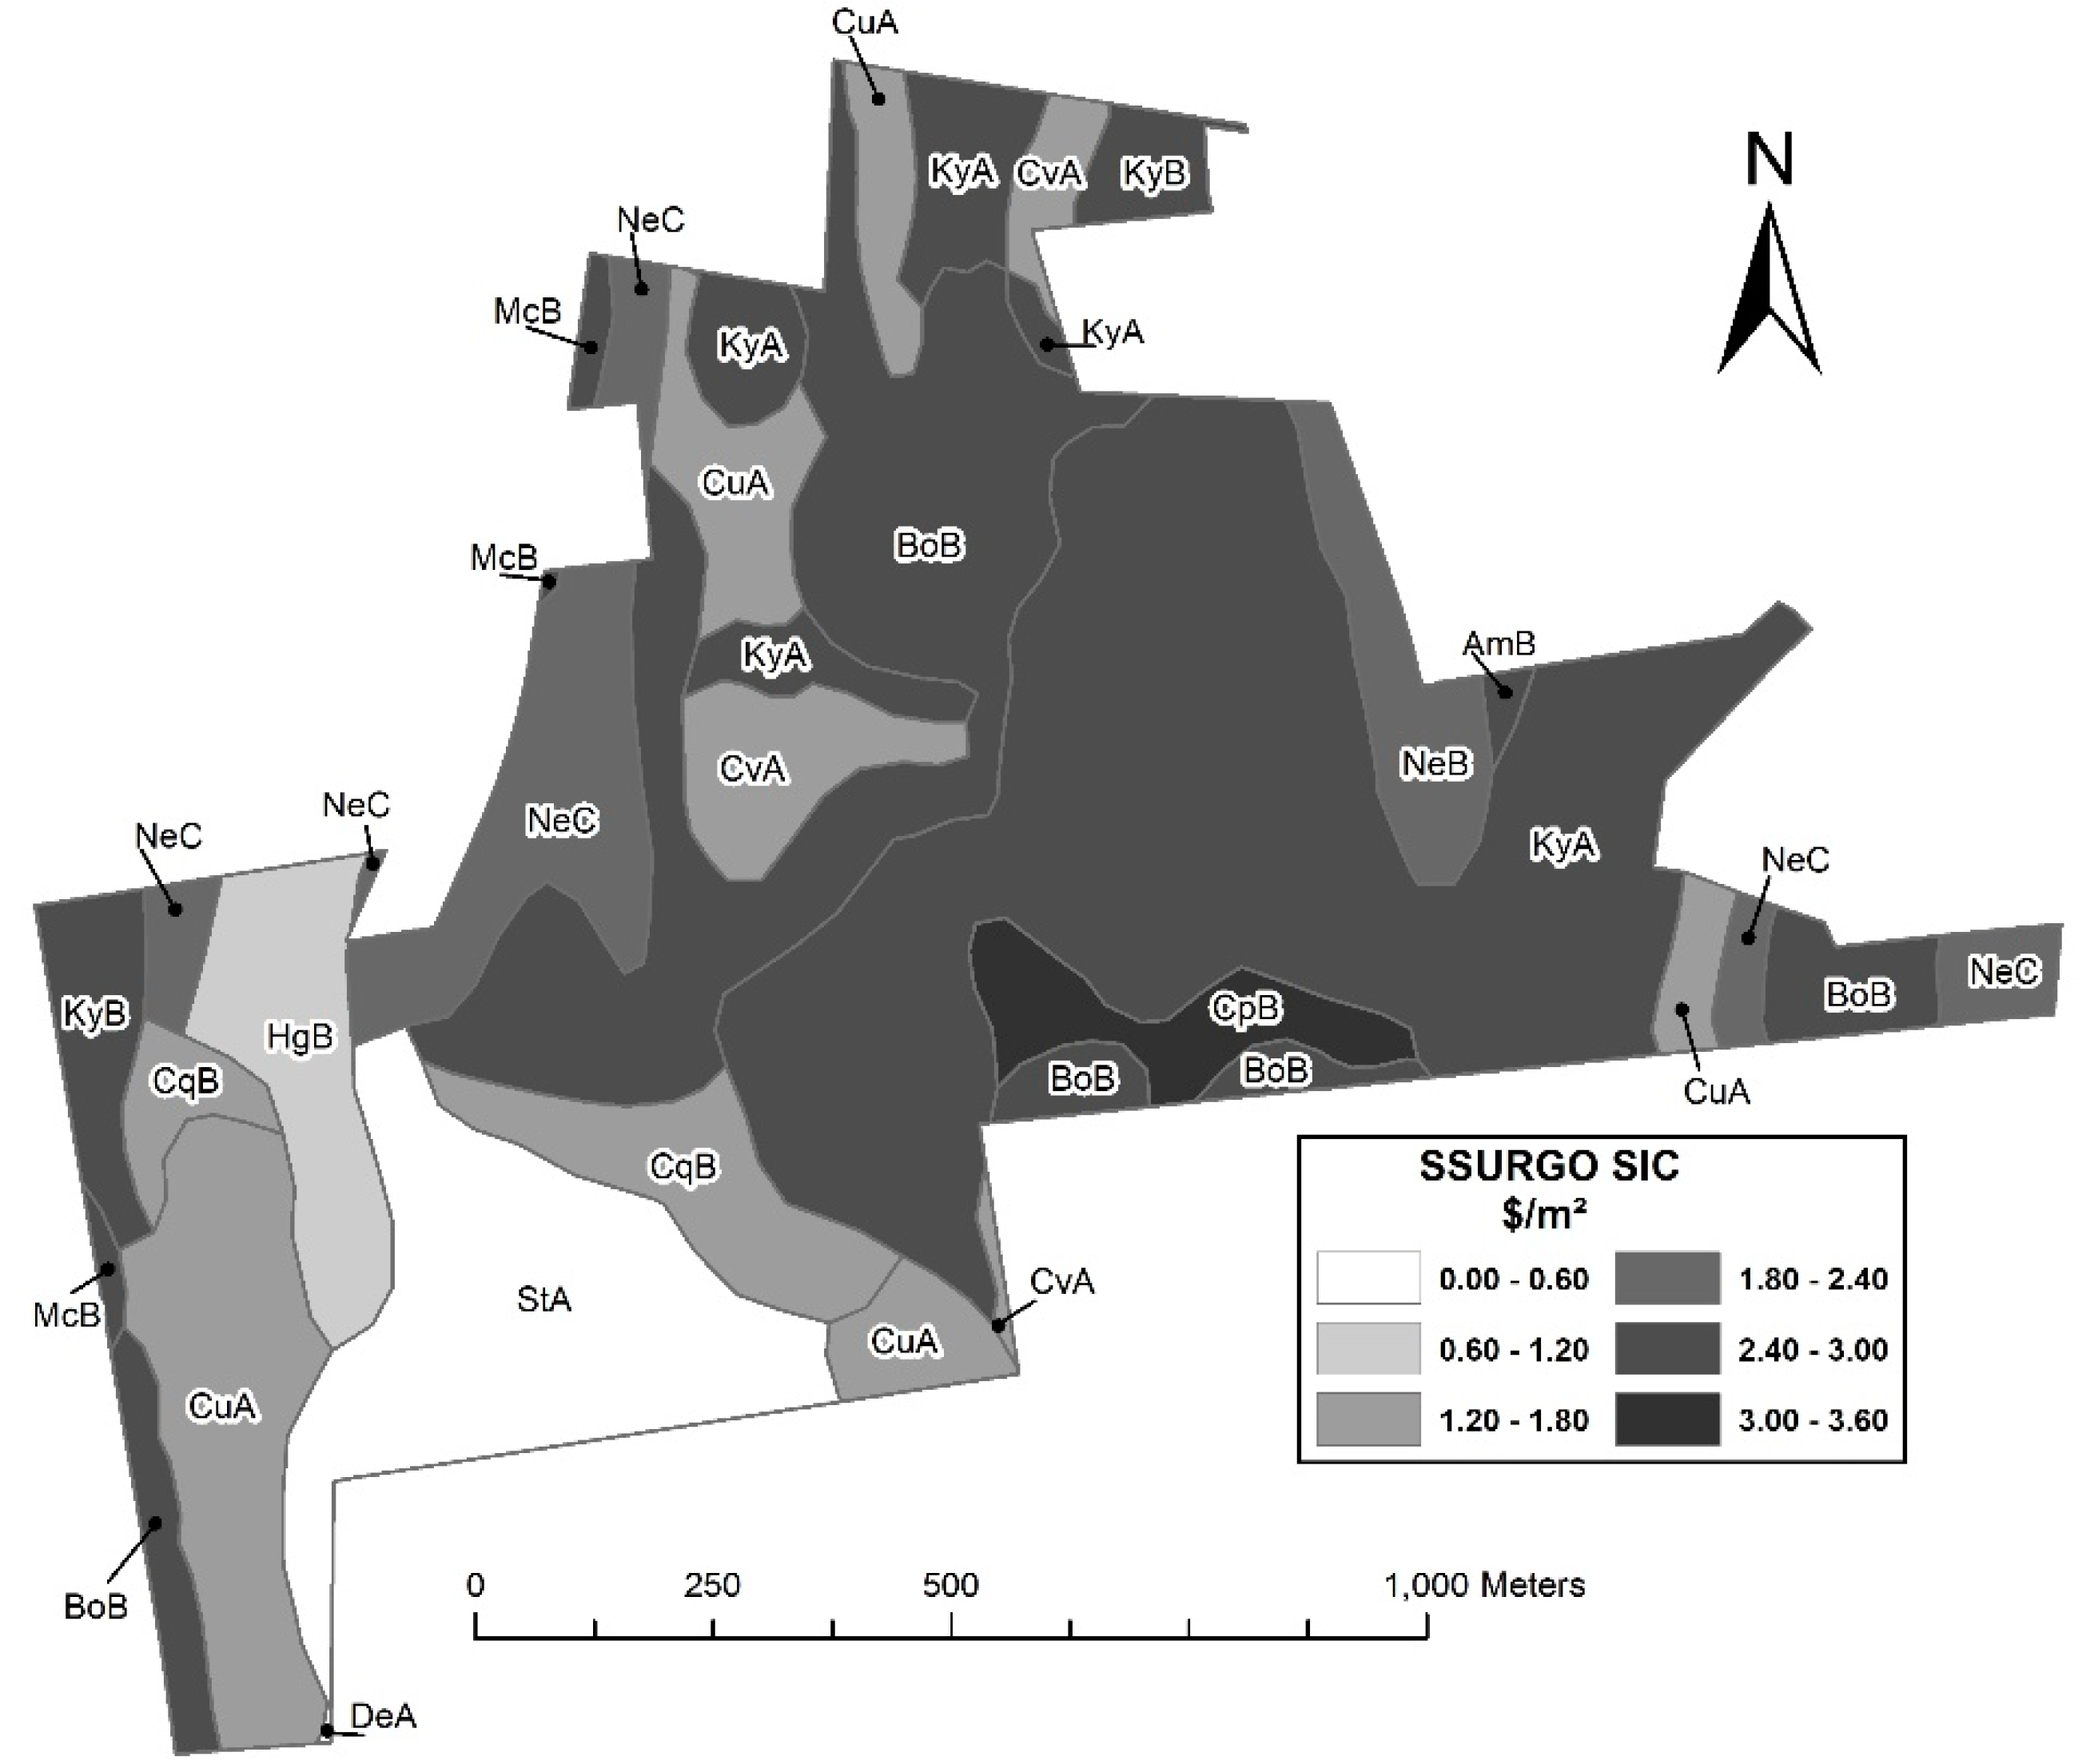
Qualitative-empirical valuations can vary from simple verbal valuations of soil ES (e.g., “dirt cheap,” fertile, productive, etc.) [44,53] to soil ES valuation maps. For example, Lobry de Bruyn and Abbey (2003) [54] examined farmers’ values related to soil health and sustainability using interviews with farmers to identify the language and techniques in relation to identifiable themes, such as soil feel, organic matter, soil life, soil texture, soil management, etc. Although farmers were not directly asked about soil-based ES, farmers understood the link between soil health, productive soil, and profitability. Soil maps are also qualitative empirical models which show soil distribution within a landscape based on soil map units (SMUs) that are identified by soil scientists using “a mental version of the soil-landscape model” [55]. Typically, SMU boundaries are based on a combination of limited field data as well as vegetation and topographic associations that are determined by the soil scientist in the field. This qualitative-empirical approach to define soil boundaries then can be associated with soil property data and/or monetary valuation. For example, the legend for the soil map shown in Figure 7 displays monetary soil ES values averaged over the SMUs.
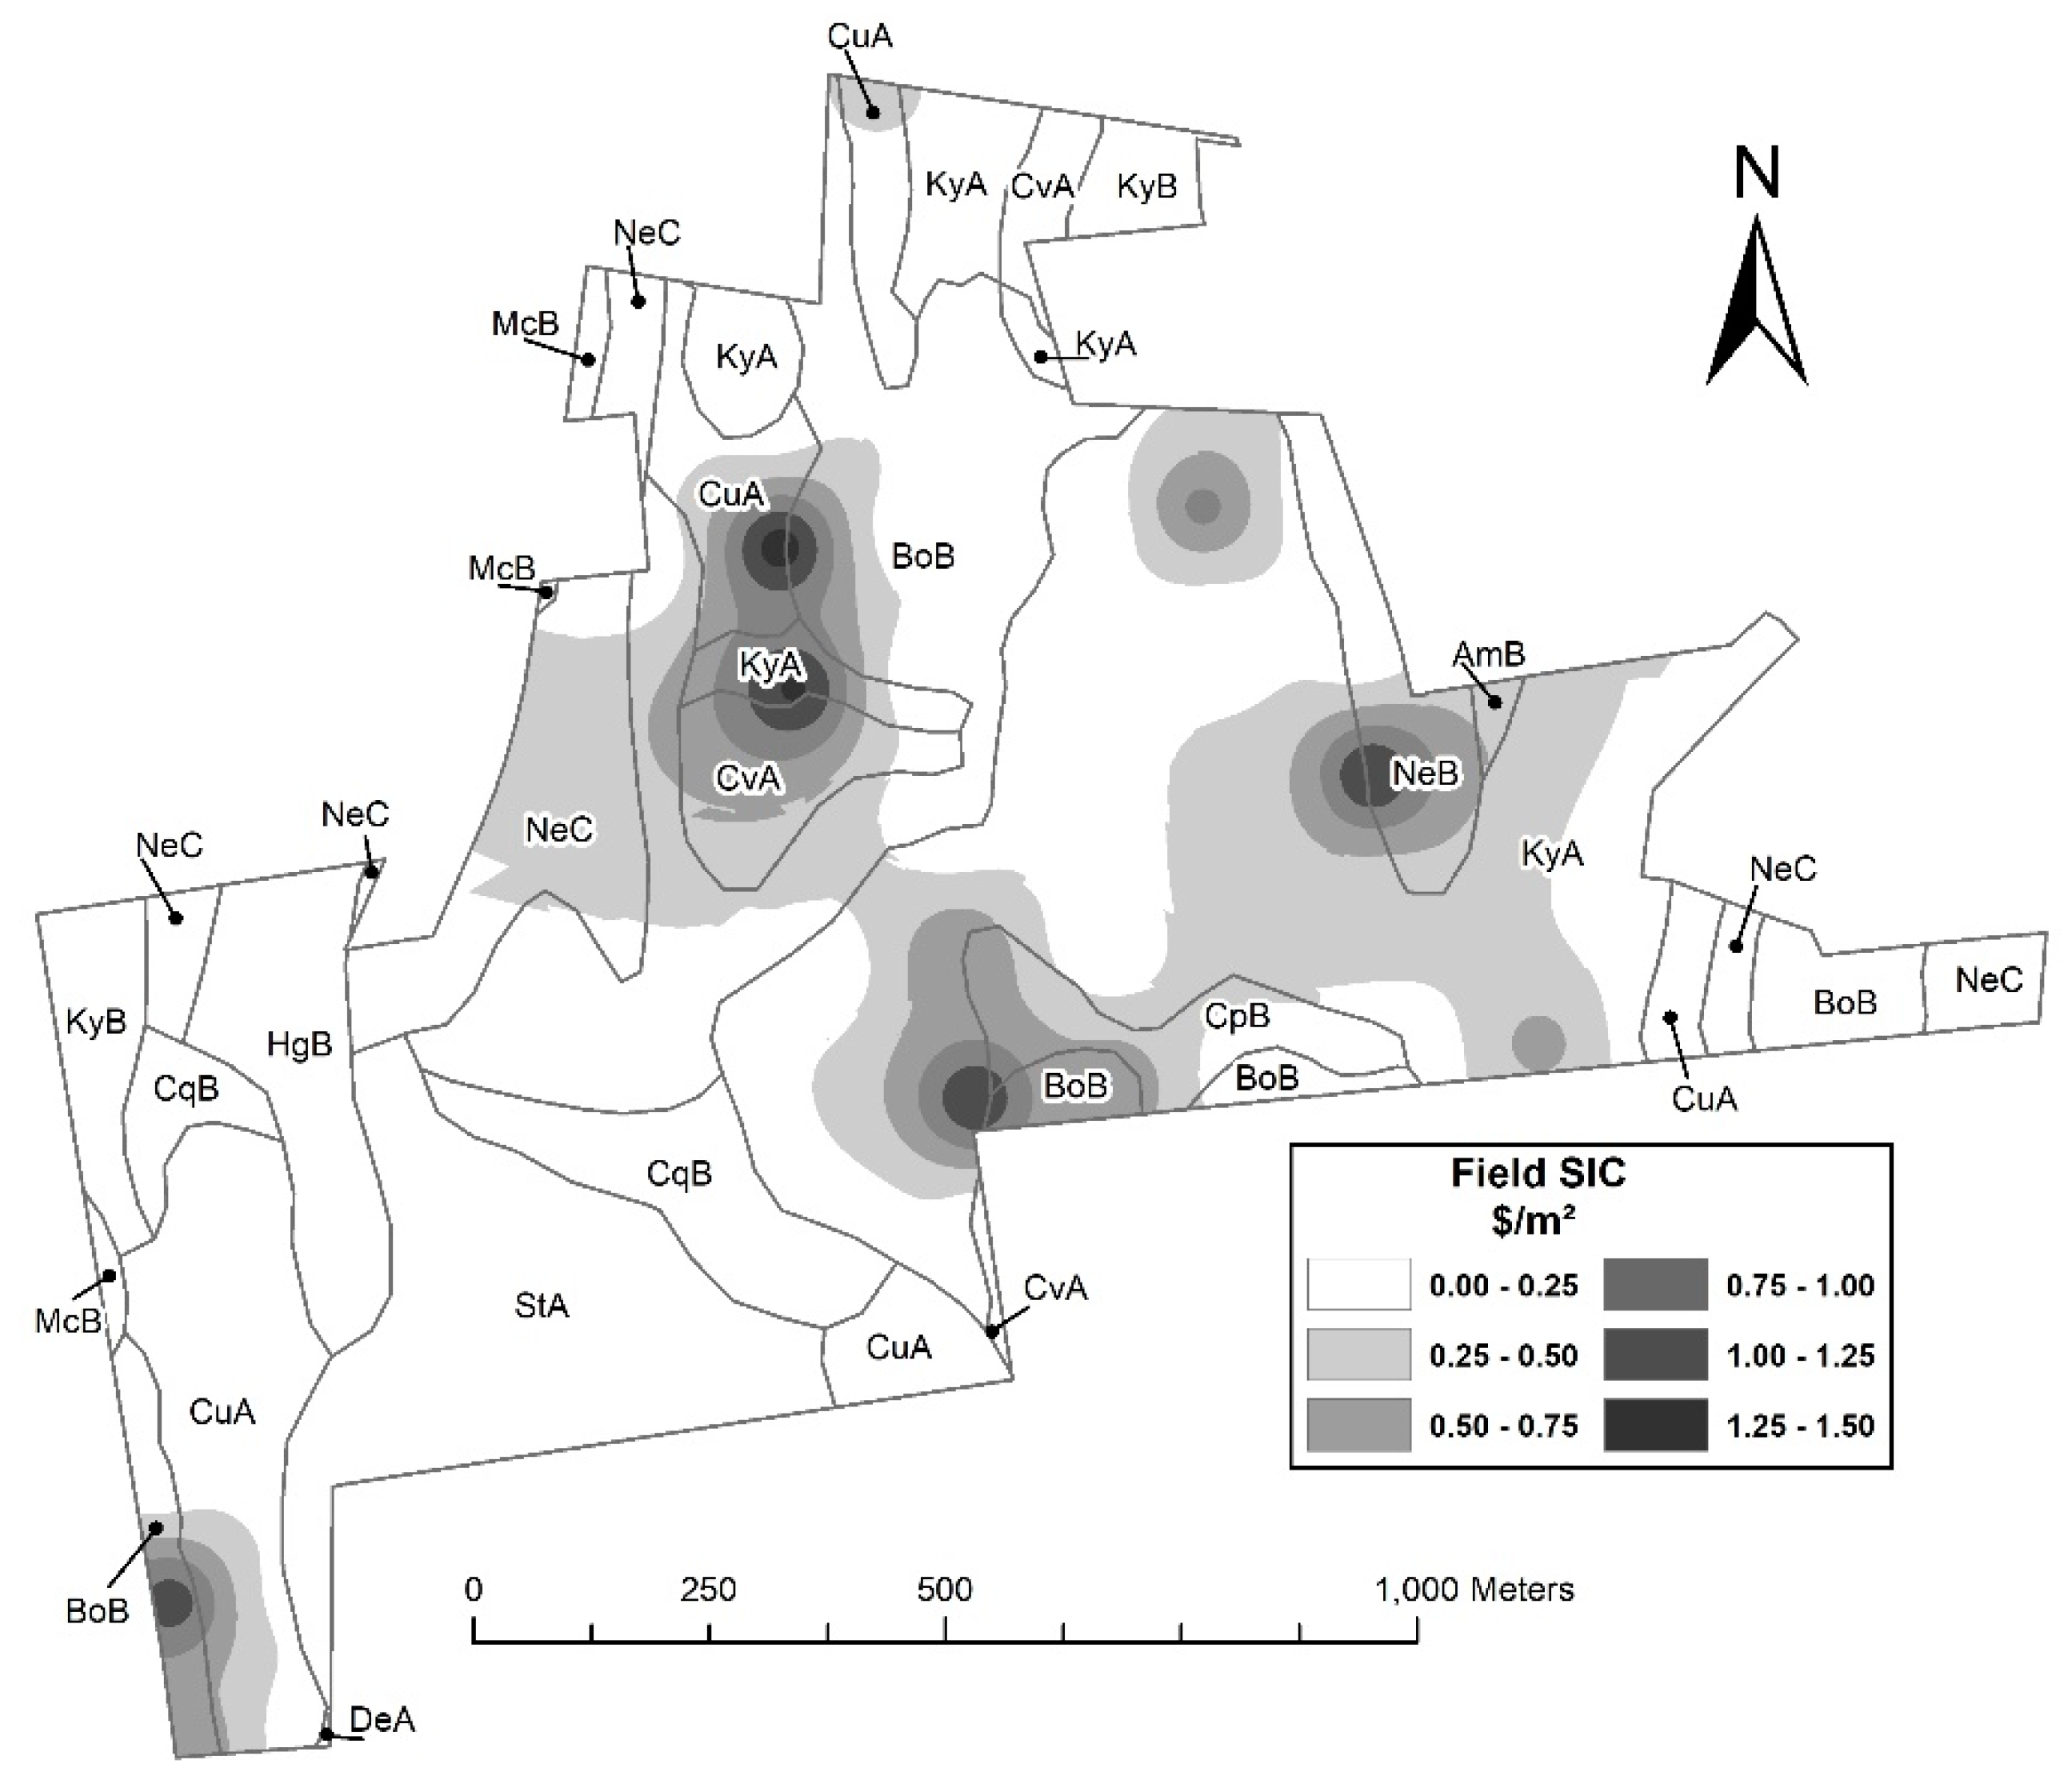
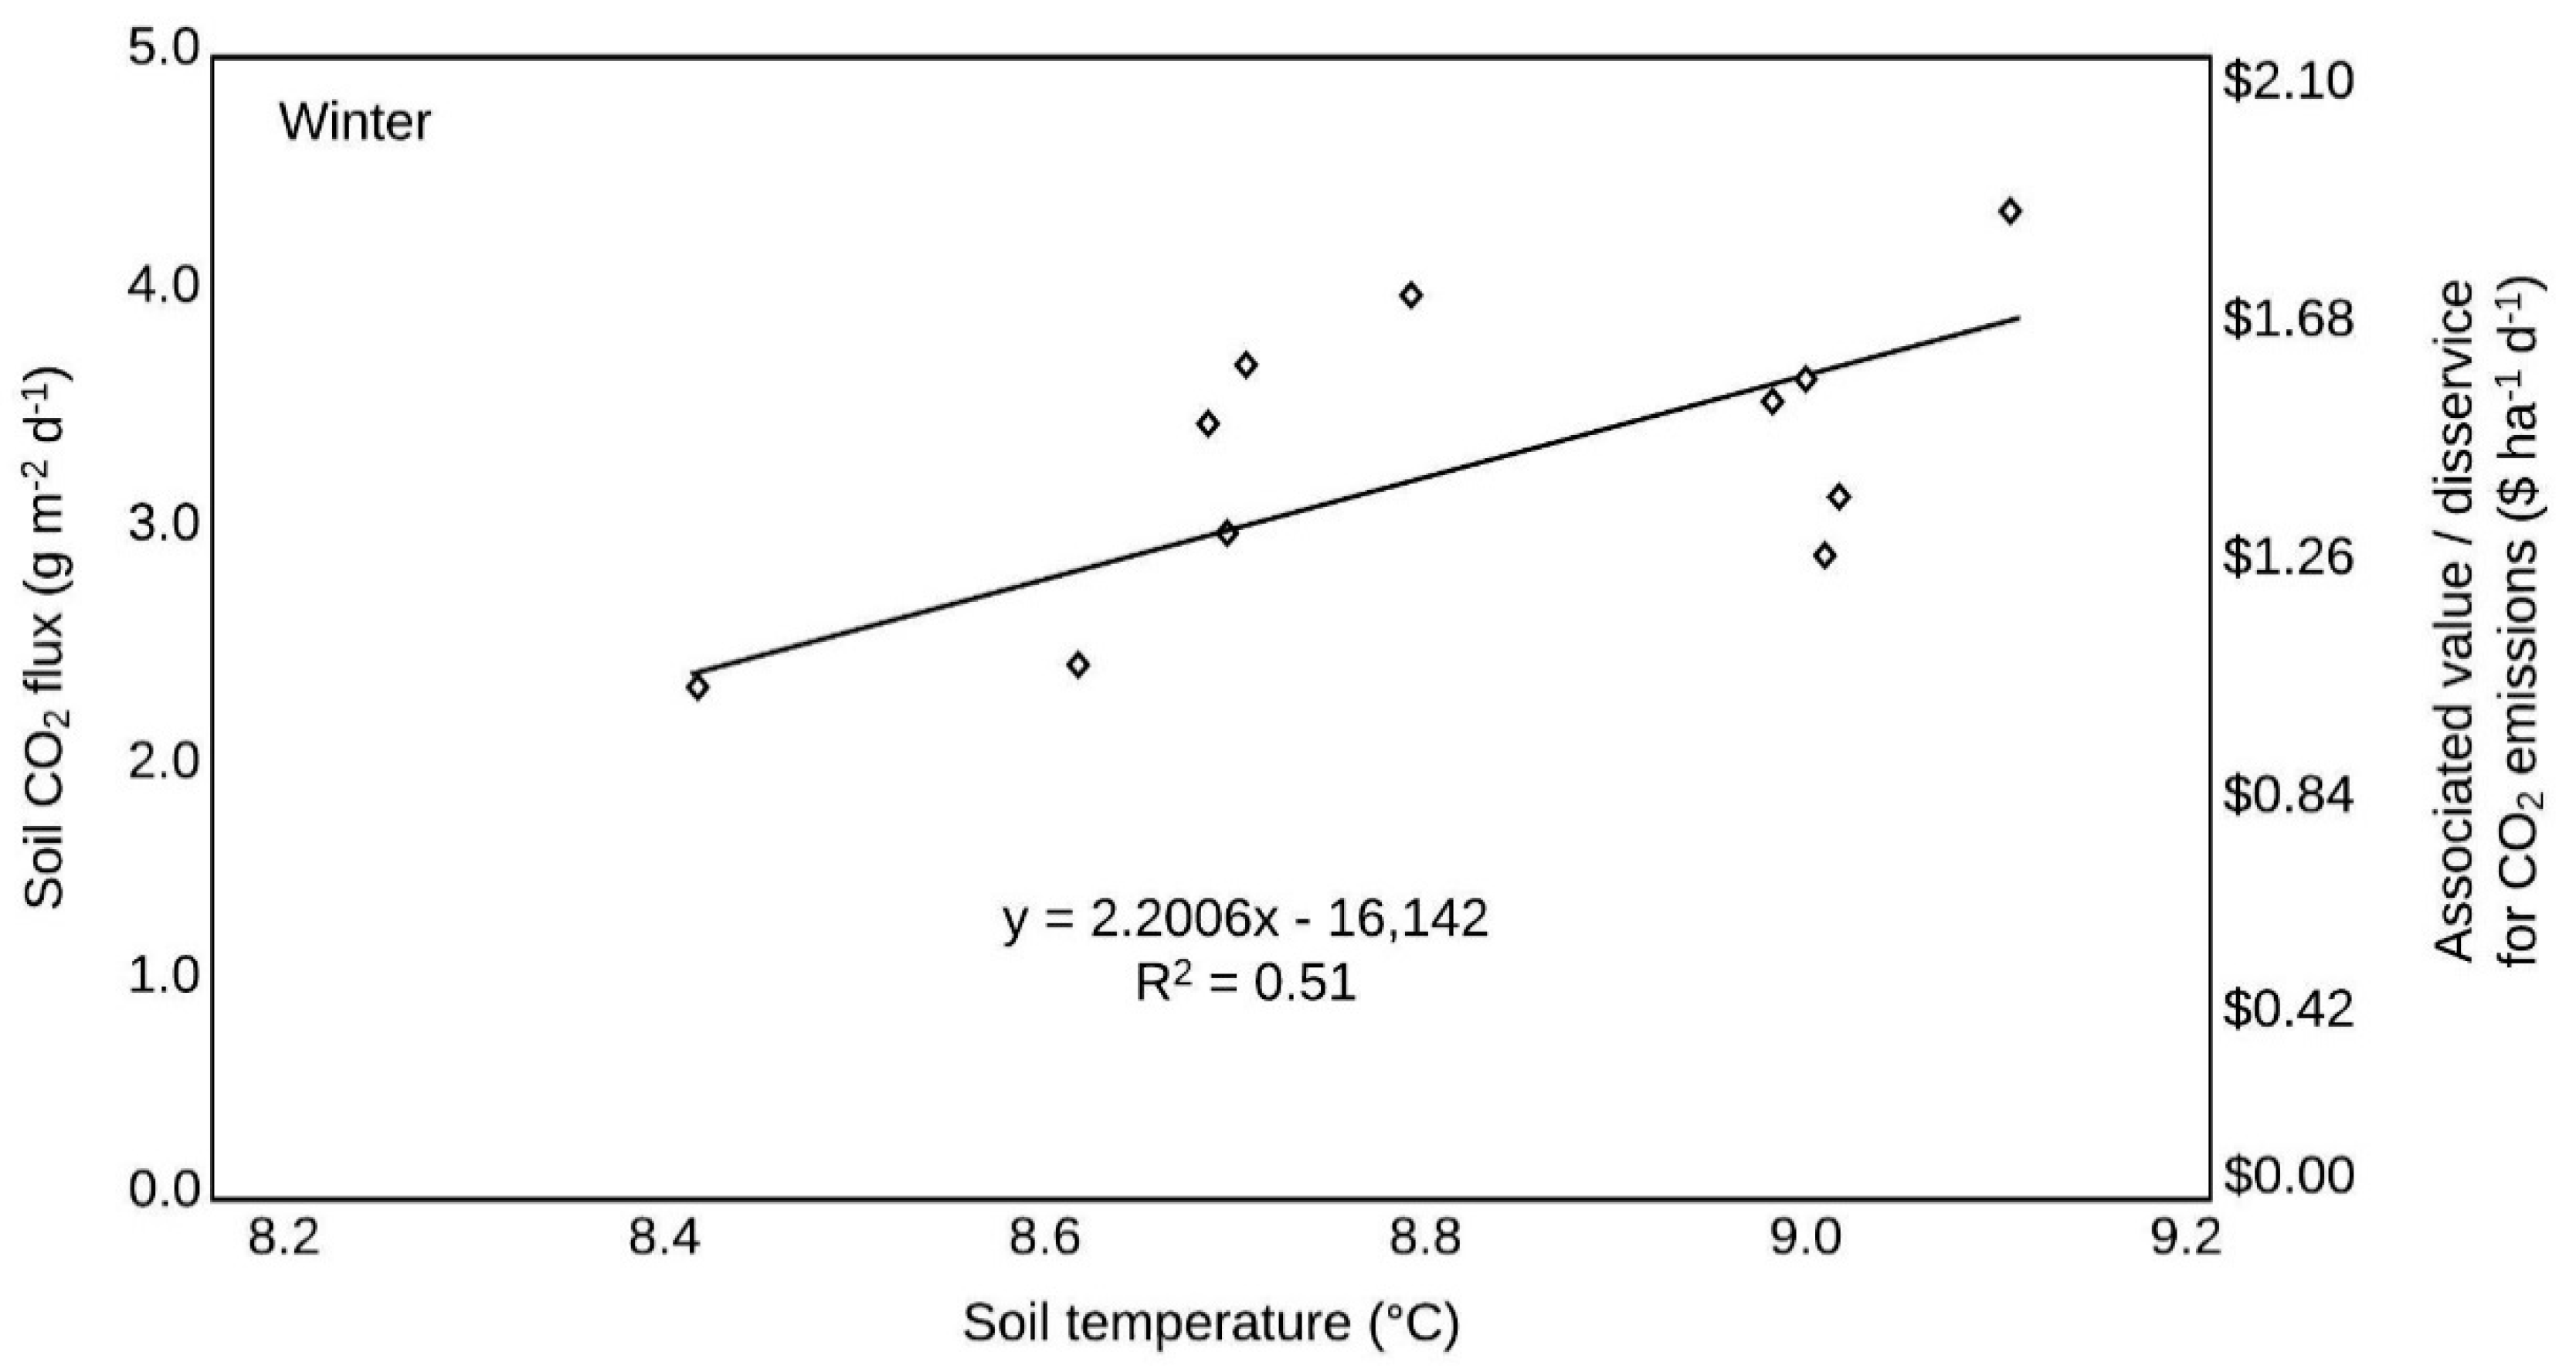
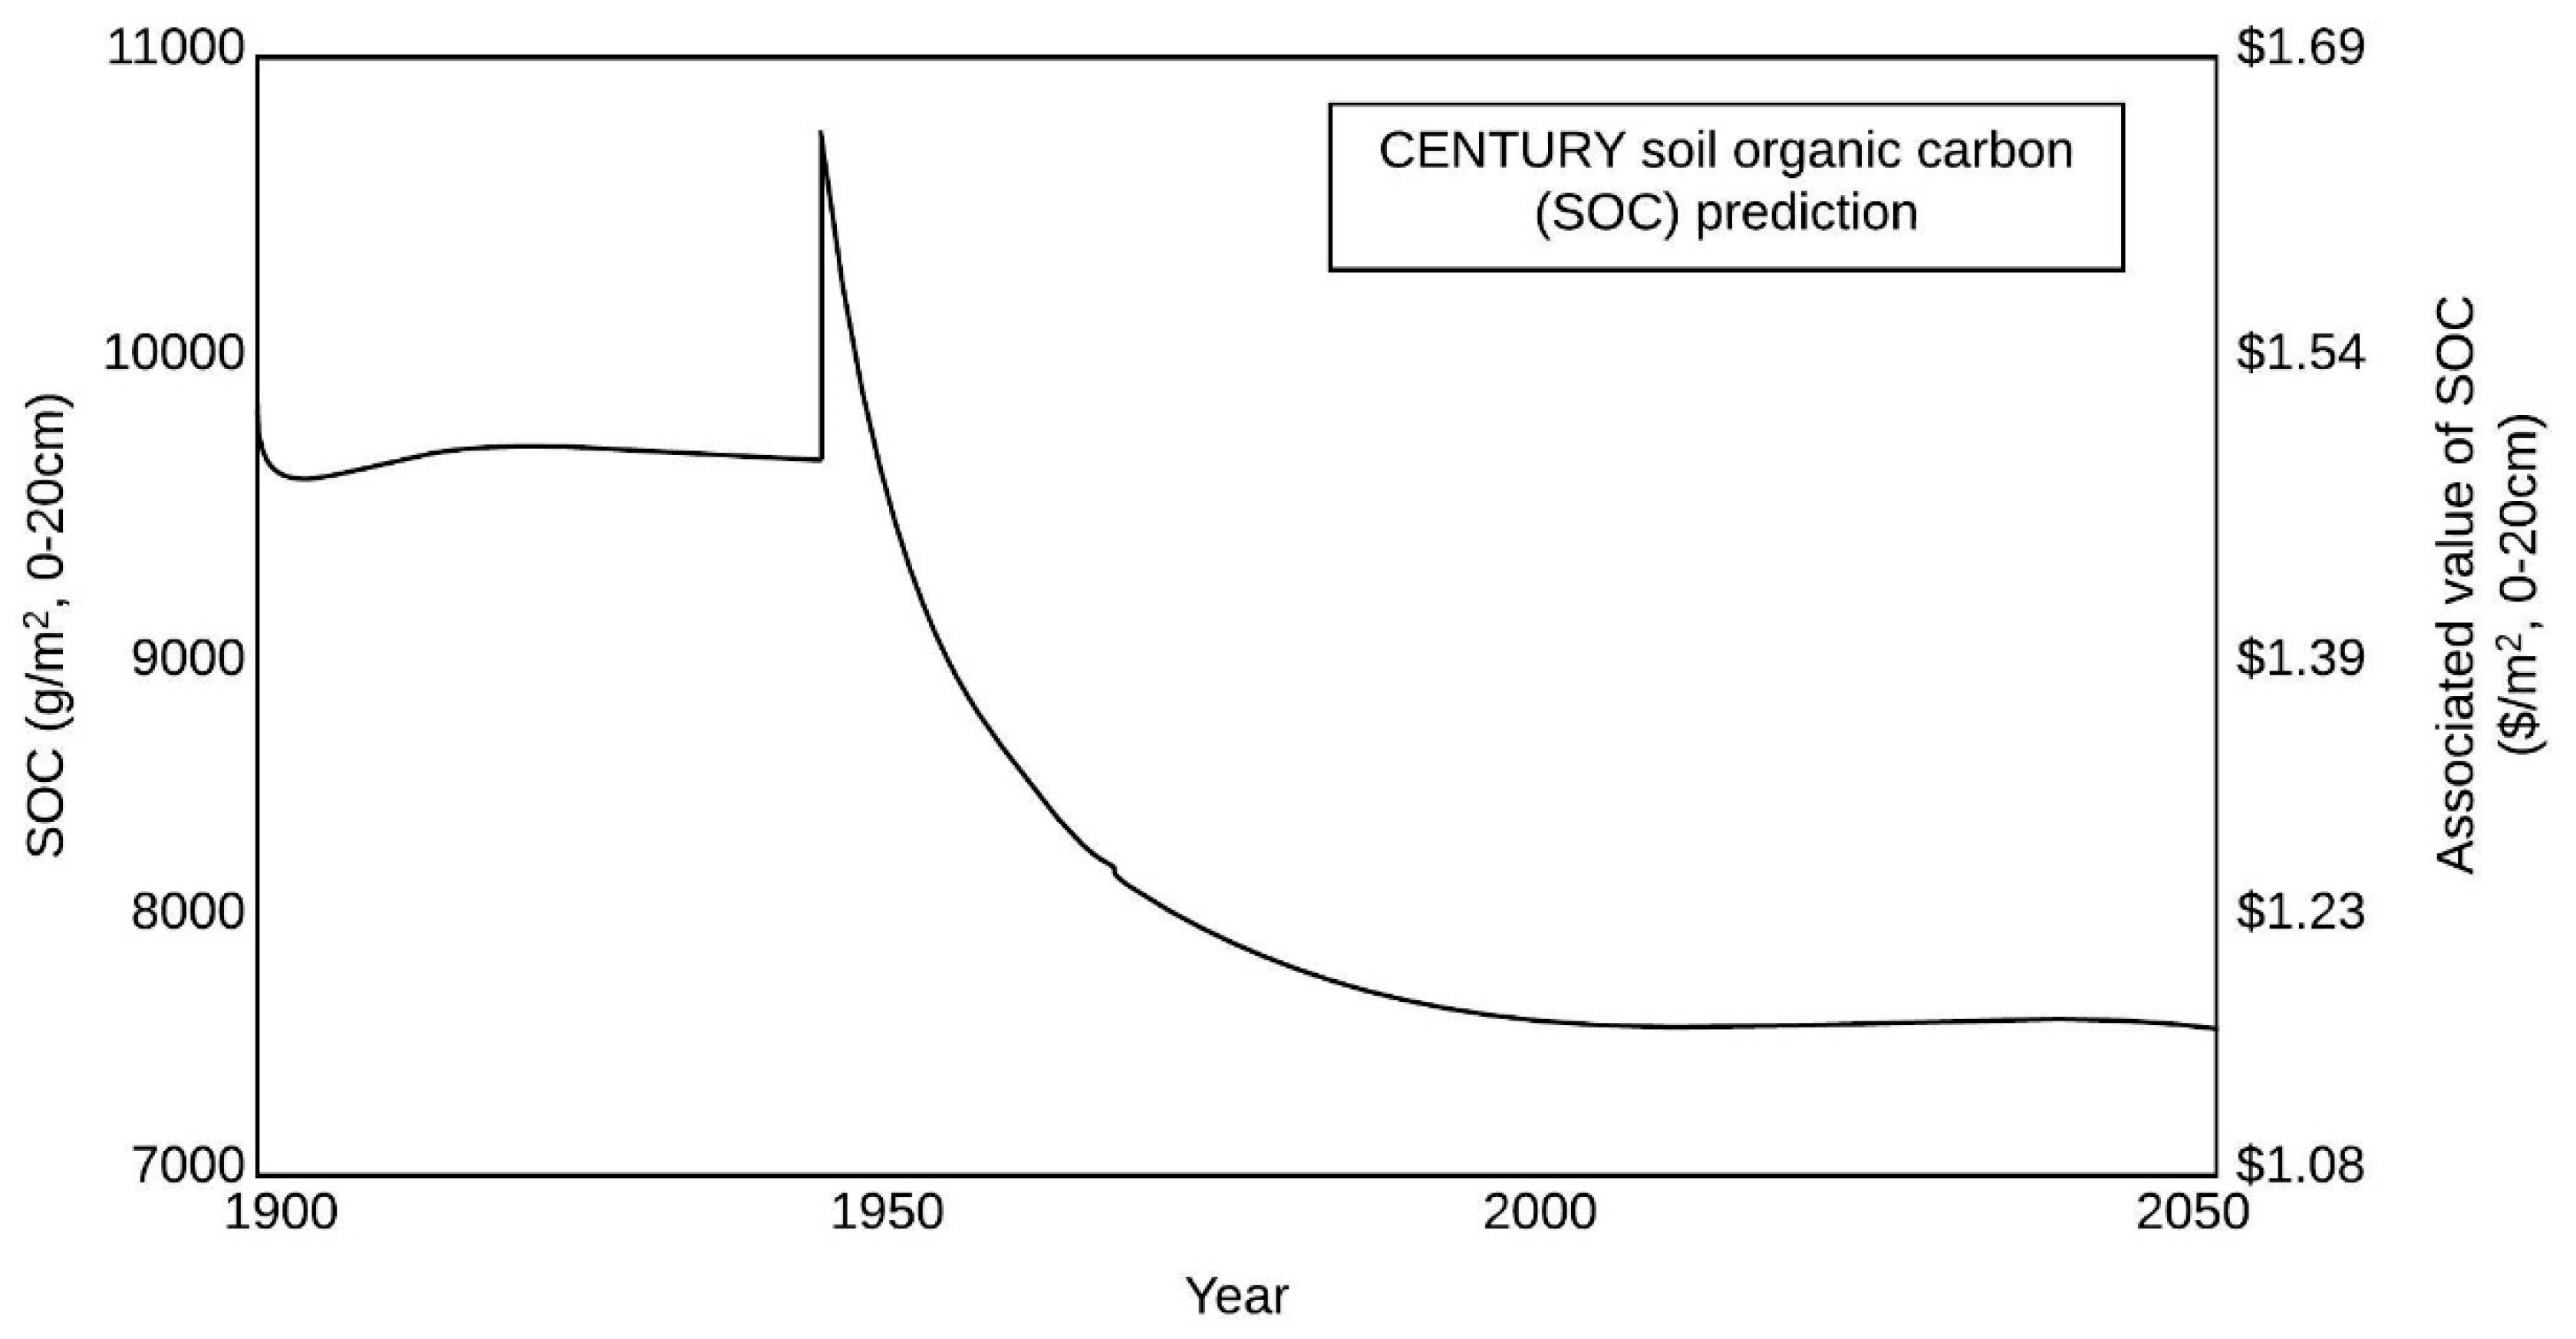
Geospatial technologies (e.g., Geographic Information Systems, etc.) enable soil scientists to use various interpolation techniques to create qualitative-mechanistic valuations where field data are used for the extrapolation of point-based information across the farm for soil ES valuations (Figure 8). Quantitative-empirical valuations can be demonstrated by an example of a linear regression relationship between soil CO2 fluxes and soil temperature during winter (p = 0.009) under long-term effects of vehicular passages in a no-till corn-soybean rotation on a Crosby silt loam in Central Ohio, USA, with associated daily social costs of carbon dioxide emissions [56] (Figure 9). Quantitative-mechanistic valuations can be illustrated by an SOM model (CENTURY) (Parton et al., 1994 [57]), which was used to track SOM dynamics after the conversion of native grassland to long-term (50-year) continuous fallow [58] (Figure 10). Figure 10 demonstrates that social costs associated with SOC can be added into the model output to inform decision-makers about these costs.
3.2. Examples of Monetary Valuations Based on Interaction of Pedosphere with Earth’s Other Spheres and Organizational Hierarchy of Soil Systems
The pedosphere forms as a result of interactions with Earth’s other spheres (atmosphere, biosphere, lithosphere, hydrosphere, ecosphere, and anthroposphere) and exchanges flows of ecosystem goods and services with these spheres (Table 5), which can be of utility to humans [59]. These flows of goods and services are often excluded from monetary valuations of soil ES, even though they are intricately linked with soil properties and functions, and make remarkable monetary contributions to soil ES and disservices (e.g., social costs) (Table 5). Contributions of Earth’s spheres to soil ES have a wide range of applications (e.g., provisioning, maintenance, regulation, etc.) There are various ways to estimate the value of contributions of Earth’s spheres to the pedosphere. For example, produced substitutes (e.g., liming, fertilizer materials, etc.) are often used to value the ES provided by Earth’s spheres (Table 5), but these substitutes are rarely perfect and can be costly [59]. Future research should examine how to add (without double-counting) these important ES to the monetary valuation of the total supply of ES provided by the soil systems. Disservices (e.g., social costs of carbon dioxide emissions) should be accounted for as well.
Despite the various limitations associated with economic valuations of ES provided by the pedosphere and Earth’s other spheres, these tools are important in decision making (e.g., benefit-cost analysis, cost effectiveness analysis, etc.) when it comes to natural resource management. Examples of monetary valuations in Table 5 vary in scale, and Brown et al. (2005) [59] point out that economic valuation can be more accurate in evaluating small changes in ES because “existing prices indicate the marginal value of the resource, and the marginal value applies best to a small change in quantity or quality.” Many ES provided from interactions between the pedosphere and Earth’s other spheres are provided for free because they are viewed as non-scarce with non-attenuated property rights [59].
4. Discussion
Ecosystem goods, services, and disservices provided by soils are an integral part of business ecosystems [2,65], but they have been narrowly defined (e.g., soil-based, pedosphere-based, etc.) [12,66] leading to a potential underestimation of their value to human society (Figure 11). Since many ecosystems on Earth have been modified by human activity, there is a need to expand the scope of the soil (and pedosphere) definitions to include the anthroposphere (Figure 2 and Figure 12).
The anthroposphere has impacted all of the Earth’s spheres, and it is sometimes difficult to separate the human-derived from natural ES. This review introduces soil systems goods and services (SSGS) as a more inclusive term to describe a combination of anthropogenic and natural goods and services provided by the soils, which are open systems [67] (Figure 2 and Figure 12).
Ecological economics [1] developed the concepts of natural capital, ecosystem goods, and services, which are essential for human wellbeing. According to Guerry et al. (2015) [68], there is a fundamental asymmetry of the most current economic systems which very often reward short-term gains (at the human-scale) at the expense of human wellbeing in the long-term (at the geologic scale). Business and economics are alongside each other, where businesses offer goods and services that generate economic output, while economics determines the supply and demand of these products. Moore (1993) [65] describes business ecosystems with a new ecology of competition between predators and prey, comparing them to natural ecosystems which can sometimes collapse if the environmental conditions change too rapidly (e.g., comparable to Stephen Jay Gould’s evolutionary theory [69] and punctuated equilibrium [70]). According to Moore (1993) [65], successful businesses must attract resources, capital, partners, supplies, and create cooperative networks, which hopefully will be sustainable not only for these businesses but also to the humans they serve.
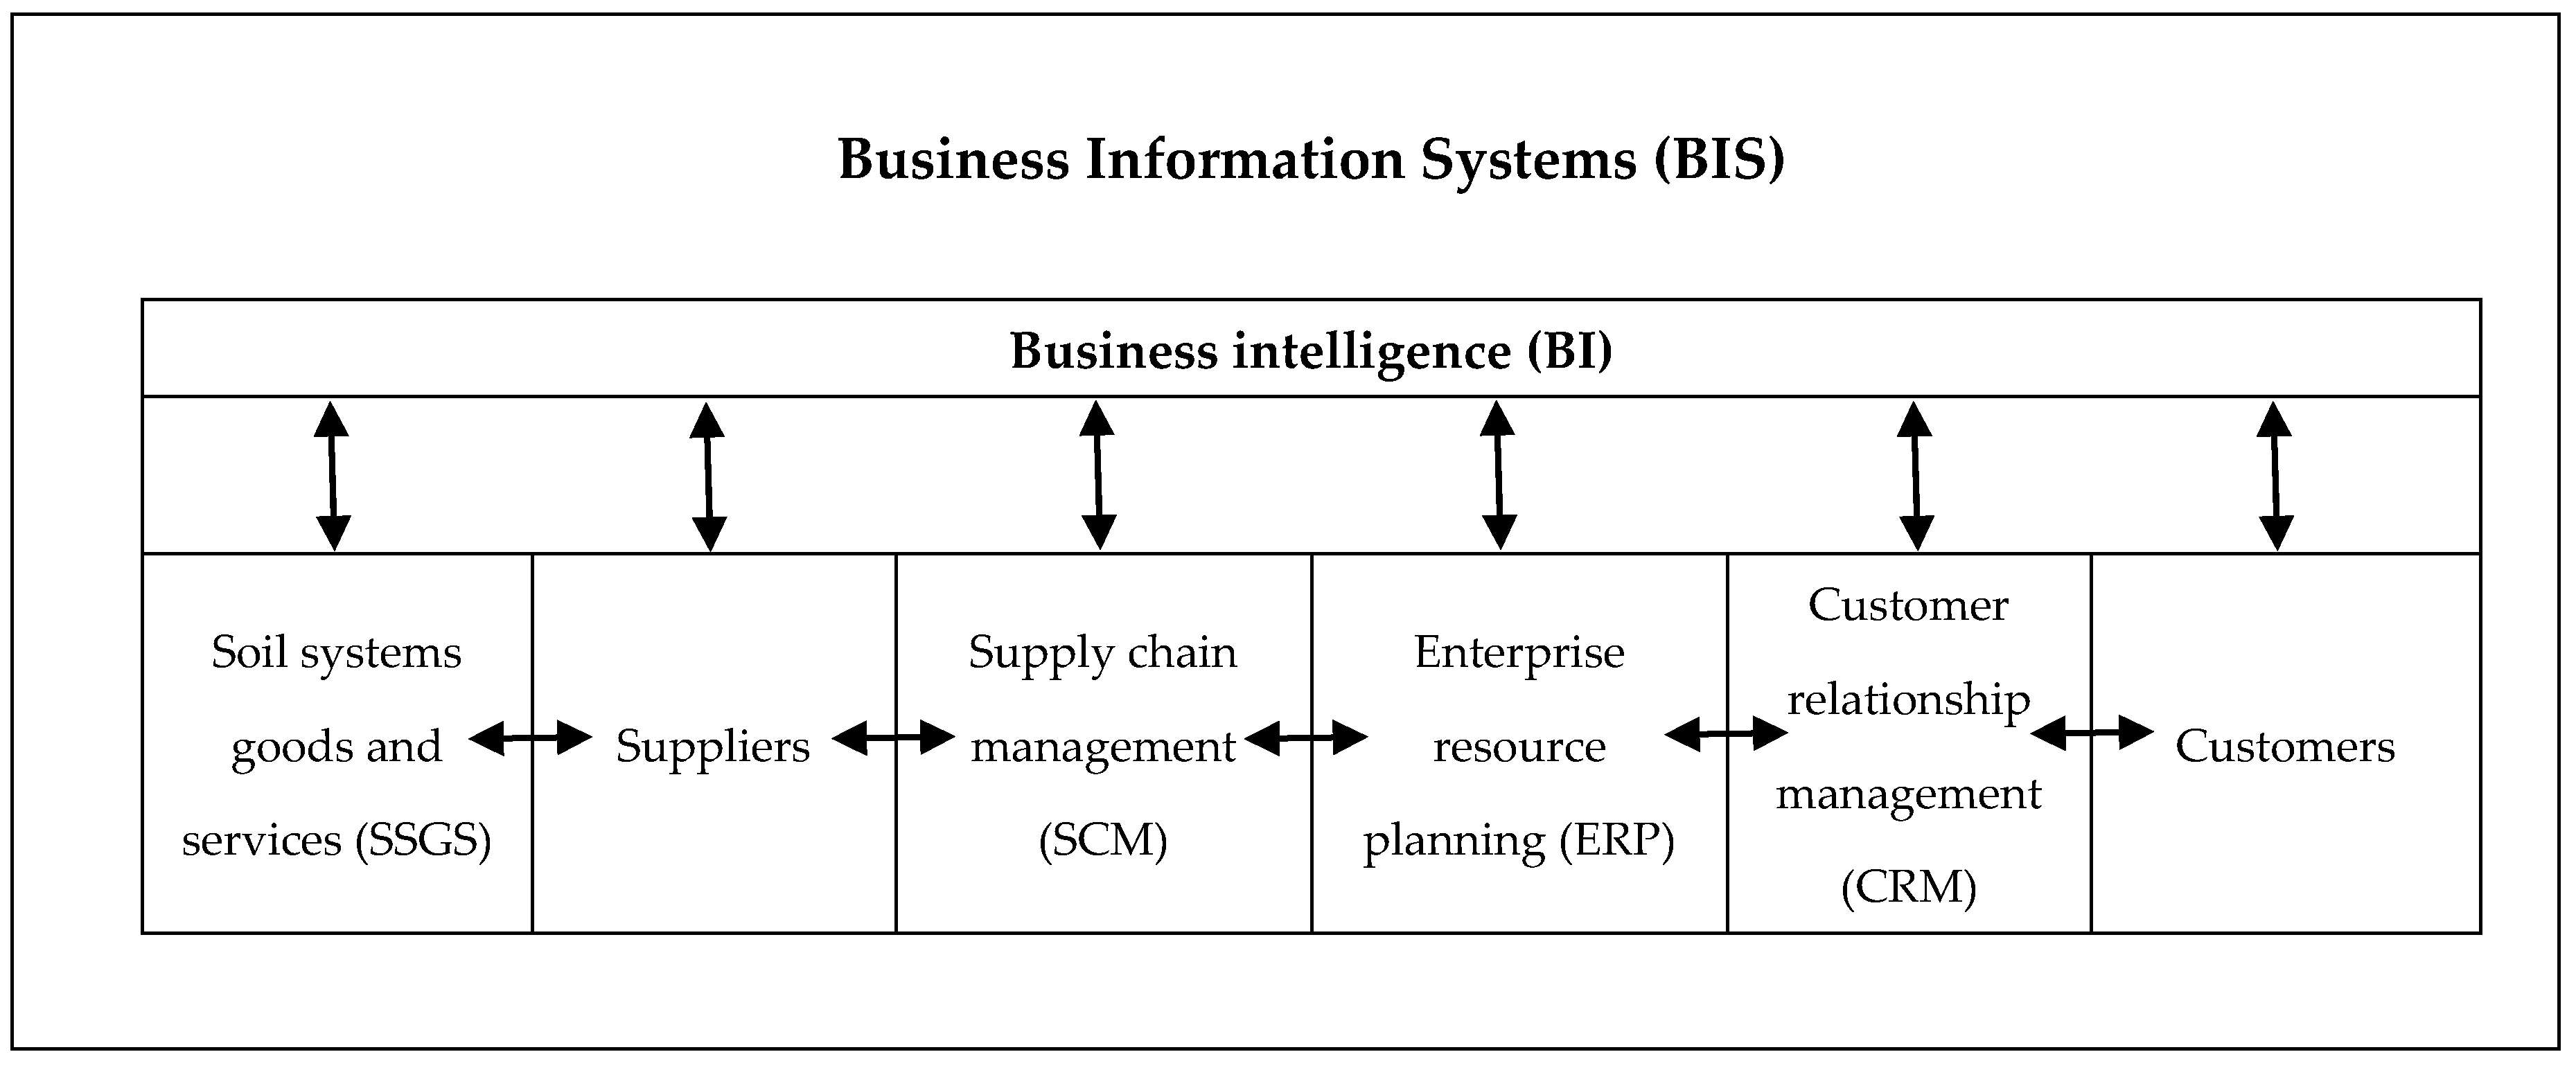
Soils are complex entities which are organized into soil systems with different organizational hierarchies, which can be integrated within the framework of ecosystem services (Table 1) and business information systems (BIS) (Figure 13). This organizational hierarchy of soil systems can be used by businesses (e.g., BIS, business intelligence (BI), etc.) in the economic valuation of soil ES/ED by scale (e.g., world, continent), time (e.g., soil, geologic), qualitative and quantitative degrees of computation (e.g., mental, verbal, descriptive, mathematical, deterministic, stochastic), and complexity (e.g., mechanistic, empirical) (Table 1). This review introduces soil systems goods and services (SSGS) to human business activity because it describes soil benefits/damages supplied to human societies, governments, businesses, individuals (e.g., farmers, etc.), and shared values between entities (Figure 11). This review has also provided examples of monetary valuations of SSGS based on the interaction of the pedosphere with Earth’s other spheres (Table 5).
Ecosystem goods, services, and disservices (including soil systems ones) are not typically integrated with BIS (Figure 13). In the business environment, suppliers are often associated with humans, but these suppliers rely on raw or transformed ecosystem goods and services from the Earth’s spheres. Suppliers (e.g., farmers, etc.) rely on ecosystem goods and services provided by the pedosphere and Earth’s other spheres; therefore, they need data and information provided by business intelligence (BI) to make sustainable purchasing decisions which will subsequently impact other parts of the BI system (Figure 13) to deliver to customers more sustainable products. This inclusion will provide businesses with various short-term and long-term benefits including sustainable sources of raw materials, a positive public view of corporate social responsibility [72], climate resilience in supply chain management (SCM) (Figure 13), improved risk analysis and reduction, the opportunity to participate in carbon markets, tax breaks, and many others. A business role is essential in overcoming market failures when it comes to ecosystem goods and services/disservices provided by soil systems at various scales [73]. Although economic valuations of ES are “serious underestimates of infinity” (Costanza et al., 1997) [74], they are useful in identifying unsustainable, inefficient use of resources, and comparing between use options during the decision-making process [73].
5. Conclusions
Current applications of the human-centered ES framework to soils are narrowly defined (e.g., soil-based, pedosphere-based, etc.) and focus on soil properties while treating soil as a closed system. Soils are complex open systems that form from the interaction of Earth’s various spheres (atmosphere, biosphere, lithosphere, hydrosphere, ecosphere, and anthroposphere), which contribute to ES/ED but are not accounted for in current ES/ED valuations. Since many ecosystems on Earth have been modified by human activity, there is a need to expand the scope of the soil (and pedosphere) definitions to include the anthroposphere. The anthroposphere has impacted all of the Earth’s spheres, and it is sometimes difficult to separate the human-derived from natural ES. The market transforms resources from the Earth’s spheres into goods and services/disservices for societal welfare with non-market institutions mediating the human and environmental interactions. These transformations and mediations can result not only in welfare but damages as well. This review proposes to use soil systems and its organizational hierarchy integrated with an ES framework in the economic valuations of soil ES/ED by scale (e.g., world, continent), time (e.g., soil, geologic), qualitative and quantitative degrees of computation (e.g., mental, verbal, descriptive, mathematical, deterministic, stochastic), and complexity (e.g., mechanistic, empirical).
Soil ES/ED can be valued using spatial, temporal, and spatial-temporal scales applicable to both science-based and administrative-based boundaries. In order to value ES/ED, data are required; however, humans can only do experiments over small-scale areas using a short-term temporal scale. This experimental data can be used to help parameterize models that can make predictions over large geographic extents and longer time frames to help access the full potential economic impact of soil change (e.g., thawing of permafrost in Gelisols and the massive release of various greenhouse gasses).
Time in soil systems often shows a relationship between the degree of soil weathering and the value of ES/ED. The degree of weathering/soil development puts bio-physical constraints on soils, its ES/ED, and monetary values associated with these services. This review demonstrated the effect of the degree of weathering on the value of provisioning ES from SIC using biophysical and administrative accounts with strongly weathered soils having essentially no SIC available in the soil. This would influence the fertilizer and liming investments required for agriculture. There is a common misconception that all soils can sequester carbon, but carbon sequestration potential is often directly limited by the degree of weathering. The pedological concept of time refers to natural soil processes, however anthropogenic pressures are rapidly transforming soils into “human-natural” bodies. These human impacts can result in the destruction of soil resources, which cannot be renewed on a human timescale.
Valuations of soil ES/ED can be done with various degrees of computation (quantitative or qualitative) and complexity (mechanistic or empirical), and examples of these valuations range from soil maps to the CENTURY model simulation of soil carbon dynamics and associated social costs of carbon dioxide emissions. This review provides examples of monetary valuations of ES/ED based on the interaction of the pedosphere with Earth’s other spheres using various market and non-market valuation methods (e.g., liming replacement costs, fertilizer replacement costs, etc.).
Ecosystem goods and services are not typically integrated with BIS. Suppliers rely on ecosystem goods and services provided by the pedosphere and Earth’s other spheres and need information provided by business intelligence (BI) to identify sustainable purchasing options which will deliver to customers more sustainable products. The integration of BIS with ES/ED valuations will provide businesses with benefits including more sustainably sourced raw materials, a more positive public perception, as well as climate resilience and risk reduction in supply chain management (SCM), the ability to participate in carbon markets, and other related regulatory incentives. This review introduces soil systems goods and services (SSGS) as a more inclusive term to describe the combination of anthropogenic and natural goods and services/disservices provided by soils. Although monetary valuations can be useful in human decision making, changes in soil systems are governed by natural processes and human induced changes may not be reversible on a human time scale.
Author Contributions
Conceptualization, E.A.M.; methodology, M.A.S., E.A.M., and G.C.P.; writing—original draft preparation, E.A.M., and C.J.P.; writing—review and editing, E.A.M., C.J.P., and M.A.S.; visualization, E.A.M., H.A.Z., G.C.P., and C.J.P. All authors have read and agreed to the published version of the manuscript.
Funding
This research received no external funding.
Acknowledgments
We would like to thank the reviewers for the constructive comments and suggestions.
Conflicts of Interest
The authors declare no conflict of interest.
References
- Farley, J. Ecosystem services: The economics debate. Ecosyst. Serv. 2012, 1, 40–49. [Google Scholar] [CrossRef] [Green Version]
- Watson, S.C.L.; Newton, A.C. Dependency of businesses on flows of ecosystem services: A case study from the county of Dorset, UK. Sustainability 2018, 10, 1368. [Google Scholar] [CrossRef] [Green Version]
- Davies, J. The business case for soil. Nature 2017, 543, 309–311. [Google Scholar] [CrossRef] [PubMed] [Green Version]
- Baveye, P.C.; Baveye, J.; Gowdy, J. Soil “ecosystem” services and natural capital: Critical appraisal of research on uncertain ground. Front. Environ. Sci. 2016, 4. [Google Scholar] [CrossRef]
- Van Es, H. A new definition of soil. CSA News 2017, 62, 20–21. [Google Scholar] [CrossRef] [Green Version]
- Targulian, V.O.; Arnold, R.W.; Miller, B.A.; Brevik, E.C. Pedosphere. In Encyclopedia of Ecology, 2nd ed.; Elsevier: Amsterdam, The Netherlands, 2019; Volume 4, pp. 162–168. [Google Scholar]
- Mattson, S. The constitution of the pedosphere. Ann. Agric. Coll. Swed. 1938, 5, 261–279. [Google Scholar]
- Heal, G. Nature and the Marketplace: Capturing the Value of Ecosystem Services; Island Press: Washington, DC, USA, 2000. [Google Scholar]
- Dijkerman, J.C. Pedology as a science: The role of data, models and theories in the study of natural soil systems. Geoderma 1974, 11, 73–93. [Google Scholar] [CrossRef]
- Hoosbeek, M.R.; Bryant, R.B. Towards the quantitative modeling of pedogenesis—A review. Geoderma 1992, 55, 183–210. [Google Scholar] [CrossRef]
- Chandler, R.D.; Mikhailova, E.A.; Post, C.J.; Moysey, S.M.J.; Schlautman, M.A.; Sharp, J.L.; Motallebi, M. Integrating soil analyses with frameworks for ecosystem services and organizational hierarchy of soil systems. Commun. Soil Sci. Plant Anal. 2018, 49, 1835–1843. [Google Scholar] [CrossRef]
- Adhikari, K.; Hartemink, A.E. Linking soils to ecosystem services—A global review. Geoderma 2016, 262, 101–111. [Google Scholar] [CrossRef]
- Millennium Ecosystem Assessment (MEA). Ecosystems and Human Well-Being: Synthesis; Island Press: Washington, DC, USA, 2005. [Google Scholar]
- USDA/NRCS. National Soil Survey Center: Partnership, Technical Excellence, Service; Brochure; National Soil Survey Center: Lincoln, NE, USA, April 2014.
- Groshans, G.R.; Mikhailova, E.A.; Post, C.J.; Schlautman, M.A. Accounting for soil inorganic carbon in the ecosystem services framework for the United Nations sustainable development goals. Geoderma 2018, 324, 37–46. [Google Scholar] [CrossRef] [Green Version]
- Mikhailova, E.A.; Groshans, G.R.; Post, C.J.; Schlautman, M.A.; Post, G.C. Valuation of total soil carbon stocks in the contiguous United States based on the avoided social cost of carbon emissions. Resources 2019, 8, 157. [Google Scholar] [CrossRef] [Green Version]
- Groshans, G.R.; Mikhailova, E.A.; Post, C.J.; Schlautman, M.A.; Zhang, L. Determining the value of soil inorganic carbon stocks in the contiguous United States based on the avoided social cost of carbon emissions. Resources 2019, 8, 119. [Google Scholar] [CrossRef] [Green Version]
- Rawlins, B.G.; Henrys, P.; Breward, N.; Robinson, D.A.; Keith, A.M.; Garcia-Bajo, M. The importance of inorganic carbon in soil carbon databases and stock estimates: A case study from England. Soil Use Manag. 2011, 27, 312–320. [Google Scholar] [CrossRef] [Green Version]
- Clarivate Analytics. Web of Science. Subscription-Based Website. 2020. Available online: https://clarivate.com/tag/web-of-science/ (accessed on 21 July 2020).
- Pavan, A.L.R.; Ometto, A.R. Ecosystem services in life cycle assessment: A novel conceptual framework for soil. Sci. Total Environ. 2018, 643, 1337–1347. [Google Scholar] [CrossRef] [PubMed]
- Pachepsky, Y.; Hill, R.L. Scale and scaling in soils. Geoderma 2017, 287, 4–30. [Google Scholar] [CrossRef]
- Mikhailova, E.A.; Altememe, A.H.; Bawazir, A.A.; Chandler, R.D.; Cope, M.P.; Post, C.J.; Stiglitz, R.Y.; Zurqani, H.A.; Schlautman, M.A. Comparing soil carbon estimates in glaciated soils at a farm scale using geospatial analysis of field and SSURGO data. Geoderma 2016, 281, 119–126. [Google Scholar] [CrossRef] [Green Version]
- EPA. The Social Cost of Carbon. EPA Fact Sheet. 2016. Available online: https://19january2017snapshot.epa.gov/climatechange/social-cost-carbon_.html (accessed on 15 March 2019).
- Guo, Y.; Amundson, R.; Gong, P.; Yu, Q. Quantity and spatial variability of soil carbon in the conterminous United States. Soil Sci. Soc. Am. J. 2006, 70, 590–600. [Google Scholar] [CrossRef] [Green Version]
- USGS. Minerals Yearbook, 2014: Stone, Crushed (Advance Release); USA Department of the Interior, USA Geological Survey: Reston, VA, USA, April 2016; p. 71.2. Available online: https://minerals.usgs.gov/minerals/pubs/commodity/stone_crushed/myb1-2014-stonc.pdf (accessed on 20 July 2018).
- Zurek, M.B.; Henrichs, T. Linking scenarios across geographical scales in international environmental assessments. Technol. Forecast. Soc. Change 2007, 74, 1282–1295. [Google Scholar] [CrossRef]
- Reyer, C.P.O.; Brouwers, N.; Rammig, A.; Brook, B.W.; Epila, J.; Grant, R.F.; Holmgren, M.; Langerwisch, F.; Leuzinger, S.; Lucht, W.; et al. Forest resilience and tipping points at different spatio-temporal scales: Approaches and challenges. J. Ecol. 2015, 103, 5–15. [Google Scholar] [CrossRef] [Green Version]
- Bockheim, J.G.; Hinkel, K.M. The importance of “deep” organic carbon in permafrost-affected soils of Arctic Alaska. SSSAJ Soil Sci. Soc. Am. J. 2007, 71, 1889–1892. [Google Scholar] [CrossRef]
- Streletskiy, D.A.; Suter, L.J.; Shiklomanov, N.I.; Porfiriev, B.N.; Eliseev, D.O. Assessment of climate change impacts on buildings, structures and infrastructure in the Russian regions on permafrost. Environ. Res. Lett. 2019, 14, 025003. [Google Scholar] [CrossRef]
- Ping, C.L.; Jastrow, J.D.; Jorgenson, M.T.; Michaelson, G.J.; Shur, Y.L. Permafrost soils and carbon cycling. Soil 2015, 1, 147–171. [Google Scholar] [CrossRef] [Green Version]
- Waelbroeck, C.; Monfray, P.; Oechel, W.C.; Hastings, S.; Vourlitis, G. The impact of permafrost thawing on the carbon dynamics of tundra. Geophys. Res. Lett. 1997, 24, 229–232. [Google Scholar] [CrossRef]
- Zhuang, Q.; Melillo, J.M.; Sarofim, M.C.; Kicklighter, D.W.; McGuire, A.D.; Felzer, B.S.; Sokolov, A.; Prinn, R.G.; Steudler, P.A.; Hu, S. CO2 and CH4 exchanges between land ecosystems and the atmosphere in northern high latitudes over the 21st century. Geophys. Res. Lett. 2006, 33, L17403. [Google Scholar] [CrossRef] [Green Version]
- Koven, C.D.; Ringeval, B.; Friedlingstein, P.; Ciais, P.; Cadule, P.; Khvorostyanov, D.; Krinner, G.; Tarnocai, C. Permafrost carbon-climate feedbacks accelerate global warming. Proc. Natl. Acad. Sci. USA 2011, 108, 14769–14774. [Google Scholar] [CrossRef] [PubMed] [Green Version]
- Schaefer, K.; Zhang, T.; Bruhwiler, L.; Barrett, A.P. Amount and timing of permafrost carbon release in response to climate warming. Tellus B 2011, 63, 165–180. [Google Scholar] [CrossRef]
- Burke, E.J.; Hartley, I.P.; Jones, C.D. Uncertainties in the global temperature change caused by carbon release from permafrost thawing. Cryosphere 2012, 6, 1063–1076. [Google Scholar] [CrossRef] [Green Version]
- MacDougall, A.H.; Avis, C.A.; Weaver, A.J. Significant existing commitment to warming from the permafrost carbon feedback. Nat. Geosci. 2012, 5, 719–721. [Google Scholar] [CrossRef]
- Schneider von Deimling, T.; Meinshausen, M.; Levermann, A.; Huber, V.; Frieler, K.; Lawrence, D.M.; Brovkin, V. Estimating the near-surface permafrost-carbon feedback on global warming. Biogeosciences 2012, 9, 649–665. [Google Scholar] [CrossRef] [Green Version]
- Gershkovich, E. In Siberian Fuel Spill, Climate Change Is Seen as Major Factor. The Moscow Times, 2020. Available online: https://www.themoscowtimes.com/2020/06/05/in-siberian-fuel-spill-climate-change-is-seen-as-major-factor-a70494 (accessed on 5 June 2020).
- Brantley, S.L. Understanding soil time. Science 2008, 321, 1454–1455. [Google Scholar] [CrossRef] [PubMed]
- Amundson, R. The carbon budget in soils. Annu. Rev. Earth Planet. Sci. 2001, 29, 535–562. [Google Scholar] [CrossRef]
- Mikhailova, E.A.; Zurqani, H.A.; Post, C.J.; Schlautman, M.A. Assessing ecosystem services of atmospheric calcium and magnesium deposition for potential soil inorganic carbon sequestration. Geosciences 2020, 10, 200. [Google Scholar] [CrossRef]
- Smith, P.; Andrén, O.; Karlsson, T.; Perälä, P.; Regina, K.; Rounsevell, M.; Van Wesemaels, B. Carbon sequestration potential in European croplands has been overestimated. Global Change Biol. 2005, 11, 2153–2163. [Google Scholar] [CrossRef]
- Richter, D.B.; Bacon, A.R.; Brecheisen, Z.; Mobley, M.L. Soil in the Anthropocene. Soil change matters. 2014. In Proceedings of the IOP Conference Series: Earth and Environmental Science, Bendigo, Victoria, Australia, 24–27 March 2014; Volume 25, p. 012010. [Google Scholar] [CrossRef] [Green Version]
- Trudgill, S. “Dirt cheap”—Cultural constructs of soil: A challenge for education about soils? J. Geogr. Higher Educ. 2006, 30, 7–14. [Google Scholar] [CrossRef]
- Stockmann, U.; Minasny, B.; McBratney, A.B. How fast does soil grow? Geoderma 2014, 216, 48–61. [Google Scholar] [CrossRef]
- Mikhailova, E.A.; Schlautman, M.A.; Darnault, C.J.G.; Sharp, J.L.; Post, C.J.; Hall, K.C.; Outz, E.V.; Barfield, M.A. Effects of compost on the chemistry of an urban Upper Piedmont South Carolina soil. Commun. Soil Sci. Plant Anal. 2015, 22, 2787–2797. [Google Scholar] [CrossRef]
- Mikhailova, E.A.; Bryant, R.B.; Galbraith, J.M.; Wang, Y.; Post, C.J.; Khokhlova, O.S.; Schlautman, M.A.; Cope, M.P.; Shen, Z. Pedogenic carbonates and radiocarbon isotopes of organic carbon at depth in the Russian Chernozem. Geosciences 2018, 8, 458. [Google Scholar] [CrossRef] [Green Version]
- Drohan, P.J.; Farnham, T.J. Protecting life’s foundation: A proposal for recognizing rare and threatened soils. Soil Sci. Soc. Am. J. 2006, 70, 2086–2096. [Google Scholar] [CrossRef]
- Pearce, F. Arctic permafrost set to disappear over next century. New Sci. 2006, 2537, 15. [Google Scholar]
- Plaza, C.; Pegoraro, E.; Bracho, R.; Celis, G.; Crummer, K.G.; Hutchings, J.A.; Pries, C.E.H.; Mauritz, M.; Natali, S.M.; Salmon, V.G.; et al. Direct observation of permafrost degradation and rapid carbon loss in tundra. Nat. Geosci. 2019, 12, 627–631. [Google Scholar] [CrossRef]
- Duncombe, J. How Financial Markets Can Grow More Climate Savvy. Available online: https://0-doi-org.brum.beds.ac.uk/10.1029/2020EO143124 (accessed on 22 April 2020).
- Lin, H. Three principles of soil change and pedogenesis in time and space. Soil Sci. Soc. Am. J. 2011, 75, 2049–2070. [Google Scholar] [CrossRef] [Green Version]
- Davidson, E.A. Dirt cheap soil. Nature 2007, 447, 777–778. [Google Scholar] [CrossRef] [Green Version]
- Lobry de Bruyn, L.A.; Abbey, J.A. Characterisation of farmers’ soil sense and the implications for on-farm monitoring of soil health. Aust. J. Exp. Agric. 2003, 43, 285–305. [Google Scholar] [CrossRef]
- Hoosbeek, M.R.; Amundson, R.G.; Bryant, R.B. Pedological modeling. In Handbook of Soil Science; Sumner, M.E., Ed.; CRC Press: Boca Raton, FL, USA, 2000; p. E-77. [Google Scholar]
- Yadav, G.S.; Lal, R.; Meena, R.S. Long-term effects of vehicular passages on soil carbon sequestration and carbon dioxide emission in a no-till corn-soybean rotation on a Crosby silt loam in Central Ohio, USA. J. Plant Nutr. Soil Sci. 2019, 182, 126–136. [Google Scholar] [CrossRef] [Green Version]
- Parton, W.J.; Ojima, D.S.; Cole, C.V.; Schimel, D.S. A general model for soil organic matter dynamics: Sensitivity to litter chemistry, texture and management. In Quantative Modeling in Soil Forming Processes; Bryant, R.B., Arnold, R.W., Eds.; SSSA Special Publications: Madison, WI, USA, 1994; p. 39. [Google Scholar]
- Mikhailova, E.A.; Bryant, R.B.; DeGloria, S.D.; Post, C.J.; Vassenev, I.I. Modeling soil organic matter dynamics after conversion of native grassland to long-term continuous fallow using the CENTURY model. Ecol. Model. 2000, 132, 247–257. [Google Scholar] [CrossRef]
- Brown, T.C.; Bergstrom, J.C.; Loomis, J.B. Defining, valuing, and providing ecosystem goods and services. Nat. Resour. J. 2007, 47, 329–376. [Google Scholar]
- Mikhailova, E.A.; Post, C.J.; Schlautman, M.A.; Groshans, G.R.; Cope, M.P.; Zhang, L. A systems-based approach to ecosystem services valuation of various atmospheric calcium deposition flows. Resources 2019, 8, 66. [Google Scholar] [CrossRef] [Green Version]
- Groshans, G.R.; Mikhailova, E.A.; Post, C.J.; Schlautman, M.A.; Cope, M.P.; Zhang, L. Ecosystem services assessment and valuation of atmospheric magnesium deposition. Geosciences 2019, 9, 331. [Google Scholar] [CrossRef] [Green Version]
- Mikhailova, E.A.; Post, G.C.; Cope, M.P.; Post, C.J.; Schlautman, M.A.; Zhang, L. Quantifying and mapping atmospheric potassium deposition for soil ecosystem services assessment in the United States. Front. Environ. Sci. 2019, 7. [Google Scholar] [CrossRef]
- Groshans, G.R.; Mikhailova, E.A.; Post, C.J.; Schlautman, M.A.; Zurqani, H.A.; Zhang, L. Assessing the value of soil inorganic carbon for ecosystem services in the contiguous United States based on liming replacement costs. Land 2018, 7, 149. [Google Scholar] [CrossRef] [Green Version]
- Mikhailova, E.A.; Groshans, G.R.; Post, C.J.; Schlautman, M.A.; Post, G.C. Valuation of soil organic carbon stocks in the contiguous United States based on the avoided social cost of carbon emissions. Resources 2019, 8, 153. [Google Scholar] [CrossRef] [Green Version]
- Moore, J.F. Predators and prey: A new ecology of competition. Harv. Bus. Rev. 1993, 71, 75–86. [Google Scholar] [PubMed]
- Bartkowski, B.; Hansjürgens, B.; Möckel, S.; Bartke, S. Institutional economics of agricultural soil ecosystem services. Sustainability 2018, 10, 2447. [Google Scholar] [CrossRef] [Green Version]
- Nicolodi, M.; Gianello, C. Understanding soil as an open system and fertility as an emergent property of the soil system. Sustain. Agric. Res. 2015, 4, 94–105. [Google Scholar] [CrossRef]
- Guerry, A.D.; Polasky, S.; Lubchenco, J.; Chaplin-Kramer, R.; Daily, G.C.; Griffin, R.; Ruckelshaus, M.; Bateman, I.J.; Duraiappah, A.; Elmqvist, T.; et al. Natural capital and ecosystem services informing decisions: From promise to practice. Proc. Natl. Acad. Sci. USA 2015, 112, 7348–7355. [Google Scholar] [CrossRef] [Green Version]
- Gould, S.J. The Structure of Evolutionary Theory; The Belknap Press of Harvard University Press: Cambridge, MA, USA; London, UK, 2002. [Google Scholar]
- Gould, S.J. Punctuated Equilibrium; The Belknap Press of Harvard University Press: Cambridge, MA, USA; London, UK, 2007. [Google Scholar]
- Rajnoha, R.; Kádárová, J.; Sujová, A.; Kádár, G. Business information systems: Research study and methodological proposals for ERP implementation process improvement. Procedia Soc. Behav. Sci. 2014, 109, 165–170. [Google Scholar] [CrossRef] [Green Version]
- Alvarado-Herrera, A.; Bigne, E.; Aldas-Manzano, J.; Curras-Perez, R. A scale for measuring consumer perceptions of corporate social responsibility following the sustainable development paradigm. J. Bus. Ethics 2017, 140, 243–262. [Google Scholar] [CrossRef]
- Robinson, D.A.; Jackson, B.M.; Clothier, B.E.; Dominati, E.J.; Marchant, S.C.; Cooper, D.M.; Bristow, K.L. Advances in soil ecosystem services: Concepts, models, and applications for Earth system life support. Vadose Zone J. 2013. [Google Scholar] [CrossRef] [Green Version]
- Costanza, R.R.; d’Arge, R.; de Groot, S.; Farber, M.; Grasso, B.; Hannon, K.; Limburg, S.; Naeem, R.V.; O’neill, J.; Paruelo, R.G.; et al. The value of the world’s ecosystem services and natural capital. Nature 1997, 387, 253–260. [Google Scholar] [CrossRef]
Figure 1.
The scope of: (a) soil and relationship between soil components from various Earth’s spheres; (b) formation of two-sphere, three-sphere, and four-sphere (e.g., pedosphere) systems in nature (A = atmosphere; B = biosphere; H = hydrosphere; L = lithosphere) (adapted from Mattson, 1938 [7]).
Figure 1.
The scope of: (a) soil and relationship between soil components from various Earth’s spheres; (b) formation of two-sphere, three-sphere, and four-sphere (e.g., pedosphere) systems in nature (A = atmosphere; B = biosphere; H = hydrosphere; L = lithosphere) (adapted from Mattson, 1938 [7]).

Figure 2.
Conceptual diagram of how the market transforms resources from the Earth’s spheres (A = atmosphere; B = biosphere; H = hydrosphere; L = lithosphere; P = pedosphere; Ecosphere, and Anthroposphere) into goods and services for societal welfare with non-market institutions mediating human and environmental interactions (adapted from Heal, 2000 [8]). These transformations and mediations can result not only in welfare but damages as well.

Figure 3.
Example of a soil system scale. For the soil order Entisols at the Willsboro Farm (NY), an increasing spatial scale increases the value of total soil carbon (TSC) storage based on interpolated soil core results (based on data from Mikhailova et al., 2016 [22]) and an avoided social cost of carbon emission (SC-CO2) of USD 42 per metric ton of CO2 [23].

Figure 4.
Example of an administrative scale. Replacement cost valuation of soil inorganic carbon (SIC) in the contiguous United States, based on data reported by Guo et al. 2006 [24] and the 2014 U.S. average price of USD 10.42 per U.S. ton of agricultural limestone (CaCO3) [25] (i.e., symbols used for region spatial scale are USD 2.56B billion, where B = billion = 109; USD 3.29 trillion, where T = trillion = 1012).

Figure 5.
Example of a spatio-temporal scale (based on Reyer et al., 2015 [27]). Total values of soil carbon (C) storage in Gelisols in the upper 100 cm [28] based on an avoided social cost of carbon emissions (SC-CO2) of USD 42 per metric ton of CO2 [23] (i.e., USD 60.5 trillion U.S. dollars, where T = trillion = 1012).

Figure 6.
Possible combinations for the degree of computation and the degree of complexity that can be used in the valuation of soil systems goods and services (SSGS).
Figure 6.
Possible combinations for the degree of computation and the degree of complexity that can be used in the valuation of soil systems goods and services (SSGS).

Figure 7.
Example of qualitative-empirical valuation of soil inorganic carbon (SIC) based on replacement cost method using the 2014 U.S. average price of $10.42 per U.S. ton of agricultural limestone (CaCO3) [25] at the Willsboro Farm, Willsboro, NY from SSURGO results averaged over soil map units (SMUs) (based on data from Mikhailova et al., 2016 [22]).

Figure 8.
Example of qualitative-mechanistic valuation of soil inorganic carbon (SIC) based on replacement cost method using the 2014 U.S. average price of $10.42 per U.S. ton of agricultural limestone (CaCO3) [25] at the Willsboro Farm, Willsboro, NY interpolated from soil core sample results (based on data from Mikhailova et al., 2016 [22]).

Figure 9.
Example of quantitative-empirical valuation using the linear regression relationship between soil CO2 fluxes and soil temperature during winter (p = 0.009) in a no-till corn-soybean rotation on a Crosby silt loam in Central Ohio, USA, under long-term effects of vehicular passages. Regression equation shown in the figure is for soil CO2 flux vs. soil temperature. The associated values/disservices shown on the right y-axis are based on an avoided SC-CO2 of USD 42/metric ton of CO2 [22] (based on data from Yadav et. al., 2019 [56]).

Figure 10.
Example of quantitative-mechanistic valuation of soil organic carbon (SOC) simulated by the CENTURY model (Parton et al., 1994 [57]) based on data from Mikhailova et al. (2000) [58]. The associated values shown on the right y-axis are based on an avoided SC-CO2 of USD 42/metric ton of CO2 [23].

Figure 11.
Relationship between different types of stakeholders and their values: societal, government, business, and individual with regards to soil ecosystem goods and services.
Figure 11.
Relationship between different types of stakeholders and their values: societal, government, business, and individual with regards to soil ecosystem goods and services.

Figure 12.
The newly expanded scope of the definition of soil: (a) soil and relationship between soil components from Earth’s various spheres; (b) formation of two-sphere, three-sphere, and four-sphere (e.g., pedosphere) systems in nature (A = atmosphere; B = biosphere; H = hydrosphere; L = lithosphere; Ecosphere, and Anthroposphere) (adapted from Mattson, 1938 [7]).

Figure 13.
Integration of soil systems goods and services (SSGS) (including goods and services provided by interaction of soil with various Earth’s spheres) into the enterprise resource planning (ERP) within the Business Information Systems (BIS) (adapted from Rajnoha et al., 2014 [71]).
Figure 13.
Integration of soil systems goods and services (SSGS) (including goods and services provided by interaction of soil with various Earth’s spheres) into the enterprise resource planning (ERP) within the Business Information Systems (BIS) (adapted from Rajnoha et al., 2014 [71]).


Table 1.
Integration of ecosystem services (ES) framework with organizational hierarchy of soil systems (adapted from Dijkerman, 1974 [9]; Hoosbeek and Bryant, 1992 [10]; Chandler et. al., 2018 [11]; Adhikari and Hartemink, 2016 [12]).
| Organizational Hierarchy of Soil System | Framework for Ecosystem Services | |||||
|---|---|---|---|---|---|---|
| Degree of … | Ecosystem Services | |||||
| Soil System (Scale) | Time | Computation (Qualitative or Quantitative) | Complexity (Mechanistic or Empirical) | Provisioning | Regulation and Maintenance | Cultural |
| World | ||||||
| i + 6 | x | x | x | x | x | x |
| Continent | ||||||
| i + 5 | x | x | x | x | x | x |
| Region | ||||||
| i + 4 | x | x | x | x | x | x |
| Watershed | ||||||
| i + 3 | x | x | x | x | x | x |
| Catena | ||||||
| i + 2 | x | x | x | x | x | x |
| Polypedon | ||||||
| i + 1 | x | x | x | x | x | x |
| Pedon | ||||||
| i | x | x | x | x | x | x |
| Soil | ||||||
| horizon | ||||||
| i − 1 | x | x | x | x | x | x |
| Soil | ||||||
| structure | ||||||
| i − 2 | x | x | x | x | x | - |
| Basic | ||||||
| structure | ||||||
| i − 3 | x | x | x | x | x | - |
| Molecular | ||||||
| interaction | ||||||
| i − 4 | x | x | x | x | x | - |
Note: (i − 1) indicates the levels of scale hierarchy according to the organizational hierarchy of soil systems, where the behavior of a system at the extent scale (i level) can be described in terms of attributes at lower (−) or upper (+) scale levels (adapted from Dijkerman, 1974 [9]).
Table 2.
Conceptual overview of the accounting framework for a systems-based approach in the ecosystem services (ES) valuation of various soil systems goods and services (SSGS) based on organizational hierarchy of soil systems (adapted from Groshans et al., 2018 [15]).
Table 2.
Conceptual overview of the accounting framework for a systems-based approach in the ecosystem services (ES) valuation of various soil systems goods and services (SSGS) based on organizational hierarchy of soil systems (adapted from Groshans et al., 2018 [15]).
| Biophysical Accounts (Science-Based) | Administrative Accounts (Boundary-Based) | Monetary Accounts | Benefit/Damage | Total Value |
|---|---|---|---|---|
| Soil extent: | Administrative extent: | Ecosystem good(s) and service(s): | Sector: | Types of value: |
| Examples of monetary valuations based on soil properties and organizational hierarchy of soil systems | ||||
| Examples of monetary valuations based on interaction of pedosphere and Earth’s other spheres and organizational hierarchy of soil systems | ||||
| Organizational hierarchy of soil system (i − 4 to i + 6) | Administrative organizational hierarchy (i − 4 to i + 6) | Provisioning, regulation/maintenance, and cultural | Environment, agriculture, industry etc. | Market and non-market valuations |
Note: (i − 4) indicates the levels of scale hierarchy according to the organizational hierarchy of soil systems, where the behavior of a system at the extent scale (i level) can be described in terms of attributes at lower (−) or upper (+) scale levels (adapted from Dijkerman, 1974 [9]).
Table 3.
Degree of soil development and area-normalized midpoint values of soil inorganic carbon (SIC) storage in the upper 2-m soil depth within the contiguous United States (U.S.) based on midpoint SIC numbers from Guo et al., 2006 [24] and USD 10.42 price per U.S. ton of agricultural lime (CaCO3) in the U.S. (2014) [25].
| Slight ←-------------- Degree of Weathering and Soil Development -------------→ Strong | |||||
|---|---|---|---|---|---|
| Slight Weathering | Intermediate Weathering | Strong Weathering | |||
| Soil Order | Midpoint SIC Value per Area ($ m−2) | Soil Order | Midpoint SIC Value per Area ($ m−2) | Soil Order | Midpoint SIC Value per Area ($ m−2) |
| Entisols | 0.46 | Aridisols | 1.52 | Spodosols | 0.06 |
| Inceptisols | 0.49 | Vertisols | 2.22 | Ultisols | 0.00 |
| Histosols | 0.23 | Alfisols | 0.41 | Oxisols | - |
| Gelisols | - | Mollisols | 1.10 | ||
| Andisols | 0.00 | ||||
Table 4.
Integration of biophysical accounts (science-based) and administrative accounts (boundary-based). Degree of soil development and area-normalized midpoint values of soil inorganic carbon (SIC) storage in the upper 2-m soil depth within the contiguous United States (U.S.) based on midpoint SIC numbers from Guo et al., 2006 [24] and USD 10.42 price per U.S. ton of agricultural lime (CaCO3) in the U.S. (2014) [25].
| Slight ←------------------------------ Degree of Weathering and Soil Development ------------------→ Strong | |||||
|---|---|---|---|---|---|
| Slight Weathering | Intermediate Weathering | Strong Weathering | |||
| State (Region) | Midpoint SIC Value per Area ($ m−2) | State (Region) | Midpoint SIC Value per Area ($ m−2) | State (Region) | Midpoint SIC Value per Area ($ m−2) |
| Connecticut | 0.01 | Iowa | 1.12 | Alabama | 0.00 |
| Delaware | 0.00 | Illinois | 0.72 | Florida | 0.06 |
| Maryland | 0.00 | Indiana | 1.13 | Georgia | 0.01 |
| Maine | 0.00 | Michigan | 1.17 | Kentucky | 0.01 |
| New Hampshire | 0.00 | Minnesota | 1.35 | Mississippi | 0.03 |
| New Jersey | 0.00 | Missouri | 0.11 | North Carolina | 0.00 |
| New York | 0.12 | Ohio | 0.60 | South Carolina | 0.02 |
| Pennsylvania | 0.00 | Wisconsin | 0.37 | Tennessee | 0.00 |
| Rhode Island | 0.00 | (Midwest) | 0.82 | Virginia | 0.00 |
| Vermont | 0.06 | (Southeast) | 0.01 | ||
| West Virginia | 0.00 | ||||
| (East) | 0.03 | ||||
Table 5.
Examples of monetary valuations based on the interaction of the pedosphere with Earth’s other spheres and organizational hierarchy of soil systems.
Table 5.
Examples of monetary valuations based on the interaction of the pedosphere with Earth’s other spheres and organizational hierarchy of soil systems.
| Earth’s Sphere(s) | Example (Valuation) | Type | Soil System (Scale) | Source(s) |
|---|---|---|---|---|
| Ecosystem Services: Provisioning, maintenance | ||||
| Atmosphere, Hydrosphere, Anthroposphere | Atmospheric Ca2+ deposition (market, liming replacement costs) | Abiotc | i + 4 | [60] |
| Atmospheric Mg2+ deposition (market, liming replacement costs) | Abiotc | i + 4 | [61] | |
| Atmospheric K+ deposition (market, fertilizer replacement costs) | Abiotc | i + 4 | [62] | |
| Lithosphere, Anthroposphere | Soil inorganic carbon (SIC)–2-m soil depth (market, liming replacement costs) | Abiotc | i + 4 | [15,17] |
| Ecosystem Services: Regulation | ||||
| Atmosphere, Hydrosphere, Anthroposphere | Atmospheric Ca2+ and Mg2+ deposition (avoided social costs of carbon dioxide emissions, SC-CO2) | Abiotc | i + 4 | [41] |
| Lithosphere, Anthroposphere | Soil inorganic carbon (SIC)–2-m soil depth (avoided social costs of carbon dioxide emissions, SC-CO2) | Abiotc | i + 4 | [63] |
| Biosphere, Anthroposphere | Soil organic carbon (SOC)–2-m soil depth (avoided social costs of carbon dioxide emissions, SC-CO2) | Biotic | i + 4 | [64] |
| Biosphere, Lithosphere, Anthroposphere | Total soil carbon (TSC)–2-m soil depth (avoided social costs of carbon dioxide emissions, SC-CO2) | Biotic + Abiotic | i + 4 | [16] |
Note: (i + 4) indicates the levels of scale hierarchy according to the organizational hierarchy of soil systems, where the behavior of a system at the extent scale (i level) can be described in terms of attributes at lower (−) or upper (+) scale levels (adapted from Dijkerman, 1974 [9]).
© 2020 by the authors. Licensee MDPI, Basel, Switzerland. This article is an open access article distributed under the terms and conditions of the Creative Commons Attribution (CC BY) license (http://creativecommons.org/licenses/by/4.0/).
Share and Cite
MDPI and ACS Style
Mikhailova, E.A.; Post, C.J.; Schlautman, M.A.; Post, G.C.; Zurqani, H.A. The Business Side of Ecosystem Services of Soil Systems. Earth 2020, 1, 15-34. https://0-doi-org.brum.beds.ac.uk/10.3390/earth1010002
AMA Style
Mikhailova EA, Post CJ, Schlautman MA, Post GC, Zurqani HA. The Business Side of Ecosystem Services of Soil Systems. Earth. 2020; 1(1):15-34. https://0-doi-org.brum.beds.ac.uk/10.3390/earth1010002
Chicago/Turabian StyleMikhailova, Elena A., Christopher J. Post, Mark A. Schlautman, Gregory C. Post, and Hamdi A. Zurqani. 2020. "The Business Side of Ecosystem Services of Soil Systems" Earth 1, no. 1: 15-34. https://0-doi-org.brum.beds.ac.uk/10.3390/earth1010002