Article

Using XVIII–XIX Cent. Maps and Modern Remote Sensing Data for Detecting the Changes in the Land Use at Bulgarian Fortified Settlements in the Volga Region

1
Department of Landscape Ecology, Kazan Federal University, 5, Tovarishcheskaya St., 420097 Kazan, Russia
2
Restoration and Analytical Department, Institute of Archaeology Named after A. Kh. Khalikov Tatarstan Academy of Sciences, 30 Butlerova St., 420012 Kazan, Russia
3
GIS Center, Innopolis University, 1 Universitetskaya St., 420005 Innopolis, Russia
4
Department of Archaeology, Faculty of Humanities and Social Sciences, Memorial University of Newfoundland, P.O. Box 4200, St. John’s, NL A1C 5S7, Canada
*
Author to whom correspondence should be addressed.
Submission received: 30 November 2020 / Revised: 24 January 2021 / Accepted: 25 January 2021 / Published: 29 January 2021

Abstract

:
This study uses modern and historic spatial data to analyze land use around 13th Century AD Bulgarian fortified settlements to examine the current state of these features and how changes in land use over the past two centuries have affected these features. Historic maps from the late 18th to the early 19th centuries AD were used alongside Landsat 8 images from 2015–2018 as a source of information about land use. Based on the results of archival map analysis and the classification of satellite imagery, the interpretation of land use around Bulgarian fortified settlements was possible. This method generated new data about land use dynamics near cultural heritage sites in the Volga Region. The diachronic study of sequential map data allowed researchers to further understand how anthropogenic factors have impacted the survivability of Bulgarian sites in the region. Among these, arable farming, hydro-electric power generation, and urban growth have had the greatest impact on these features.

1. Introduction

The use of digitized historical survey data in Russia to analyze heritage sites has been slowly growing over the past 30 years. However, formative studies of archaeological data from historical surveys are not widely cited in the wider heritage literature [1,2,3,4], largely because the primary drive in Russian archaeology is to understand the heritage of vast swathes of land.
The most widely used studies have typically been archaeological site catalogs prepared as geodatabases, which have been used in areas such as Karelia [5]. The use of a geographic information system (GIS), in this case, is not entirely unproblematic, as it requires a code of best practice that must be developed from a solid theoretical stance. In Russia, this has largely been implemented by Grishin [6,7,8], who has attempted to codify the practice of GIS for archaeology. R.N. Batalov and L.K. Radchenko recently reviewed the theoretical and methodological aspects of historical cartographic research using GIS in Russia [9,10]. Their review focused on the importance of site recording from these maps, and the possibility of cataloging historically known sites, and the further possibilities of applying GIS analyses to this data. R.N. Batalov and L.K. Radchenko took the view that through the analysis of historic maps, more site data may be recovered and that these maps may play an important part in better understanding the spatiality of Russian archaeology.
Recent advances in digital technology have opened up new and previously inaccessible opportunities to review cartographic data. In particular, georeferencing transforms old maps from purely archival documents into real geographical data. Today, the use of historical maps in the digital environment is a common phenomenon both in many historical disciplines, including archaeology and in the management of historical and cultural heritage. This allows cultural heritage sites that have since been destroyed to be recorded as a component of heritage databases.
In addition, historical maps provide valuable information on changes in the built environment and natural landscapes before active economic and industrial development, which allows researchers to assess the distribution of archaeological features [11]. Remote sensing data is more commonly used to study anthropogenic and natural changes. However, this only allows the researcher to view data from the past six decades. The use of historical maps from the 18th and 19th centuries AD in GIS allows archaeologists and historians to analyze features that may have been damaged by natural or anthropogenic effects over the past few centuries.
At present, this interdisciplinary historical and geographical research is actively developing. These studies are particularly important for analyses of the cultural heritage of forests [12] and archaeological predictive model agricultural areas [13] and allow a deeper temporal analysis of changing landscapes over the past two centuries [14,15,16].
One of the key issues in the inclusion of digitized historical maps into GIS environments is that they must be georeferenced into a modern coordinate reference system for direct comparison with other maps and spatial data, either historical or modern [17]. Georeferencing is done using reference points, which can be represented by churches, bridges, and other objects that have survived to the present day. The reference points can be taken from either terrestrial surveyed data or satellite imagery [18]. It is not always possible to correlate historical maps with modern spatial data because of issues with their accuracy and the difficulty of finding reference points. As a result, even modern algorithms cannot guarantee the necessary level of accuracy [19].
Nevertheless, these materials are a sufficient basis for analyzing changes in land use boundaries: arable land, forest land, settlements, changes in rivers [20,21], etc.—i.e., factors directly affecting the conservation of archaeological heritage sites. The study of historical maps allows the researcher to understand the changing spatial and contextual features of the surveyed region and the evolution of the broader landscape. Analysis of changes in agricultural land use, as well as landscape conditions, is important for understanding transformations associated with human intervention and natural phenomena [14,15].
An important research problem that may be resolved using georeferenced archival materials and modern remote sensing data is the assessment of the impact of anthropogenic factors on medieval settlements and their surrounding area [22]. The population of Volga Bulgaria, which existed for about 500 years, had a significant impact on the surrounding landscape. The main activity of the population was farming in both arable and pastoral modalities. Their highly developed arable farming and producing a lot of bread not only for themselves but also for trade with neighboring peoples and the Bulgars cultivated vast areas and mastered almost all lands of the Middle Volga region with chernozem soils and even the farmed part of the lands with less fertile soils of the forest zone. During this period, natural ecozones were destroyed, and most of the land controlled by the Volga Bulgars was prepared as arable farmland. Natural landscapes were replaced by meadows for pastoral farming and arable farmland. After the collapse of the Bulgarian state, there came a period of prolonged desolation of the territory and the restoration of vegetation cover.
Russian colonization led to even more intense use of farmland. Rapid population growth and economic development required the exploitation of increasingly larger areas. Almost all open lands are being plowed, and intensified deforestation is beginning, with the advancement of Russian colonization, forested area first on the right bank of the Volga region, and then on the left bank in the Kama region. In the 13th Century AD population density here was still low, so not only extensive forested areas, but also some areas of virgin steppes were preserved. In the 18th Century AD, there was mass migration into the Volga region, and the share of land turned into arable land significantly increased in all districts.
At the turn of the 18th–19th centuries AD in the densely populated right-bank region of the Volga, arable land and farmland took up approximately half of the total land area (in Sviyazhsk County—52.6%, in Tetyush County—49.6%) [23]. According to land statistics for 1887, arable land took up to three-quarters of the area of the Volga region (Sviyazhsk County—64%, Tetyush County—75.9%) [24].
One of the key indicators that can be used to assess the risks of destruction of archaeological sites is land use [25]. Changes in land use during the period of intensive agriculture allow researchers to estimate the causes and determine the period when the impact began, as well as making a forecast of the future state of the monument.
The purpose of this study is to prepare an estimate of the dynamics of land use among medieval settlements in Volga Bulgaria over a 200-year period.
The study of Volga Bulgarian sites is especially important to understand the Middle Ages in the Volga-Kama territory better. In the complete absence of Bulgarian written sources from the 10th to the 13th centuries AD, archaeological analyses provide unique evidence of urban life in Volga Bulgaria, the spatial distribution of military, administrative, trade centers and their relationships, fortification architecture, etc. Due to their distinctive features, fortifications since the 18th Century, which distinguish them from the surrounding landscape, have attracted the attention of scientists [26] and are of historical and cultural value.
Fortified settlements with a system of defensive structures [27] located in the Volga region of the Republic of Tatarstan (RT) (Figure 1) were chosen as the subjects of this study. This region is characterized by a very high level of agricultural development (76.4% of plowed and 40% of eroded land). There are 20 Volga Bulgarian settlements, most of which have been negatively impacted by anthropogenic and natural factors. The assessment of these processes at a number of monuments has already been covered by the authors in other studies [28,29]. For this study, we chose nine fortified settlements of the first–relief related, and the third–not related to relief types (according to P.A. Rappoport [30]) which had similar areas, except the Deushevskoe fortified site, which is much larger than the others [30]. These sites were chosen due to the relationship between the types of fortified settlement and the use of their territories. On the basis of the analysis conducted using multi-temporal remote sensing data, it was determined that the third type of fortified settlement is most affected by destructive anthropogenic effects, as these monuments are usually located on land suitable for plowing, while subordinate to the relief of the first type of fortified settlement is usually difficult to access and unsuitable for agricultural development, even with the use of modern technology.

2. Materials and Methods

The study covered the area surrounding 9 settlements of the Volga Bulgaria in the Sviyazhsk, Tetyush, and Buinsk districts of Kazan and Simbirsk provinces (Table 1). Square buffer zones with 10 km sides were prepared during work with historical maps, matching the radius of 5 km of the economic zone around the settlement, which corresponds to the optimal costs of exploitation of specific territories in the Middle Ages [31]. Maps of the 18th Century AD are interesting primarily because these data reflect the economic development of land in the pre-industrial era, and as the closest in the system to the period under study and can provide material for further analysis of the pattern of land use and road locations in the Middle Ages.
To assess land use in the late 18th–early 19th centuries AD, materials from two main state archives containing information on the territory of distribution of Bulgarian settlements in the Volga–Kama region were used: Russian State Archive of Ancient Acts (RSAAA) and the State Archive of the Republic of Tatarstan (SA RT), as well as some materials that are publicly available. Among the sites where historical maps are publicly available are the “Collection of ancient maps of the Russian Empire” [32] and Retromap [33].
The stored maps and materials in Collection № 1356 “Provincial, county and city atlases, maps and plans for the general survey of 1766–1883. (collection)”, include materials relating to the territory of the Kazan and Simbirsk provinces. These materials were analyzed in The Russian State Archive of Ancient Acts (RSAAA). The following maps of surveys from the late 18th to early 19th centuries AD were used as the main source for this analysis:
  • “General geometric plan of the city of Sviyazhsk and its county, which is part of the Kazan Province. Written in the Kazan Fringe Office in 1798”—this is the most detailed plan of the territory of Sviyazhsk County at that time. The map is handwritten and in color. This map is also similar to the atlas of Buinsk County, as it includes the shapes of settlements in Kazan County. Unlike the atlas, there is a legend with a clear description of the features. Map details in the city of Sviyazhsk include slobodas, villages, factories, ponds, large and country roads, swamps, sands, stone places, mowed areas, forest hayfields, forests, arable land, bridges, transportation. Most importantly, clear boundary lines were identified, including the urban areas, property, and county possessions, and disputed areas.
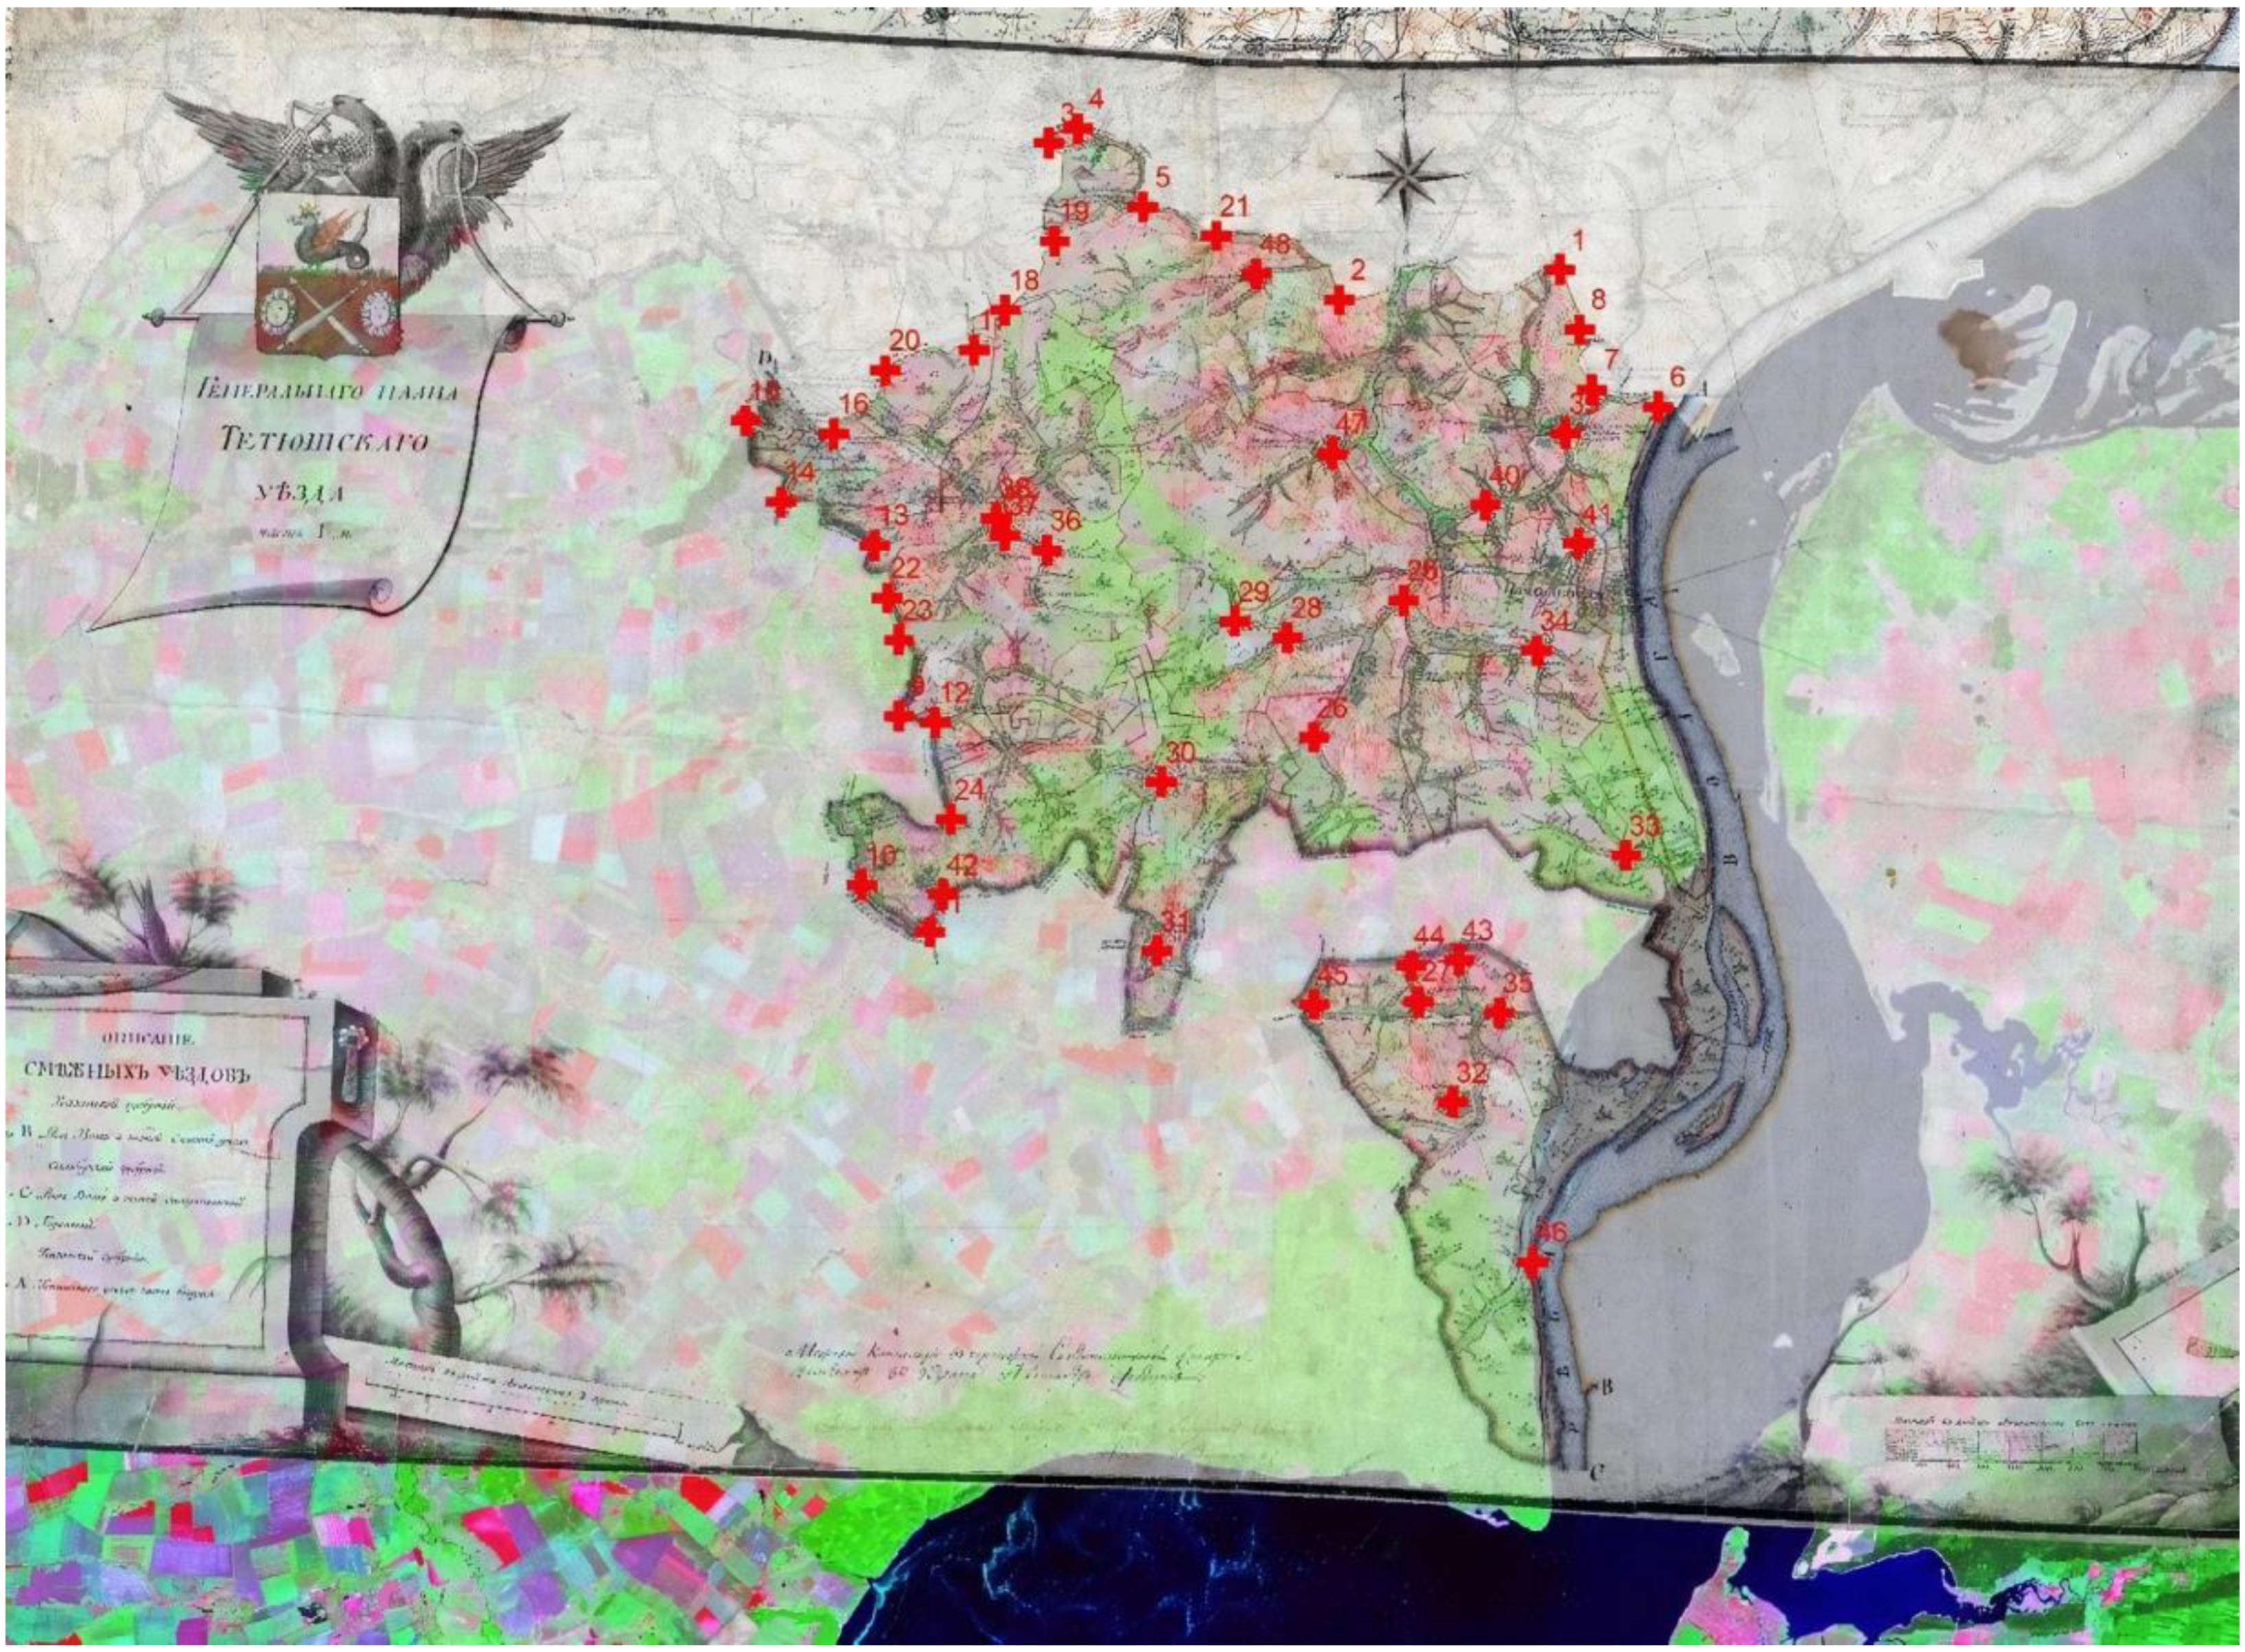
  • “General County Plan of Tetyush County”—the most detailed plan of the territory of Tetyush County from this period. The date and name of the plan are not specified. We can assume that it was prepared in the last decade of the 18th Century AD. The map is hand-drawn and in color. The map includes the city, villages, factories, flour mills, roads: large and country roads, gullies, swamps, sandy places, clay places, hayfields, hayfields with forest, forests, arable land, bridges, transportations. The map specifies boundaries between owned areas and includes a Wind Rose. The plan was signed “Senior surveyor of the 8th class Alexander Fedorov testified to the boundary office in the drawing room”.
  • “Geometric atlas of Buinsk county”—This map specifies all inner-city, treasury, and possession boundaries of each village and city and indicates the boundaries between each municipal area. Composed in 1808 AD, it is based on the plans of the general survey. The map shows not only the settlements but also their real outlines at that period. In addition, all the farmland around the villages, roads, gullies, riverbanks, forests, and meadows are clearly identified. And most importantly, the boundaries of landholdings were drawn, and their numbering was given. Parts of the atlas are handwritten. Buinsk is represented in the outlines of the early 19th Century AD and surrounding villages. These are the most detailed maps of individual regions of the province of that period, and they used for many decades.
To assess the current structure of land use in the studied areas, the main data were Landsat images from the archive of the United States Geological Survey (USGS). The satellite images and additional materials used, and the methods are described below.

2.1. Georeferencing of General Survey Plans

Universal Transverse Mercator (UTM) using the ellipsoid WGS84, zone 39 of the northern hemisphere, was chosen as a working projection.
The georeferencing of the General Survey Plans (hereinafter referred to as GSP) of Sviyazhsk (2 sheets), Tetyush (3 sheets), and Buinsk (1 sheet) counties was performed in ArcGIS. These counties cover the Volga region of the RT and part of the Chuvash Republic and Ulyanovsk region of Russia.
Landsat TM mosaics of 5 degrees latitude and 6 degrees longitude (Tri-Decadal TM Mosaics) from the open archive of the United States Geological Survey (USGS) with a spatial resolution of 30 m were used as basic reference data for geolocation. Since GSPs are made at a scale of 1–2 verst in 1 inch, which is equal to the scales of 1:420,000 and 1:840,000, respectively, the resolution of Landsat 5 images is more than enough to find the reference points. As additional data, a sheet of the topographic map 1-N-39 of 1946 at the scale of 1:300,000 georeferenced by a regular coordinate grid was used. This topographic map reflects the state of the area before the creation and filling of the Kuibyshev reservoir (in contrast to satellite images), which allowed finding additional reference points near the Volga River banks. Georeferencing was carried out in the Esri ArcMAP program using the “Georeferencing” tool.
Since GSPs were compiled at the end of the 18th to the beginning of the 19th Century AD, it is rather difficult to find closely related reference points. As such, typical branches of the river network, river junction points (in case the configuration on the GSP and the image or topographic map were visually identical), centers of small settlements (again, in case of maximum invariability of borders), river estuaries flowing into the Volga River were used. A rather large number of reference points (not less than 30) were used for each plan (Figure 2). Due to large distortions and the inaccuracy of positions and configuration of objects in boundary plans, quantitative estimation of reference points and errors was meaningless. For the same reason, 3rd order polynomial and, in some cases, splines were used as transformation methods for georeferencing. Both methods, especially splines, are used in similar works by other researchers [34]. It allows correcting irregular inaccuracies typical for drawn maps. The method transforms the image according to the nearest reference points, correcting the area between them even if the errors are not linear [35].
As the counties have adjacent borders, each georeferenced plan was used as reference data for georeferencing the next image. Adjacent borders were also used as reference points, which georeferencing error on the one hand and to improve the accuracy of georeferencing the next set of borders. This method permitted all 6 GSP images to be georeferenced for the Volga Region (Figure 3).

2.2. Land Use Structure Detection

Land use around 9 settlements between the late 18th to the early 19th Centuries AD was extracted from the GSP. For this study, the most significant land categories were manually vectorized using the EasyTrace software. These included water bodies (reservoirs and rivers), settlements, forests, natural hayfields and pastures, arable land, swamps, and sandy coastlines (Figure 4). Corresponding maps were drawn based on the vectorization results.
Cloud-free Landsat 8 images (Surface Reflectance Level-2 Data Products) for the snow-free periods between 2015 and 2018 were used to analyze modern land use. The use of multi-seasonal images is necessary to take into account the phenological features of different types of lands.
The Random Forest method was used for recognition, which is widely used for both land use and land cover interpretation, including in historical context [36].
The images selected for the studied period were assembled into a single composite. It included separate bands (2–7), calculated normalized difference vegetation indexes (NDVI) for all images, and metrics calculated based on indices, i.e., average, sum, maximum, minimum, standard deviation, median.
The reference samples were selected for six land types: 1. Water objects, 2. Croplands, 3. grasslands (natural hayfields and pastures), 4. deciduous and mixed forests, 5. coniferous forests, 6. anthropogenic objects, human settlements. Reference samples are represented by vector polygons. To provide better classification accuracy, training samples were prepared analyzing multiseasonal Landsat images [37]. Visualization examples of main land use types are presented in Table 2. Verification of the sample sets was carried out using high resolution images presented in Google Earth.
Classification and accuracy assessment was performed in the EnMAP module for QGIS using the Random Forest method with the number of trees equal to 100. Eighty percent of the reference pixels were used for classification and 20% for results validation. Using the error matrix, the Producer’s accuracy and User’s accuracy were calculated (Table 3).

3. Results and Discussion

After the results from land use classification were processed, they were vectorized to easily quantify the results, the results of which can be seen in Table 4 and Figure 5.
The table shows that arable land is most common near the settlements. Before the 18th Century, the first period, arable land covered 45–74% of the area. An exception was the area surrounding the Deushevskoe settlemfaent, which was natural grassland.
After the 19th Century, the second period, there was an increase in the area of settlements. For most of them, arable land had also increased by 13–85% of the area of the corresponding category in the first period. This increase was primarily due to the massive deforestation of the modern Republic of Tatarstan over the last 200 years to expand the area available for farming [38]. A different scenario is observed in the areas around Tavlinskoe and Lukovskoe settlement, where there was a slight (7–12%) decrease in arable land, which may be due to abandonment, typical of the former USSR territory in recent decades [39,40].
The area of arable land in the area around the Urazlinskoe settlement had also been significantly reduced. However, the greatest loss here was due to the creation of the Kuibyshev reservoir.
As already described above, economic activity is one of the key anthropogenic factors in the destruction of cultural heritage objects. This is confirmed by the current state of the investigated settlements, most of which, along with natural areas, were destroyed as a result of plowing. An example of this can be seen at the Bolsheklyarinskoye settlement, where more than 60% of the site has been destroyed, and at the Staroenaleiskoye settlement, which has been completely destroyed [41]. Thus, the change in land use (especially the increase in the area of arable land and settlements) can be seen through this research, indicating a high risk of destruction for cultural heritage sites.
The historical maps from the 17th Century AD contain unique information about the land use of that time in this vast territory. Despite their disadvantages—low detail, inaccurate drawing, inconsistency with modern projections—these cartographic products are the only source of spatial data on the structure of land use in the study time interval. Starting from the middle of the 19th Century AD, maps were produced at a smaller scale, using more accurate methods. In the archives from the end of 19th to the beginning of the 20th Century, we were able to find maps of Strelbitsky at a 10-verst per inch scale and 19th Century military topographic maps at a scale of 3 versts per inch. They do not contain detailed information about land use in the studied territory, but some topographic features, such as forest massifs and gullies, are indicated. As they did not allow the identification of the land use boundaries, they could not be used in this study.
The categories of land use were extracted for the oldest historical maps, and these were used in this study for that reason, despite their disadvantages.
Returning to the topic at the start of this section, a few key points are worth mentioning, which should be considered when georeferencing historical maps. Due to the time interval, it is obvious that there are not many objects preserved and displayed on old maps. Among the preserved objects are the estuaries of ancient river gullies (known as balkas), the intersections of major traffic routes, which became modern highways. The coordinates of religious buildings, such as churches, that have become de facto centers of urban areas, which are relatively accurate.
An important task in georeferencing historical maps is evaluating the possibility of using them to obtain quantitative data and finding the optimal source resolution for digitization. In this context, the use of Landsat images is optimal for comparison with historical maps because of the similarity of spatial resolution. This is very important because more detailed images produce large errors in alignment and georeferencing. In this study, we used satellite imagery (the most accurate source) as a georeferencing benchmark. To improve the accuracy of georeferencing historical maps, it is also necessary to sequentially georeference maps (from the most recent to the oldest) in pairs. The scale is also important, as this must also be matched as closely as possible. When these two factors are considered (scale/resolution and age of the data), the level of error can be minimized [25]. In this study, georeferencing errors ranged from several meters to the first tens of meters. Since we were dealing with land dynamics estimation, we could rely on the CORINE Land Cover 2000 (CLC2000) project [42,43], where the geometry accuracy of object boundaries is 3 pixels of Landsat TM in width, i.e., 90 m. In addition, 100 m is the minimum boundary displacement that is mapped as land use change [44,45]. Thus, the resulting georeferencing accuracy can be considered satisfactory for the goal of analyzing historic land use.
It should be noted that the purpose of this study was to assess the possibility of using historical maps as a source of information about land use. As a result of this, we did not look for a correlation between changes in the structure of land use within the economic zone and the rate of anthropogenic impact on a particular ancient settlement, since the condition of the monuments under consideration depends rather on the proximity of developed areas (agricultural lands, urban areas), as well as the relief. However, using historical maps and remote sensing data could allow us to prepare more concrete estimates of land use dynamics and their effects on archaeological features in this region.
It also should be noted that a future goal of this research project is to examine both simple and complex indicators to allow the estimation of landscape fragmentation. Confidence in estimating landscape fragmentation will allow researchers to better quantify the degradation of ancient settlements through the number of patches (NP), mean patch size (MPS), landscape form index (LFI), Shannon diversity index (SHDI), mean area fractal dimension (MAFD), etc.

4. Conclusions

As a result of the work carried out, significant changes in the land structure were identified, and general trends in land use dynamics were assessed. The research region is an area of intensive agriculture, which explains the significant increase in the percentage of arable land during the analyzed period. Even in the case of a slight reduction in arable lands on some plots, this type of land use is still dominant. This was confirmed by data on the current state of the fortified settlements in the area studied—most of them have been plowed, but it can not be confirmed that the fortified settlement was plowed in the modern period, rather than before the creation of the used GSP.
The growth of modern settlements in this area must also be noted, particularly around the Deushevskoe and Tanay–Turaevskoe settlements, which have now been covered over. The development of agriculture and the growth of urban settlements must also be considered as it has led to the development of infrastructure (primarily road network), which has also led to the destruction of archaeological sites in this region.
In conclusion, it can be said that historical maps and modern RS data are a valuable source of data enabling qualitative and quantitative analysis of land use structure near cultural heritage monuments. Their combined use, however, is complicated by their incomparability in scale, detail, and quality. One of the main disadvantages of historical materials is a significant misrepresentation of objects. All this, along with the small scale, makes it impossible to analyze the structure of land use and the state of the territory of the settlements themselves in the past.
Nevertheless, the analysis of the surrounding area of archeological monuments can give an understanding of trends in the transformation of the land use structure and key anthropogenic factors affecting them.

Author Contributions

Conceptualization, H.A. and I.G.; Methodology, M.I.; Resources, H.A.; Software, M.I.; Supervision, B.U.; Validation, M.I.; Visualization, A.G.; Writing—original draft, I.G.; Writing—review & editing, A.G., B.U., and J.W. All authors have read and agreed to the published version of the manuscript.

Funding

The work was carried out with the financial support of the Russian Foundation for Basic Research, project No. 18-09-40114 “Country of Cities”—comprehensive study of ancient settlements of Volga Bulgaria with modern methods.

Institutional Review Board Statement

Not applicable.

Informed Consent Statement

Not applicable.

Data Availability Statement

The data presented in this study are available on request from the corresponding author. The data are not publicly available due to their large size.

Conflicts of Interest

The authors declare no conflict of interest.

References

  1. Berlyant, A.M. Theoretical Concepts in Cartography. Mapp. Sci. Remote Sens. 1994, 31, 279–287. [Google Scholar] [CrossRef]
  2. Kashin, L.A. Topographical Study of Russia (Historical Essay); Kartgeocenter-Geodezizdat: Moscow, Russia, 2001. (In Russian) [Google Scholar]
  3. Kusov, V.S. Monuments of National Cartography; Moscow University: Moscow, Russia, 2003. (In Russian) [Google Scholar]
  4. Hrenov, L.S. Chronology of Russian Geodesy from Ancient Times to the Present Day: Geodesy, Astrometry, Gravimetry, Photogeodesy and Cartography; Vsesoyuznogo astronomichesko-geodezicheskogo o-va; Main Astronomical Observatory: Leningrad, Russia, 1987; 288p. (In Russian) [Google Scholar]
  5. Zhukov, A.Y.; Lyallya, E.V. GIS “Electronic Catalog of Settlements in Karelia XV-XXI Centuries”; Scientific notes of Petrozavodsk State University. Soc. Humanit. Sci. 2010, 7, 7–15. [Google Scholar]
  6. Grishin, E.S. Technologies and Methods of Space-Time Analysis Application in Special Historical GIS Projects. Hist. Inform./Istor. Inform. 2017, 2, 74–84. (In Russian) [Google Scholar] [CrossRef] [Green Version]
  7. Grishin, E.S. Reference Symbol Base for Historical Maps: General Concept, Methodological Basis and Ways of Application. Istor. Inform. 2018, 1, 38–62. (In Russian) [Google Scholar] [CrossRef] [Green Version]
  8. Grishin, E.S. Historical and Cartographic Materials Fund as a Tool to Unify Historical GIS and Digital Cartography. Istor. Inform. 2019, 1, 133–142. (In Russian) [Google Scholar] [CrossRef]
  9. Batalov, R.N.; Radchenko, L.K. Review of the Main Directions of GIS-Technologies in Historical and Cartographic Research. Vestnik SGUGiT 2020, 25, 119–135. (In Russian) [Google Scholar] [CrossRef]
  10. Svedjemo, G. Swedish Large-Scale Historical Maps as Sources for Archaeological Research: Examples from Gotlandic Maps from 1693–1705. In Proceedings of the VII International Conference on Easter Island and the Pacific: Migration, Identity, and Cultural Heritage, Visby, Sweden, 20–25 August 2007; Gotland University: Gotland, Sweden; pp. 475–490. [Google Scholar]
  11. Šulte, A.; Gunnarsson, D.S. 17th Century Large-Scale Historical Maps of Vidzeme as Sources for Archaeological Research. J. Inst. Latv. Hist./Latv. Vēstures Institūta Žurnāls 2017, 1, 111–126. [Google Scholar]
  12. Bunyaeva, A.G.; Buryak, Z.A.; Liseckij, F.N. Reconstruction of Forest Areas on the Tarkhankutsky Peninsula in the Conditions of the Forest-Steppe Zone in the Ancient Times. Belgorod State Univ. Sci. Bull. Nat. Sci. Ser. 2017, 40, 164–175. (In Russian) [Google Scholar]
  13. Matasov, V.; Prishchepov, A.V.; Jepsen, M.R.; Müller, D. Spatial Determinants and Underlying Drivers of Land-Use Transitions in European Russia from 1770 to 2010. J. Land Use Sci. 2019, 14, 362–377. [Google Scholar] [CrossRef]
  14. Lieskovský, J.; Kaim, D.; Balázs, P.; Boltižiar, M.; Chmiel, M.; Grabska, E.; Király, G.; Konkoly-Gyuró, É.; Kozak, J.; Antalová, K.; et al. Historical Land Use Dataset of the Carpathian Region (1819–1980). J. Maps 2018, 14, 644–651. [Google Scholar] [CrossRef] [Green Version]
  15. Statuto, D.; Cillis, G.; Picuno, P. Using Historical Maps within a GIS to Analyze Two Centuries of Rural Landscape Changes in Southern Italy. Land 2017, 6, 65. [Google Scholar] [CrossRef] [Green Version]
  16. Valent, P.; Rončák, P.; Maliariková, M.; Behan, Š. Utilization of Historical Maps in the Land Use Change Impact Studies: A Case Study from Myjava River Basin. Slovak J. Civil Eng. 2016, 24, 15–26. [Google Scholar] [CrossRef] [Green Version]
  17. Flejs, M.E.; Borisov, M.M.; Aleksandrovich, M.V. Cartographic Projections and Coordination of Multi-Temporal Maps of Russia and the Soviet Union in Geoinformation Environment. Izv. Ross. Akad. Nauk Seriya Geogr. 2008, 5, 118–125. (In Russian) [Google Scholar]
  18. Brovelli, M.A.; Minghini, M. Georeferencing Old Maps: A Polynomial-Based Approach for Como Historical Cadastres. e-Perimetron 2012, 7, 97–110. [Google Scholar]
  19. Timár, G.; Biszak, S. Digitizing and Georeferencing of the Historical Cadastral Maps (1856–1860) of Hungary. In Proceedings of the 5th International Workshop on Digital Approaches in Cartographic Heritage, Vienna, Austria, 22–23 February 2010; Volume 22, pp. 22–24. [Google Scholar]
  20. Gainullin, I.; Usmanov, B.M.; Gafurov, A. Study of Fluvial Processes Impact on Archaeological Sites of the Volga Bulgaria Period Using Remote Sensing Data. In Proceedings of the Eighth International Conference on Remote Sensing and Geoinformation of the Environment (RSCy2020), Paphos, Cyprus, 16–18 March 2020; Themistocleous, K., Michaelides, S., Ambrosia, V., Hadjimitsis, D.G., Papadavid, G., Eds.; SPIE: Paphos, Cyprus, 2020; p. 48. [Google Scholar]
  21. Nicu, I.; Usmanov, B.; Gainullin, I.; Galimova, M. Shoreline Dynamics and Evaluation of Cultural Heritage Sites on the Shores of Large Reservoirs: Kuibyshev Reservoir, Russian Federation. Water 2019, 11, 591. [Google Scholar] [CrossRef] [Green Version]
  22. Gainullin, I.I.; Khomyakov, P.V.; Sitdikov, A.G.; Usmanov, B.M. Qualitative Assessment of the Medieval Fortifications Condition with the Use of Remote Sensing Data (Republic of Tatarstan). In Fifth International Conference on Remote Sensing and Geoinformation of the Environment (RSCy2017), Paphos, Greece, 20–23 March 2017; SPIE: Paphos, Cyprus, 2017; Volume 10444. [Google Scholar] [CrossRef]
  23. Yermolaev, O.P.; Ivanov, M.A. Environmental Assessment of Basin Geosystems Based on the Landscape Approach. Biosci. Biotechnol. Res. Asia 2014, 11, 257–263. [Google Scholar] [CrossRef]
  24. Yermolaev, O.; Usmanov, B.; Muharamova, S.S. The Basin Approach and Mapping to the Anthropogenic Impact Assessment on the East of the Russian Plain. Int. J. Appl. Eng. Res. 2015, 10, 41178–41184. [Google Scholar]
  25. Petit, C.C.; Lambin, E.F. Impact of Data Integration Technique on Historical Land-Use/Land-Cover Change: Comparing Historical Maps with Remote Sensing Data in the Belgian Ardennes. Landsc. Ecol. 2002, 17, 117–132. [Google Scholar] [CrossRef]
  26. Gubajdullin, A.M. Fortification in the Middle Volga Region in the X—First Half of the XVI Centuries (based on Archaeological Research) Kazan. Ph.D. Thesis, Kazan, Russia, 2017. (In Russian). [Google Scholar]
  27. Makarov, N.A.; Zelentsova, O.V.; Korobov, D.S.; Voroshilov, A.N. The Space of Antiquity: Archaeological Sites on the Map of Russia. Her. Russ. Acad. Sci. 2017, 87, 336–347. [Google Scholar] [CrossRef]
  28. Gainullin, I.; Sitdikov, A.; Usmanov, B.; Khomyakov, P. Qualitative Assessment of the Condition of Tatarstan Medieval Fortified Settlements Under the Data of Remote Sensing. Povolzhskaya Arkheologiya 2017, 2, 303–320. [Google Scholar] [CrossRef] [Green Version]
  29. Gafurov, A.; Gainullin, I.; Usmanov, B.; Khomyakov, P.; Kasimov, A. Impacts of Fluvial Processes on Medieval Settlement Lukovskoe (Tatarstan, Russia). Proc. IAHS 2019, 381, 31–35. [Google Scholar] [CrossRef] [Green Version]
  30. Rappoport, P.A. Essays on the History of Military Architecture of North-Eastern and North-Western Russia in X-XV Centuries; USSR Academy of Sciences Publishing House: Moscow, Russia, 1961. (In Russian) [Google Scholar]
  31. Afanas’ev, G.E.; Savenko, S.N.; Korobov, D.S. Ancients of the Kislovodsk Depression; Scientific World: Moscow, Russia, 2004. (In Russian) [Google Scholar]
  32. Collection of Ancient Maps of the Russian Empire. Available online: http://raremaps.ru/ (accessed on 30 November 2020).
  33. Old Maps of Cities in Russia and Abroad. Available online: http://retromap.ru (accessed on 30 November 2020).
  34. Horodnic, V.-D.; Graur, D.-S.; Afloari, M.; Efros, V. Geospatial Analysis of Land Use Dynamics Using Historical Maps and Gis Techniques. Case Study of Rădăuți, Romania. In Proceedings of the 4th International Scientific Conference Geobalcanica, Ohrid, Macedonia, 15–16 May 2018; pp. 577–597. [Google Scholar]
  35. Cajthaml, J. Methods of Georeferencing Old Maps on the Example of Czech Early Maps. In Proceedings of the 25th International Cartographic Conference, Paris, France, 3–8 July 2011; Available online: https://www.researchgate.net/publication/259495942 (accessed on 23 January 2021).
  36. Liu, D.; Toman, E.; Fuller, Z.; Chen, G.; Londo, A.; Zhang, X.; Zhao, K. Integration of Historical Map and Aerial Imagery to Characterize Long-Term Land-Use Change and Landscape Dynamics: An Object-Based Analysis via Random Forests. Ecol. Indic. 2018, 95, 595–605. [Google Scholar] [CrossRef]
  37. Ivanov, M.A.; Prishchepov, A.V.; Golosov, V.N.; Zalyaliev, R.R.; Efimov, K.V.; Kondrat’eva, A.A.; Kinyashova, A.D.; Ionova, Y.K. Changes of Cropland Area in the River Basins of the European Part of Russia for the Period 1985–2015 as a Factor of Soil Erosion Dynamics. Sovr. Probl. DZZ Kosm. 2017, 14, 149–157. [Google Scholar] [CrossRef]
  38. Yermolaev, O.P.; Igonin, M.E.; Bubnov, A.Y.; Pavlova, S.V. Landscapes of the Republic of Tatarstan. Regional Landscape and Environmental Analysis; Slovo: Moscow, Russia, 2007. (In Russian) [Google Scholar]
  39. Lyuri, D. Dynamics of Agricultural Land in Russia and in the World in the XX Century. Potential of idle agricultural lands of the post-soviet area to mitigate the climate changes and improve an environment. Book of extended abstracts. In Proceedings of the Interdisciplinary Workshop, Moscow, Russia, 3–5 March 2015. [Google Scholar]
  40. Prishchepov, A.V.; Radeloff, V.C.; Baumann, M.; Kuemmerle, T.; Müller, D. Effects of Institutional Changes on Land Use: Agricultural Land Abandonment during the Transition from State-Command to Market-Driven Economies in Post-Soviet Eastern Europe. Environ. Res. Lett. 2012, 7, 024021. [Google Scholar] [CrossRef]
  41. Gainullin, I.I.; Khomyakov, P.V.; Sitdikov, A.G.; Usmanov, B.M. Study of Anthropogenic and Natural Impacts on Archaeological Sites of the Volga Bulgaria Period (Republic of Tatarstan) Using Remote Sensing Data. In Proceedings of the Fourth International Conference on Remote Sensing and Geoinformation of the Environment (RSCy2016), Paphos, Cyprus, 4–8 April 2016. 96880Z. [Google Scholar] [CrossRef]
  42. Bossard, M.; Feranec, J.; Otahel, J. CORINE Land Cover Technical Guide: Addendum 2000; European Environment Agency: Copenhagen, Denmark, 2000. [Google Scholar]
  43. Büttner, G.; Feranec, J.; Jaffrain, G.; Mari, L.; Maucha, G.; Soukup, T. The CORINE Land Cover 2000 Project. EARSeL eProceedings 2004, 3, 331–346. [Google Scholar]
  44. European Economic Area. CORINE Land Cover Update CLC 2000 Project. Technical Guidelines; Final Version; EEA: Copenhagen, Denmark, 2002. [Google Scholar]
  45. Feranec, J.; Hazeu, G.; Christensen, S.; Jaffrain, G. Corine Land Cover Change Detection in Europe (Case Studies of the Netherlands and Slovakia). Land Use Policy 2007, 24, 234–247. [Google Scholar] [CrossRef]
Figure 1. Study area.
Earth 02 00004 g001
Figure 2. General surveying plans georeferencing based on Landsat 5 image and 1946 topographic map.
Earth 02 00004 g002
Figure 3. Georeferenced general surveying plans of Sviyazhsk, Tetyush, and Buinsk counties combined with Landsat 5 images.
Earth 02 00004 g003
Figure 4. Results of the land use structure digitalization near the fortified settlements according to the general surveying plans.
Earth 02 00004 g004
Figure 5. Comparison of land use coverage (%) near the fortified settlements according to the general surveying plans (GSP) and the results of Landsat 8 classification: (a) Tavlinskoe settlement, (b) Lukovskoe settlement, (c) Churu-Baryshevskoe settlement, (d) Staroenaleiskoe settlement, (e) Tanay–Turaevskoe settlement, (f) Deushevskoe settlement, (g) Bolsheklyarinskoe settlement, (h) Urazlinskoe settlement, (i) Chuvashsko–Bezdninskoe settlement. Legend: G—Grassland, C—Cropland, F—Forests, Sw—Swamps, W—Water objects, S—Settlements, SC—Sandy coastline.
Earth 02 00004 g005
Table 1. The list of settlement areas for land use structure analysis.
County NameModern Municipal DistrictSettlement/Type 1Area from Aerial Photographs of the 1950s, ha Preservation/Main Impact 2
SviyazhskZelenodolskyTavlinskoe/10.77<50%/1
Lukovskoe/112<50%/2
TetyushApastovskyChuru-Baryshevskoe/112.285%/1
Staroenaleiskoe/312.40%/3
Tanay-Turaevskoe/312.50%/4
Deushevskoe/398.50%/3 and 4
Kamsko-UstiinskyBolsheklyarinskoe/316.335%/3
Urazlinskoe/33.190%/3
BuinskDrozhzhanovskyChuvashsko-Bezdninskoe/32.695%/2
Note: 1 Type of settlement: 1—relief related, 3—not related to relief; 2 Impact: 1—exogenous processes, 2—fluvial processes, 3—plowing, 4—development.
Table 2. Example of main land use types viewed in different seasons Landsat images (band combination 6-5-4).
Land Use Type26 May 201827 June 201830 August 20181 October 201827 April 201929 May 20194 October 2019
Water objects Earth 02 00004 i001 Earth 02 00004 i002 Earth 02 00004 i003 Earth 02 00004 i004 Earth 02 00004 i005 Earth 02 00004 i006 Earth 02 00004 i007
Cropland Earth 02 00004 i008 Earth 02 00004 i009 Earth 02 00004 i010 Earth 02 00004 i011 Earth 02 00004 i012 Earth 02 00004 i013 Earth 02 00004 i014
Grassland Earth 02 00004 i015 Earth 02 00004 i016 Earth 02 00004 i017 Earth 02 00004 i018 Earth 02 00004 i019 Earth 02 00004 i020 Earth 02 00004 i021
Deciduous and mixed forest Earth 02 00004 i022 Earth 02 00004 i023 Earth 02 00004 i024 Earth 02 00004 i025 Earth 02 00004 i026 Earth 02 00004 i027 Earth 02 00004 i028
Conifer forest Earth 02 00004 i029 Earth 02 00004 i030 Earth 02 00004 i031 Earth 02 00004 i032 Earth 02 00004 i033 Earth 02 00004 i034 Earth 02 00004 i035
Settlement Earth 02 00004 i036 Earth 02 00004 i037 Earth 02 00004 i038 Earth 02 00004 i039 Earth 02 00004 i040 Earth 02 00004 i041 Earth 02 00004 i042
Table 3. Classification accuracy assessment results.
Land UseUser’s Accuracy, %Producer’s Accuracy, %
Water objects99.9499.23
Croplands95.2197.23
Grasslands74.0564.27
Deciduous and mixed forests99.398.72
Coniferous forests97.8199.49
Anthropogenic objects87.1687.16
Table 4. Land use structure near the fortified settlements according to the general survey plans and remote sensing data.
Land UseGSPLandsat 8Changes, haChanges, % of Total AreaChanges, % from 18th to 19th Centuries AD Category
Area, haShare, %Area, haShare, %
Tavlinskoe settlement
Grassland2609.026.12266.022.7−343.0−3.4−13.1
Cropland6835.568.46353.563.5−482.0−4.8−7.1
Forests358.63.6468.04.7109.41.130.5
Swamps1.90.020.000.0−1.90.0−100.0
Water object34.70.314.90.1−19.8−0.2−57.0
Settlements160.31.6897.69.0737.37.4460.0
Lukovskoe settlement
Grassland2053.120.52732.427.3679.36.833.1
Cropland6368.863.75640.056.4−728.8−7.3−11.4
Forests554.25.5745.47.5191.21.934.5
Swamps631.56.345.70.5−585.8−5.9−92.8
Water object327.63.3300.23.0−27.4−0.3−8.4
Settlements64.90.6536.35.4471.44.7726.3
Churu-Baryshevskoe settlement
Grassland2036.020.42148.621.5112.61.15.5
Cropland5248.252.56878.668.81630.416.331.1
Forests2125.921.3642.26.4−1483.7−14.8−69.8
Swamps433.64.315.20.2−418.4−4.2−96.5
Water object127.41.358.00.6−69.4−0.7−54.5
Settlements28.90.3257.42.6228.52.3791.0
Staroenaleiskoe settlement
Grassland2102.821.02049.620.5−53.2−0.5−2.5
Cropland4503.145.06378.463.81875.418.841.6
Forests2645.726.5679.26.8−1966.5−19.7−74.3
Swamps493.24.95.50.1−487.7−4.9−98.9
Water object132.51.368.20.7−64.3−0.6−48.5
Settlements122.81.2819.18.2696.37.0567.2
Tanay-Turaevskoe settlement
Grassland2038.920.42172.221.7133.41.36.5
Cropland5588.755.97034.970.31446.214.525.9
Forests1706.017.1382.33.8−1323.7−13.2−77.6
Swamps391.33.95.50.1−385.8−3.9−98.6
Water object142.41.440.50.4−101.9−1.0−71.6
Settlements132.71.3364.63.6231.92.3174.7
Deushevskoe settlement
Grassland5348.153.52416.124.2−2932.0−29.3−54.8
Cropland2989.529.95524.255.22534.725.384.8
Forests1177.511.81319.613.2142.11.412.1
Swamps133.11.30.00.0−133.1−1.3−100.0
Water object270.72.7120.41.2−150.3−1.5−55.5
Settlements81.00.8619.76.2538.75.4665.1
Bolsheklyarinskoe settlement
Grassland2836.528.41458.814.6−1377.7−13.8−48.6
Cropland5986.259.96798.268.0812.08.113.6
Forests742.37.41146.411.5404.14.054.4
Swamps334.43.30.00.0−334.4−3.3−100.0
Water object9.20.128.30.319.10.2209.0
Settlements91.50.9568.35.7476.84.8521.3
Urazlinskoe settlement
Grassland1483.5815.22441.424.4957.89.664.6
Cropland5216.9153.43464.634.6−1752.3−17.5−33.6
Forests1675.1817.1808.58.1−866.7−8.7−51.7
Swamps93.191.00.00.0−93.2−0.9−100.0
Water object706.697.22410.424.11703.717.0241.1
Settlements110.81.1875.18.8764.37.6689.8
Sandy coastline483.144.90.00.0−483.1−4.8−100.0
Chuvashsko-Bezdninskoe settlement
Grassland4157.841.62053.020.5−2104.8−21.0−50.6
Cropland4834.848.35978.359.81143.511.423.7
Forests679.86.81568.815.7889.08.9130.8
Swamps268.52.70.00.0−268.5−2.7−100.0
Water object4.70.050.80.01−3.90.0−83.0
Settlements54.40.5399.14.0344.73.4633.6
Publisher’s Note: MDPI stays neutral with regard to jurisdictional claims in published maps and institutional affiliations.

