
Localize the Impact of Global Greenhouse Gases Emissions under an Uncertain Future: A Case Study in Western Cape, South Africa


1
Department of Civil and Environmental Engineering, Vanderbilt University, Nashville, TN 37235, USA
2
Department of Geological and Atmospherical Sciences, Iowa State University, Ames, IA 50011, USA
*
Author to whom correspondence should be addressed.
Earth 2021, 2(1), 111-123; https://0-doi-org.brum.beds.ac.uk/10.3390/earth2010007
Submission received: 22 January 2021
/
Revised: 19 February 2021
/
Accepted: 23 February 2021
/
Published: 26 February 2021
Abstract
:The growing impact of CO2 and other greenhouse-gas (GHG) emissions on the socio-climate system in the Western Cape, South Africa, urgently calls for the need for better climate adaptation and emissions-reduction strategies. While the consensus has been that there is a strong correlation between CO2 emissions and the global climate system, few studies on climate change in the Western Cape have quantified the impact of climate change on local climate metrics such as precipitation and evaporation under different future climate scenarios. The present study investigates three different CO2 emissions scenarios: Representative Concentration Pathway (RCP) 2.6, RCP 4.5, and RCP 8.5, from moderate to severe, respectively. Specifically, we used climate metrics including precipitation, daily mean and maximum near-surface air temperature, and evaporation to evaluate the future climate in Western Cape under each different RCP climate scenario. The projected simulation results reveal that temperature-related metrics are more sensitive to CO2 emissions than water-related metrics. Districts closer to the south coast are more resilient to severer GHG emissions scenarios compared to inland areas regarding temperature and rainfall; however, coastal regions are more likely to suffer from severe droughts such as the “Day-Zero” water crisis. As a result, a robust drying signal across the Western Cape region is likely to be seen in the second half of the 21st century, especially under the scenario of RCP 8.5 (business as usual) without efficient emissions reduction policies.
1. Introduction
The effects of climate change and global warming have exacerbated the need for better water management strategies and emissions reduction policies. The severity of the future impact of climate change is largely dependent on people’s present understanding and ability to adapt, with government and policymakers playing a critical leading role [1]. A thorough and integrated understanding of both climate history and future projection, and both the inherent mechanisms and their implications to the society, is important for building a strong resilience to future climate change for a region. Adaptation is particularly critical to secure social-economic well-being [2,3]. For instance, farmers are changing their selection of crops and the timing of their field operations to adapt their farming strategy to future impacts of climate change to maintain agricultural productivity and rural livelihoods, although the relationship between farmers’ perception and their adaptation to future climate change is far away from being fully understood [4].
South Africa has always been one of the most vulnerable regions to climate change on earth, with a mean annual temperature increase by at least 1.5 times the observed global average of 0.65 °C during the past five decades [5,6]. In addition to temperature increase, precipitation is projected to decrease with higher spatial variability, along with drier rainy seasons and higher risks of severe droughts and extreme weather events across the southwestern regions of Africa from now on [7]. For Western Cape Province, the lack of rainfall, decreasing storage levels in major reservoirs, increasing water demand driven by population growth and urban expansion, combined with problematic and ineffective water management practices led to the “Day-Zero” water crisis which caused serious troubles to local citizens, businesses, and agriculture [8,9,10].
Most research that focused on the meteorological aspects of the drought used only precipitation to approximate drought intensity, overlooking the role of other climate metrics such as near-surface air temperature, evaporation, and their internal relations. For example, Pascale et al. [11] used a higher resolution climate model to further highlight the role of anthropogenic climate change and provided a clear and well-supported mechanism to explain the cause of the increase in drought risk in the South Africa region. They illustrated that a reduction in precipitation during the shoulder seasons is likely to be the cause of drought risk in southwestern Africa in the 21st century. While their study greatly increases the confidence in the projections of a drying South Africa region, they only analyzed the drought risk from a rainfall deficit perspective, ignoring the combined effect of precipitation, temperature, and evaporation. Naik and Abiodun [10] conducted a study to investigate the projected drought characteristics over the Western Cape, South Africa, using CORDEX simulation data, and stressed the importance of the role of potential evapotranspiration (PET) on future drought characteristics. However, they only considered the RCP 8.5 scenario, and more analysis needs to be done under other climate scenarios to better quantify the uncertainties of future climate change. Pendergrass et al. [12] investigated the relationship between extreme precipitation and different emissions scenarios and concluded that the increased rate of global-mean precipitation per degree of global-mean temperature increase differs for greenhouse gas and aerosol forcing scenarios. However, their global-level research provides very limited insights that could be used in local regions.
In this context, the overarching goal of the present study is to quantify the effect of climate change on the climate and hydrological system over six main districts in Western Cape Province under 3 climate scenarios: RCP 2.6, RCP 4.5, RCP 8.5.
Representative concentration pathway (RCP) 2.6, is a “very stringent” and optimistic pathway that requires that CO2 emissions start to decline by 2020 and go to zero by 2100. It also requires CH4 concentration to approximately cut to half of the CH4 levels in 2020 and the SO2 emissions to decline to about 10% of the 1980–1990 level. This emission scenario is representative of the literature on mitigation scenarios aiming to limit the increase of global mean temperature to not beyond 2 °C and is shown to be technically feasible in the IMAGE integrated assessment modeling framework from a medium emission baseline scenario, assuming full participation of all countries [13].
RCP 4.5 is a scenario of long-term, global emissions of greenhouse gases, short-lived species, and land-use-land-cover that stabilizes radiative forcing at 4.5 W/m2 up to the year 2100 without ever exceeding that value [14]. RCP 4.5 is a stabilization scenario and assumes that climate policies are invoked to achieve the goal of limiting emissions and radiative forcing. The application of RCP 4.5 in climate models provides a platform to explore the long-term climate system response to stabilizing the anthropogenic components of radiative forcing [14].
RCP 8.5 is the highest greenhouse-gas emissions pathway among the three climate scenarios chosen in the study. This scenario does not include any specific climate mitigation strategy, increasing greenhouse-gas emissions as well as concentrations considerably over time, leading to a radiative forcing of 8.5 W/m2 by the end of this century [15]. Hence, it represents the upper bound of the RCPs’ set system, which can also be called the business-as-usual scenario [15].
By conducting this research, we aim to answer the following research questions: (1) How do different CO2 emissions scenarios impact the climate and hydrological system in the Western Cape region? (2) How are different districts within Western Cape responding to different CO2 emissions? The paper is structured as follows: Section 2 describes the data and methods used in the study, Section 3 presents the results and discussion, and Section 4 delivers the conclusions and implications of the study.
2. Methods
2.1. Study Region
We chose Western Cape Province in South Africa as our study region, which is located in the southernmost section of Southern Africa (Figure 1). It is surrounded by Northern Cape Province and Eastern Cape Province, as well as the Atlantic Ocean in the west and the Indian Ocean in the south. It ranges from 15.0° E to 25.0° E longitudinally, and 30.0° S to 35.0° S latitudinally. The Western Cape accounts for 12% of South Africa’s total agricultural area, provides 20% of the nation’s total agricultural production outputs, and nurtures a world-famous wine appellation [16,17]. The climate conditions across the region are temperate Mediterranean with warm dry summers and mild moist winters, rendering it favorable for cereal farming such as wheat, oats, and barley, and viticulture [10,18,19]. Average summer temperatures range from 5 °C to 27 °C, while winter temperatures range from 5 °C to 22 °C [20]. The Western Cape is one of South Africa’s driest regions with approximately 350 mm annual precipitation, well below the national annual average of 500 mm precipitation [21]. Precipitation is also highly heterogeneous and varies greatly, from semi-arid areas to relatively wet areas on the windward slope of mountains [22].
The Western Cape is the fourth largest of the nine provinces with an area of 129,449 square km, and the third most populous province with an estimated 7 million inhabitants in 2020 [23].
2.2. Data
In this study, we obtained the Coordinated Regional Downscaling Experiment Simulations (CORDEX) “Phase 1” simulation data from the Earth System Grid Federation (ESGF). The CORDEX models have been proved to be able to correctly capture the spatial distribution of major climate variables over the Western Cape region and reproduce the essential climatic features in the observed temperature and moisture fields [10]. Thus, they are reliable models to predict the future climatic system over the Western Cape region. “Phase 1” data are made available at the monthly temporal resolution, 0.44-degree spatial resolution, by far the largest GCM-RCK downscaled data available. We downloaded the data under AFR-44, which indicates the Africa continent with 0.44-degree downscaling. We selected several variables including pr (precipitation), tas (average near-surface air temperature), tasmax (daily average maximum near-surface air temperature), and evspsbl (evaporation) as key metrics to describe the regional climate and hydrological system in Western Cape. RCP 2.6, RCP 4.5, and RCP 8.5 were selected as experiment configurations and monthly data were downloaded. We selected MPI-M-MPI-ESM-LR as the driving model for the reason that it is the only driving model available for all 3 RCP scenarios. Moreover, its overall performance is better than its predecessor ECHAM5/MPIOM model based on a modified Reichler–Kim standardized error due to improvements of the extratropical circulation [24]. RCA4 was selected as the regional climate model (RCM) because a recent study found that it can adjust the boundary conditions, resulting in a significant reduction of biases in the dynamically downscaled outputs [25]. Furthermore, many previous studies verified the credibility and advantage regarding the MPI-ESM-LR-RCA4 (GCM-RCM) chain on the projection of climate change signal over different CORDEX regions [26,27]. Full information regarding 3 downscaled GCMs data in this study is summarized in Table 1.
Monthly spatial climatic data of the Africa continent for 3 RCP scenarios were imported and analyzed in the open-source program RStudio [28]. The aim of using RStudio at this step was to quickly retrieve the variable data and generate raster data for further analysis. Specifically, we used the “ncdf4” package in RStudio to retrieve the climate characteristics data such as precipitation, evaporation, and so forth for each RCP scenario for the whole Africa continent. We used the “ncks” command from NetCDF Operators (NCO) to downscale the data from the Africa continent to Western Cape, South Africa, to focus on our study area. The downscaled data were then saved as raster data and imported into ArcMap 10.8.1 software to be further analyzed. To reveal the spatial–temporal patterns, we averaged the aforementioned climate metrics over every 20 years for each 0.44 by 0.44-degree grid inside the study area. The averaged data then were mapped for 4 two-decade spans from 2021 to 2100 for each of the 3 climate scenarios.
In addition, we also examined how the water availability will change across the Western Cape region under 3 different emission scenarios using a simple water balance approach in Equation (1):
where is precipitation [mm/month], is discharge [mm/month], is evapotranspiration [mm/month], and is storage changes per time step [mm/month] [29]. We used evaporation from the RCM model outputs as a proxy for ET since our purpose was to examine the general trend of water availability. In this case, we used the sum of water discharge and storage changes rate as a critical indicator of a region’s water availability, which can be calculated as the difference between precipitation and evaporation [30,31,32].
3. Results and Discussions
3.1. Spatial–Temporal Patterns of Climate Metrics
In this section, each climate metric under three different GHG emissions is spatially evaluated using outputs from three downscaled GCMs (Table 1). The results are well aligned with a previous study by Naik and Abiodun (2020) that projected changes in drought characteristics over the Western Cape that show a robust drying signal under the RCP 8.5 emission scenario. In addition, by investigating more emission scenarios such as the RCP 2.6 and the RCP 4.5 scenarios, this study highlights the importance of emission reduction to alleviate the region’s future climate stress.
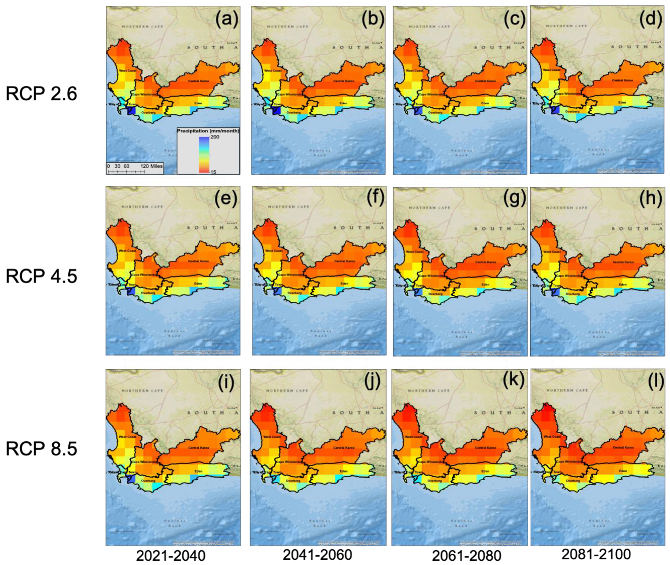
The precipitation ranges from 15 mm/month to 200 mm/month for the whole area, with the junction of City of Cape Town, Cape Winelands, and Overberg receiving the most precipitation and Central Karoo district receiving the least (Figure 2). A clear pattern is seen that coastal regions generally receive more precipitation than inland regions in the same period (Figure 2). There is no significant variability for precipitation distribution under the scenario of the RCP 2.6 and the RCP 4.5 since no noticeable difference was found in the period of 2081–2100 compared to that of 2021–2041. However, the region is dryer under the scenario of the RCP 8.5 with much less precipitation received for the junction of Cape Town, Cape Winelands, and Overberg that is relatively wet under the RCP 2.6 and the RCP 4.5 scenario, and the Central Karoo district will likely face droughts in higher magnitudes and longer duration compared to the beginning of 21st century.
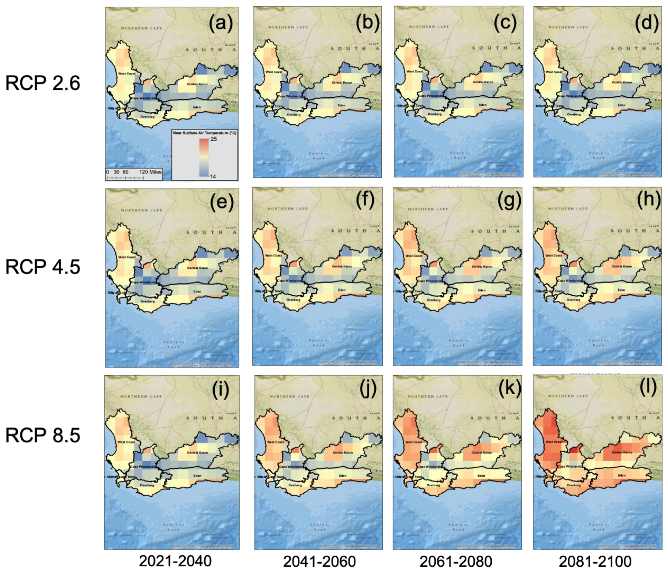
The mean near-surface air temperature revealed a more apparent pattern under three different CO2 emissions scenarios (Figure 3). The regional warming signal is not as significant under the RCP 2.6 scenario; however, the signal amplified gradually across the whole region under the RCP 4.5 and RCP 8.5 scenarios and with time. Inland districts such as West Coast and Central Karoo face larger surface air temperature increases than districts closer to the southern coast such as Overberg and Eden.
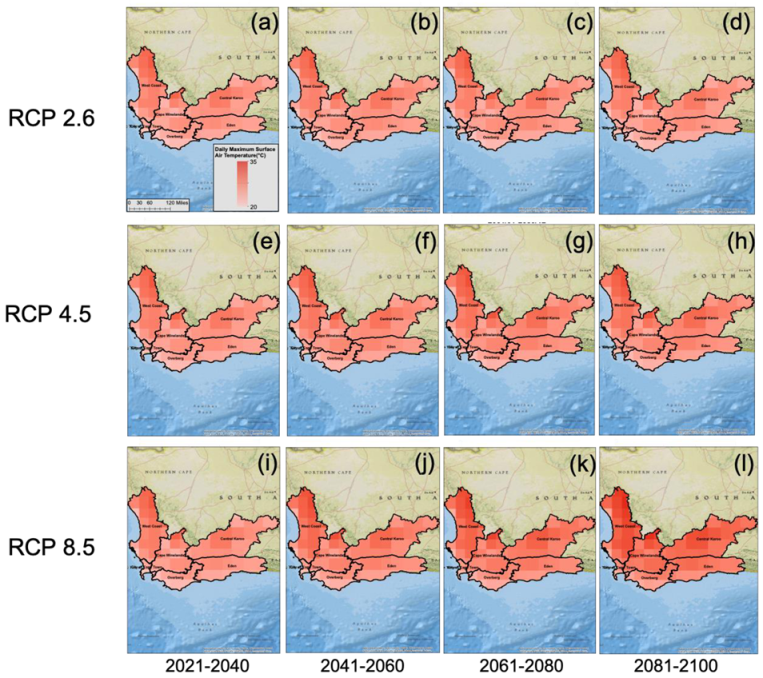
Daily maximum surface air temperature is used typically as a signal for extreme events such as heatwaves for a region. The daily maximum surface air temperature ranges from 20 °C to 35 °C during the simulation period (Figure 4). West Coast and Central Karoo are more vulnerable to potential heatwave risks, especially under the RCP 8.5 scenario by the end of the 21st century (Figure 4). A similar trend is found as more variability of maximum temperature occurred with intensifying GHG emissions. Inland districts such as the West Coast, Central Karoo, and some areas of Cape Winelands are more likely to encounter extreme weather under the RCP 8.5 scenario.
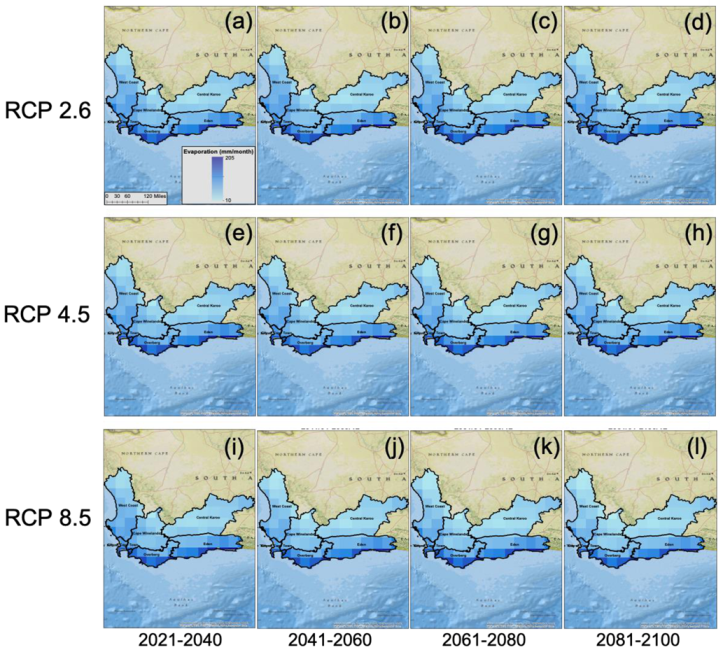
Evaporation is a critical element that affects the region’s water budget. Evaporation for the Western Cape area ranges from 10 to 205 mm/month in the future (Figure 5). There is no significant variability for evaporation across different CO2 emissions scenarios. However, there are decreasing trends in evaporation in inland districts such as the West Coast and Central Karoo compared to coastal regions (Figure 5). Thus, coastal regions are more resilient to more intense GHG emission scenarios in terms of evaporation since they are easier to adapt to and recover from evaporation-induced extreme climate events caused by GHG emissions increases.
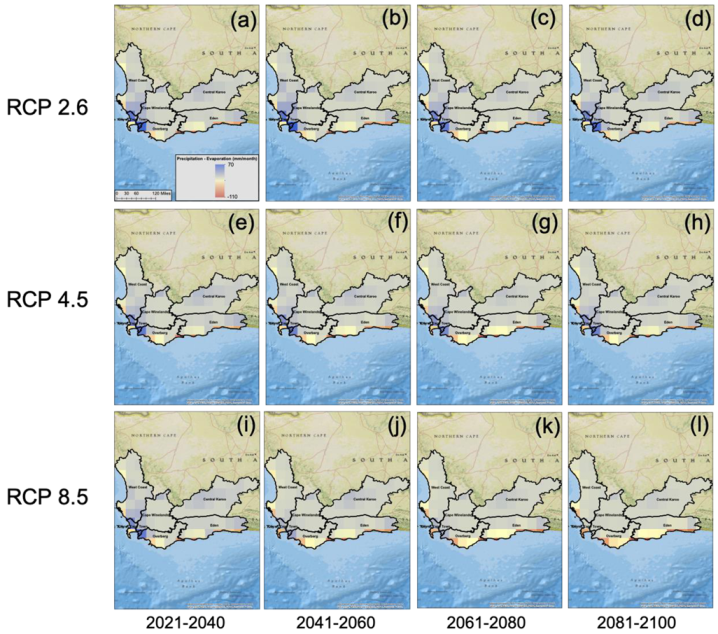
The trend of water availability is going to deeply impact the economic activities, tourism, agricultural practices, and people’s wellbeing in general for a region. Here we consider the difference of precipitation and evaporation as net available water for each pixel in the region, and a drought signal over a two-decade period time is identified when the net available water is less than zero. For the RCP 2.6 and 4.5 scenarios, drought signals only occur at limited locations such as coastal regions within the Overberg and Eden districts (Figure 6). There is no significant temporal variability under this scenario. However, for the RCP 8.5 scenario, a robust drying signal is expected across Western Cape from 2060 onward, with severe drought expectation near the coastal areas within the City of Cape Town, Overberg, and Eden districts (Figure 6). One probable explanation is that although rainfall is relatively abundant in coastal regions, it is countered by a higher evaporation rate that results from temperature increase.
3.2. Regional Trends of Various Climate Metrics
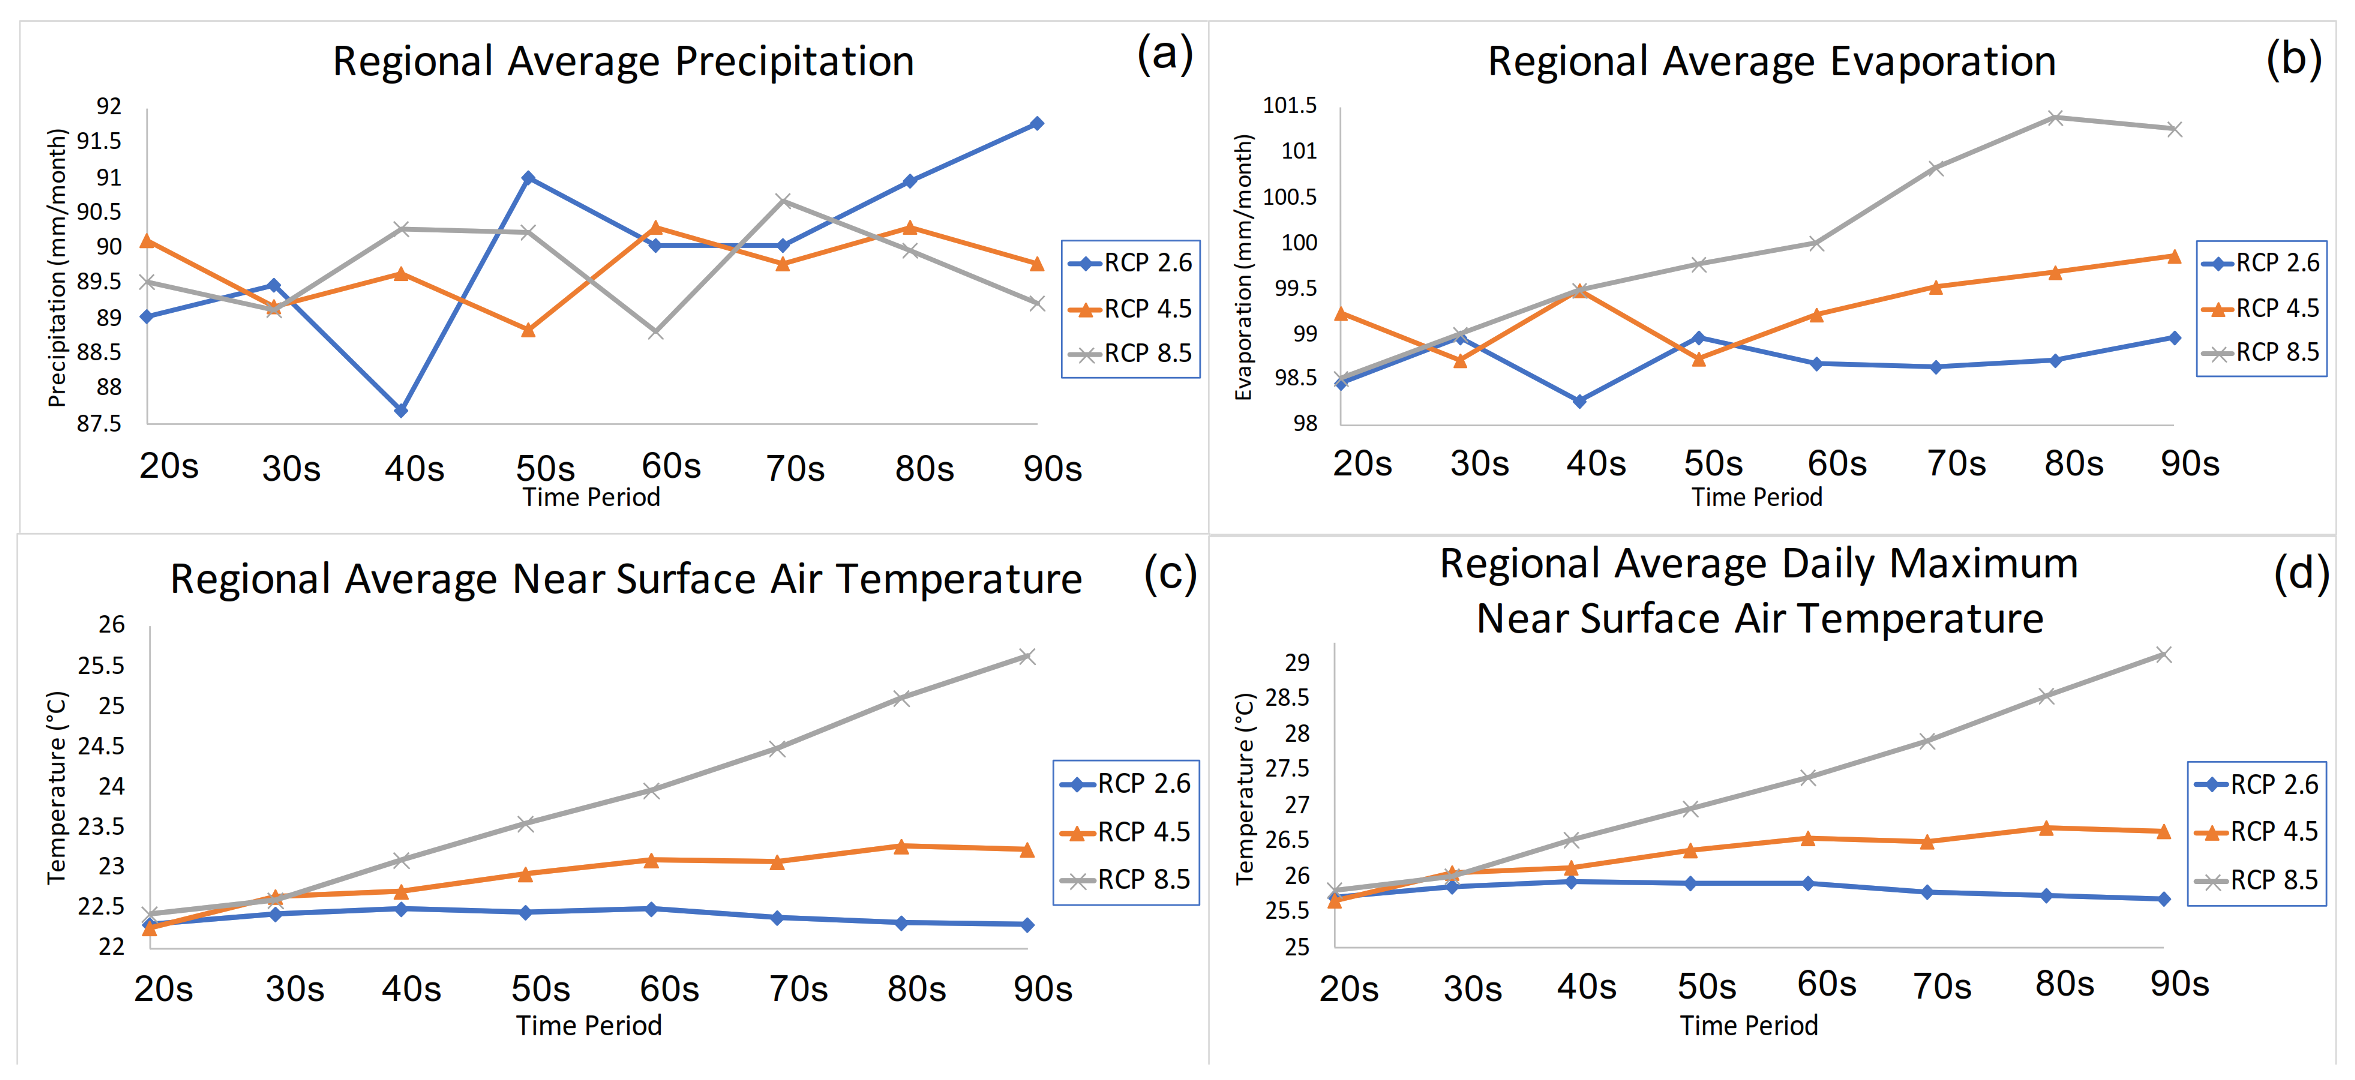
We calculated the regional average for all the climate metrics to assess the overall impact of various emission scenarios on Western Cape Province. In terms of precipitation (Figure 7a), there is not much fluctuation under both the RCP 4.5 and RCP 8.5 scenarios. However, there is an approximately 3.5% increase of rainfall with greater variability under the scenario of the RCP 2.6 from the year 2020 to the end of the 21st century. For evaporation (Figure 7b), there is no significant increase under both the RCP 2.6 and RCP 4.5 scenarios; however, there is a steady increasing trend with about a 3.1% increase of evaporation in 2100 under the RCP 8.5 scenario. In other words, emissions increases will bring more rainfall while causing more evaporation. However, both water-related characteristics did not display a linear trend over time, as opposed to the trends of those temperature metrics. Figure 7c,d shows that rates of change of temperature metrics are faster compared to those of precipitation and evaporation over time, indicating higher sensitivities of temperature metrics to GHG emissions. Figure 8 is a clear indication of how more emissions will increase the likelihood of water crises in the Western Cape. While the net water availability is negative under all three emissions scenarios, the values under the RCP 2.6 and RCP 8.5 scenarios exhibit the opposite trend: For the RCP 2.6 scenario, water availability condition in the Western Cape area improves after 2060 while the situation continues to get worse and worse under the RCP 8.5 scenario.
Temperature-related characteristics such as near-surface air temperature and daily maximum surface air temperature are more closely connected to GHG emissions compared to water-related metrics such as precipitation and evaporation. This is because increasing greenhouse gases will directly affect the temperature, and temperature will further cause rainfall to decrease and evaporation to increase [33].
3.3. Potential Policy Implications
Based on the results shown above, it is more likely to see severer droughts across the Western Cape region when doing business as usual, as opposed to taking serious actions and making policies to reduce GHG emissions. In terms of water availability, higher evaporation caused by regional warming offsets the relatively abundant rainfall for coastal regions, and those regions may suffer severer water crises than inland districts.
Local government and policymakers could make efforts on at least two aspects to increase water availability and avoid the “Day-Zero” water crisis problem: controlling the emissions and at the same time, improving water usage efficiency and diversifying water supply sources. First, in terms of emissions constraining technology, many innovative technologies emerge as solutions to cut emissions. As an example of emission reduction, smart-grid technologies are becoming popular that can use artificial intelligence (AI) to introduce a layer of digital intelligence to the grid to enable the industry to respond to the grid dynamically, restore power interruptions, accommodate alternative energy options, and facilitate demand response strategies [34]. There is significant potential for improving the efficiency of the electrical energy value chain and efficiency by introducing AI-based smart-grid technologies [34]. Carbon-capture technologies may be a more localized approach; however, these require global cooperation and collaboration to reach the level of significance. For improving water-usage efficiency, this requires citizens and government to adopt a water-sensitive approach in city planning and development that could include shifting water-management paradigms, developing new governance mechanisms, and guiding diversification of water supplies to provide resilience to potential future climate shocks [35]. In the meantime, local government should explore interventions that promote and proactively encourage behavioral change and address inequity regarding water rights [35]. Finally, we have to emphasize the importance of governance across all administrative levels [36], because all policies and measures against climate change and improving the livelihoods of the people that could last and be effective rely on proper governance.
4. Conclusions
In this study, Co-ordinated Regional Climate Downscaling Experiment (CORDEX) data were used to examine the potential impacts of various greenhouse-gas emissions (RCP 2.6, RCP 4.5 RCP 8.5) on the future climate systems in six districts within the Western Cape, South Africa. The global simulations have been downscaled with RCA 4 for the future 80 years of the 21st century. The precipitation and evaporation data were used to approximately predict future drought in terms of net available water for the region. Both spatial–temporal analysis and regional-average analysis suggest the following:
- Different climate metrics will respond differently to emissions scenarios. The projected simulation results reveal that temperature-related metrics are more sensitive to GHG emissions than water-related metrics as expected, as lower emissions can considerably alleviate climate vulnerability in Western Cape regions compared to business as usual.
- Climate change poses a localized effect on different regions in Western Cape. Districts closer to the south coast are more resilient to regional warming compared to inland areas, but less so in terms of water stress.
- A robust drying signal across the Western Cape region is likely to be seen in the near future if we continue doing business as usual (as seen in RCP 8.5). Efficient water-management practices and greenhouse-gas emissions reduction strategies are urgently needed to avoid more severe droughts such as the “Day-Zero” crisis in 2018, especially for the City of Cape Town and several other coastal regions within the Overberg and Eden district.
This study highlights the importance of the impact of climate emissions scenarios (RCP 2.6, RCP 4.5, and RCP 8.5) on the regional climate change signals simulated by the model chain MPI-ESM/RCA4. Since this is the only GCM-RCM model combination available, the results cannot provide a comprehensive evaluation of possible climate change signals in the region. Nonetheless, the results sufficiently demonstrated the great potential of reducing climate risks and vulnerability under lower GHG emission scenarios for Western Cape region. When more downscaled climate data across different RCPs are available for Africa, it will enable uncertainty analyses and quantification of future climate change using a sufficiently large ensemble of simulations.
Author Contributions
Conceptualization, B.H. and K.J.D.; methodology, B.H. and K.J.D.; software, B.H.; validation, B.H.; formal analysis, B.H.; investigation, B.H.; resources, B.H.; data curation, B.H.; writing—original draft preparation, B.H.; writing—review and editing, K.J.D.; visualization, B.H.; supervision, K.J.D.; Both authors have read and agreed to the published version of the manuscript.
Funding
This research received no external funding.
Institutional Review Board Statement
Not applicable.
Informed Consent Statement
Not applicable.
Data Availability Statement
Not applicable.
Conflicts of Interest
Authors declare no competing interests.
References
- Wolf, J.; Moser, S.C. Individual understandings, perceptions, and engagement with climate change: Insights from in-depth studies across the world. Wiley Interdiscip. Rev. Clim. Chang. 2011, 2, 547–569. [Google Scholar] [CrossRef]
- Haden, V.R.; Niles, M.T.; Lubell, M.; Perlman, J.; Jackson, L.E. Global and local concerns: What attitudes and beliefs motivate farmers to mitigate and adapt to climate change? PLoS ONE 2012, 7, e52882. [Google Scholar] [CrossRef]
- Niang, I.; Ruppel, O.C.; Abdrabo, M.A.; Essel, A.; Lennard, C.; Padgham, J.; Urquhart, P. Climate Change 2014: Impacts, Adaptation, and Vulnerability. Part B: Regional Aspects. Contribution of Working Group II to the Fifth Assessment Report of the Intergovernmental Panel on Climate Change; Barros, V.R., Field, C.B., Dokken, D.J., Eds.; Cambridge University Press: Cambridge, UK; New York, NY, USA, 2014; pp. 1199–1265. [Google Scholar]
- Talanow, K.; Topp, E.N.; Loos, J.; Martín-López, B. Farmers’ perceptions of climate change and adaptation strategies in South Africa’s Western Cape. J. Rural Stud. 2020, 81, 203–219. [Google Scholar] [CrossRef]
- Botai, C.M.; Botai, J.O.; Adeola, A.M. Spatial distribution of temporal precipitation contrasts in South Africa. S. Afr. J. Sci. 2018, 114, 70–78. [Google Scholar] [CrossRef]
- Ziervogel, G.; New, M.; Archer van Garderen, E.; Midgley, G.; Taylor, A.; Hamann, R.; Stuart-Hill, S.; Myers, J.; Warburton, M. Climate change impacts and adaptation in South Africa. Wiley Interdiscip. Rev. Clim. Chang. 2014, 5, 605–620. [Google Scholar] [CrossRef]
- Nhemachena, C.; Hassan, R.M.; Chakwizira, J. Analysis of determinants of farm-level adaptation measures to climate change in Southern Africa. J. Dev. Agric. Econ. 2014, 6, 232–241. [Google Scholar]
- Bohatch, T. What’s Causing Cape Town’s Water Crisis? 2017. Available online: https://www.groundup.org.za/article/whats-causing-cape-towns-water-crisis/ (accessed on 17 January 2020).
- Ding, K.; Jonathan, M.G.; George, M. Hornberger. “Avoiding” day-zero”: A Testbed for Evaluating Integrated Food-energy-water Management in Cape Town, South Africa. In Proceedings of the IEEE Proceedings: 2019 Winter Simulation Conference, National Harbor, MD, USA, 8–11 December 2019; pp. 866–877. [Google Scholar]
- Naik, M.; Abiodun, B.J. Projected changes in drought characteristics over the Western Cape, South Africa. Meteorol. Appl. 2020, 27, e1802. [Google Scholar] [CrossRef] [Green Version]
- Pascale, S.; Kapnick, S.B.; Delworth, T.L.; Cooke, W.F. Increasing risk of another Cape Town “Day Zero” drought in the 21st century. Proc. Acad. Natl. Sci. USA 2020, 117, 29495–29503. [Google Scholar] [CrossRef]
- Pendergrass, A.G.; Lehner, F.; Sanderson, B.M.; Xu, Y. Does extreme precipitation intensity depend on the emissions scenario? Geophys. Res. Lett. 2015, 42, 8767–8774. [Google Scholar] [CrossRef] [Green Version]
- Van Vuuren, D.P.; Stehfest, E.; den Elzen, M.G.; Kram, T.; van Vliet, J.; Deetman, S.; Isaac, M.; Goldewijk, K.K.; Hof, A.; Beltran, A.M.; et al. RCP2. 6: Exploring the possibility to keep global mean temperature increase below 2 °C. Clim. Chang. 2011, 109, 95. [Google Scholar] [CrossRef]
- Thomson, A.M.; Calvin, K.V.; Smith, S.J.; Kyle, G.P.; Volke, A.; Patel, P.; Delgado-Arias, S.; Bond-Lamberty, B.; Wise, M.A.; Clarke, L.E.; et al. RCP4. 5: A pathway for stabilization of radiative forcing by 2100. Clim. Chang. 2011, 109, 77. [Google Scholar] [CrossRef] [Green Version]
- Riahi, K.; Rao, S.; Krey, V.; Cho, C.; Chirkov, V.; Fischer, G.; Kindermann, G.; Nakicenovic, N.; Rafaj, P. RCP 8.5—A scenario of comparatively high greenhouse gas emissions. Clim. Chang. 2011, 1–2, 33. [Google Scholar] [CrossRef] [Green Version]
- Meterlekamp, L. Commercial Agriculture in the Swartland: Investigating Emerging Trends towards More Sustainable Food Production. Maters’ Thesis, Stellenbosch University, Stellenbosch, South Africa, 2011. [Google Scholar]
- Directorate Statistics, Analysis, Economic, 2013. Abstract of Agricultural Statistics: 2013. Department of Agriculture, Forestry and Fisheries, Republic of South Africa (DAFF), Pretoria. Available online: https://www.daff.gov.za/docs/statsinfo/Abstact2013.pdf (accessed on 17 January 2020).
- Araujo, J.A.; Abiodun, B.J.; Crespo, O. Impacts of drought on grape yields in the Western Cape, South Africa. Theor. Appl. Climatol. 2016, 123, 117. [Google Scholar] [CrossRef]
- Midgley, G.F.; Chapman, R.A.; Hewitson, B.; Johnston, P.; de Wit, M.; Ziervogel, G.; Mukheibir, P.; van Niekerk, L.; Tadross, M.; van Wilgen, B.W.; et al. A Status Quo, Vulnerability and Adaptation Assessment of the Physical and Socio-Economic Effects of Climate Change in the Western Cape; Report to the Western Cape Government. Council for Scientific and Industrial Research, Report No. ENV-SC 2005-073; Stellenbosch: Cape Town, South Africa, 2005. [Google Scholar]
- Hurry, L.; Van Heerden, J. Southern Africa’s Weather Patterns: A Guide to the Interpretation of Synoptic Maps, 1st ed.; Via Afrika: Cape Town, South Africa, 1982. [Google Scholar]
- Dennis, I.; Dennis, R. Climate change vulnerability index for South African aquifers. Water SA 2012, 38, 417–426. [Google Scholar] [CrossRef] [Green Version]
- Blamey, R.C.; Ramos, A.M.; Trigo, R.M.; Tomé, R.; Reason, C.J.C. The influence of atmospheric rivers over the South Atlantic on winter rainfall in South Africa. J. Hydrometeorol. 2017, 19, 127–142. [Google Scholar] [CrossRef]
- Statistics South Africa. Mid-Year Population Estimates. 2020. Available online: http://www.statssa.gov.za/publications/P0302/P03022020.pdf (accessed on 17 January 2020).
- Giorgetta, M.A.; Jungclaus, J.; Reick, C.H.; Legutke, S.; Bader, J.; Böttinger, M.; Brovkin, V.; Crueger, T.; Esch, M.; Fieg, K.; et al. Climate and carbon cycle changes from 1850 to 2100 in MPI-ESM simulations for the Coupled Model Intercomparison Project phase 5. J. Adv. Modeling Earth Syst. 2013, 5, 572–597. [Google Scholar] [CrossRef]
- Gnitou, G.T.; Ma, T.; Tan, G.; Ayugi, B.; Nooni, I.K.; Alabdulkarim, A.; Tian, Y. Evaluation of the Rossby Centre Regional Climate Model Rainfall Simulations over West Africa using large-scale spatial and temporal statistical metrics. Atmosphere 2019, 10, 802. [Google Scholar] [CrossRef] [Green Version]
- Ayugi, B.; Tan, G.; Gnitou, G.T.; Ojara, M.; Ongoma, V. Historical evaluations and simulations of precipitation over East Africa from Rossby centre regional climate model. Atmos. Res. 2020, 232, 104705. [Google Scholar] [CrossRef]
- Ogega, O.M.; Koske, J.; Kung’u, J.B.; Scoccimarro, E.; Endris, H.S.; Mistry, M.N. Heavy precipitation events over East Africa in a changing climate: Results from CORDEX RCMs. Clim. Dyn. 2020, 55, 993–1009. [Google Scholar] [CrossRef]
- RStudio Team. RStudio: Integrated Development for R. RStudio; PBC: Boston, MA, USA, 2020; Available online: http://www.rstudio.com/ (accessed on 17 January 2021).
- Hornberger, G.M.; Wiberg, P.L.; Raffensperger, J.P.; D’Odorico, P. Elements of Physical Hydrology; JHU Press: Baltimore, MD, USA, 2014. [Google Scholar]
- Arnell, N.W. Climate change and global water resources. Glob. Environ. Chang. 1999, 9, S31–S49. [Google Scholar] [CrossRef]
- Milly, P.C.D. Climate, interseasonal storage of soil water, and the annual water balance. Adv. Water Res. 1994, 17, 19–24. [Google Scholar] [CrossRef]
- Taylor, R.G.; Scanlon, B.; Döll, P.; Rodell, M.; Van Beek, R.; Wada, Y.; Longuevergne, L.; Leblanc, M.; Famiglietti, J.S.; Edmunds, M.; et al. Ground water and climate change. Nat. Clim. Chang. 2013, 3, 322–329. [Google Scholar] [CrossRef] [Green Version]
- Barnett, T.P.; Adam, J.C.; Lettenmaier, D.P. Potential impacts of a warming climate on water availability in snow-dominated regions. Nature 2005, 438, 303–309. [Google Scholar] [CrossRef] [PubMed]
- Diab, R. Recommendations for the energy efficiency technology landscape in South Africa. J. Energy South. Afr. 2018, 29, 84–86. [Google Scholar] [CrossRef] [Green Version]
- Taing, L.; Chang, C.C.; Pan, S.; Armitage, N.P. Towards a water secure future: Reflections on Cape Town’s Day Zero crisis. Urban Water J. 2019, 16, 530–536. [Google Scholar] [CrossRef]
- Ding, T.; Gunda, T.; Hornberger, G.M. Prominent Influence of Socioeconomic and Governance Factors on the Food-Energy-Water Nexus in Sub-Saharan Africa. Earth’s Future 2019, 7, 1071–1087. [Google Scholar] [CrossRef] [Green Version]
Figure 1.
The study domain depicting the six main districts (City of Cape Town, West Coast, Cape Winelands, Overberg, Garden Route, Central Karoo) in the Western Cape region (South Africa). The black solid line delineates the political boundary of each main district in the Western Cape.
Figure 1.
The study domain depicting the six main districts (City of Cape Town, West Coast, Cape Winelands, Overberg, Garden Route, Central Karoo) in the Western Cape region (South Africa). The black solid line delineates the political boundary of each main district in the Western Cape.

Figure 2.
Spatial–temporal patterns of precipitation in Western Cape, South Africa (for 2021–2100) for 3 emission scenarios: (a–l) exhibit the precipitation projection pattern for the each 20-year span from 2021–2100 under the 3 different GHG emission scenarios.
Figure 2.
Spatial–temporal patterns of precipitation in Western Cape, South Africa (for 2021–2100) for 3 emission scenarios: (a–l) exhibit the precipitation projection pattern for the each 20-year span from 2021–2100 under the 3 different GHG emission scenarios.

Figure 3.
Spatial–temporal patterns of near-surface air temperature in Western Cape, South Africa (2021–2100) for 3 CO2 emissions scenarios: (a–l) exhibit the mean near-surface air temperature projection pattern for the each 20-year span from 2021-2100 under the 3 different GHG emission scenarios.
Figure 3.
Spatial–temporal patterns of near-surface air temperature in Western Cape, South Africa (2021–2100) for 3 CO2 emissions scenarios: (a–l) exhibit the mean near-surface air temperature projection pattern for the each 20-year span from 2021-2100 under the 3 different GHG emission scenarios.

Figure 4.
Spatial–temporal patterns of daily maximum surface air temperature in Western Cape, South Africa (2021–2100) for 3 CO2 emissions scenarios: (a–l) exhibit the daily maximum surface air temperature projection pattern for the each 20-year span from 2021–2100 under the 3 different GHG emission scenarios.

Figure 5.
Spatial–temporal patterns of spatially distributed evaporation in Western Cape, South Africa (2021–2100) for 3 CO2 emissions scenarios: (a–l) exhibit the evaporation projection pattern for the each 20-year span from 2021–2100 under the 3 different GHG emission scenarios.
Figure 5.
Spatial–temporal patterns of spatially distributed evaporation in Western Cape, South Africa (2021–2100) for 3 CO2 emissions scenarios: (a–l) exhibit the evaporation projection pattern for the each 20-year span from 2021–2100 under the 3 different GHG emission scenarios.

Figure 6.
Spatial–temporal patterns of net available water in Western Cape, South Africa (2021–2100) for 3 CO2 emissions scenarios: (a–l) exhibit the net available water projection pattern for the each 20-year span from 2021-2100 under the 3 different GHG emission scenarios.
Figure 6.
Spatial–temporal patterns of net available water in Western Cape, South Africa (2021–2100) for 3 CO2 emissions scenarios: (a–l) exhibit the net available water projection pattern for the each 20-year span from 2021-2100 under the 3 different GHG emission scenarios.

Figure 7.
Projection of regional averaged climate metrics in Western Cape, South Africa for 3 CO2 emissions scenarios: (a) regional average precipitation; (b) regional average evaporation; (c) regional average near-surface air temperature; (d) regional average daily maximum surface air temperature.
Figure 7.
Projection of regional averaged climate metrics in Western Cape, South Africa for 3 CO2 emissions scenarios: (a) regional average precipitation; (b) regional average evaporation; (c) regional average near-surface air temperature; (d) regional average daily maximum surface air temperature.

Figure 8.
Projection of regional average water balance in Western Cape area for 3 CO2 emissions scenarios.
Figure 8.
Projection of regional average water balance in Western Cape area for 3 CO2 emissions scenarios.


Table 1.
Summary of the simulation data.
| Domain | Resolution | Driving Model | Time Frequency | Downscaling Resolution | RCM Model | Ensemble | Variable | Experiment |
|---|---|---|---|---|---|---|---|---|
| AFR | 0.44 | MPI-M-MPI-ESM-LR | Monthly | V1 | RCA 4 | R1i1p1 | pr, tas, tasmax, evspsbl | Rcp26 |
| Rcp45 | ||||||||
| Rcp85 |
Publisher’s Note: MDPI stays neutral with regard to jurisdictional claims in published maps and institutional affiliations. |
© 2021 by the authors. Licensee MDPI, Basel, Switzerland. This article is an open access article distributed under the terms and conditions of the Creative Commons Attribution (CC BY) license (http://creativecommons.org/licenses/by/4.0/).
Share and Cite
MDPI and ACS Style
He, B.; Ding, K.J. Localize the Impact of Global Greenhouse Gases Emissions under an Uncertain Future: A Case Study in Western Cape, South Africa. Earth 2021, 2, 111-123. https://0-doi-org.brum.beds.ac.uk/10.3390/earth2010007
AMA Style
He B, Ding KJ. Localize the Impact of Global Greenhouse Gases Emissions under an Uncertain Future: A Case Study in Western Cape, South Africa. Earth. 2021; 2(1):111-123. https://0-doi-org.brum.beds.ac.uk/10.3390/earth2010007
Chicago/Turabian StyleHe, Bowen, and Ke J. Ding. 2021. "Localize the Impact of Global Greenhouse Gases Emissions under an Uncertain Future: A Case Study in Western Cape, South Africa" Earth 2, no. 1: 111-123. https://0-doi-org.brum.beds.ac.uk/10.3390/earth2010007