
Vulnerability of Soil Carbon Regulating Ecosystem Services due to Land Cover Change in the State of New Hampshire, USA


 ,
,  , and
, and
Abstract
:1. Introduction
2. Materials and Methods
3. Results
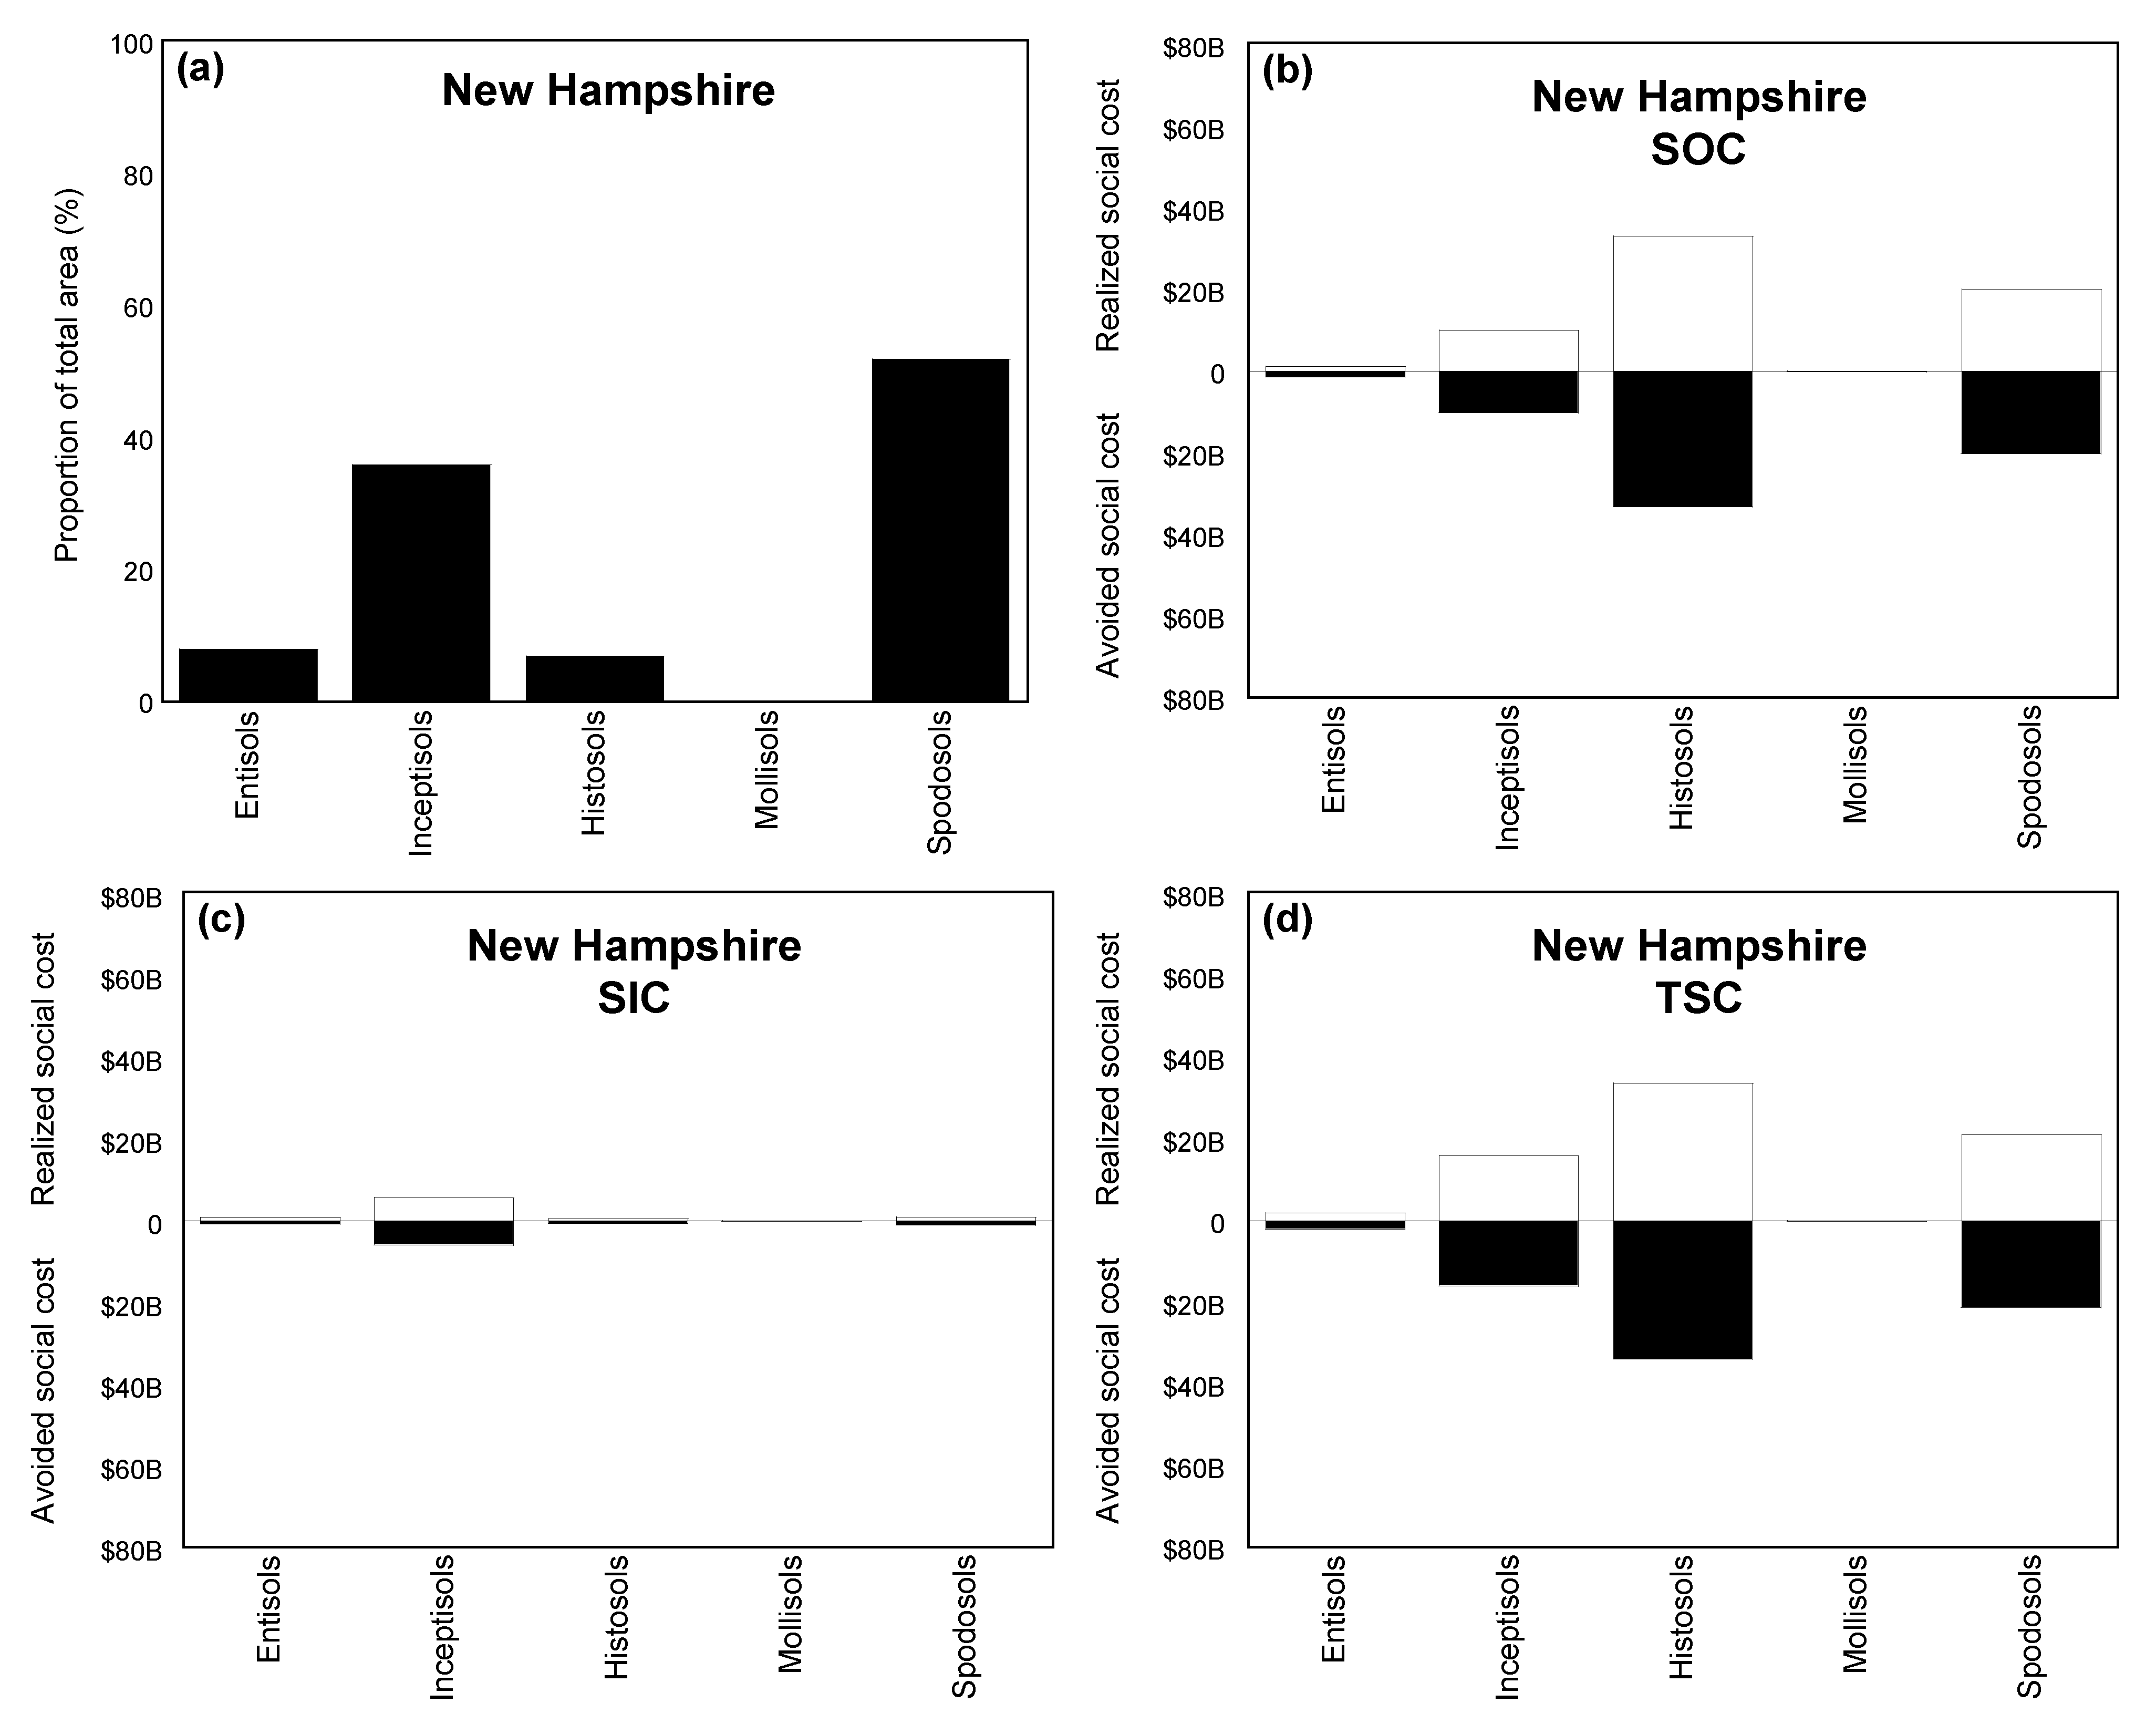
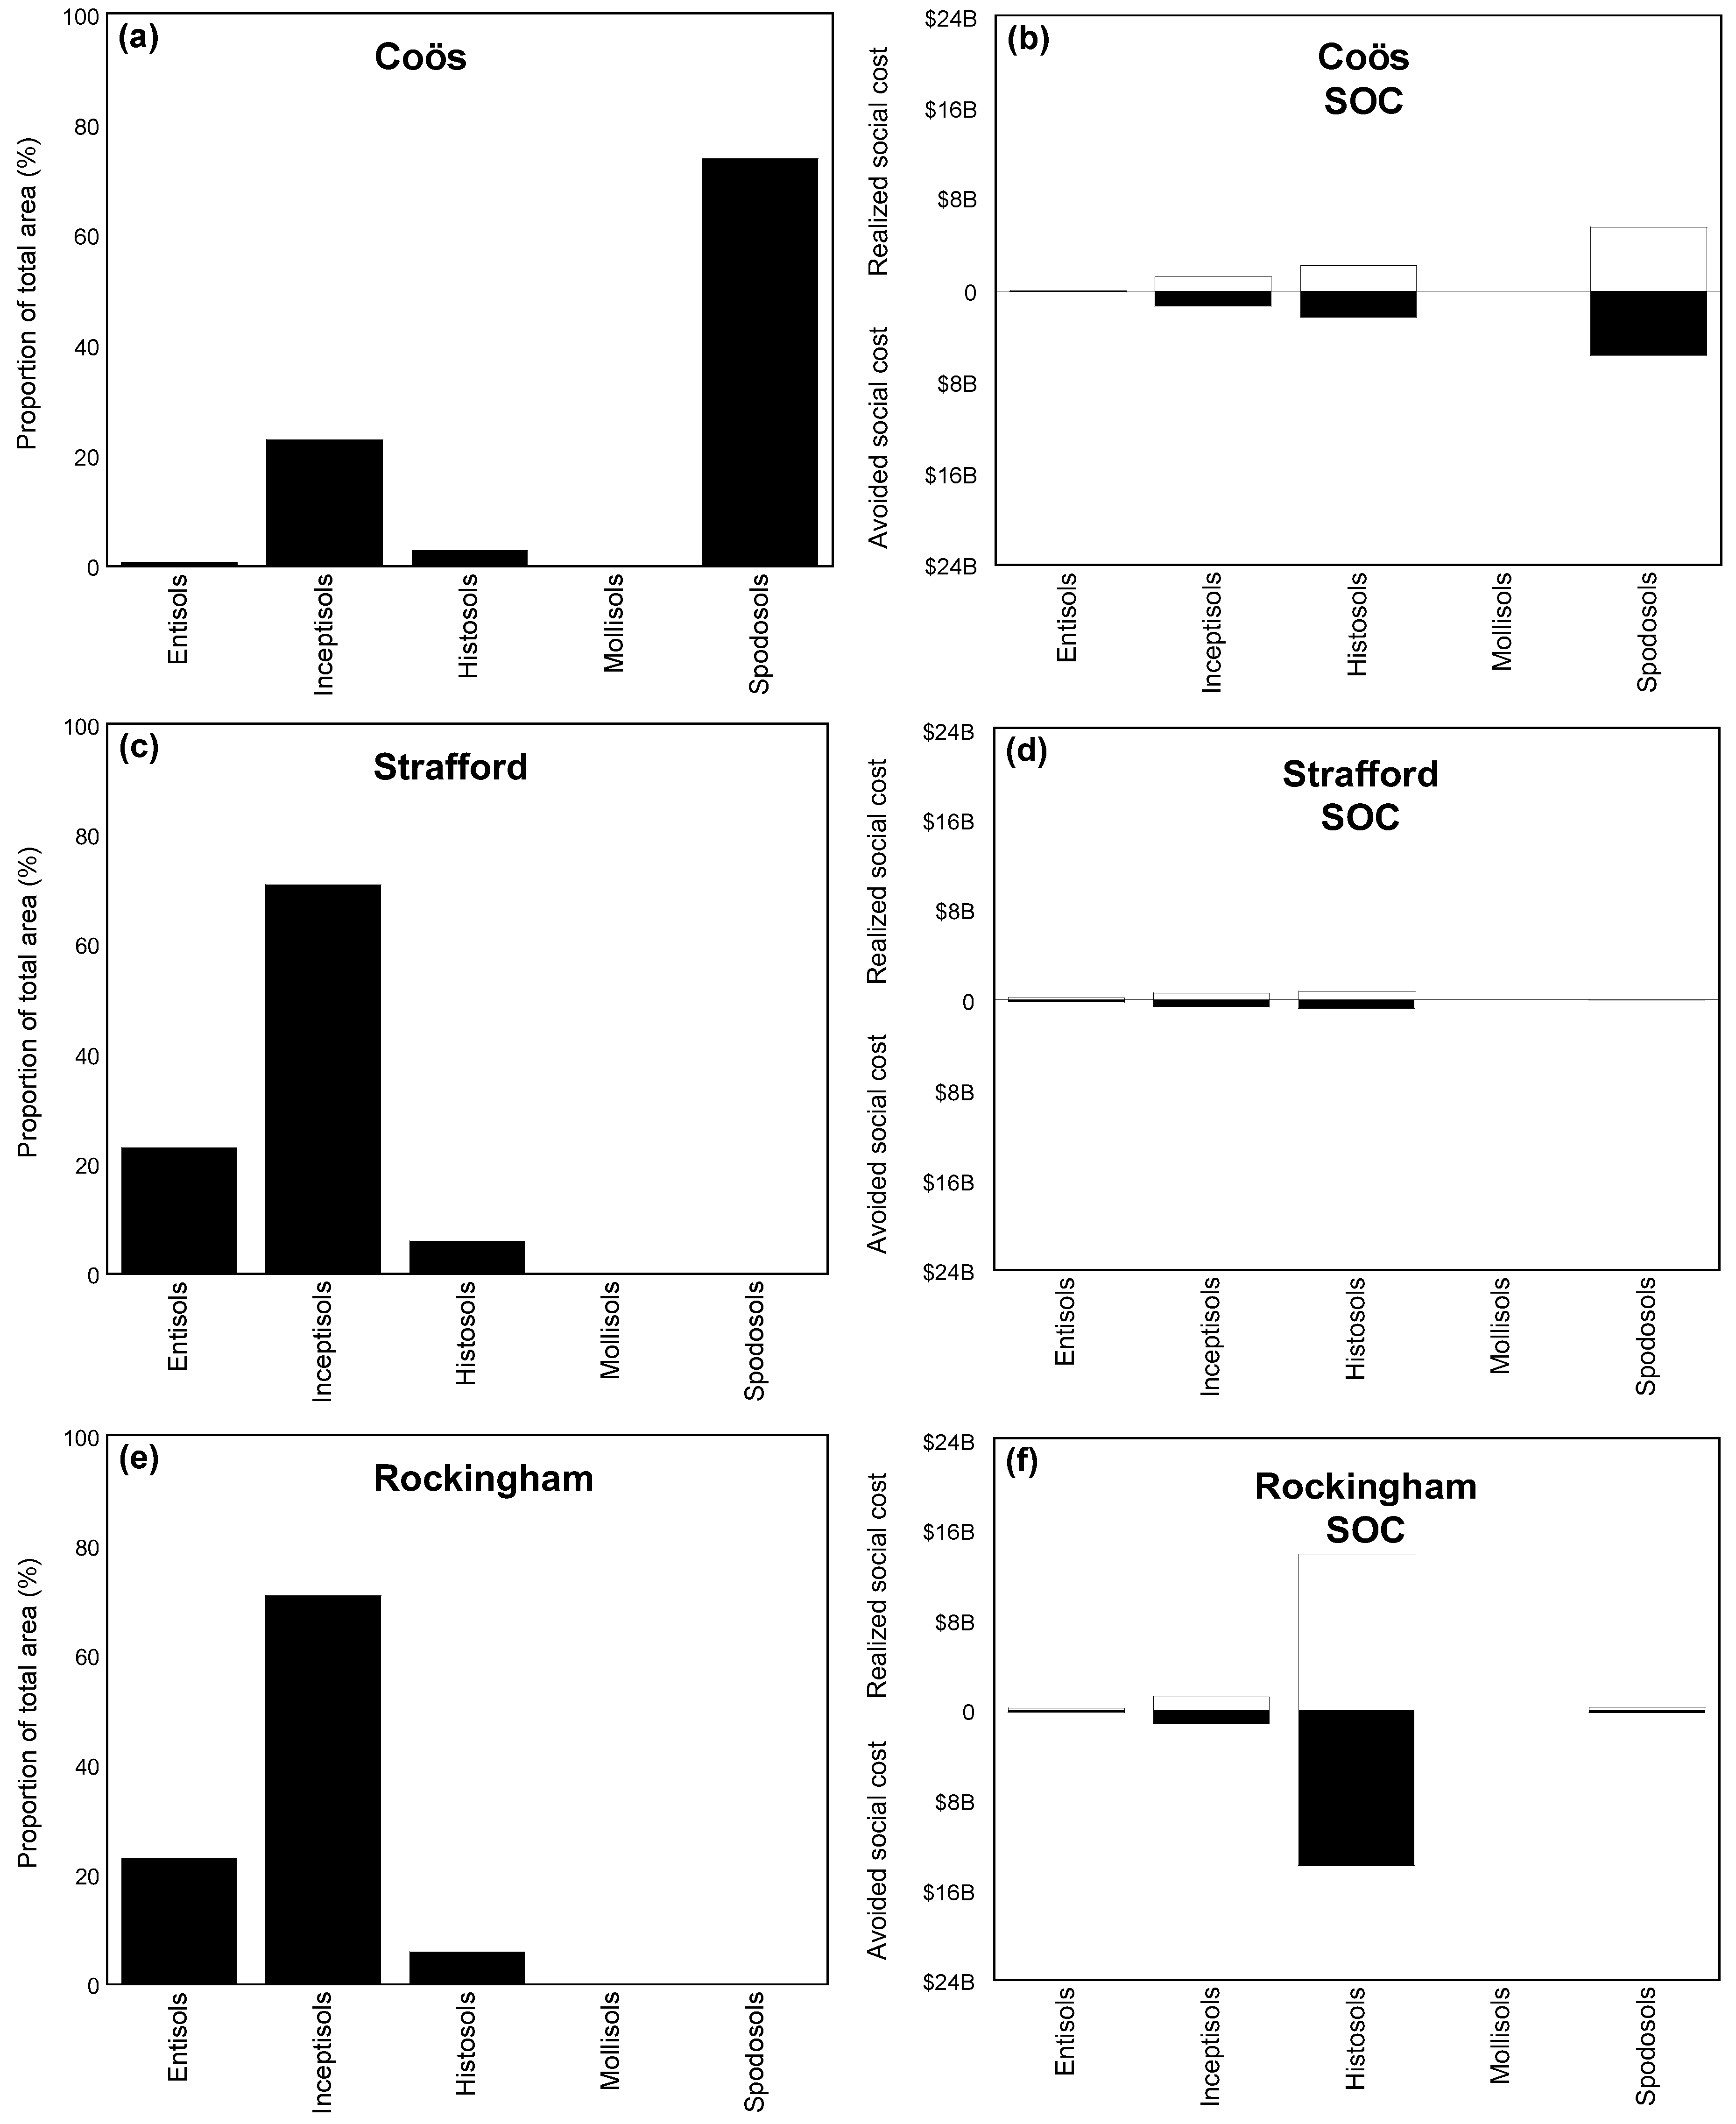
3.1. Storage and Value of SOC by Soil Order and County for New Hampshire
3.2. Storage and Value of SIC by Soil Order and County for the State of New Hampshire
3.3. Storage and Value of TSC (SOC + SIC) by Soil Order and County for New Hampshire
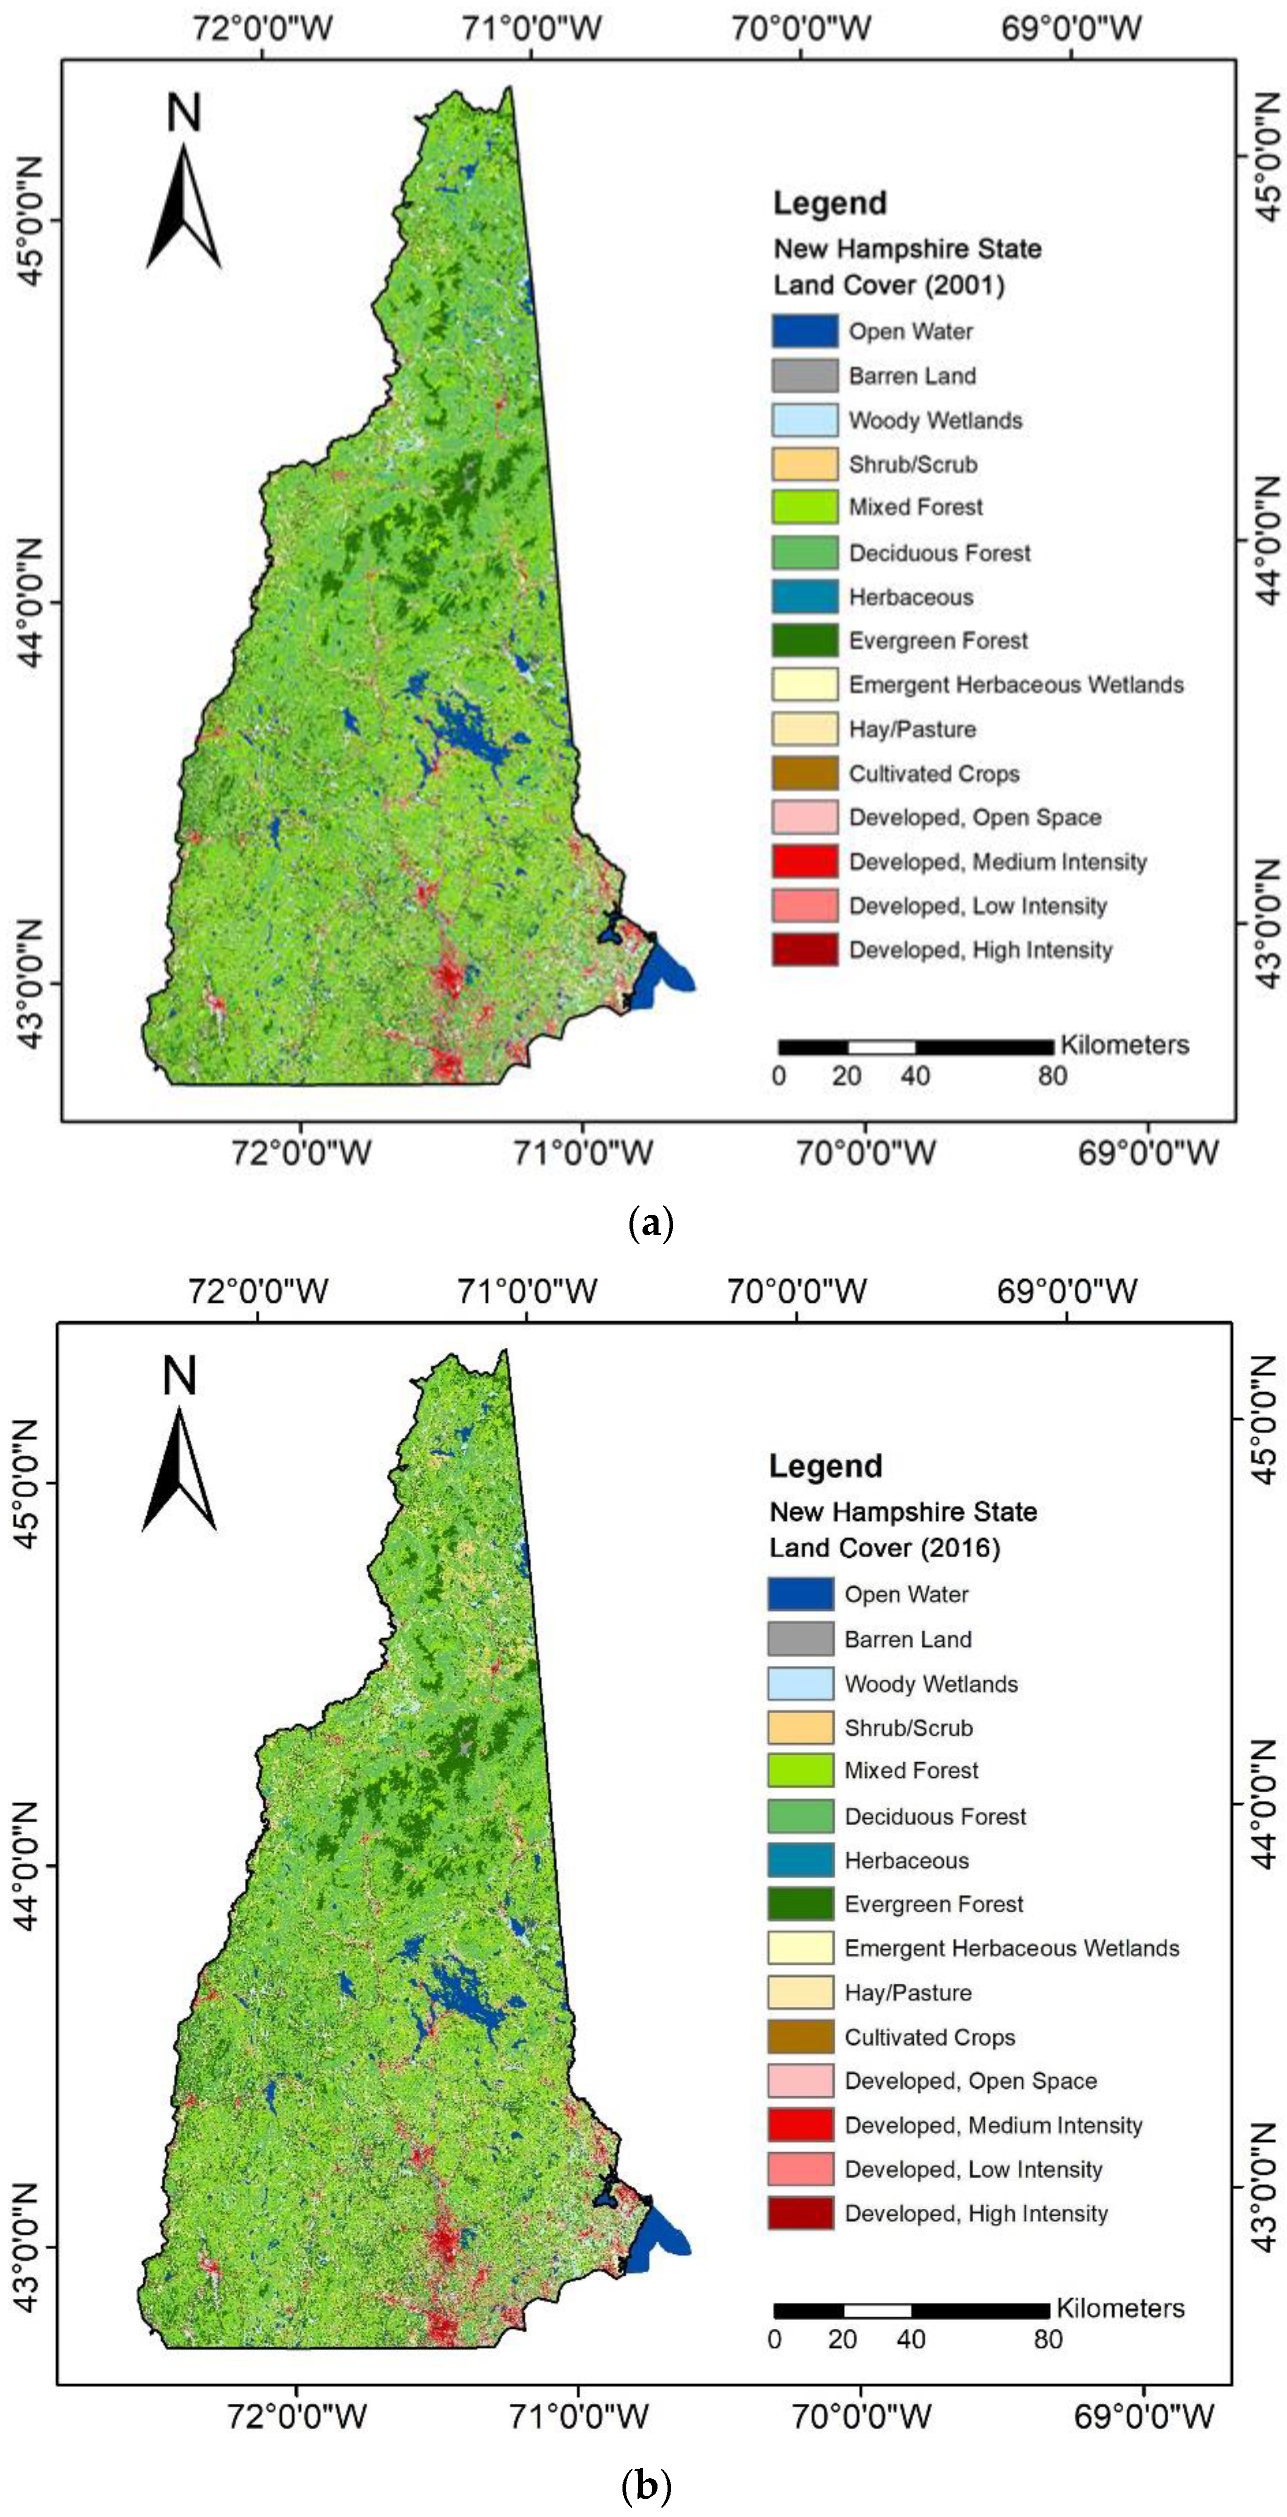
3.4. Land Use/Land Cover Change by Soil Order in New Hampshire from 2001 to 2016
4. Discussion
5. Conclusions
Author Contributions
Funding
Institutional Review Board Statement
Informed Consent Statement
Acknowledgments
Conflicts of Interest
Glossary
| ED | Ecosystem disservices |
| ES | Ecosystem services |
| EPA | Environmental Protection Agency |
| SC-CO2 | Social cost of carbon emissions |
| SDGs | Sustainable Development Goals |
| SOC | Soil organic carbon |
| SIC | Soil inorganic carbon |
| SOM | Soil organic matter |
| SSURGO | Soil Survey Geographic Database |
| TSC | Total soil carbon |
| USDA | United States Department of Agriculture |
| U.S.A. | United States of America |
References
- Keestra, S.D.; Bouma, J.; Wallinga, J.; Tittonell, P.; Smith, P.; Cerda, A.; Montanarella, L.; Quinton, J.N.; Pachepsky, Y.; Van der Putten, W.H.; et al. The significance of soils and soil science towards realization of the United Nations Sustainable Development Goals. Soil 2016, 2, 111–128. [Google Scholar] [CrossRef] [Green Version]
- Wood, S.L.; Jones, S.K.; Johnson, J.A.; Brauman, K.A.; Chaplin-Kramer, R.; Fremier, A.; Girvetz, E.; Gordon, L.J.; Kappel, C.V.; Mandle, L.; et al. Distilling the role of ecosystem services in the Sustainable Development Goals. Ecosyt. Serv. 2017, 29, 701–782. [Google Scholar] [CrossRef] [Green Version]
- Mikhailova, E.A.; Zurqani, H.A.; Post, C.J.; Schlautman, M.A.; Post, C.J. Soil diversity (pedodiversity) and ecosystem services. Land 2021, 10, 288. [Google Scholar] [CrossRef]
- Zamanian, K.; Zhou, J.; Kuzyakov, Y. Soil carbonates: The unaccounted, irrecoverable carbon source. Geoderma 2021, 384, 114817. [Google Scholar] [CrossRef]
- Adhikari, K.; Hartemink, A.E. Linking soils to ecosystem services—A global review. Geoderma 2016, 262, 101–111. [Google Scholar] [CrossRef]
- Baveye, P.; Baveye, J.; Gowdy, J. Soil “ecosystem” services and natural capital: Critical appraisal of research on uncertain ground. Front. Environ. Sci. 2016, 4, 41. [Google Scholar] [CrossRef]
- Amundson, R.; Biardeau, L. Soil carbon sequestration is an elusive climate mitigation tool. Proc. Natl. Acad. Sci. USA 2018, 115, 11652–11656. [Google Scholar] [CrossRef] [PubMed] [Green Version]
- Plaster, E.J. Soil Science and Management, 4th ed.; Delmar Learning Inc.: Clifton Park, NY, USA, 2013; ISBN 0766839362. [Google Scholar]
- USDA/NRCS. State Soils. Available online: https://www.nrcs.usda.gov/wps/portal/nrcs/detail/soils/edu/?cid=stelprdb1236841 (accessed on 1 April 2021).
- Jevon, F.V.; D’Amato, A.W.; Woodall, C.W.; Evans, K.; Ayres, M.P.; Matthes, J.H. Tree basal area and conifer abundance predict soil carbon stocks and concentrations in an actively managed forest of northern New Hampshire, USA. Forest Ecol. Manag. 2019, 451, 117534. [Google Scholar] [CrossRef]
- Soil Survey Staff, Natural Resources Conservation Service, United States Department of Agriculture. Soil Survey Geographic (SSURGO) Database. Available online: https://nrcs.app.box.com/v/soils (accessed on 10 September 2020).
- Bailey, G.D.; Pilgrim, S.A.L. Soils of the White Mountains of New Hampshire and their suitability for recreational development. Mt. Res. Dev. 1983, 3, 53–60. [Google Scholar] [CrossRef]
- Wright, A.L.; Inglett, P.W. Soil organic carbon and nitrogen and distribution of carbon-13 and nitrogen-15 in aggregates of Everglades Histosols. Soil Sci. Soc. Am. J. 2009, 73, 427–433. [Google Scholar] [CrossRef]
- Fossey, M.; Angers, D.; Bustany, C.; Cudennec, C.; Durand, P.; Gascuel-Odoux, C.; Jaffrezic, A.; Pérès, G.; Besse, C.; Walter, C. A framework to consider soil ecosystem services in territorial planning. Front. Environ. Sci. 2020, 8, 28. [Google Scholar] [CrossRef] [Green Version]
- Mikhailova, E.A.; Groshans, G.R.; Post, C.J.; Schlautman, M.A.; Post, G.C. Valuation of soil organic carbon stocks in the contiguous United States based on the avoided social cost of carbon emissions. Resources 2019, 8, 153. [Google Scholar] [CrossRef] [Green Version]
- Groshans, G.R.; Mikhailova, E.A.; Post, C.J.; Schlautman, M.A.; Zhang, L. Determining the value of soil inorganic carbon stocks in the contiguous United States based on the avoided social cost of carbon emissions. Resources 2019, 8, 119. [Google Scholar] [CrossRef] [Green Version]
- Mikhailova, E.A.; Post, C.J.; Schlautman, M.A.; Post, C.J.; Zurqani, H.A. Determining farm-scale site-specific monetary values of “soil carbon hotspots” based on avoided social costs of CO2 emissions. Cogent Environ. Sci. 2020, 6, 1–1817289. [Google Scholar] [CrossRef]
- Mikhailova, E.A.; Groshans, G.R.; Post, C.J.; Schlautman, M.A.; Post, C.J. Valuation of total soil carbon stocks in the contiguous United States based on the avoided social cost of carbon emissions. Resources 2019, 8, 157. [Google Scholar] [CrossRef] [Green Version]
- EPA (United States Environmental Protection Agency). The Social Cost of Carbon. EPA Fact Sheet. 2016. Available online: https://19january2017snapshot.epa.gov/climatechange/social-cost-carbon_.html (accessed on 15 March 2021).
- Guo, Y.; Amundson, R.; Gong, P.; Yu, Q. Quantity and spatial variability of soil carbon in the conterminous United States. Soil Sci. Soc. Am. J. 2006, 70, 590–600. [Google Scholar] [CrossRef] [Green Version]
- The United States Census Bureau, 2018 TIGER/Line Boundary Shapefiles. Available online: https://www.census.gov/geographies/mapping-files/time-series/geo/tiger-line-file.2018.html (accessed on 10 March 2021).
- Multi-Resolution Land Characteristics Consortium (MRLC). Available online: https://www.mrlc.gov/ (accessed on 1 March 2021).
- ESRI (Environmental Systems Research Institute). ArcMap 10.7. Available online: https://support.esri.com/en/products/desktop/arcgis-desktop/arcmap/10-7-1 (accessed on 1 March 2021).
- Soil Survey Staff, Natural Resources Conservation Service, United States Department of Agriculture. Photos of Soil Orders. Available online: https://www.nrcs.usda.gov/wps/portal/nrcs/detail/soils/edu/?cid=nrcs142p2_053588 (accessed on 20 February 2021).
- Bétard, F.; Peulvast, J. Geodiversity hotspots: Concept, method and cartographic application for geoconservation purposes at a regional scale. Environ. Manag. 2019, 63, 822–834. [Google Scholar] [CrossRef] [PubMed]
- IPCC (International Panel on Climate Change). Guidelines for National Greenhouse Gas Inventories. AFOLU (Agriculture, Forestry and Other Land Use). 2006. Available online: http://www.ipcc-nggip.iges.or.jp/public/2006gl/vol4.html (accessed on 10 March 2021).
- Sallustio, L.; Quatrini, V.; Geneletti, D.; Corona, P.; Marchetti, M. Assessing land take by urban development and its impact on carbon storage: Findings from two case studies in Italy. Environ. Impact Assess. Rev. 2015, 54, 80–90. [Google Scholar] [CrossRef] [Green Version]
- Robalino, J.A.; Pfaff, A. Contagious development: Neighbor interactions in deforestation. J. Dev. Econ. 2012, 97, 427–436. [Google Scholar] [CrossRef]
- Schlesinger, W.H.; Amundson, R. Managing for soil carbon sequestration: Let’s get realistic. Glob. Chang. Biol. 2019, 25, 386–389. [Google Scholar] [CrossRef] [PubMed] [Green Version]


| Stocks | Ecosystem Services | |||
|---|---|---|---|---|
| Soil Order | General Characteristics and Constraints | Provisioning | Regulation/Maintenance | Cultural |
| Slightly Weathered | ||||
| Entisols | Embryonic soils with ochric epipedon | x | x | x |
| Inceptisols | Young soils with ochric or umbric epipedon | x | x | x |
| Histosols | Organic soils with ≥20% of organic carbon | x | x | x |
| Moderately Weathered | ||||
| Mollisols | Carbon-enriched soils with B.S. ≥ 50% | x | x | x |
| Strongly Weathered | ||||
| Spodosols | Coarse-textured soils with albic and spodic horizons | x | x | x |
| STOCKS | FLOWS | VALUE | ||
|---|---|---|---|---|
| Biophysical Accounts (Science-Based) | Administrative Accounts (Boundary-Based) | Monetary Account(s) | Benefit(s) | Total Value |
| Soil extent: | Administrative extent: | Ecosystem good(s) and service(s): | Sector: | Types of value: |
| Separate constitute stock 1: Soil organic carbon (SOC) | ||||
| Separate constitute stock 2: Soil inorganic carbon (SIC) | ||||
| Composite (total) stock: Total soil carbon (TSC) = Soil organic carbon (SOC) + Soil inorganic carbon (SIC) | ||||
| Environment: | The social cost of carbon (SC-CO2) and avoided emissions: | |||
| - Soil order | - State - County | - Regulating (e.g., carbon sequestration) | - Carbon sequestration | - $46 per metric ton of CO2 (2007 U.S. dollars with an average discount rate of 3% [19]) |
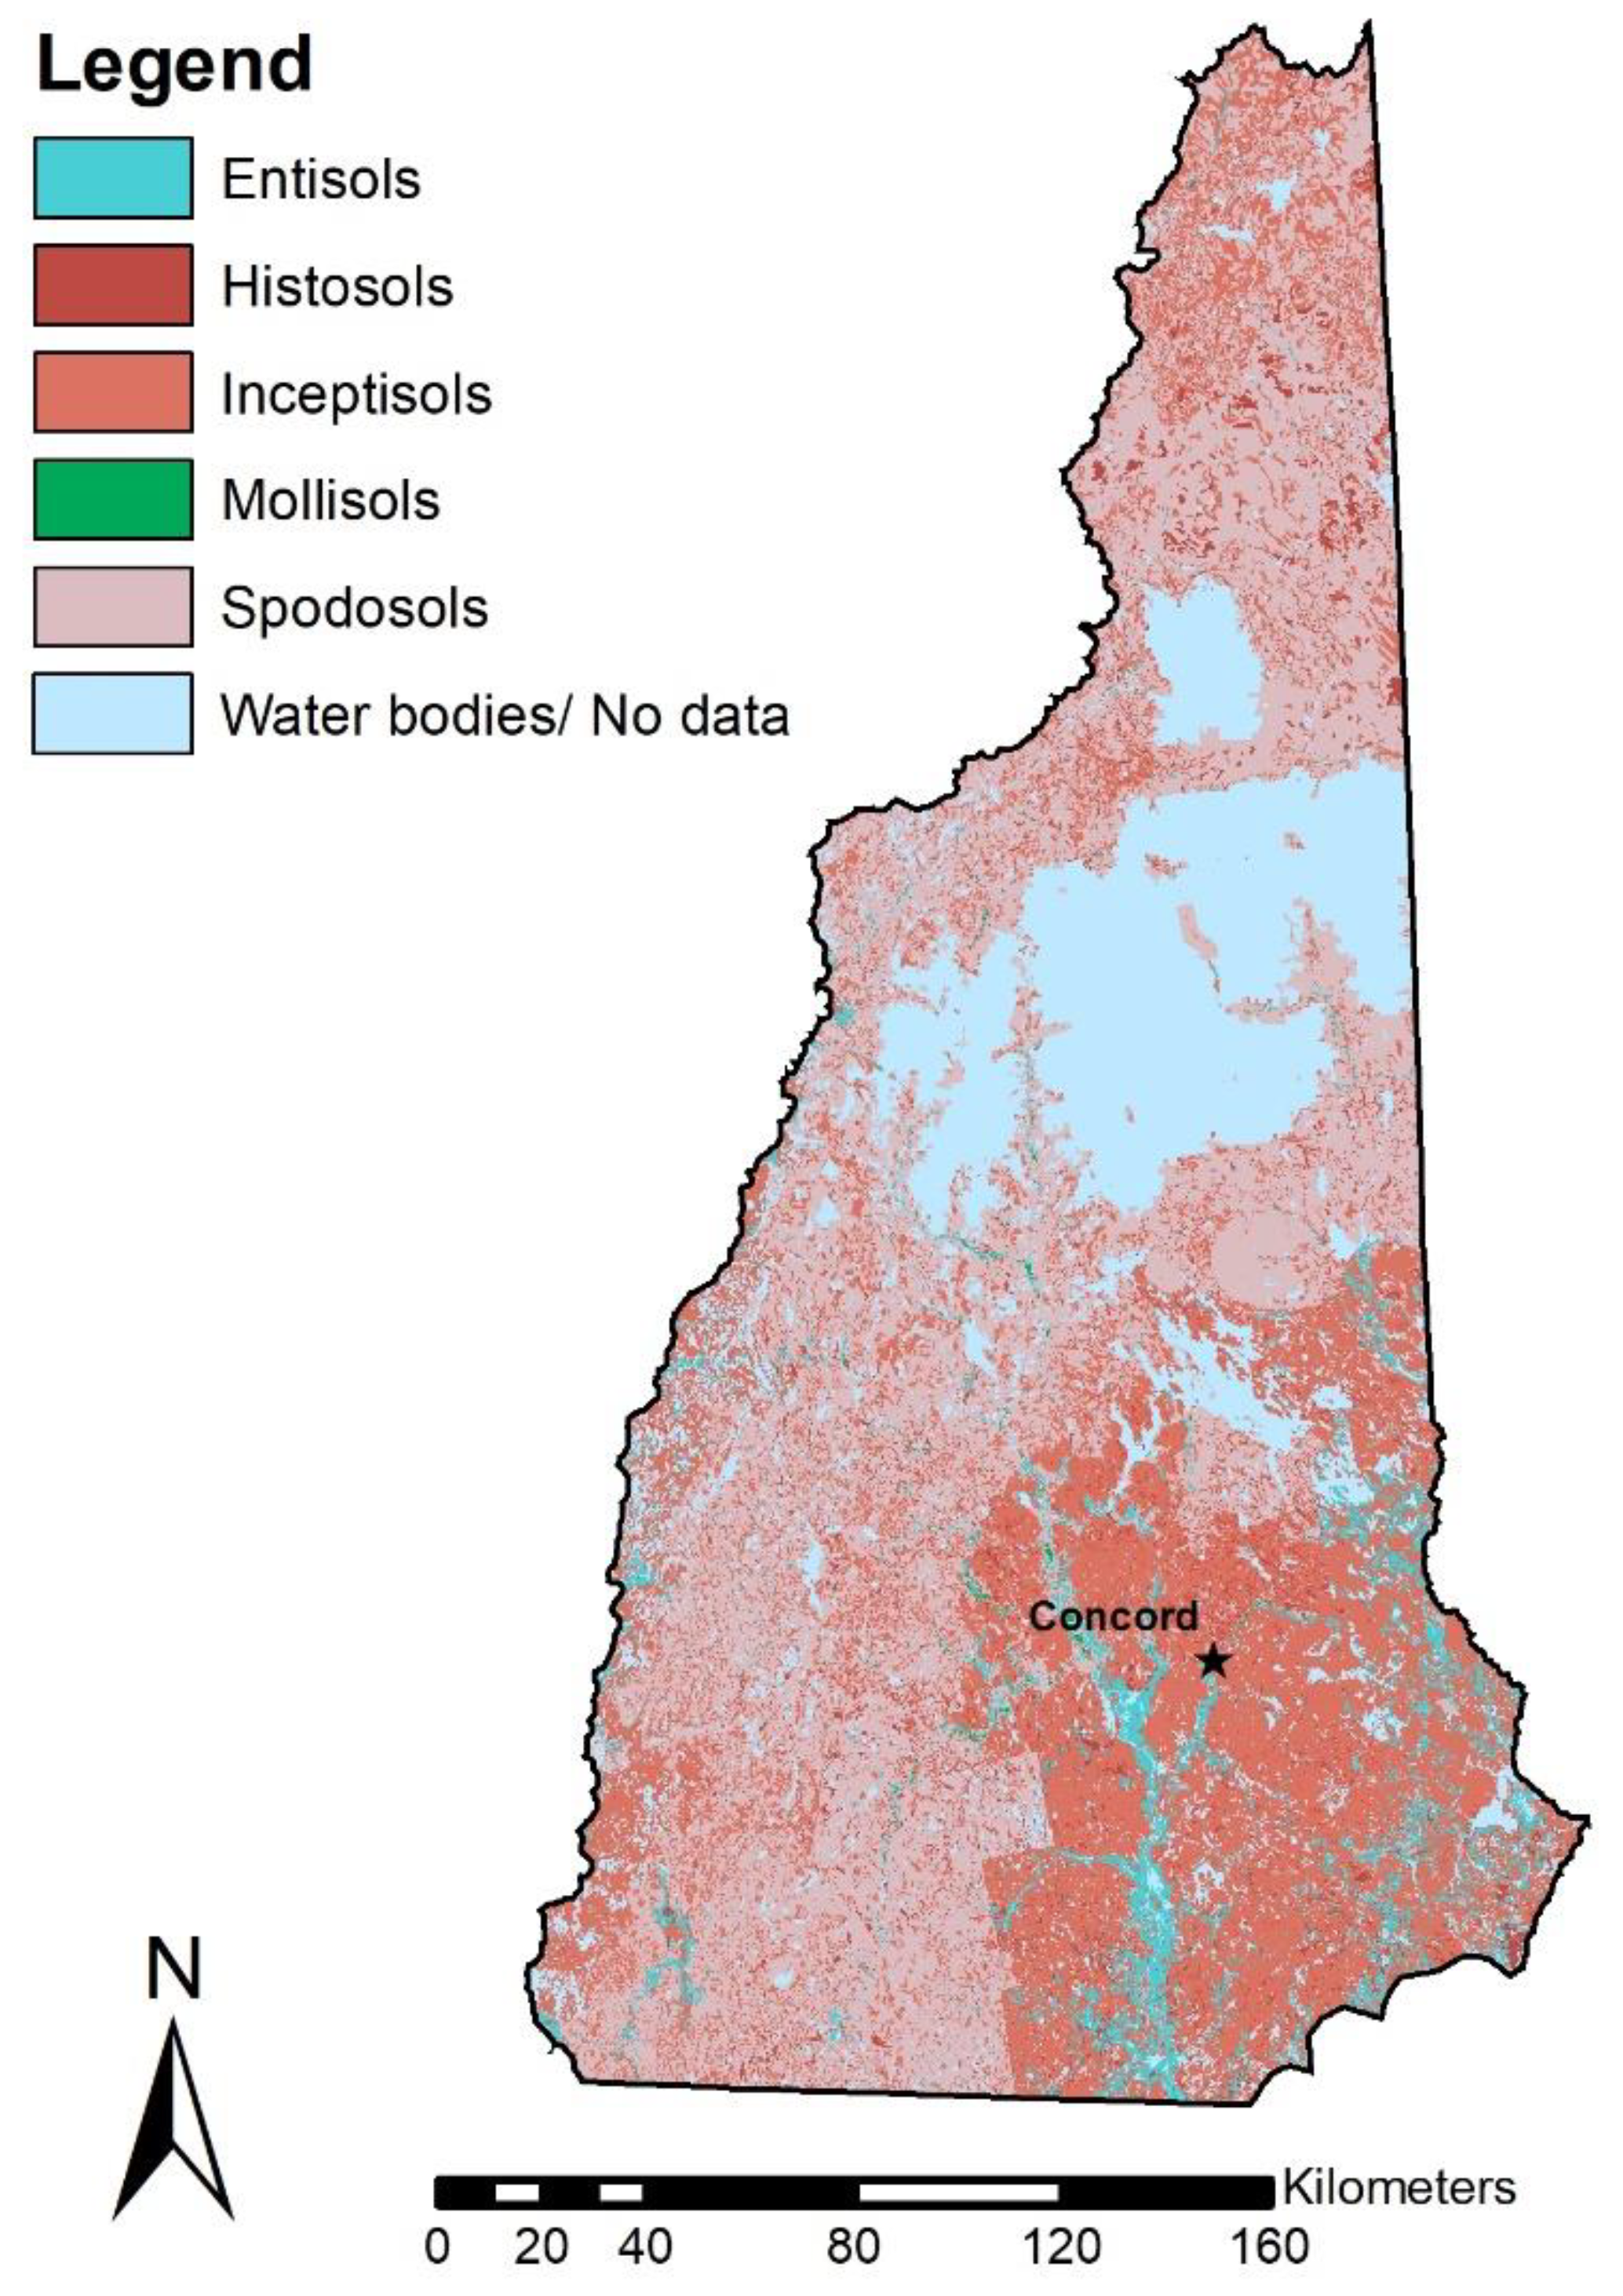
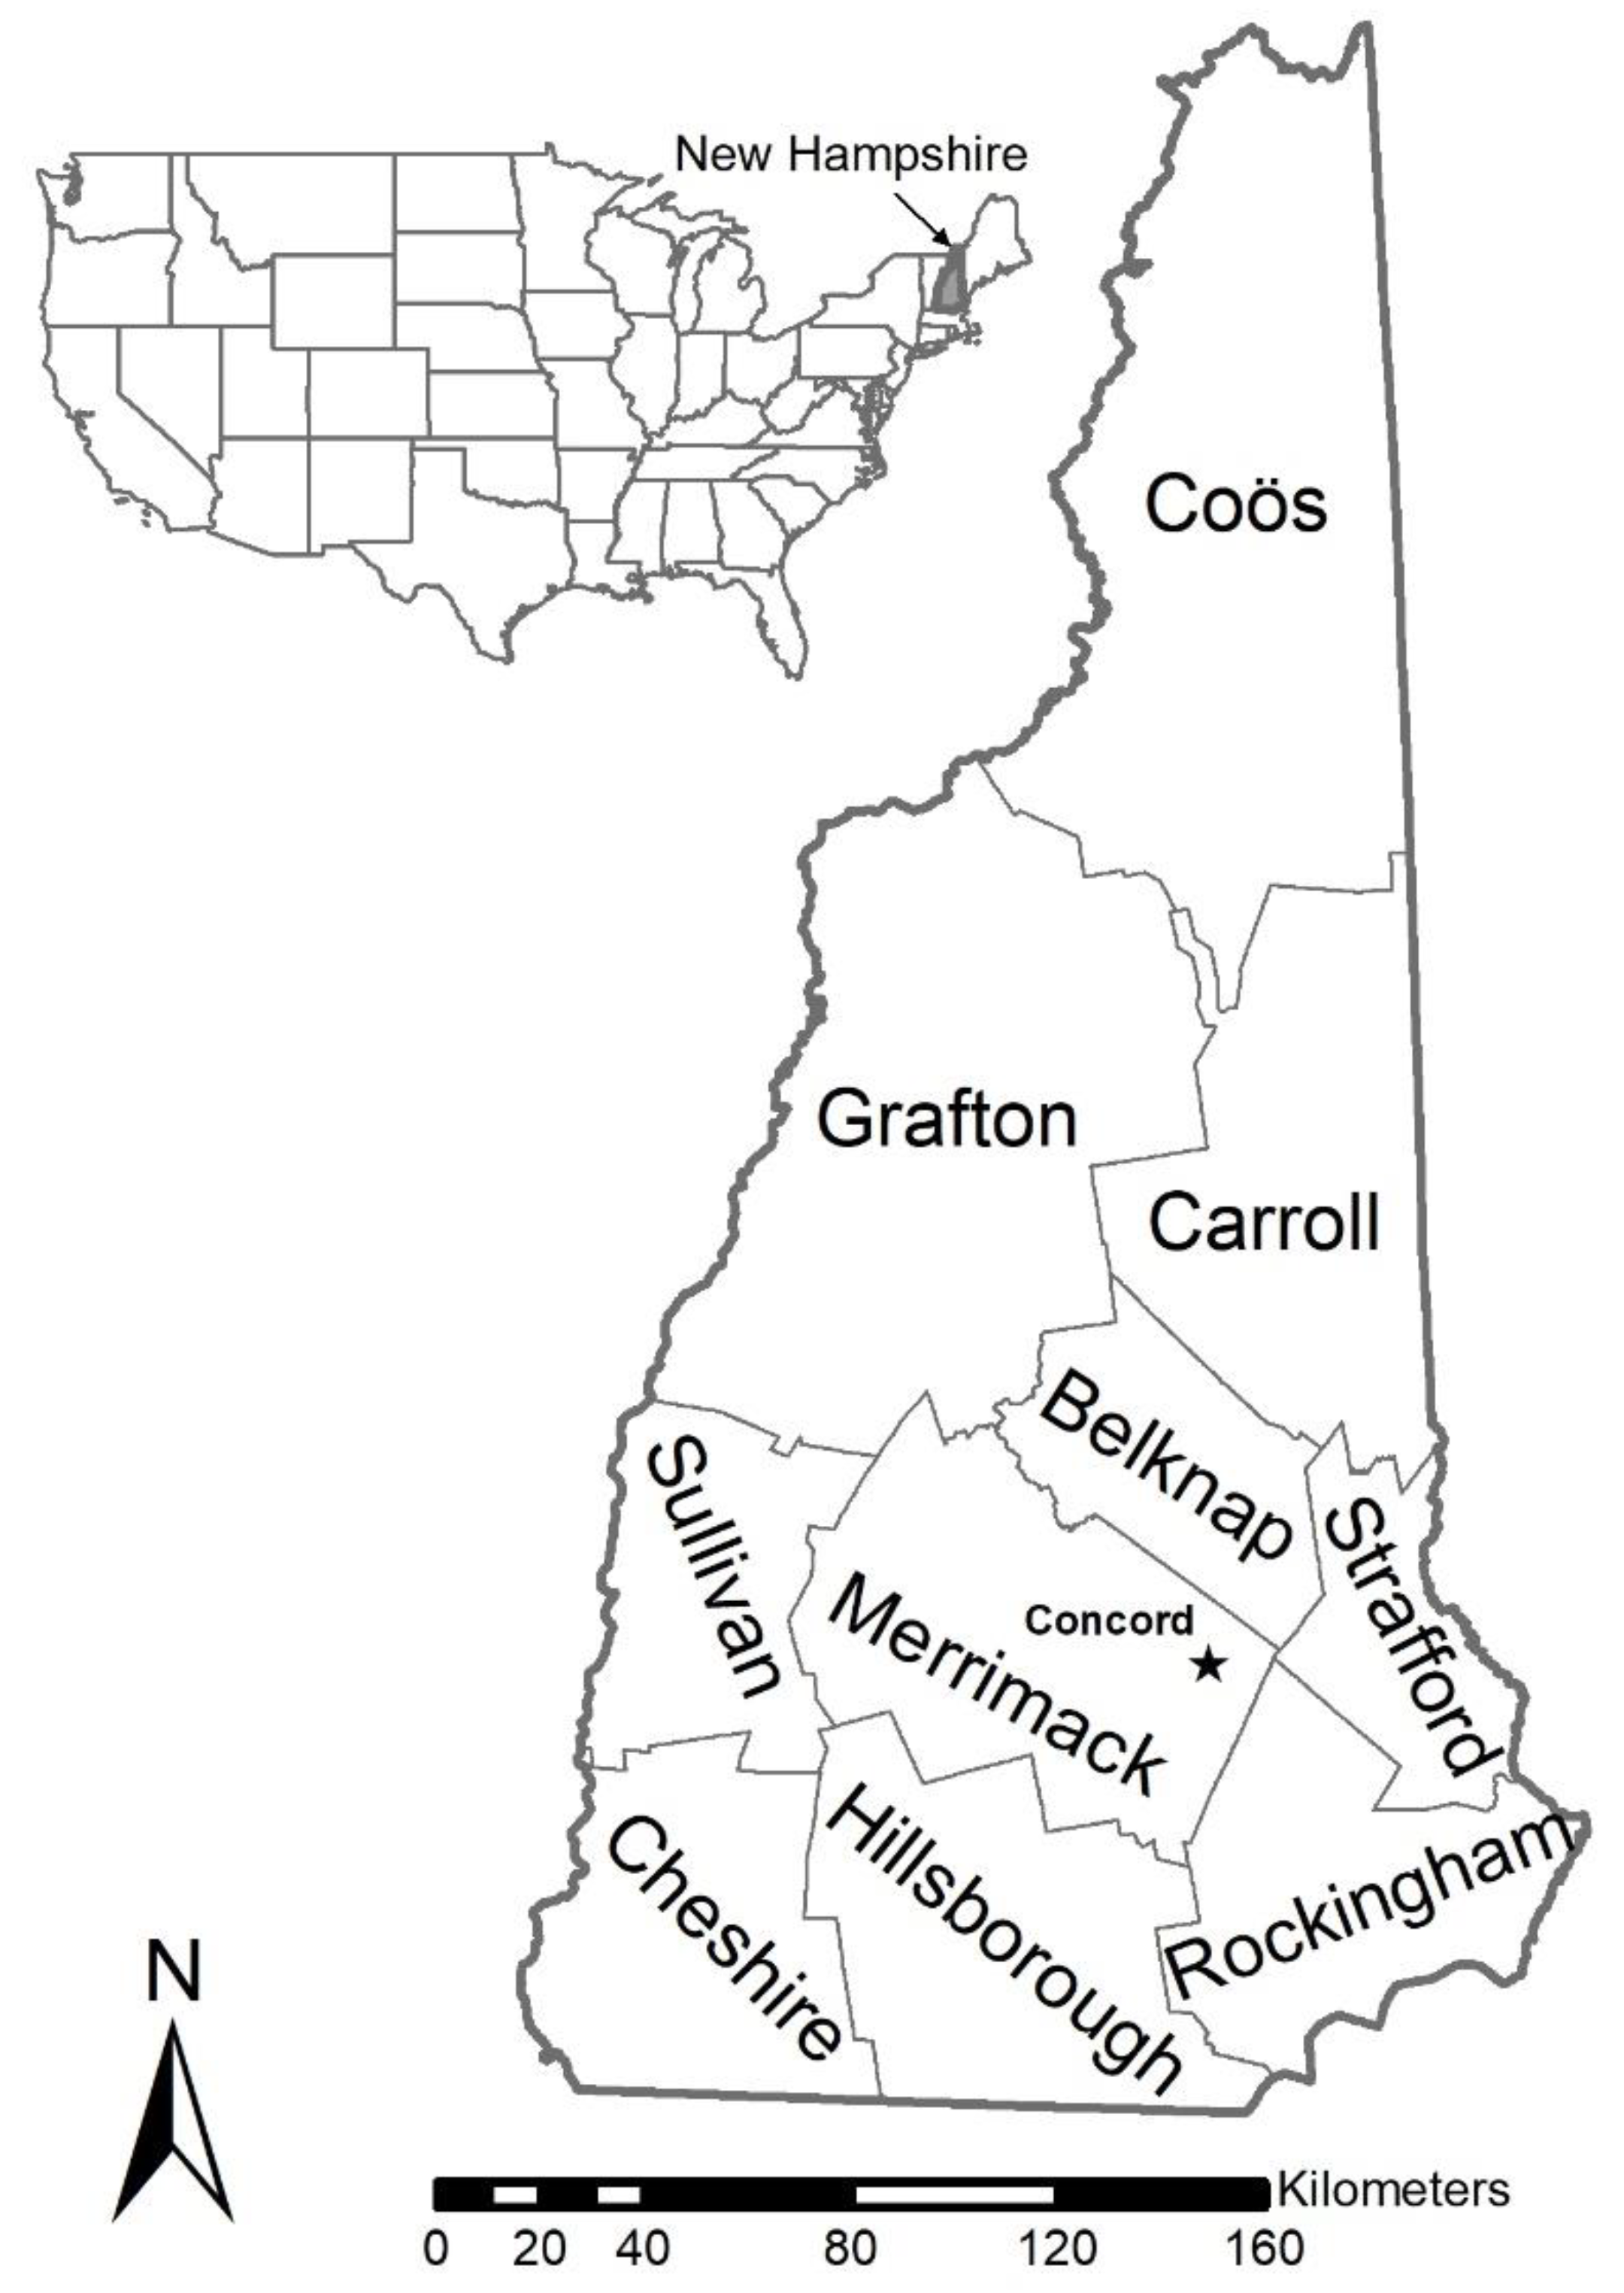
| County | Total Area (km2) | Degree of Weathering and Soil Development | ||||
|---|---|---|---|---|---|---|
| Slight | Moderate | Strong | ||||
| Entisols | Inceptisols | Histosols | Mollisols | Spodosols | ||
| Area (km2) | ||||||
| Belknap | 993.1 | 29.9 | 397.4 | 87.8 | 0 | 478.0 |
| Carroll | 1625.2 | 57.0 | 644.7 | 23.3 | 0 | 900.2 |
| Cheshire | 1785.5 | 77.7 | 799.7 | 82.8 | 0 | 825.4 |
| Coös | 3690.3 | 30.0 | 840.9 | 97.4 | 0 | 2722.0 |
| Grafton | 2857.0 | 72.9 | 802.6 | 14.8 | 0 | 1966.7 |
| Hillsborouh | 2169.6 | 192.4 | 693.4 | 272.1 | 0 | 1011.8 |
| Merrimack | 2276.5 | 166.4 | 1051.5 | 189.6 | 0 | 869.1 |
| Rockinghm | 1631.6 | 136.6 | 793.3 | 584.5 | 0 | 117.2 |
| Strafford | 564.6 | 128.2 | 403.2 | 33.0 | 0 | 0.2 |
| Sullivan | 1276.0 | 45.1 | 317.3 | 20.2 | 2.9 | 890.5 |
| Totals | 18869.5 | 936.1 | 6744.0 | 1405.6 | 2.9 | 9780.9 |
| Soil Order | SOC Content | SIC Content | TSC Content | SOC Value | SIC Value | TSC Value |
|---|---|---|---|---|---|---|
| Minimum—Midpoint—Maximum Values | Midpoint Values | |||||
| (kg m−2) | (kg m−2) | (kg m−2) | ($ m−2) | ($ m−2) | ($ m−2) | |
| Slightly Weathered | ||||||
| Entisols | 1.8–8.0–15.8 | 1.9–4.8–8.4 | 3.7–12.8–24.2 | 1.35 | 0.82 | 2.17 |
| Inceptisols | 2.8–8.9–17.4 | 2.5–5.1–8.4 | 5.3–14.0–25.8 | 1.50 | 0.86 | 2.36 |
| Histosols | 63.9–140.1–243.9 | 0.6–2.4–5.0 | 64.5–142.5–248.9 | 23.62 | 0.41 | 24.03 |
| Moderately Weathered | ||||||
| Mollisols | 5.9–13.5–22.8 | 4.9–11.5–19.7 | 10.8–25.0–42.5 | 2.28 | 1.93 | 4.21 |
| Strongly Weathered | ||||||
| Spodosols | 2.9–12.3–25.5 | 0.2–0.6–1.1 | 3.1–12.9–26.6 | 2.07 | 0.10 | 2.17 |


| NLCD Land Cover Classes (LULC) | 2016 Total Area by LULC (km2) | Degree of Weathering and Soil Development | ||||
|---|---|---|---|---|---|---|
| Slight | Moderate | Strong | ||||
| Entisols | Inceptisols | Histosols | Mollisols | Spodosols | ||
| 2016 Area by Soil Order, km2 (Change in Area, 2001–2016, %) | ||||||
| Barren land | 80 | 25.3 (−6.8%) | 21.3 (−4.5%) | 4.2 (−5.6%) | 0.0 (5.1%) | 29.2 (−0.1%) |
| Woody wetlands | 1354 | 83.9 (−0.2%) | 494.8 (0.4%) | 452.7 (2.3%) | 0.2 (−1.1%) | 322.0 (0.4%) |
| Shrub/Scrub | 710 | 12.6 (89.9%) | 198.7 (218.1%) | 22.5 (219.0%) | 0.0 (−25.6%) | 476.1 (322.0%) |
| Mixed forest | 6506 | 146.4 (−3.2%) | 2362.8 (−2.0%) | 343.3 (−2.0%) | 0.2 (−6.0%) | 3653.7 (−1.5%) |
| Deciduous forest | 4022 | 67.6 (−5.8%) | 1277.0 (−6.0%) | 150.4 (−9.5%) | 0.3 (−10.2%) | 2526.9 (−8.4%) |
| Herbaceous | 249 | 13.9 (20.4%) | 89.7 (25.1%) | 12.9 (45.3%) | 0.1 (1030.4%) | 132.6 (−0.9%) |
| Evergreen forest | 3368 | 174.2 (−6.9%) | 1204.3 (−4.6%) | 194.2 (−5.4%) | 0.5 (−6.6%) | 1794.7 (−3.7%) |
| Emergent herbaceous wetlands | 122 | 8.4 (−3.1%) | 33.3 (−3.2%) | 65.4 (−6.2%) | 0.0 (8.5%) | 14.9 (−4.4%) |
| Hay/Pasture | 628 | 56.2 (−7.6%) | 327.2 (−5.1%) | 15.8 (−10.7%) | 0.6 (−8.6%) | 228.5 (−5.6%) |
| Cultivated crops | 61 | 20.3 (2.3%) | 32.9 (3.1%) | 0.6 (−14.0%) | 0.3 (17.4%) | 6.8 (6.6%) |
| Developed, open space | 884 | 83.9 (4.1%) | 356.1 (5.5%) | 66.0 (14.3%) | 0.2 (−6.1%) | 377.4 (1.0%) |
| Developed, medium intensity | 275 | 95.9 (9.3%) | 102.4 (14.6%) | 22.4 (16.3%) | 0.1 (14.9%) | 53.9 (10.6%) |
| Developed, low intensity | 542 | 110.0 (4.4%) | 225.5 (8.5%) | 52.8 (14.0%) | 0.2 (−0.2%) | 153.8 (2.9%) |
| Developed, high intensity | 68 | 37.6 (13.2%) | 18.1 (32.5%) | 2.3 (36.8%) | 0.1 (164.9%) | 10.4 (17.3%) |
| Soil Regulating Ecosystem Services in the State of New Hampshire | ||||
| Degree of Weathering and Soil Development | ||||
| Slight 48% | Moderate <0.02% | Strong 52% | ||
| Entisols 5% | Inceptisols 36% | Histosols 7% | Mollisols <0.02% | Spodosols 52% |
 |  |  |  |  |
| Social cost of soil organic carbon (SOC): $64.8B | ||||
| $1.3B | $10.1B | $33.2B | $6.6M | $20.2B |
| 2% | 16% | 51% | <0.02% | 31% |
| Social cost of soil inorganic carbon (SIC):$8.1B | ||||
| $767.6M | $5.8B | $576.3M | $5.6M | $978.1M |
| 9% | 71% | 7% | <0.1% | 12% |
| Social cost of total soil carbon (TSC): $73.0B | ||||
| $2.0B | $15.9B | $33.8B | $12.2M | $21.2B |
| 3% | 22% | 46% | <0.02% | 29% |
| Sensitivity to climate change | ||||
| Low | Low | High | High | Low |
| SOC and SIC sequestration (recarbonization) potential | ||||
| Low | Low | Low | Low | Low |
| NLCD Land Cover Classes (LULC) | Degree of Weathering and Soil Development | ||||
|---|---|---|---|---|---|
| Slight | Moderate | Strong | |||
| Entisols | Inceptisols | Histosols | Mollisols | Spodosols | |
| Area Change, km2 (SC-CO2, $=USD) | |||||
| Developed, open space | 3.3 ($7.2M) | 18.7 ($44.2M) | 8.3 ($198.4M) | - | 3.7 ($7.9M) |
| Developed, medium intensity | 8.2 ($17.8M) | 13.0 ($30.7M) | 3.1 ($75.3M) | 0.02 ($80,000) | 5.2 ($11.2M) |
| Developed, low intensity | 4.6 ($10.0M) | 17.7 ($41.7M) | 6.5 ($155.9M) | - | 4.3 ($9.3M) |
| Developed, high intensity | 4.4 ($9.5M) | 4.4 ($10.5M) | 0.6 ($14.9M) | 0.06 ($242,000) | 1.5 ($3.3M) |
| Totals | 20.5 ($44.5M) | 53.8 ($127.0M) | 18.5 ($444.5M) | 0.08 ($322,000) | 14.6 ($31.8M) |

Publisher’s Note: MDPI stays neutral with regard to jurisdictional claims in published maps and institutional affiliations. |
© 2021 by the authors. Licensee MDPI, Basel, Switzerland. This article is an open access article distributed under the terms and conditions of the Creative Commons Attribution (CC BY) license (https://creativecommons.org/licenses/by/4.0/).
Share and Cite
Mikhailova, E.A.; Lin, L.; Hao, Z.; Zurqani, H.A.; Post, C.J.; Schlautman, M.A.; Post, G.C. Vulnerability of Soil Carbon Regulating Ecosystem Services due to Land Cover Change in the State of New Hampshire, USA. Earth 2021, 2, 208-224. https://0-doi-org.brum.beds.ac.uk/10.3390/earth2020013
Mikhailova EA, Lin L, Hao Z, Zurqani HA, Post CJ, Schlautman MA, Post GC. Vulnerability of Soil Carbon Regulating Ecosystem Services due to Land Cover Change in the State of New Hampshire, USA. Earth. 2021; 2(2):208-224. https://0-doi-org.brum.beds.ac.uk/10.3390/earth2020013
Chicago/Turabian StyleMikhailova, Elena A., Lili Lin, Zhenbang Hao, Hamdi A. Zurqani, Christopher J. Post, Mark A. Schlautman, and Gregory C. Post. 2021. "Vulnerability of Soil Carbon Regulating Ecosystem Services due to Land Cover Change in the State of New Hampshire, USA" Earth 2, no. 2: 208-224. https://0-doi-org.brum.beds.ac.uk/10.3390/earth2020013