
Mapping European Rice Paddy Fields Using Yearly Sequences of Spaceborne Radar Reflectivity: A Case Study in Italy


1
Department of Electrical, Computer and Biomedical Engineering, University of Pavia, 27100 Pavia, Italy
2
CNIT, Pavia Unit, Department of Electrical, Computer, Biomedical Engineering, University of Pavia, 27100 Pavia, Italy
*
Author to whom correspondence should be addressed.
†
F. Dell’Acqua is also with Ticinum Aerospace, a spin-off Company of the University of Pavia, Italy.
Earth 2021, 2(3), 387-404; https://0-doi-org.brum.beds.ac.uk/10.3390/earth2030023
Submission received: 20 May 2021
/
Revised: 18 June 2021
/
Accepted: 26 June 2021
/
Published: 2 July 2021
Abstract
:Although a vast literature exists on satellite-based mapping of rice paddy fields in Asia, where most of the global production takes place, little has been produced so far that focuses on the European context. Detection and mapping methods that work well in the Asian context will not offer the same performance in Europe, where different seasonal cycles, environmental contexts, and rice varieties make distinctive features dissimilar to the Asian case. In this context, water management is a key clue; watering practices are distinctive for rice with respect to other crops, and within rice there exist diverse cultivation practices including organic and non-organic approaches. In this paper, we focus on satellite-observed water management to identify rice paddy fields cultivated with a traditional agricultural approach. Building on established research results, and guided by the output of experiments on real-world cases, a new method for analyzing time-series of Sentinel-1 data has been developed, which can identify traditional rice fields with a high degree of reliability. Typical watering practices for traditional rice cultivation leave distinctive marks on the yearly sequence of spaceborne radar reflectivity that are identified by the proposed classifier. The method is tested on a small sample of rice paddy fields, built by direct collection of ground reference information. Automated setting of parameters was sufficient to achieve accuracy values beyond 90%, and scanning of a range of values led to touch full score on an independent test set. This work is a part of a broader initiative to build space-based tools for collecting additional pieces of evidence to support food chain traceability; the whole system will consider various parameters, whose analysis procedures are still at their early stages of development.
1. Introduction
1.1. Space-Based Mapping of Rice
At the global level, rice paddy fields account for about 12% of global cropland area and provide staple food to roughly half the Earth population [1]. Actually, rice provides more calories for human consumption than any other cereal crop [2]. Moreover, water demand and sequestration [3] plus methane emissions [4,5] from such fields generate a remarkable impact on the overall environmental balance. Most rice production takes place in Asia [1], hence the majority of scientific results in space-based mapping of rice paddy fields focus on Asian contexts, including both lowlands [6], highlands [7] and mixed areas [8], warmer [9,10] and colder climates [11]. Spaceborne remote sensing is used even for estimating the transplantation period [12], time trends [11], crop height [13] and phenology monitoring [14]. Significantly less research results are reported on average regarding the European context, although some more papers have started to appear in recent years, addressing e.g., phenology-based mapping [15], time-series-based classification [16], growth monitoring [17]. Given the different weights and contexts, however, the priorities are different. Asian rice production has a significant role in the overall energy, environmental and food budgets, thus large-scale mapping and monitoring is the prevailing topic; European rice lacks such impact, and the emphasis is placed on more detailed assessment of rice characteristics. In this context, a theme worth developing is water management monitoring based on spaceborne radar data.
1.2. Detecting Field Flooding with Radar Acquisitions
There exists an increasing trend in availability of spaceborne synthetic aperture data under free and open terms, including Sentinel-1 since 2014, Radarsat Constellation Mission (RCM) [18] since 2019, etc. Earth Observation (EO) radar is particularly suitable to detect and outline water bodies and water cover [19], so dense series of Synthetic Aperture Radar (SAR) acquisitions can lead to detailed monitoring of flooding and drying of rice paddy fields. Water management practices come in a broad variety, and convey significant information about the rice crops they refer to [20]. Greenhouse gas emission [21], water demand [22], and even pollutant concentration [23] are just examples of parameters that can be significantly impacted by the selection of water management approach to be used.
1.3. Flood Mapping and Organic Agriculture
Organic practices in rice growing [24] are steadily expanding in Europe. Organic practices require specific water management criteria [25], hence water management information can convey additional benefits. Such information can generate additional traceability information, which is a valuable component of organic food appeal as it contributes to reassuring the consumer on the reliability of the organic status declaration. In addition to water management, several parameters exist that are visible from space and can add to food traceability; a few have already been identified [26,27]. Moreover, space-based remote sensing can provide precious support to organic farmers; organic crops are far more vulnerable than traditional ones to the emergence of weeds and pests, and to various other types of risk. Keeping crops constantly monitored from space, thanks also to the Copernicus open-data policy, possibly integrated by in-situ sensors [28], can effectively help farmers to keep their delicate crops healthy and their fields productive. To the best of our knowledge, no specific investigation has been carried out yet on the matter, before our early publications [26,27]. Albeit complex, the problem may be opening up a new application sector for research on spaceborne EO. In this context, this paper will focus on mapping of European rice using dense sequences of SAR data. The paper is organized as follows: the next chapter introduces the specific issue of monitoring water management in rice paddy fields; Section 3 outlines the reference state of the art in detection of water from radar acquisitions on areas partly covered with vegetation, and justifies some of the choices made in the later development; Section 4 describes the study area and its features. Next, Section 5 reports on the development of the method, steered by the partial results obtained in preliminary tests, whereas Section 6 offers some results and a related discussion. Finally, Section 7 draws some preliminary conclusions on the work done so far and outlines a way forward.
2. Focus on Water
As previously mentioned, water management is an important piece of information in terms of food traceability. The moments in time when inflow and outflow of water from the paddy field chamber takes place may vary significantly for different cultivation practices; hence, by analyzing the presence of water as a function of time in a field, a clue can be generated about the practice being implemented. This task is made complex by the existence of a wide range of different cultivation practices, especially when organic rice is concerned; such patterns are practically all weather-dependent in one way or the other, which results into complex patterns of flooding and drying. Hence, a simple approach for rice mapping consisting of identifying areas of low backscatter at a specific time of year will not work well in this context [29] However, the problem can be simplified by focusing on standard cultivation practices (i.e., non-organic) and consequently standard watering patterns. The authors have previously made a preliminary investigation [30] using public available databases and a statistical approach; in the present paper, ground truth data were sourced from volunteer farmers or from direct inspection, and the investigation zooms into the details of the temporal trend. In terms of satellite data analysis, this is a multitemporal water mapping problem. An investigation on the state of the art in flooded vegetation detection with radar data has been consequently carried out. Radar sensing is the natural choice for mapping inner water bodies in general, as these latter usually generate distinctive features in radar reflectivity maps due to the low backscatter level of mirror-reflecting, calm water surfaces. Moreover, for this specific application, radar sensors offer an additional advantage over optical sensors thanks to their insensitivity to weather conditions [31]; this means that cloud cover and haze, both frequent phenomena in rice-producing areas including Northern Italy, will not interfere with data acquisition. However, emerging rice and weed may complicate the matter and require more specific analysis. In this paper, we describe how we developed a method for identifying Italian rice paddy fields managed with a traditional approach leveraging spaceborne radar data. Ground truth data were offered by volunteer farmers in North-Western Italy.
3. State of the Art in Flooded Vegetation Detection
The first round of review of the state of the art in rice crops monitoring and mapping revealed that most scientific papers published so far focuses on South-Eastern Asia, where most of global rice production takes place. Cultivation practices in such region are different from European practices for cultural, environmental and climatic reasons, and simple re-use of methods is not viable [32,33,34]. Still, interesting clues were collected towards a method suitable for European domestic rice, as outlined in the following. Remote sensing data can help monitor the ground surface of crops at a large scale by providing precise and timely information on the phenological status and development of vegetation [35,36,37,38]. In particular, several studies have been conducted on the use of remote sensing data when monitoring rice paddy fields [39,40]. The data used by these studies define three broad categories: optical-based, Synthetic Aperture Radar (SAR)-based and data-fusion-based (optical plus radar and/or ancillary data sources, e.g., weather stations and other sensors).
A common method to map rice fields takes advantage of decision trees and/or random forest classifiers with different input features [41,42,43,44,45], relying only on SAR backscatter time-series. In this type of methodology, classification is performed by a simple phenology-based decision tree. Another common approach for mapping rice fields relies on histograms [46,47,48]. In particular, histogram modes are used to identify surface water by selecting a radiometric threshold. In a post-flood event image, indeed, as with generally in any scene with flooded and non-flooded areas next to each other, the distribution of values tends to be bimodal. This makes water detection easier as the two histogram modes generally represent water and non-water pixels, respectively. Normally, threshold values are set at the local minimum between the two modes of the histogram polynomial fitting curve. Despite their effectiveness in binary mapping, especially where radar acquisition is carried out at the right time of year, these methods output a single-date rice map, lacking the temporal information which is needed in our case.
Another widely used rice mapping approach is based on polarimetry, which may provide clues on the actual scattering mechanism taking place in each field. Fully polarimetric SAR data permit analysis of the double-bounce enhancement due to still water in flooded agricultural fields [33,49,50,51]. Once the coherence and covariance matrices are derived from the polarimetric dataset, decompositions such as the Freeman and eigenvector can be applied to derive meaningful information on the scattering process.
4. Study Area and Data
4.1. Study Area and Ground Reference Data
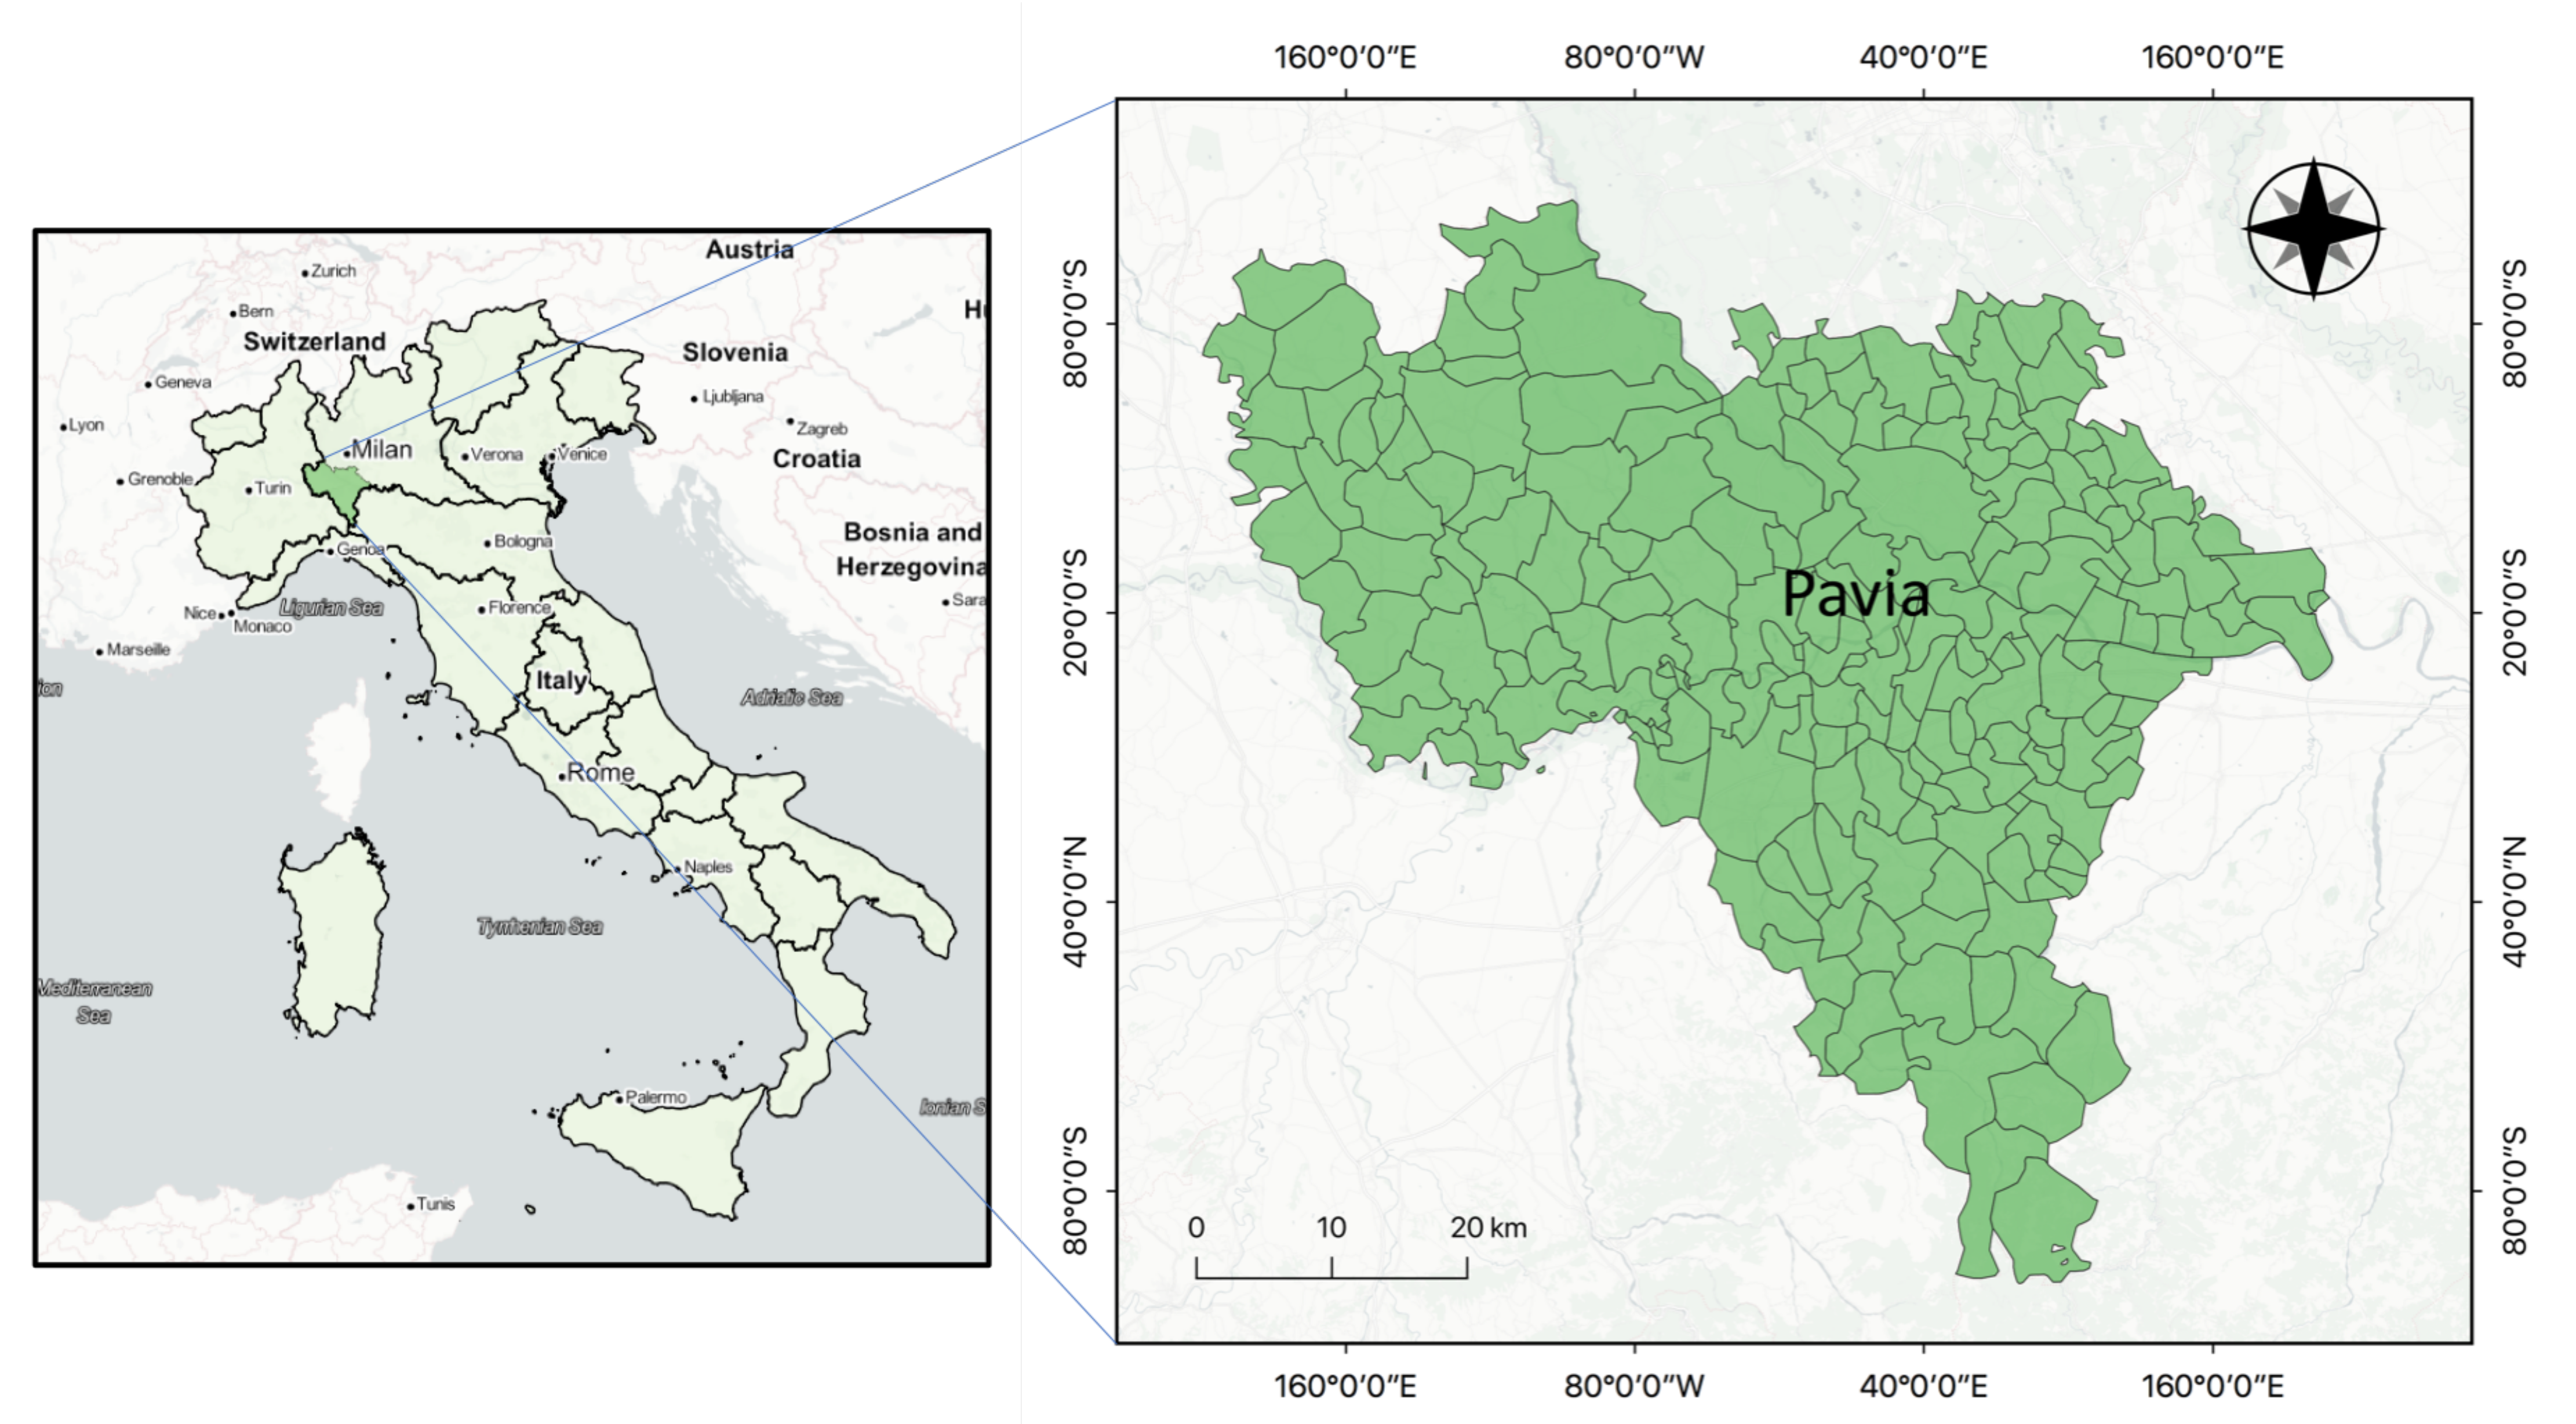
Among all EU countries, Italy is the biggest rice producer, covering more than 53% of the entire rice-cultivated European area; also, Italy exports more than 45% in weight of its domestic output, thus playing a primary role in the European rice market. Although in Southern Asia yearly harvests may be multiple, the agrarian calendar for this temperate climate is characterized by a single rice cropping pattern each year. Most of the Italian rice production takes place in North-Western Italy, with the province of Pavia (see Figure 1) providing alone just above one third of the total domestic rice production [52] thanks to its 82,000 hectares of rice paddy fields. In this area, thanks to our local collaborating farmers, we were able to identify 20 rice paddy fields and define GIS polygons marking the boundaries of each field. A total of 10 more polygons were used to define non-rice fields and build counterexamples. The corresponding 30 GIS polygons were used for isolating responses from each single field, spatially averaging them within each polygon and composing the related time-series for each field. This dataset could potentially be expanded by merging in crowdsourced multitemporal information from volunteer collectors in the future [28]. The sample is small because obtaining reliable ground truth on the type of crop is a time-consuming task, which effectively limits the size of the final result. We have generated our ground truth by in-situ inspection, and by direct contact with farmers. In a previous experiment [30] we used the geographic database named DUSAF 6.0 (“Destinazione d’uso dei suoli agricoli e forestali”, 6th version), referring to year 2018 and developed by Lombardy region using AGEA orthophotos and SPOT 6/7 satellite images, publicly available on the web Geoportal of Regione Lombardia [53]. This database is extensive (hundreds of thousands of polygons), but comparison with in-situ inspection results and visual interpretation of high-resolution multispectral satellite images raised doubts about the punctual correspondence between the stated and actual crop type. The DUSAF database is still suitable for investigating on a statistical basis as in [30] but not as suitable for detailed analysis of time-series, which is the subject of this paper. In this work, ground reference parcels were individually selected based on information from participating farmers, to guarantee a flawless set of reference data for training and verification of the classification procedure. Reference data includes 30 polygons as training data (20 rice + 10 non-rice) and 49 polygons at test data (29 rice + 20 non-rice), completely disjoint from each other to avoid optimistic bias in Overall Accuracy (OA) assessment.
4.2. Satellite Data
Reviewing the scientific literature, we found that a wide variety of SAR sensors have been employed in rice mapping applications [42,49,50,54,55,56,57,58], such as COSMO-SkyMed (CSK), Sentinel-1, Radarsat-2, TerraSAR-X, PALSAR-2, etc. Notwithstanding its inability to provide fully polarimetric data, in this work we decided to take advantage of Sentinel-1 radar data. The free and open Sentinel data policy set up under the Copernicus umbrella encourages EO data users thanks to easy access and use of the data anywhere and anytime. In particular, Sentinel-1 provides freely accessible data at both temporal and spatial resolutions fully compatible with the application we intended to develop. The Sentinel-1 SAR sensor operates in band C with a central frequency of 5.405 GHz and a right-looking antenna capable of providing a radiometric accuracy within 1 dB. The acquisition incidence angle can range from 20° to 47°. Regarding the polarization modes, Sentinel-1 can provide images acquired with VV (Vertical transmit, Vertical receive) and VH (Vertical transmit, Horizontal receive) polarization in different acquisition modes: Stripmap (SM), Interferometric Wide Swath (IW), Extra-Wide Swath (EW) and Wave (WV). In this work, we used VH-polarized images, as this polarization appears to be more sensitive to the features of rice paddy fields in comparison with VV [43,58,59]. Regarding the acquisition mode, IW Ground Range Detected (GRD) images were used, as backscatter intensity is the main source of information for the proposed application.
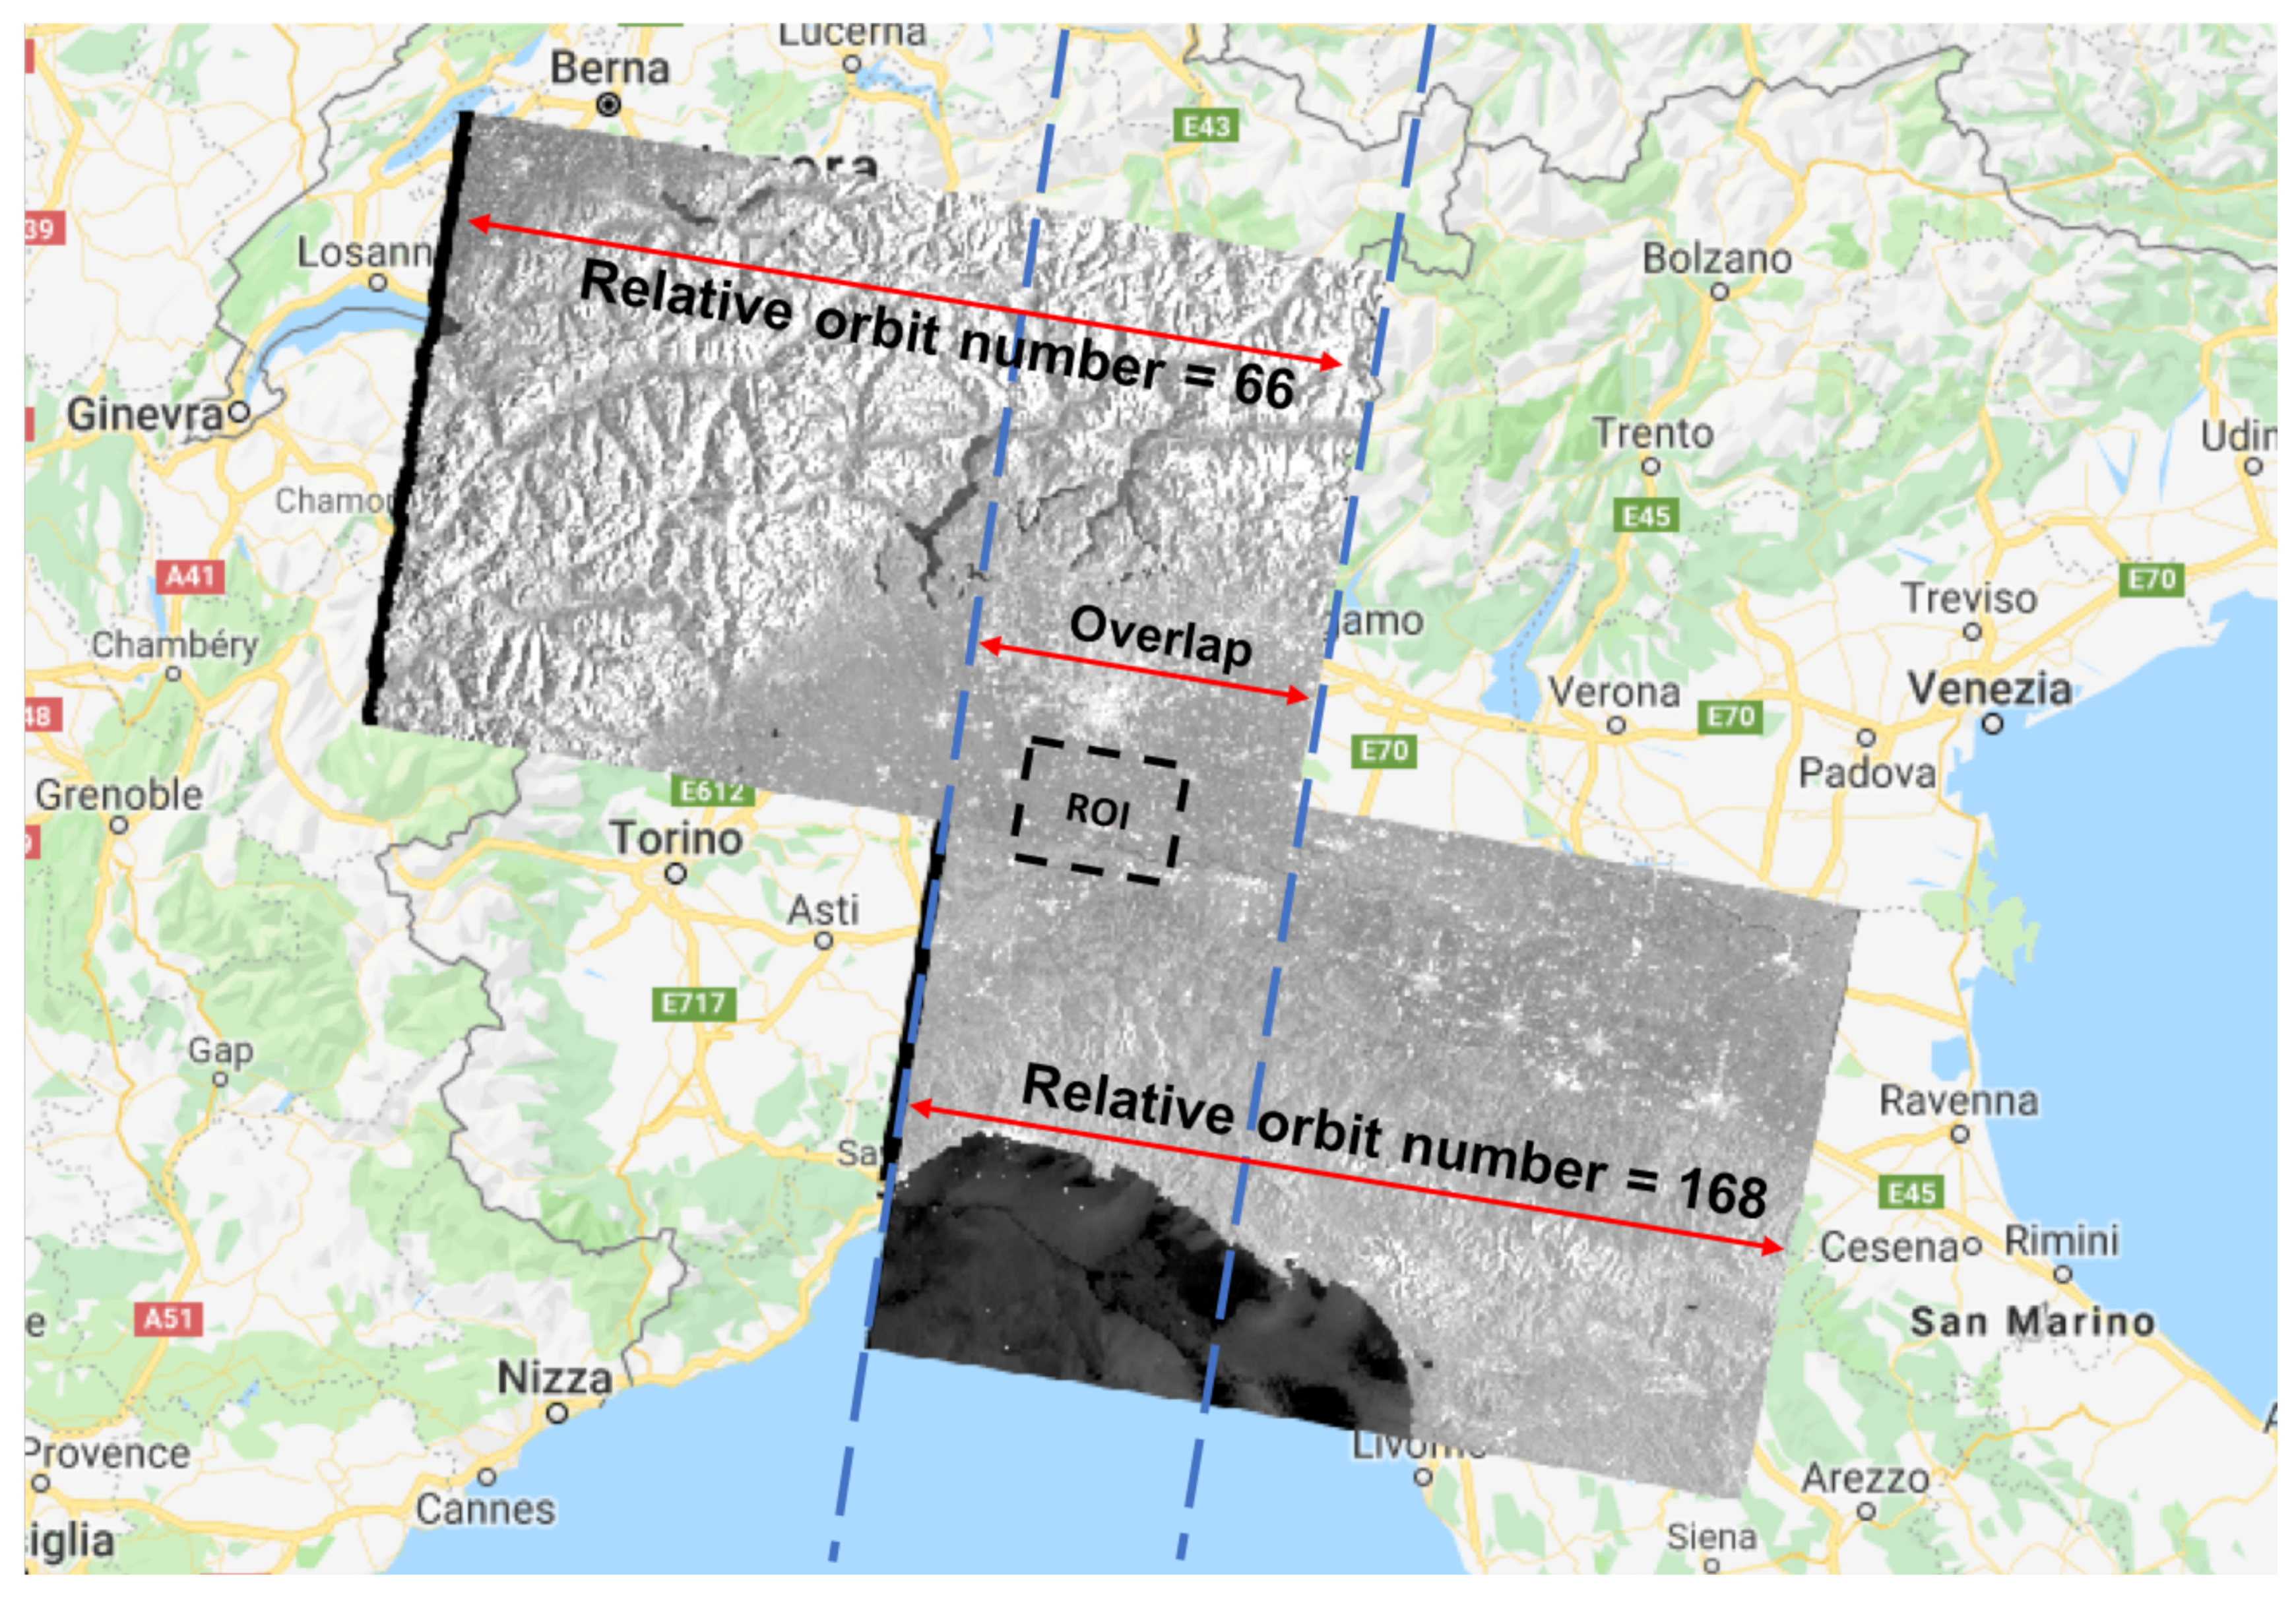
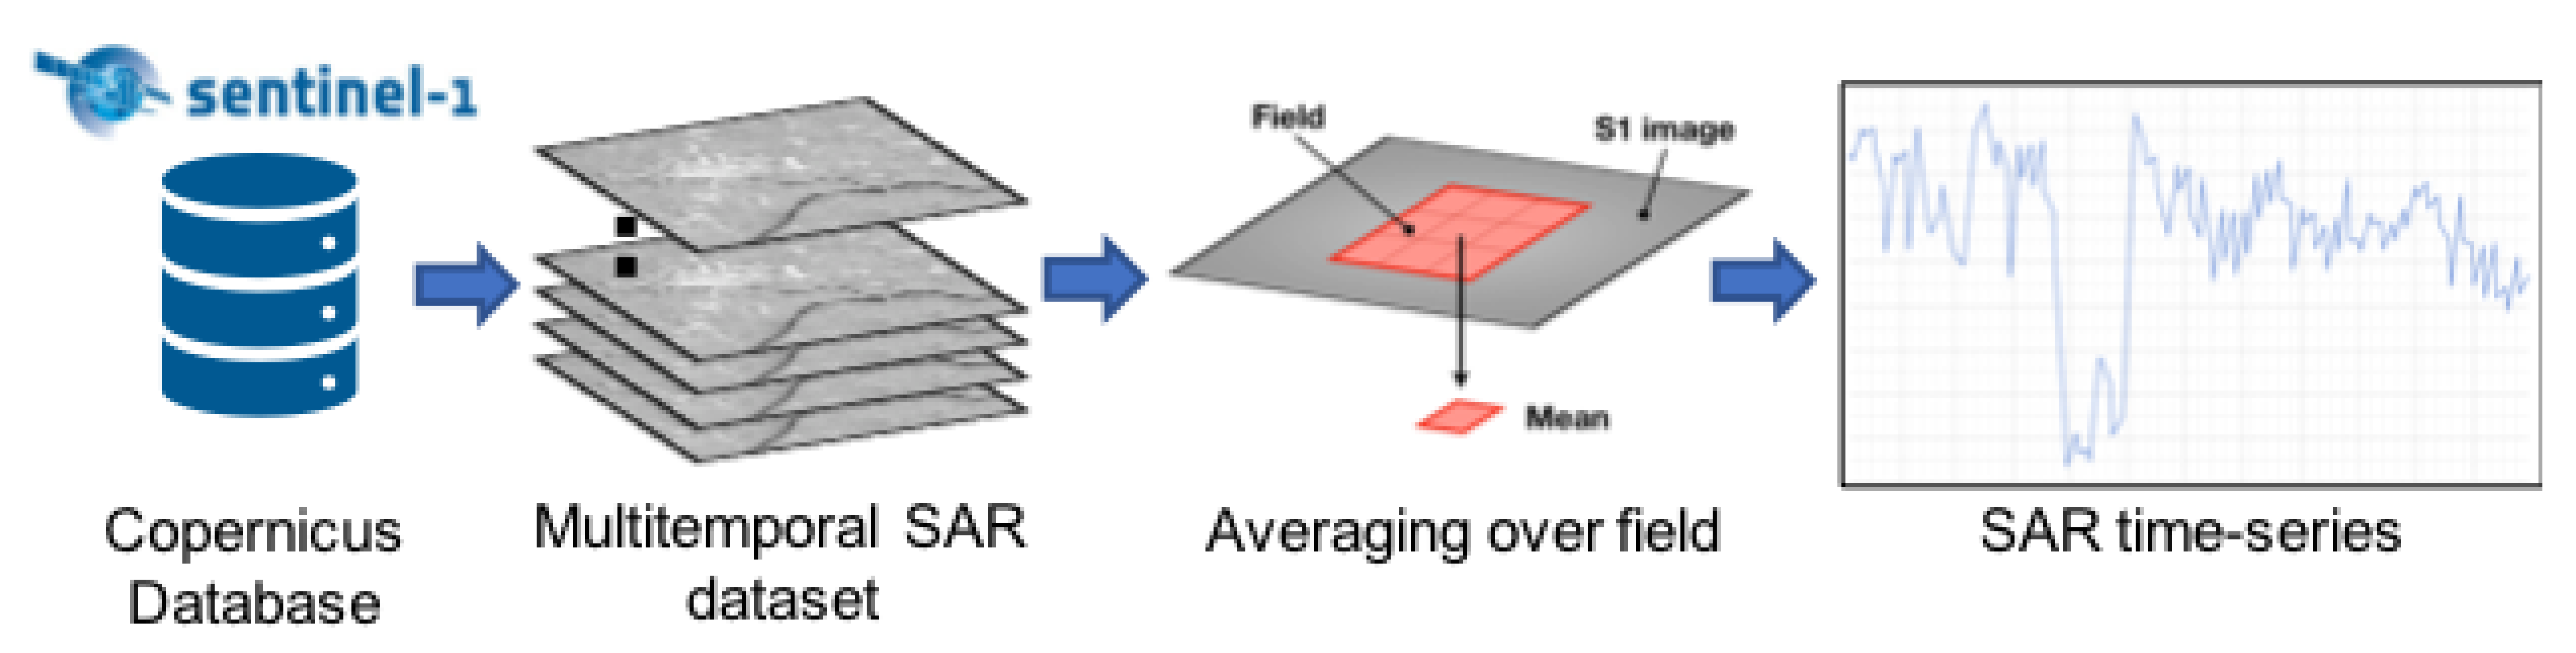
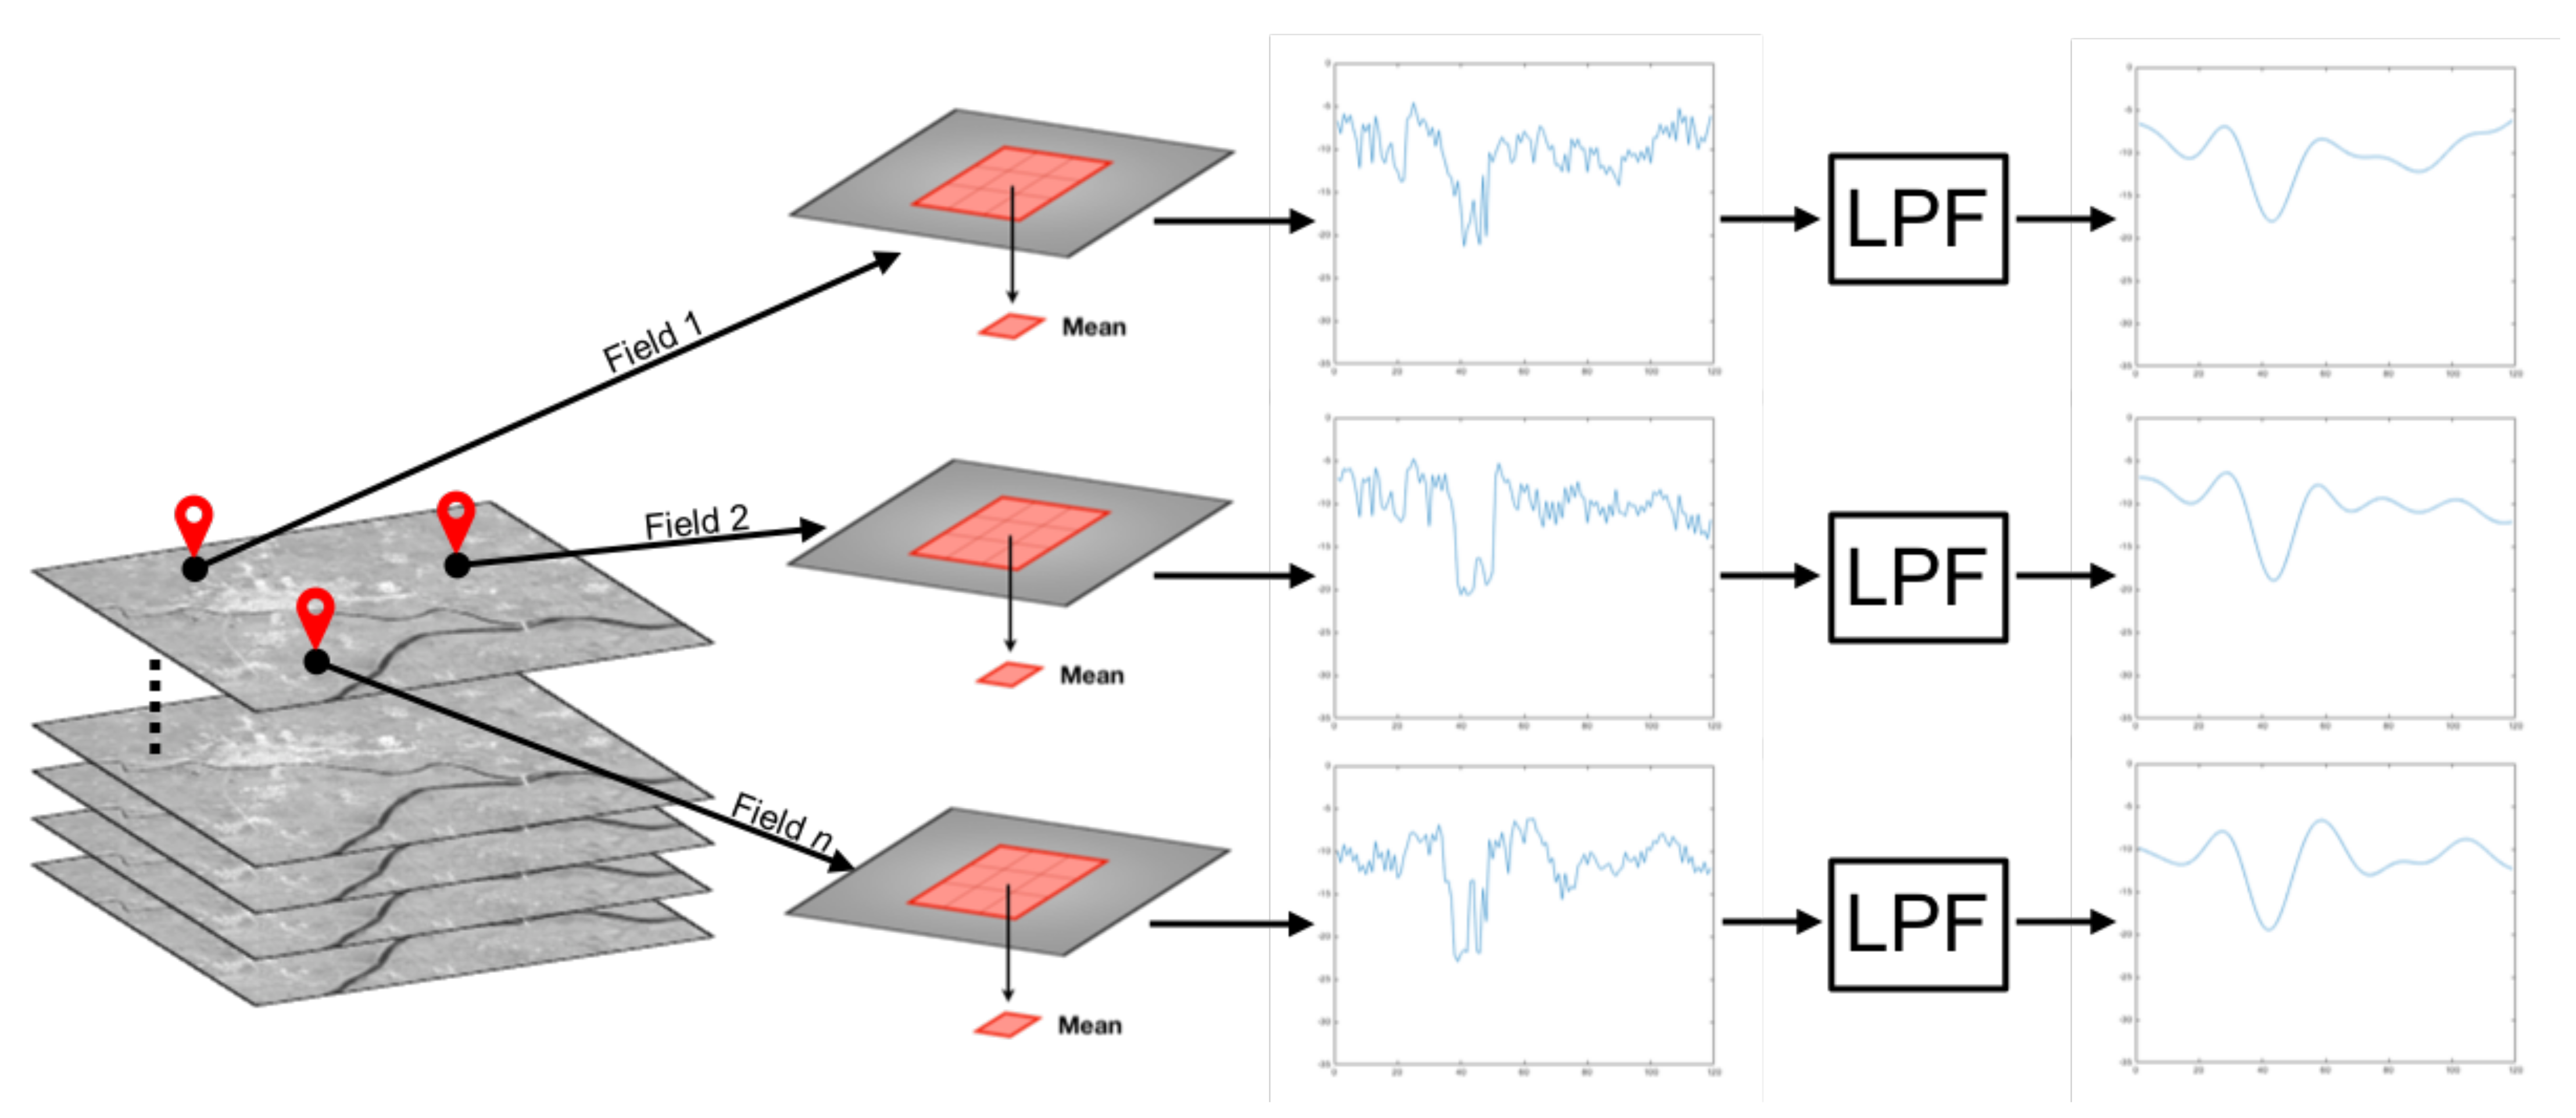
Once the multitemporal dataset covering the entire rice growing season was acquired through the ESA Copernicus Hub, SAR backscatter time-series were extracted for each single considered field. As mentioned above, each sample was computed as the average value of the Normalized Radar Cross Section over the entire field at the given date. The features of Sentinel-1 orbit and sensors at the selected acquisition mode result into yearly time-series composed of 121 samples. The large number of yearly acquisitions is due to the location of the study area, where two descending-orbit swaths of Sentinel-1A and B overlap with each other (Figure 2). The 6-day repeat cycle of a single Sentinel platform, indeed, would itself result into roughly 60 samples per year; the overlapping swaths double this latter figure, although this comes with both pros and cons. The main pro is the increased temporal frequency, whereas the main con is related to the unevenness of time intervals and acquisition parameters between adjacent samples. Time lags between adjacent samples are not evenly spaced 3-day intervals, but they rather alternate a 1-day with a 5-day interval, which adds to the complexity of the analysis. Incidence angles are also different, featuring 33° and 43° for orbit number 66 and 168, respectively. Therefore, in order to correctly use all the available measurements, a normalization of the incidence angle must be performed prior to classification. This can be accomplished using different techniques, such as the popular cosine squared normalization [60], which we applied in our research.
The time-series extraction procedure is depicted in Figure 3. Please note that for the sake of simplicity, Figure 3 does not show all the pre-processing steps applied to the downloaded images, but only those characterizing the proposed method. The classification system, described in Section 5, is entirely based on the extracted SAR time-series.
5. The Proposed Method
5.1. Selection of the Approach
As it emerged from the state of the art in Section 3, three different approaches to rice mapping using spaceborne radar data can be exploited: investigation of the scattering mechanism using polarimetric SAR dataset, use of decision trees based on the analysis of SAR time-series and flooded vegetation systems for rice mapping applications based on the analysis of histograms. Regarding the polarimetry-based approach, strong limitations to the envisaged practical use of the system would be posed by the high cost of fully polarimetric datasets and the generally scarce coverage offered by this type of data. In the case of histogram-based methodologies, issues are related to the small amount of information provided by a single SAR image. By the nature of the analysis, we intend to perform, single-date mapping is definitely not a solution, as the information relevant to us is contained in time-series of water floodings. Having considered all the above, the best choice appeared to be a rule-based classifier whose parameters were to be derived by statistical analysis of SAR time-series on rice paddy fields. The analysis must be done on local samples, as results from the previous scientific literature focusing on South-East Asian Countries are not re-usable. Most rice fields in Indonesia, for example, feature a double rice cropping pattern: planting takes place in the wet season (October to March) and also in the dry season (April to September) [61,62]. Moreover, as irrigation water is available at any time during the year, farmers can grow rice whenever convenient [59]. Consequently, parameters of the SAR series are expected to be very different in Asian and European rice paddy fields.
5.2. Prototype SAR Time-Series
The starting idea is to build a SAR time-series sample with a rice “reference” time-series, from which relevant, typical parameters can be computed. This reference time-series can be built by averaging the radar responses across a training set including multiple rice paddy fields. Such time-series is assumed to represent a “prototype” response for a “typical” rice paddy field under traditional agricultural practices in Italy. To make the sample representative, 15 different time-series of SAR backscatter on traditional rice paddy fields have been used to create the reference signal. Then, simple tools such as the Root Mean Squared Error (RMSE) and correlation coefficient () were hypothesized as comparison tools to classify rice fields by setting a threshold on a similarity measure.
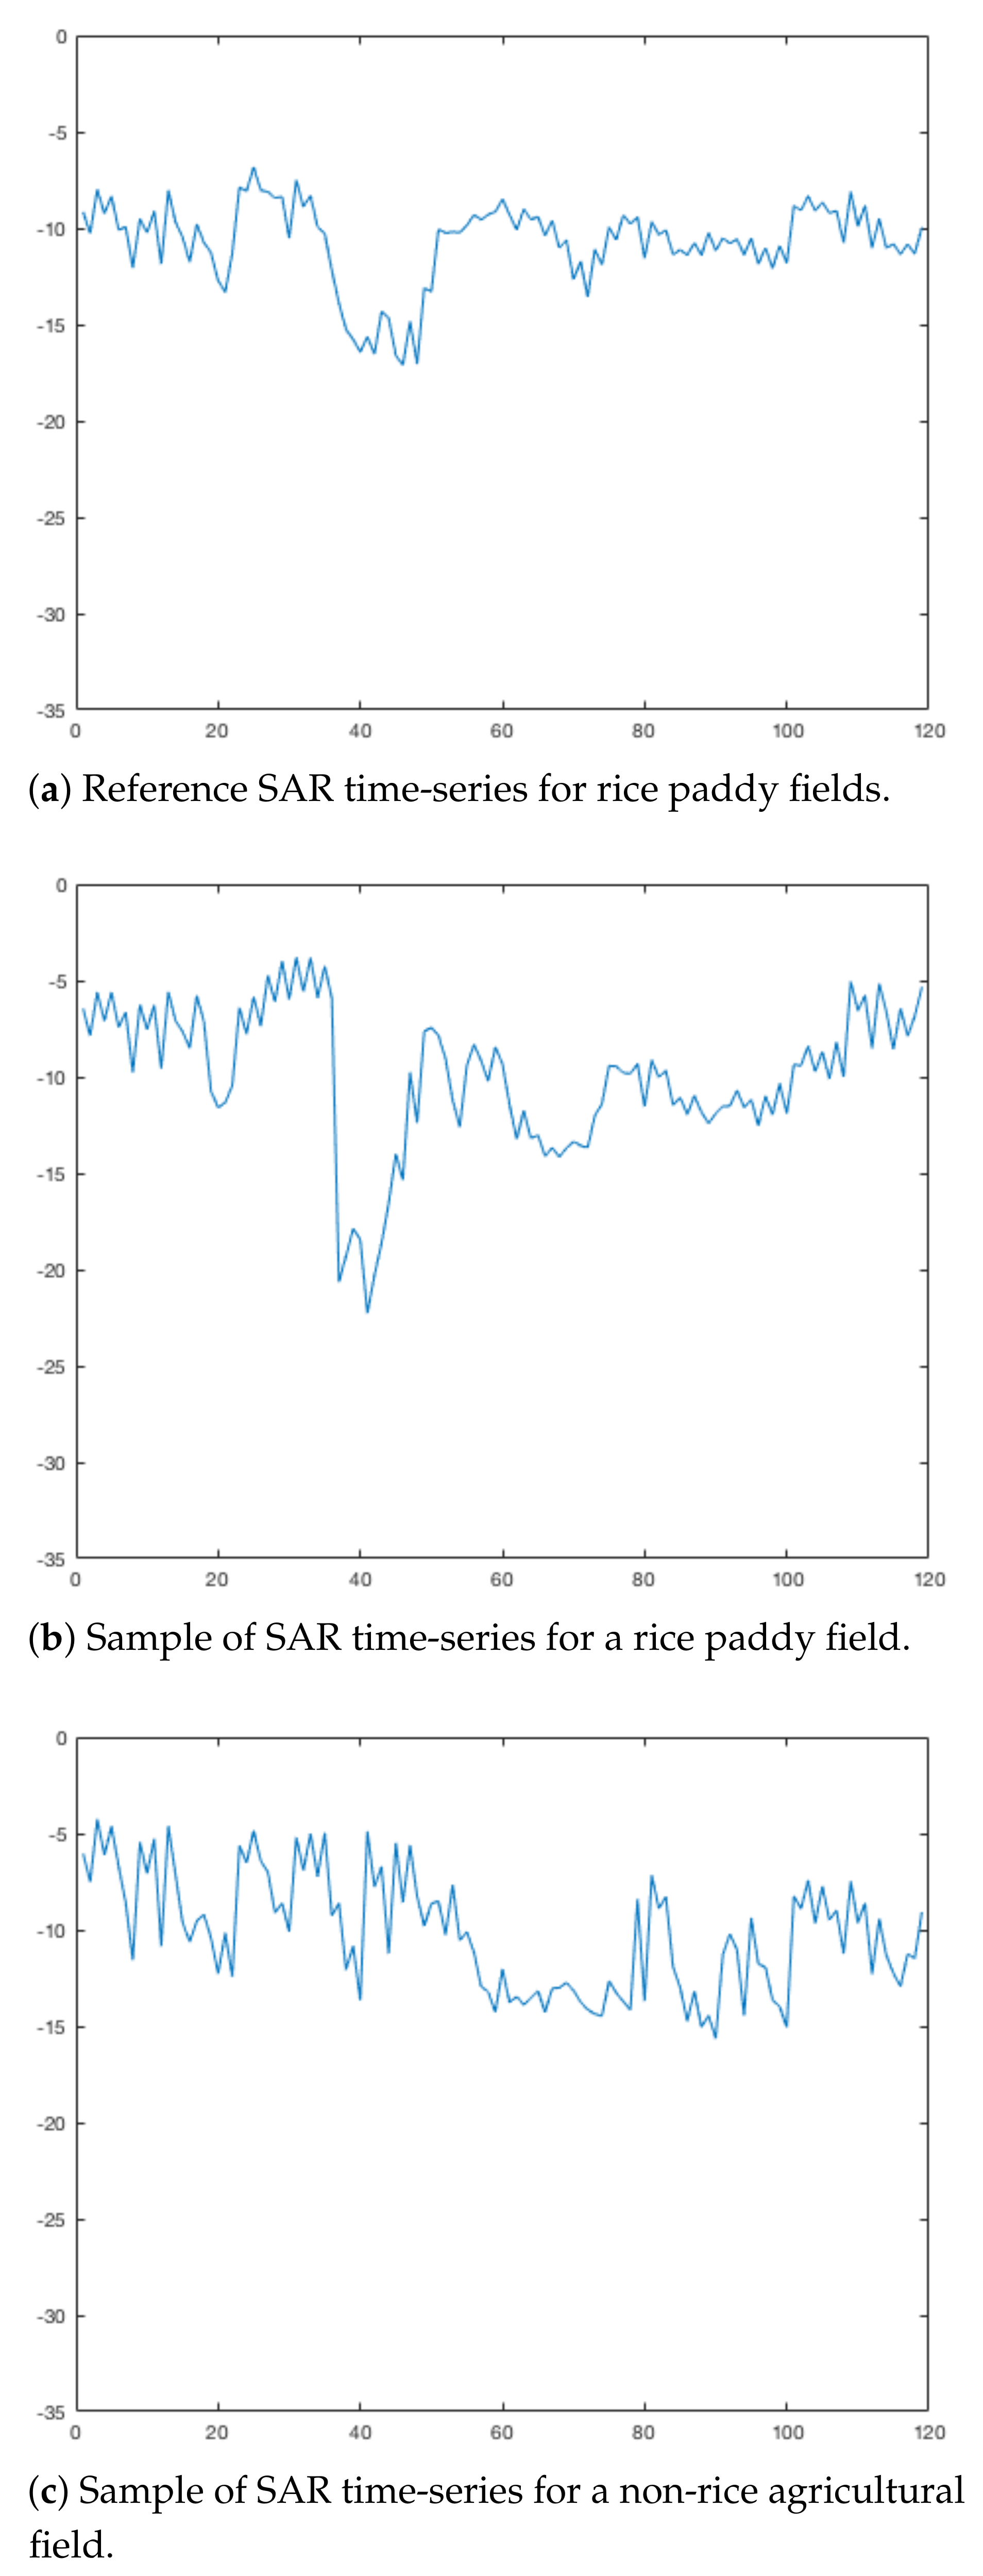
However, SAR time-series on rice fields may have, for example, different mean backscatter intensity values due to several reasons such as how and when the field is prepared to accommodate rice seeds, the sowed variety, the length of the growth cycle and many other environmental conditions. Even if rice field samples preserve their typical radar response, vertical displacements between two compared time-series, caused by the above-mentioned reasons, could lead to classification errors if RMSE alone is used as a similarity metric. An RMSE-based metric, indeed, only accounts for point-wise displacements between two time-series and not for the “overall similarity” of the trends. Despite the good stability of the reference trend (Figure 4a), differences on each single sample tend to bear little connection with the crop type; non-relevant features such as different mean values shifting the overall time-series upwards or downwards even by a small amount can generate enough accumulated RMSE to mis-classify a genuine conventional rice paddy field. Moreover, considering the situation in Figure 4, the reader can note that in this case, rice and non-rice field time-series feature very similar mean values (around −10 dB). Notwithstanding the obvious differences between the samples, this translates into low RMSE which leads a simple, threshold-based classifier to mistakenly identifying the non-rice sample as an actual rice field. For these reasons, the RMSE indicator may be not the best choice as a comparison tool, given its sensitivity to amplitude variations between signals, even with similar overall behavior.
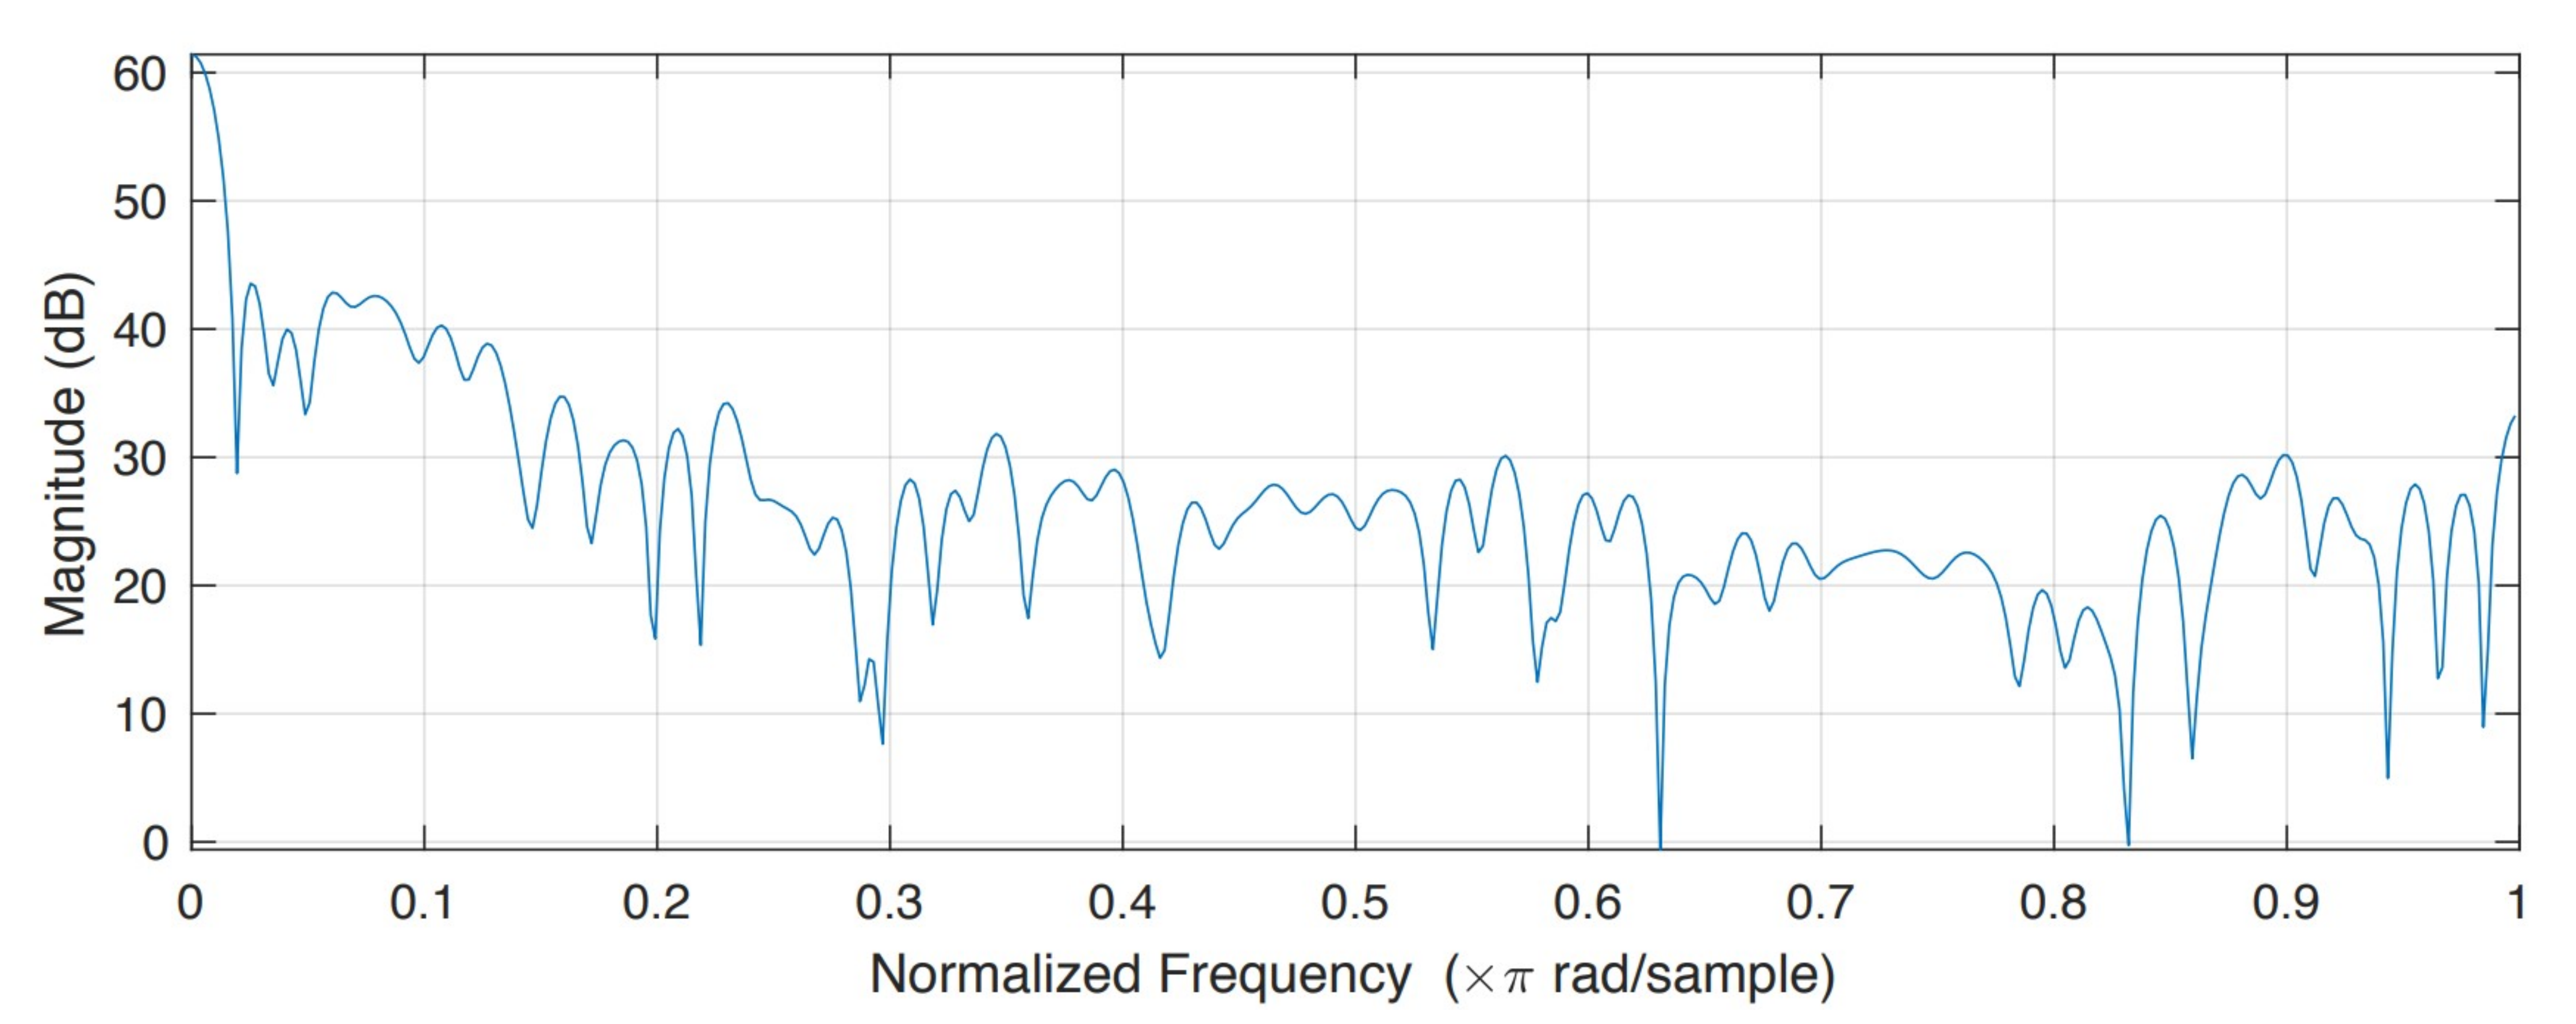
Regarding the use of the correlation coefficient, the major advantage is that it normalizes the variance of the compared signals to 1. In fact, contrary to RMSE indicator, the correlation coefficient can actually evaluate the “shape along time” of the SAR time-series and will disregard changes in amplitude values that are due to non-relevant factors (e.g., weather, sowed variety, soil conditions, etc.). Even the correlation coefficient, however, suffers from limitations linked to the noisy nature of radar data. Both the reference and test fields signals present residual high-frequency noise caused by both the effects of speckle noise and incidence angle variations [60,63,64]. This noise is not completely cancelled by spatial averaging, nor by the inter-series averaging involved in building the reference time-series. The residual noise may generate a substantial number of corresponding samples with contrary off-average displacements by pure effect of noise, even with the same type of land cover. The final effect is a substantially increased likelihood of wrong classifications for a correlation-based classifier. Experiments with correlation have indeed reported disappointing levels of Overall Accuracy (OA), i.e., around 80%. Such poor classification performance, largely caused by high-frequency noise, can be reduced through low-pass filtering. This step was implemented, as shown in Figure 5, resulting into a visible increase in OA. The cutoff frequency of the filter was determined by analyzing the magnitude of the time-series frequency spectrum, reported in Figure 6. In particular, the observation of a quick decay in amplitude between 0 and 0.02 [ rad/sample], followed by a plateau and another significant decay after 0.1 [ rad/sample], suggested that a simple 5th order low-pass Butterworth filter with normalized cut frequency [ rad/sample] could be suitable to suppress noise. Such cutoff frequency was confirmed suitable by experiment, and it is considered a good solution because it suppresses high-frequency noise components while still preserving the relevant traces of the rice plant phenology. Thanks to this type of processing, which allowed extracting the envelope from the time-series with the high noise frequencies suppressed, the classification accuracy increased. On the other hand, the number of false positives also increased, requiring further analysis and countermeasures.
5.3. Statistical Analysis
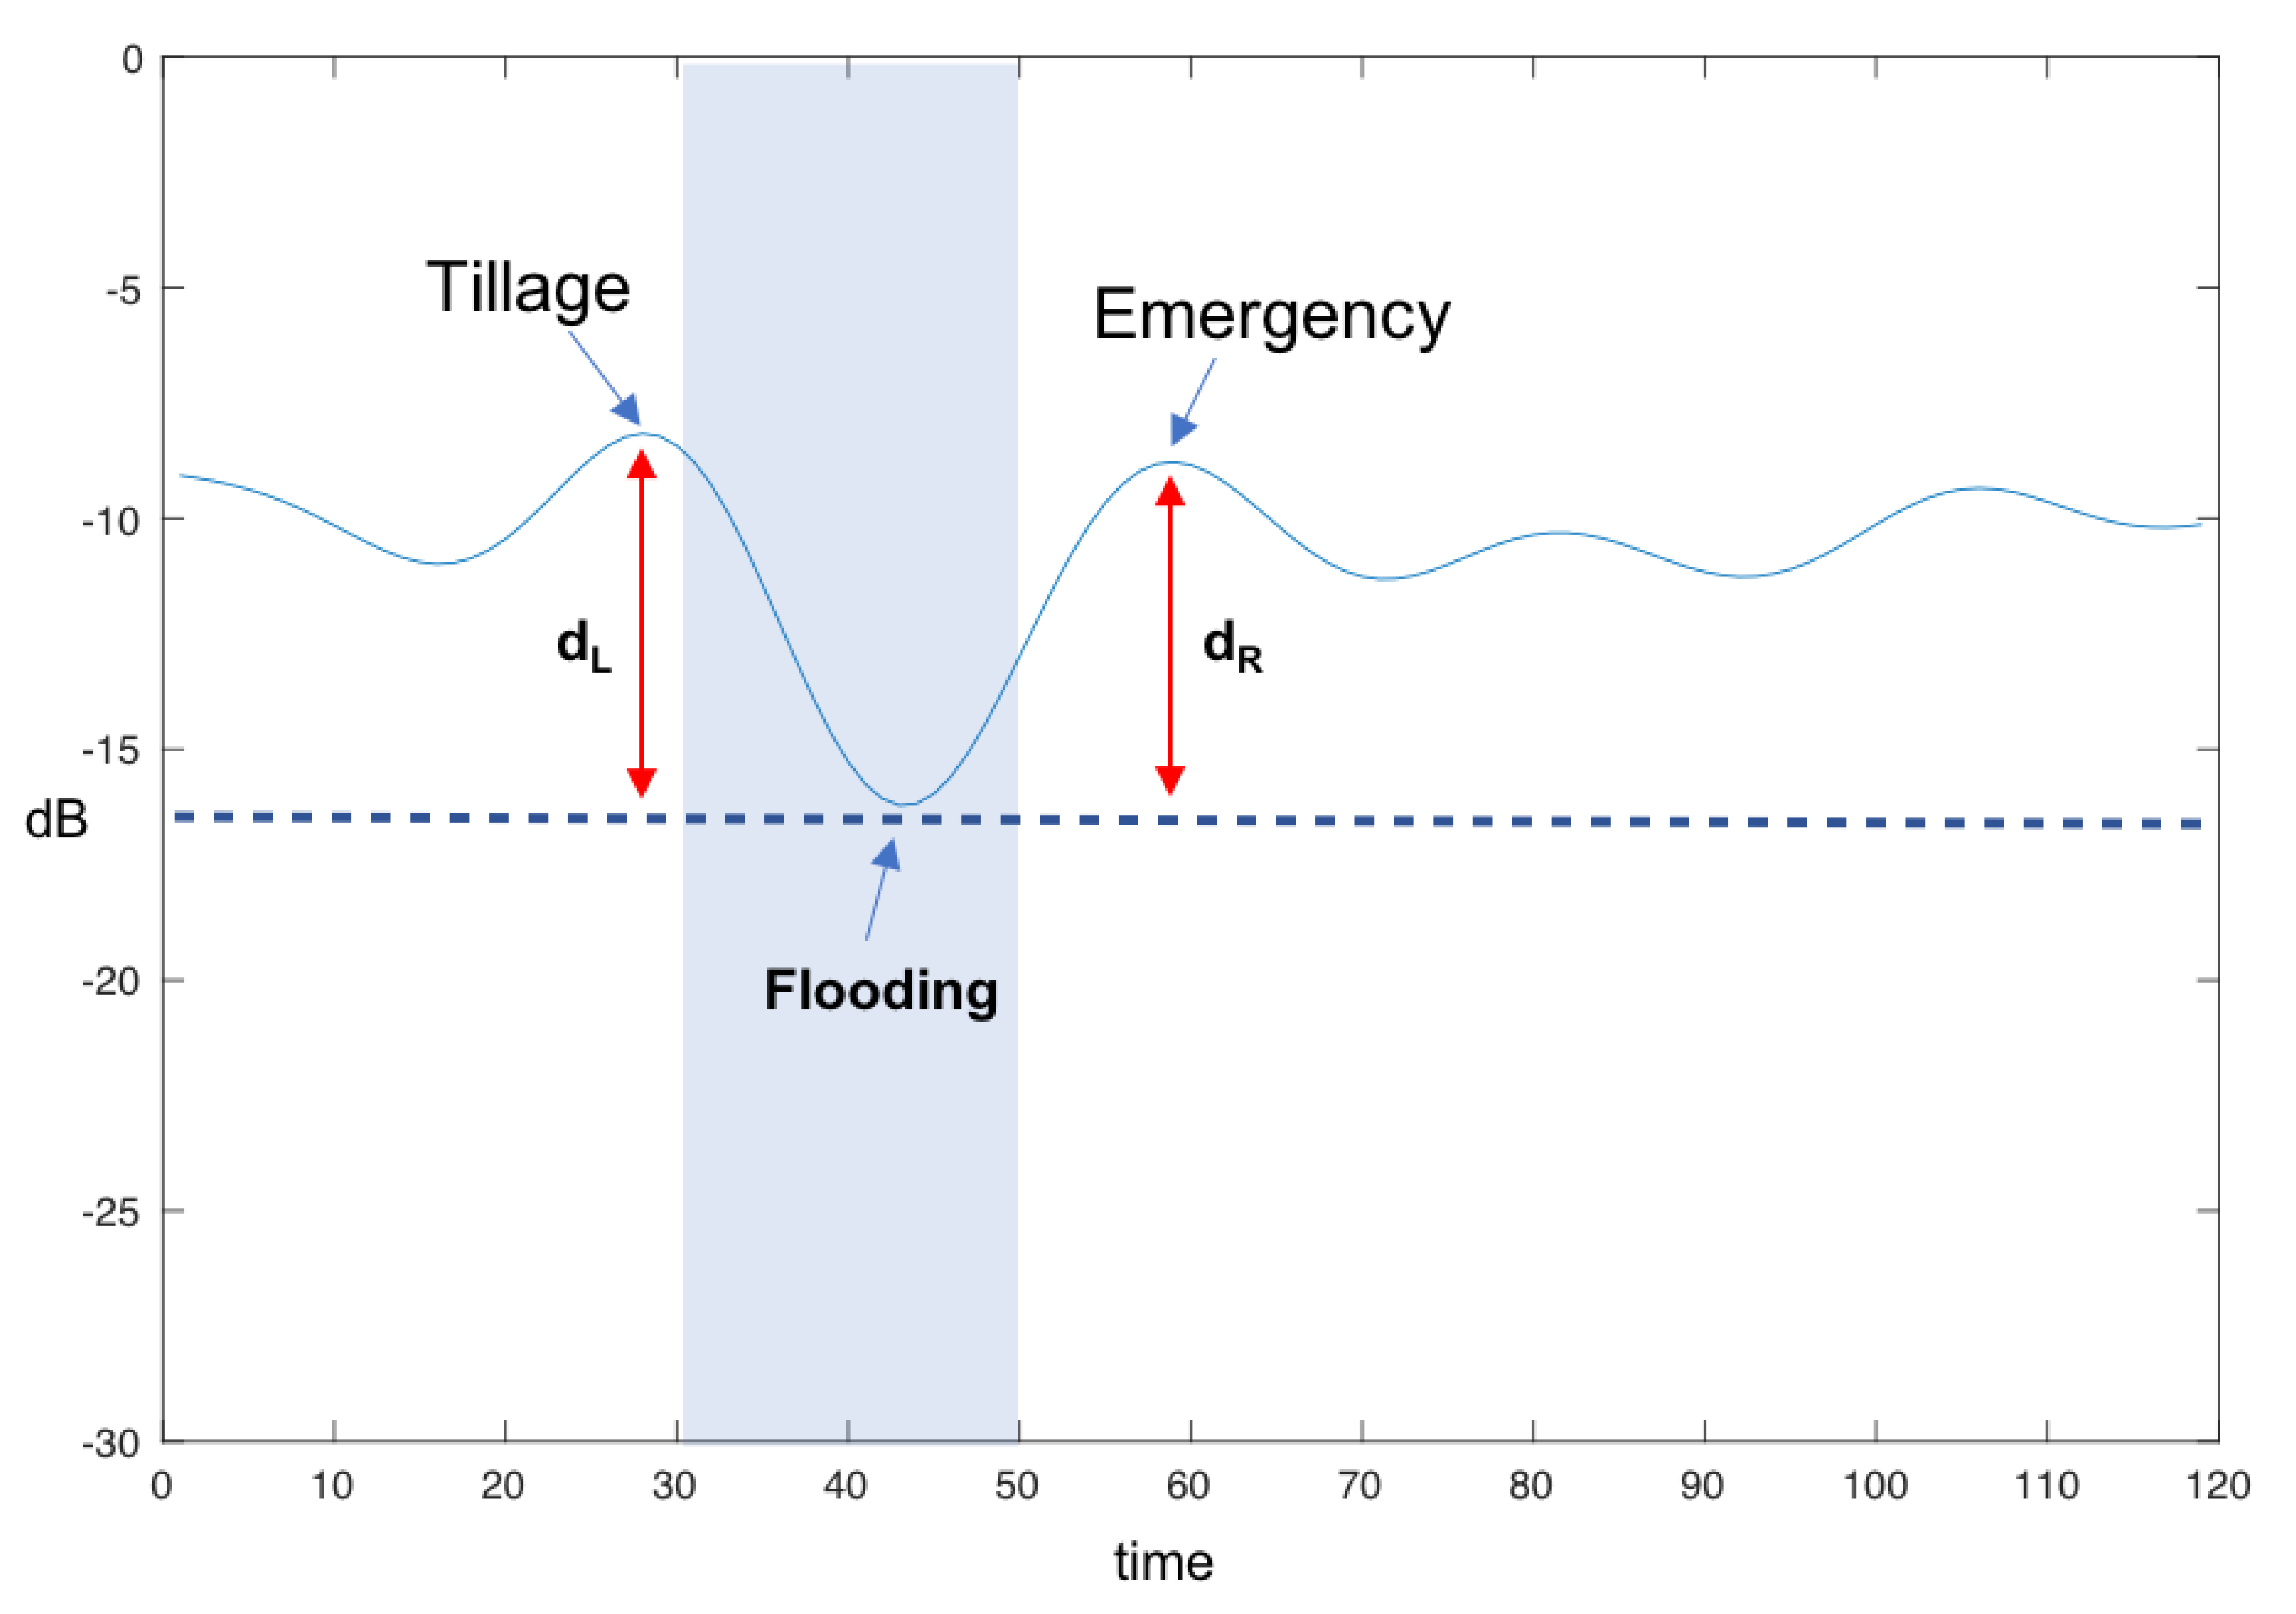
A deeper study of statistical features of SAR time-series offers the opportunity to enhance the classification procedure and rebalance error rates. Traditional rice paddy fields in Italy are flooded only once, in a specified time window between April and May. The negative impact of flooding on SAR backscatter is expected to generate a minimum in time-series acquired over rice paddy fields, resulting into a notch in the SAR backscatter sequence. The notch is expected to come with typical location and typical depth, as illustrated in the example in Figure 7, and should be confirmed by statistical analysis. The absolute minimum was in fact sought in each of the training-set samples, before and after filtering the time-series ad described in the previous subsection. Based on minima locations in DoY (Day-of-Year) and depth in dB, the following statistics were computed.
As it can be noted from Table 1, the location of the minimum is quite stable even in the unfiltered SAR sequence, and becomes even more so after filtering as reflected in the decreased standard deviation. The downside of filtering is an increased standard deviation in the depth of the minimum from 1.32 dB to 2.51 dB. Although undesired, this is still acceptable considering that typical off-notch levels float around −10 dB, i.e., 7 dB above the notch floor. Another typical feature of rice paddy fields, also visible in Figure 7, is the presence of two maxima neighboring the minimum, associated with the stages of ploughing (before flooding) and plant emergence (late stages of flooding). These maxima are not due to the overshooting effect of the filter, but rather to an objective situation: both ploughing and emergence increase locally the apparent surface roughness of the observed fields at band-C wavelengths. This shifts the reflection type from mirror to diffuse, thus increasing backscatter [65]. Based on the above analysis, an algorithm was designed to detect the presence of a minimum with a suitable depth in a suitable DoY window, plus the two neighboring maxima. An assessment of mutual distances among such salient points against the operational calendar for traditional rice allows identifying compatible behaviors and suppressing most false positives generated by the previous classification step.
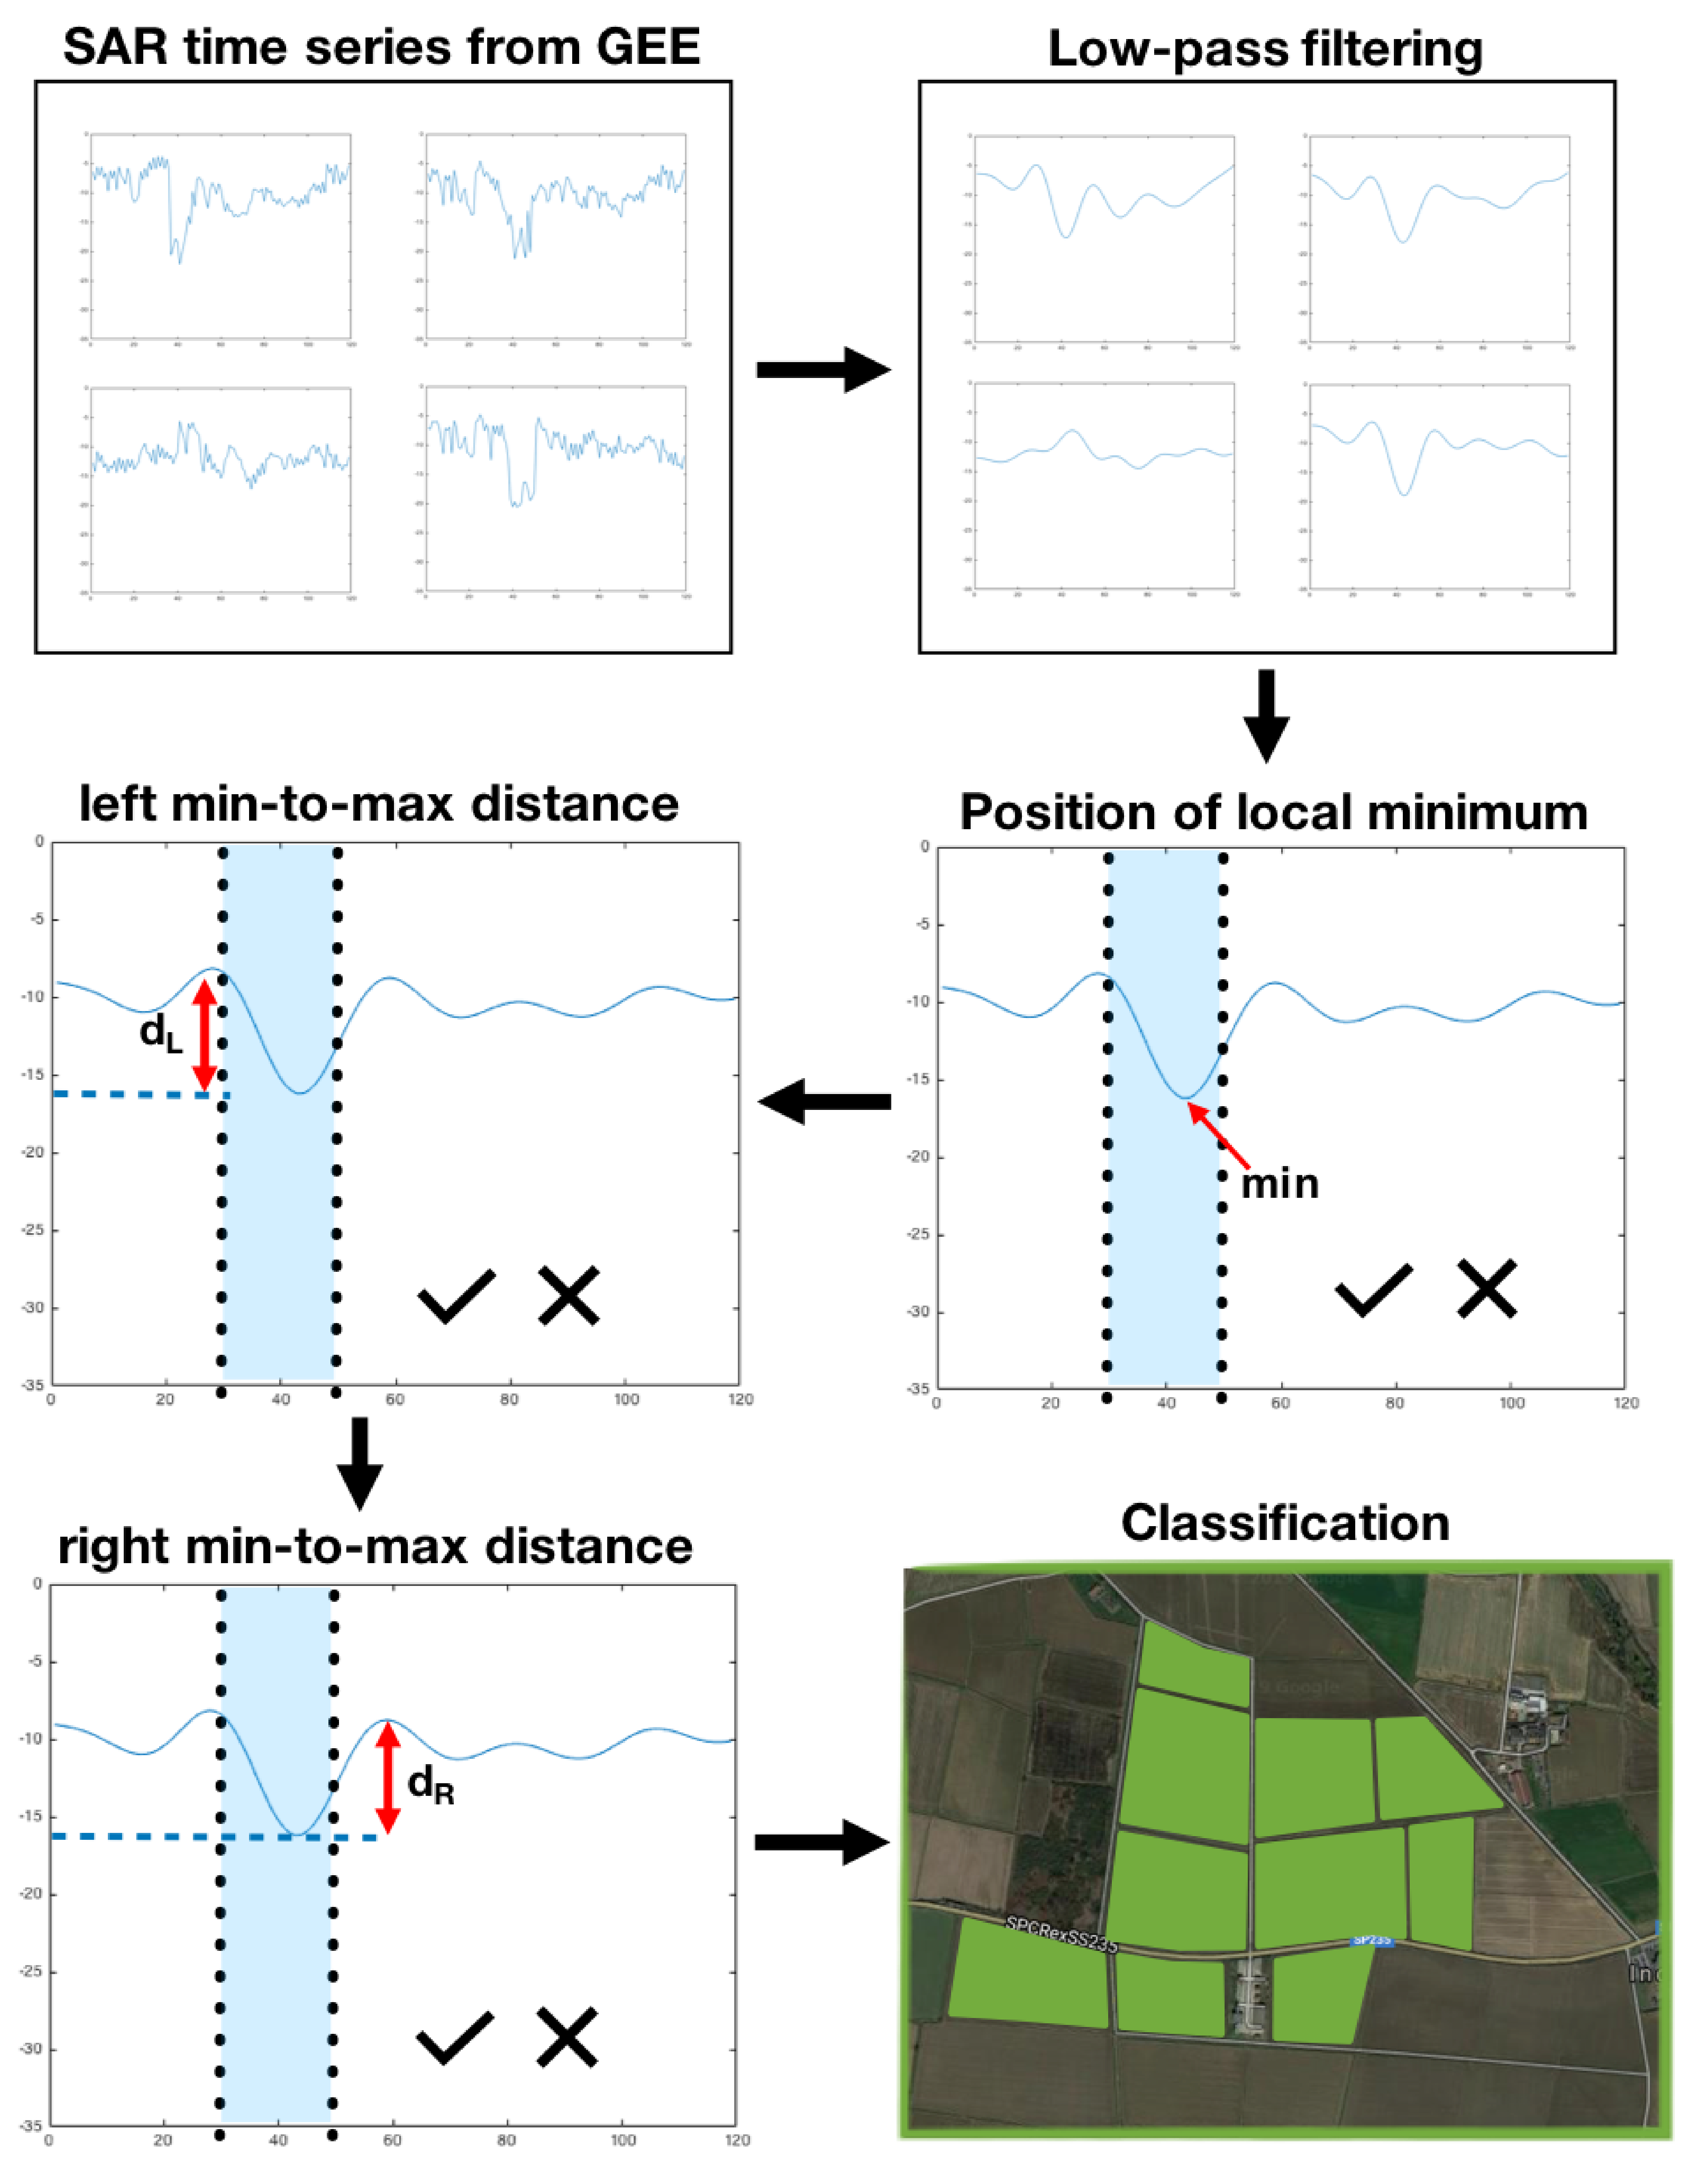
The rule designed for classifying a rice paddy field is described in the following, with reference to the simplified scheme of the classification methodology reported in Figure 8. First, the location of the minimum is identified and, if it falls off the 95% distribution limits based on statistical parameters defined in Table 1, then the sample is classified as non-rice and the procedure ends. If the minimum falls within such interval, the sample is moved to the next stage, which involves checking the levels of the side maxima (see Figure 7) against the level of the identified minimum. If one of the two computed differences does not reach a pre-set , the classification result is uncertain, and the output of the algorithm is a maybe label. However, if both distances are below threshold, the output of the system is a non-rice label. If both differences are above threshold, the sample is classified as rice. Therefore, the rice class is assigned only when all the decision nodes issue a positive flag, whereas partial non-compliance results in a maybe classification, which is equivalent to an “unclassified” output.
6. Results and Discussion
The method was initially tuned using a training ground truth dataset composed of 30 samples, of which 20 were classical rice paddy fields and 10 were land parcels with various agricultural land cover classes including organic rice. Although the training-set size may appear scarce, we should remember that obtaining reliable ground truth information about cultivation practices is not easy as this information is generally not publicly available. A set of 30 samples was fixed as a reasonable compromise between reliability of the information, and time and effort needed to collect it. Examples of optical satellite images on fields from the training set are visible in Figure 9. A first test was run on the same data set to confirm that the parameter set led to sensible results. This preliminary test was successful, with an observed 92% accuracy score. Obviously, given the limited size of the ground truth and the re-use of the same set for training and testing, it left open the question of its usability in a more general case. To assess the accuracy of the method on new samples, a further step was taken. A new test data set, with no overlap with the previously used data set, was thus generated to cross-check that the developed criterion and the parameters set could be profitably used in a more general framework.
The new test dataset was composed of 29 additional rice paddy parcels plus 20 parcels with other agricultural classes; none of these 49 parcels appeared in the training dataset.
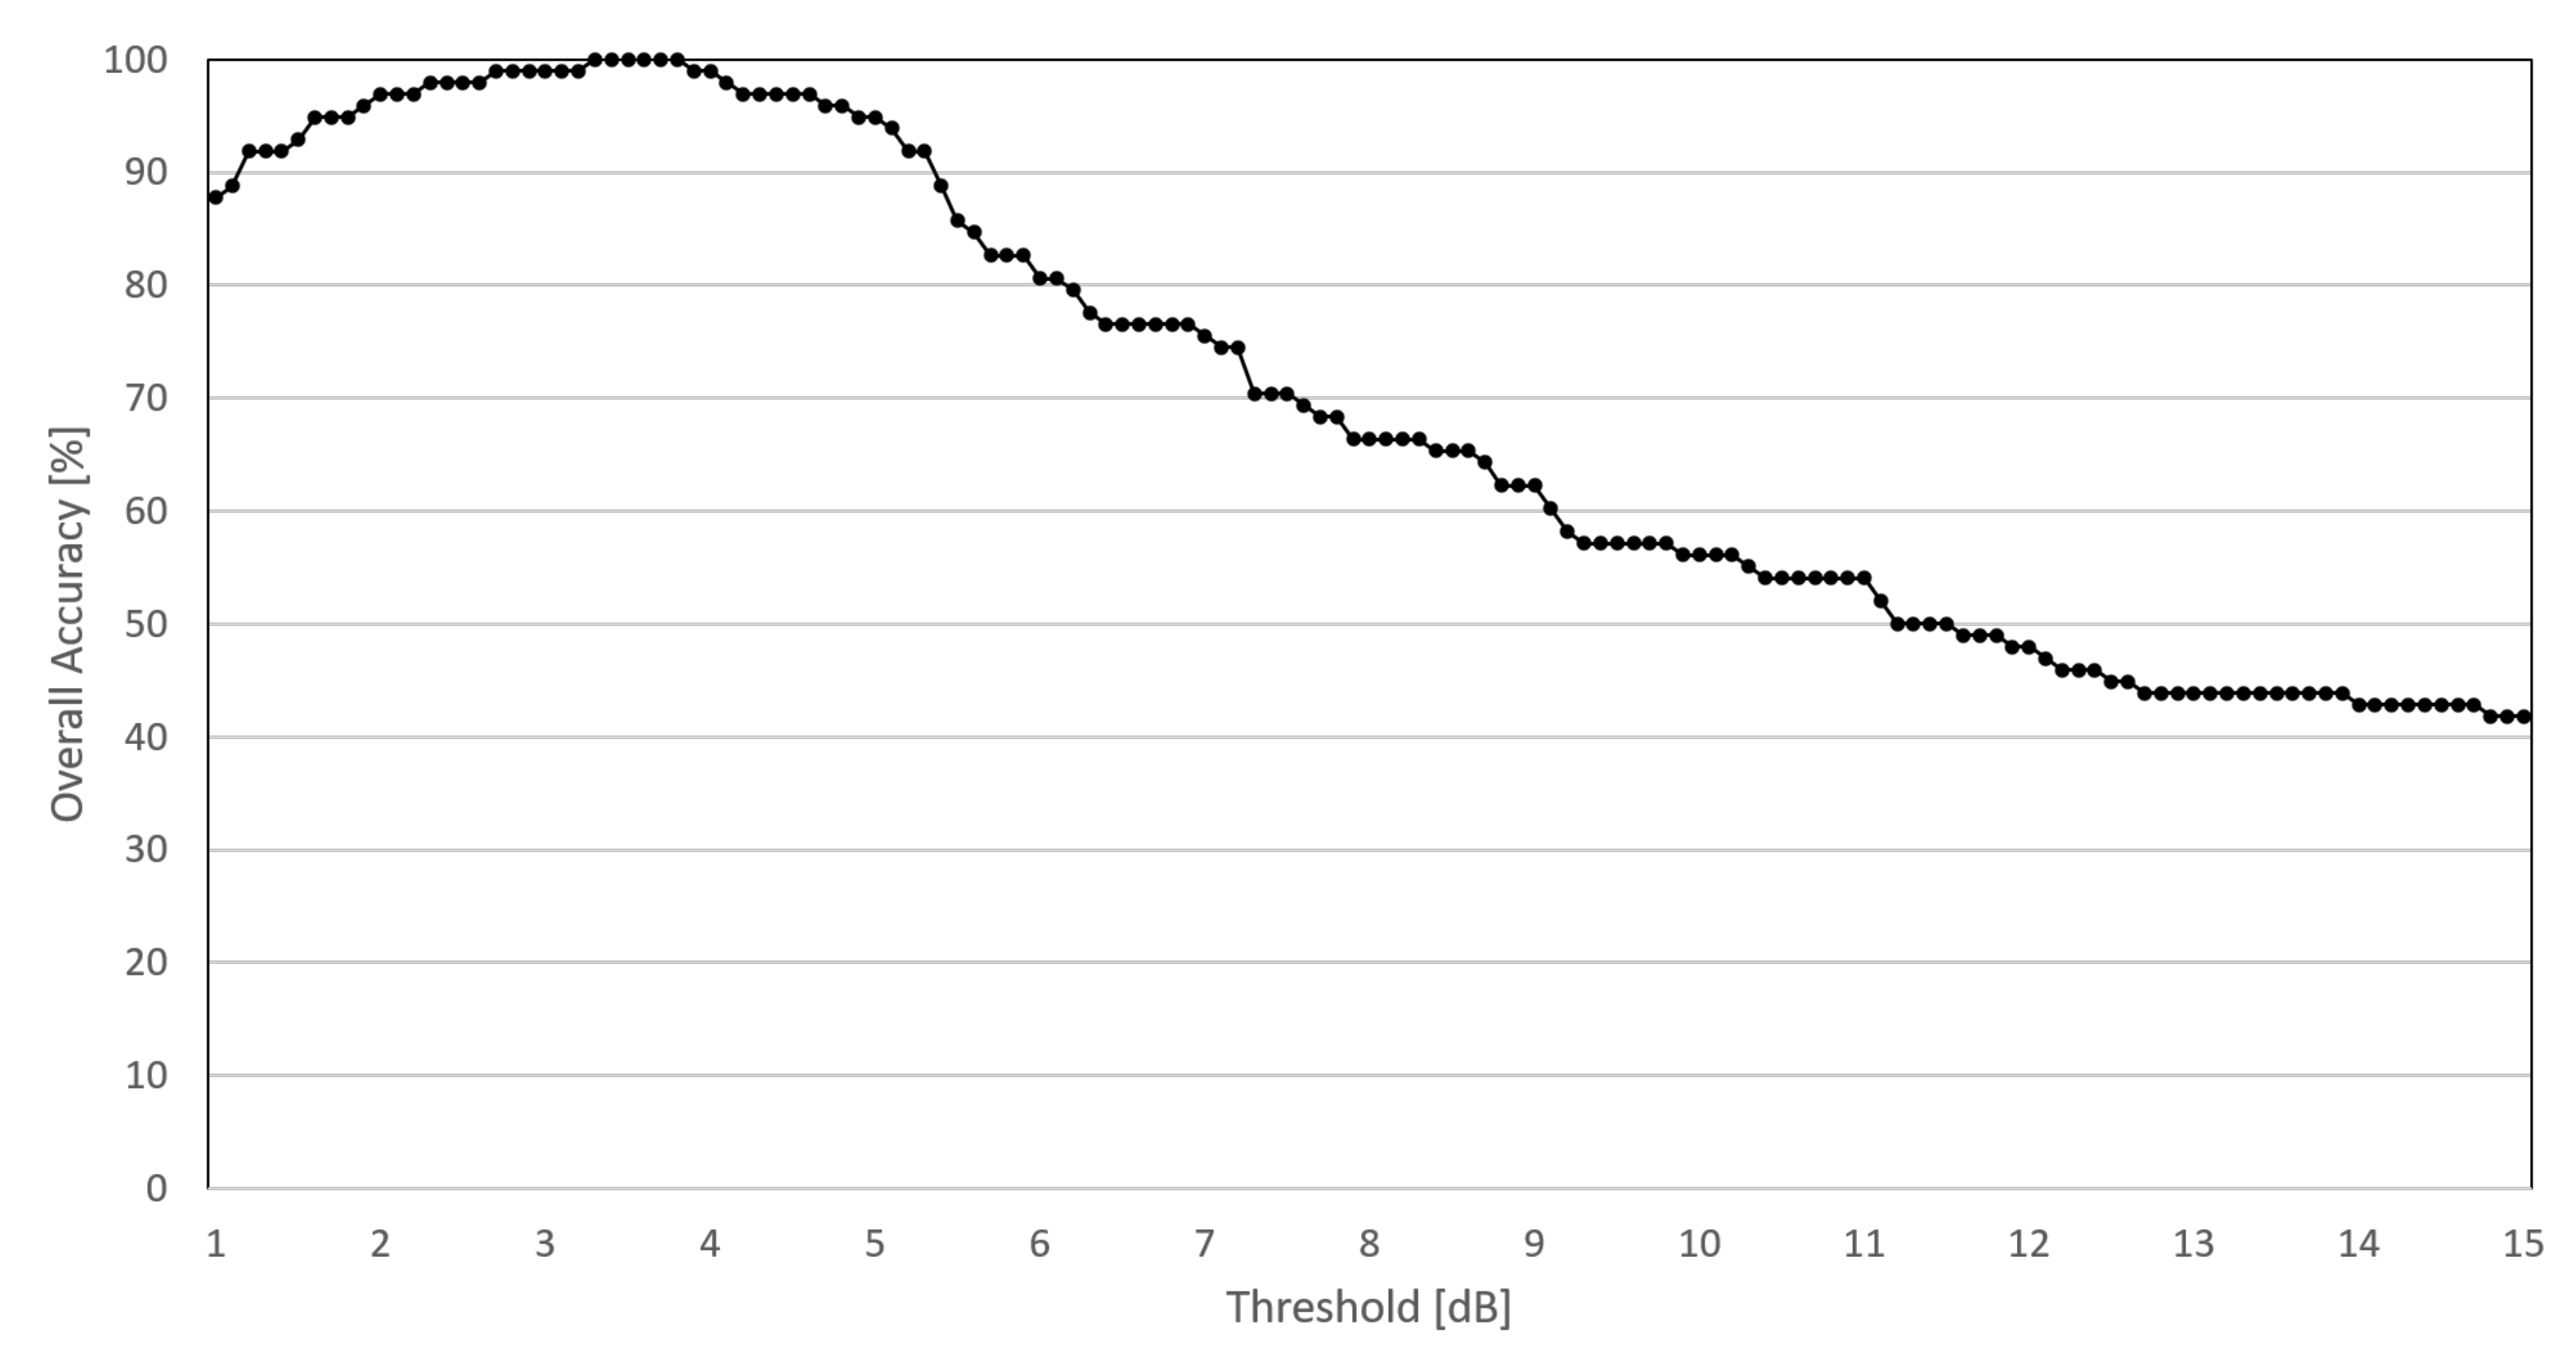
As a first approximation, the min-to-max distance threshold has been chosen by visual interpretation, after analyzing the radar responses of several rice fields. Therefore, to provide a more rigorous definition of such value, the overall accuracy has been evaluated as a function of the distance threshold. To do so, this parameter has been swept across the range 1–15 dB, at 0.1 dB steps. The algorithm automatically classified all samples for each threshold value, and the OA value was recorded in each case; maybe outputs were assigned a score of 0.5 hits as opposed to 1 hit assigned to a correct classification. This was done to partially account also for dubious cases. The accuracy as a function of the threshold parameter was then plotted in a graph, visible in Figure 10.
From Figure 10 it can be observed that top classification accuracy is achieved for threshold values around dB, resulting into 100% accuracy. To cross-check the threshold value determined was actually optimal, an analogous classification was run on the training data set with the same setting, resulted into scoring 100% OA again. Having obtained the best possible score on two independent (albeit small) datasets with the same value of the parameter appears to confirm that dB be at least an effective choice. This threshold value may seem small if compared with the typical values observed in Figure 7. It is to be noted, however, that this latter figure displays an average trend, and situations on individual rice paddy fields may differ significantly. By investigating single cases, it can be noticed that the most discriminating feature is the exact location of the minimum in the low-pass filtered sequence, whereas threshold comparison comes to be the discriminant step only in a few cases. Yet it may be interesting to investigate what happens when non-optimal threshold values are used, such as dB (too low) and dB (too high). In both cases the accuracy level plunges to around 95%, thus confirming that the parameter has a limited impact on the effectiveness of the proposed classification procedure. The two accuracy levels on the two off-optimum sides, however, come with different error patterns. In the case of low threshold, all rice paddy fields are correctly classified, and the accuracy loss is due to unclassified pixels (maybe class) from the ground truth class non-rice, whereas no false positives are observed. In other words, it becomes easier for the few non-rice fields that randomly feature their minimum within the rice window to reach the threshold on at least one side and switch from non-rice to maybe, which is consistent with the structure of the algorithm presented in Section 5. In the case of high threshold value, the situation is different, with a few missed rice samples assigned to non-rice class or left unclassified, whereas all non-rice samples have been correctly classified as such. This is also consistent with the structure of the algorithm, as a very high value of rules out legitimate rice samples by exceeding reasonable values of max-to-min difference. As a general conclusion, it can be stated that by far the most discriminating feature is the DoY location of the minimum in the filtered time sequence, which is in line with our initial hypothesis. Still, full performance cannot be achieved if max-to-min distance is not taken into account. Although based on test sets of limited size, our experiments have gone into detail into analyzing features suitable for rice paddy field classification based on the observed sequence of spaceborne SAR reflectivity. Results of the analysis support that the developed method can correctly identify classical rice cultivation practices on rice paddy fields. Naturally, the method needs further assessment on larger samples; this however requires a substantial amount of additional work, which could not be performed in the time frame of this first pilot project. It is planned for the future stages of the service development.
7. Conclusions
In this paper, it was described a simple SAR-based mapping methodology for mapping rice paddy fields managed with a conventional (i.e., non-organic) approach, in a European context. This is a part of a broader action aimed at automatically collecting information that can be used to enhance traceability of agricultural crops with the help of satellite monitoring. In the experiments conducted with volunteer farmers, we were able to spot classical rice fields thanks to precise detection of the flooding period occurring in conventional rice fields only, which translates into a typical pattern of low backscatter values between April and May, typically preceded and followed by higher backscatter values due to ploughing and emergence. Experimental results involving simple processing tools demonstrated the possibility to identify rice by comparing the SAR time-series of the considered field and a reference trend from the training set. On a small-sized dataset, we obtained 88% and 84% OA for the RMSE-based and correlation coefficient-based algorithms, respectively. The proposed method based on identification of the SAR pattern related to spring flooding of rice paddy fields pushed the overall accuracy up to 100% for an optimal choice of parameters, with values around 95% to be expected for non-optimal parameters. The most discriminating feature was found to be the day-of-year location of the minimum in the low-pass filtered version of the time-series of SAR reflectivity values; the residual ambiguity can be solved by assessing the difference between the minimum and the maxima in the filtered time-series. The next steps of our work will involve fusion of SAR backscatter data from different sources, and extension of the training and test sets to make results more statistically significant.
Author Contributions
Conceptualization, F.D.; methodology, D.M.; software, D.M.; validation, D.M.; formal analysis, F.D. and D.M.; investigation, F.D. and D.M.; resources, F.D.; data curation, D.M.; writing—original draft preparation, F.D.; writing—review and editing, F.D. and D.M.; visualization, D.M.; supervision, F.D.; project administration, F.D. and D.M.; funding acquisition, F.D. All authors have read and agreed to the published version of the manuscript.
Funding
This work was supported in part by the European Space Agency (ESA) through the KSA Contract No. 4000124436/18/NL/NR.
Institutional Review Board Statement
Not applicable.
Informed Consent Statement
Not applicable.
Data Availability Statement
Data available only on request, due to privacy restrictions. Approval of data providers required.
Acknowledgments
The authors wish to heartily thank all those who have been supporting this project by contributing field data and their knowledge of rice cultivation practices. We would like to mention here Cristiana Sartori (organic rice farmer), Silvano Rubinetto and his family (organic rice farmers), the Rovasenda family (organic rice farmers), Daniele Rattini (agronomist), Marco Romani (agronomist), Maria Gabriella Di Calì (regional policy officer) and others. Although this paper only relates to the inception of our research work, the enthusiasm we have recorded in supporters of organic rice for our long-term objectives was a great incentive for us to move on.
Conflicts of Interest
The authors declare no conflict of interest.
References
- FAOSTAT. Statistical Database of the Food and Agriculture Organization of the United Nations; FAO: Rome, Italy, 2014. [Google Scholar]
- Bouman, B.; Humphreys, E.; Tuong, T.P.; Barker, R. Rice and water. Adv. Agron. 2007, 92, 187–237. [Google Scholar]
- Yao, Z.; Zheng, X.; Liu, C.; Lin, S.; Zuo, Q.; Butterbach-Bahl, K. Improving rice production sustainability by reducing water demand and greenhouse gas emissions with biodegradable films. Sci. Rep. 2017, 7, 1–10. [Google Scholar] [CrossRef] [Green Version]
- Yagi, K.; Tsuruta, H.; Minami, K. Possible options for mitigating methane emission from rice cultivation. Nut. Cycl. Agroecosyst. 1997, 49, 213–220. [Google Scholar] [CrossRef]
- Yan, X.; Akiyama, H.; Yagi, K.; Akimoto, H. Global estimations of the inventory and mitigation potential of methane emissions from rice cultivation conducted using the 2006 Intergovernmental Panel on Climate Change Guidelines. Glob. Biogeochem. Cycles 2009, 23, 211. [Google Scholar] [CrossRef]
- Arai, H.; Takeuchi, W.; Oyoshi, K.; Nguyen, L.D.; Inubushi, K. Estimation of Methane Emissions from Rice Paddies in the Mekong Delta Based on Land Surface Dynamics Characterization with Remote Sensing. Remote Sen. 2018, 10, 1438. [Google Scholar] [CrossRef] [Green Version]
- Muslim, M.; Romshoo, S.A.; Rather, A. Paddy crop yield estimation in Kashmir Himalayan rice bowl using remote sensing and simulation model. Environ. Monitor. Assess. 2015, 187, 1–12. [Google Scholar] [CrossRef] [PubMed]
- Li, H.; Fu, D.; Huang, C.; Su, F.; Liu, Q.; Liu, G.; Wu, S. An Approach to High-Resolution Rice Paddy Mapping Using Time-Series Sentinel-1 SAR Data in the Mun River Basin, Thailand. Remote Sens. 2020, 12, 3959. [Google Scholar] [CrossRef]
- Gumma, M.K.; Nelson, A.; Thenkabail, P.S.; Singh, A.N. Mapping rice areas of South Asia using MODIS multitemporal data. J. Appl. Remote Sens. 2011, 5, 053547. [Google Scholar] [CrossRef] [Green Version]
- More, R.S.; Manjunath, K.; Jain, N.K.; Panigrahy, S.; Parihar, J.S. Derivation of rice crop calendar and evaluation of crop phenometrics and latitudinal relationship for major south and south-east Asian countries: A remote sensing approach. Comput. Electron. Agric. 2016, 127, 336–350. [Google Scholar] [CrossRef]
- Dong, J.; Xiao, X.; Kou, W.; Qin, Y.; Zhang, G.; Li, L.; Jin, C.; Zhou, Y.; Wang, J.; Biradar, C.; et al. Tracking the dynamics of paddy rice planting area in 1986–2010 through time series Landsat images and phenology-based algorithms. Remote Sens. Environ. 2015, 160, 99–113. [Google Scholar] [CrossRef]
- Mandal, D.; Kumar, V.; Bhattacharya, A.; Rao, Y.S.; Siqueira, P.; Bera, S. Sen4Rice: A Processing Chain for Differentiating Early and Late Transplanted Rice Using Time-Series Sentinel-1 SAR Data With Google Earth Engine. IEEE Geosci. Remote Sens. Lett. 2018, 15, 1947–1951. [Google Scholar] [CrossRef]
- Rossi, C.; Erten, E. Paddy-Rice Monitoring Using TanDEM-X. IEEE Trans. Geosci. Remote Sens. 2015, 53, 900–910. [Google Scholar] [CrossRef] [Green Version]
- Supriatna, R.; Wibowo, A.; Shidiq, I.P.A.; Pratama, G.P.; Gandharum, L. Spatio-temporal analysis of rice field phenology using Sentinel-1 image in Karawang Regency West Java, Indonesia. Int. J. 2019, 17, 101–106. [Google Scholar] [CrossRef]
- Nguyen, D.B.; Wagner, W. European Rice Cropland Mapping with Sentinel-1 Data: The Mediterranean Region Case Study. Water 2017, 9, 392. [Google Scholar] [CrossRef]
- Bazzi, H.; Baghdadi, N.; El Hajj, M.; Zribi, M.; Minh, D.H.T.; Ndikumana, E.; Courault, D.; Belhouchette, H. Mapping Paddy Rice Using Sentinel-1 SAR Time Series in Camargue, France. Remote Sens. 2019, 11, 887. [Google Scholar] [CrossRef] [Green Version]
- Lopez-Sanchez, J.M.; Ballester-Berman, J.D.; Hajnsek, I. First Results of Rice Monitoring Practices in Spain by Means of Time Series of TerraSAR-X Dual-Pol Images. IEEE J. Sel. Top. Appl. Earth Obs. Remote Sens. 2011, 4, 412–422. [Google Scholar] [CrossRef]
- Thompson, A.A. Overview of the RADARSAT constellation mission. Canad. J. Remote Sens. 2015, 41, 401–407. [Google Scholar] [CrossRef]
- Brisco, B. Mapping and monitoring surface water and wetlands with synthetic aperture radar. In Remote Sensing of Wetlands: Applications and Advances; NCBI: Bethesda, MD, USA, 2015; pp. 119–136. [Google Scholar]
- Datta, A.; Ullah, H. Water Management in Rice. In Rice Production Worldwide; Springer: Cham, Switzerland, 2017; pp. 255–277. [Google Scholar] [CrossRef]
- Peyron, M.; Bertora, C.; Pelissetti, S.; Said-Pullicino, D.; Celi, L.; Miniotti, E.; Romani, M.; Sacco, D. Greenhouse gas emissions as affected by different water management practices in temperate rice paddies. Agric. Ecosyst. Environ. 2016, 232, 17–28. [Google Scholar] [CrossRef]
- Miniotti, E.F.; Romani, M.; Said-Pullicino, D.; Facchi, A.; Bertora, C.; Peyron, M.; Sacco, D.; Bischetti, G.B.; Lerda, C.; Tenni, D.; et al. Agro-environmental sustainability of different water management practices in temperate rice agro-ecosystems. Agric. Ecosyst. Environ. 2016, 222, 235–248. [Google Scholar] [CrossRef]
- Shrivastava, A.; Barla, A.; Majumdar, A.; Singh, S.; Bose, S. Arsenic mitigation in rice grain loading via alternative irrigation by proposed water management practices. Chemosphere 2020, 238, 124988. [Google Scholar] [CrossRef]
- Hazra, K.; Swain, D.; Bohra, A.; Singh, S.; Kumar, N.; Nath, C. Organic rice: Potential production strategies, challenges and prospects. Org. Agric. 2018, 8, 39–56. [Google Scholar] [CrossRef]
- Neeson, R. Organic Rice Production—Improving System Sustainability. Technical Report, Cooperative Research Centre for Sustainable Rice Production. Final Research Report (P2107FR06/05). 2005. Available online: https://ses.library.usyd.edu.au/bitstream/handle/2123/151/P2107FR06-05.pdf (accessed on 30 June 2021).
- Marzi, D.; Dell’Acqua, F. Space-based monitoring of organic rice: The ESA KSA project “Vialone” contributes to supporting an Italian high-tier product. In Proceedings of the GTTI Radar and Remote Sensing Workshop 2019, Rome, Italy, 30–31 May 2019. [Google Scholar]
- Marzi, D.; De Vecchi, D.; Iannelli, G.C. The ESA KSA Vialone Project: New Business from Space in Organic Farming. In Proceedings of the Earth Observation Phi-Week, Frascati, Rome, Italy, 9–13 September 2019. [Google Scholar]
- Dell’Acqua, F.; De Vecchi, D. Potentials of active and passive geospatial crowdsourcing in complementing sentinel data and supporting Copernicus service portfolio. Proc. IEEE 2017, 105, 1913–1925. [Google Scholar] [CrossRef]
- Tian, H.; Wu, M.; Wang, L.; Niu, Z. Mapping Early, Middle and Late Rice Extent Using Sentinel-1A and Landsat-8 Data in the Poyang Lake Plain, China. Sensors 2018, 18, 185. [Google Scholar] [CrossRef] [Green Version]
- Marzi, D.; Garau, C.; Dell’Acqua, F. Identification of rice fields in the Lombardy region of Italy based on time series of Sentinel-1 data. In Proceedings of the IGARSS 2021–IEEE International Geoscience and Remote Sensing Symposium, Brussels, Belgium, 11–16 July 2021; pp. 5296–5299. [Google Scholar]
- Clement, M.; Kilsby, C.; Moore, P. Multi-temporal synthetic aperture radar flood mapping using change detection. J. Flood Risk Manag. 2018, 11, 152–168. [Google Scholar] [CrossRef]
- Khush, G.S. Origin, dispersal, cultivation and variation of rice. Plant Mol. Biol. 1997, 35, 25–34. [Google Scholar] [CrossRef]
- Lopez-Sanchez, J.M.; Cloude, S.R.; Ballester-Berman, J.D. Rice phenology monitoring by means of SAR polarimetry at X-band. IEEE Trans. Geosci. Remote Sens. 2011, 50, 2695–2709. [Google Scholar] [CrossRef]
- Xu, L.; Zhang, H.; Wang, C.; Zhang, B.; Liu, M. Crop Classification Based on Temporal Information Using Sentinel-1 SAR Time-Series Data. Remote Sens. 2019, 11, 53. [Google Scholar] [CrossRef] [Green Version]
- Zhou, D.; Zhao, S.; Zhang, L.; Liu, S. Remotely sensed assessment of urbanization effects on vegetation phenology in China’s 32 major cities. Remote Sens. Environ. 2016, 176, 272–281. [Google Scholar] [CrossRef] [Green Version]
- Pastor-Guzman, J.; Dash, J.; Atkinson, P.M. Remote sensing of mangrove forest phenology and its environmental drivers. Remote Sens. Environ. 2018, 205, 71–84. [Google Scholar] [CrossRef] [Green Version]
- Siachalou, S.; Mallinis, G.; Tsakiri-Strati, M. A hidden Markov models approach for crop classification: Linking crop phenology to time series of multi-sensor remote sensing data. Remote Sens. 2015, 7, 3633–3650. [Google Scholar] [CrossRef] [Green Version]
- Ozdogan, M.; Yang, Y.; Allez, G.; Cervantes, C. Remote sensing of irrigated agriculture: Opportunities and challenges. Remote Sens. 2010, 2, 2274–2304. [Google Scholar] [CrossRef] [Green Version]
- Mosleh, M.; Hassan, Q.; Chowdhury, E. Application of remote sensors in mapping rice area and forecasting its production: A review. Sensors 2015, 15, 769–791. [Google Scholar] [CrossRef] [PubMed] [Green Version]
- Joshi, N.; Baumann, M.; Ehammer, A.; Fensholt, R.; Grogan, K.; Hostert, P.; Jepsen, M.; Kuemmerle, T.; Meyfroidt, P.; Mitchard, E.; et al. A review of the application of optical and radar remote sensing data fusion to land use mapping and monitoring. Remote Sens. 2016, 8, 70. [Google Scholar] [CrossRef] [Green Version]
- Clauss, K.; Ottinger, M.; Kuenzer, C. Mapping rice areas with Sentinel-1 time series and superpixel segmentation. Int. J. Remote Sens. 2018, 39, 1399–1420. [Google Scholar] [CrossRef] [Green Version]
- Pazhanivelan, S.; Kannan, P.; Mary, N.; Christy, P.; Subramanian, E.; Jeyaraman, S.; Nelson, A.; Holecz, F.; Yadav, M. Rice crop monitoring and yield estimation through COSMO Skymed and TerraSAR-X: A SAR-based experience in India. Int. Arch. Photogram. Remote Sens. Spat. Inform. Sci. 2015, 40, 85. [Google Scholar] [CrossRef] [Green Version]
- Nguyen, D.B.; Gruber, A.; Wagner, W. Mapping rice extent and cropping scheme in the Mekong Delta using Sentinel-1A data. Remote Sens. Lett. 2016, 7, 1209–1218. [Google Scholar] [CrossRef]
- Liu, J.; Li, L.; Huang, X.; Liu, Y.; Li, T. Mapping paddy rice in Jiangsu Province, China, based on phenological parameters and a decision tree model. Front. Earth Sci. 2019, 13, 111–123. [Google Scholar] [CrossRef]
- Munandar, T.A. The Classification of Cropping Patterns Based on Regional Climate Classification Using Decision Tree Approach. arXiv 2018, arXiv:1803.11259. [Google Scholar] [CrossRef] [Green Version]
- White, L.; Brisco, B.; Pregitzer, M.; Tedford, B.; Boychuk, L. RADARSAT-2 beam mode selection for surface water and flooded vegetation mapping. Can. J. Remote Sen. 2014, 40, 135–151. [Google Scholar]
- DeLancey, E.R.; Kariyeva, J.; Cranston, J.; Brisco, B. Monitoring hydro temporal variability in Alberta, Canada with multi-temporal Sentinel-1 SAR data. Can. J. Remote Sens. 2018, 44, 1–10. [Google Scholar] [CrossRef]
- Dasgupta, A.; Grimaldi, S.; Ramsankaran, R.; Pauwels, V.R.; Walker, J.P. Towards operational SAR-based flood mapping using neuro-fuzzy texture-based approaches. Remote Sens. Environ. 2018, 215, 313–329. [Google Scholar] [CrossRef]
- Pierdicca, N.; Pulvirenti, L.; Boni, G.; Squicciarino, G.; Chini, M. Radar multispectral and polarimetric signature of rice fields: An investigation on the double bounce mechanism in flooded vegetation. In Proceedings of the 2017 IEEE International Geoscience and Remote Sensing Symposium (IGARSS), Fort Worth, TX, USA, 23–28 July 2017; pp. 5245–5248. [Google Scholar]
- He, Z.; Li, S.; Lin, S.; Dai, L. Monitoring Rice Phenology Based on Freeman-Durden Decomposition of Multi-Temporal Radarsat-2 Data. In Proceedings of the IGARSS 2018—IEEE International Geoscience and Remote Sensing Symposium, Valencia, Spain, 22–27 July 2018; pp. 7691–7694. [Google Scholar]
- Yonezawa, C. Paddy Rice Field Extraction Using ALOS-2 PALSAR-2 Full Polarimetric Data with Agricultural Parcel Vector Data. In Proceedings of the IGARSS 2018—IEEE International Geoscience and Remote Sensing Symposium, Valencia, Spain, 22–27 July 2018; pp. 5296–5299. [Google Scholar]
- Open-Data Portal of the Italian National Statistics Institute (ISTAT). Available online: http://dati.istat.it/ (accessed on 30 June 2021).
- Regione Lombardia. Geoportal of the Lombardy Region, Italy. Available online: http://www.geoportale.regione.lombardia.it/ (accessed on 30 June 2021).
- Forino, G.; Nunziata, F.; Mascolo, L.; Pugliano, G.; Migliaccio, M. Rice Mapping and Sowing Date Estimation Using CSK SAR Data. In Proceedings of the 2018 IEEE 4th International Forum on Research and Technology for Society and Industry (RTSI), Palermo, Italy, 10–13 September 2018; pp. 1–4. [Google Scholar]
- Clauss, K.; Ottinger, M.; Leinenkugel, P.; Kuenzer, C. Land Cover/Land Use Mapping in the Mekong Delta, Vietnam, with focus on pond aquaculture and paddy rice utilizing time series of Copernicus Sentinel data. In Proceedings of the EGU General Assembly Conference, Abstracts, Vienna, Austria, 8–13 April 2018; Volume 20, p. 7929. [Google Scholar]
- Zhang, Y.; Yang, B.; Liu, X.; Wang, C. Estimation of rice grain yield from dual-polarization Radarsat-2 SAR data by integrating a rice canopy scattering model and a genetic algorithm. Int. J. Appl. Earth Observ. Geoinform. 2017, 57, 75–85. [Google Scholar] [CrossRef]
- Zhang, X.; Wu, B.; Ponce-Campos, G.; Zhang, M.; Chang, S.; Tian, F. Mapping up-to-date paddy rice extent at 10 m resolution in china through the integration of optical and synthetic aperture radar images. Remote Sens. 2018, 10, 1200. [Google Scholar] [CrossRef] [Green Version]
- Torbick, N.; Chowdhury, D.; Salas, W.; Qi, J. Monitoring rice agriculture across myanmar using time series Sentinel-1 assisted by Landsat-8 and PALSAR-2. Remote Sens. 2017, 9, 119. [Google Scholar] [CrossRef] [Green Version]
- Nelson, A.; Setiyono, T.; Rala, A.; Quicho, E.; Raviz, J.; Abonete, P.; Maunahan, A.; Garcia, C.; Bhatti, H.; Villano, L.; et al. Towards an operational SAR-based rice monitoring system in Asia: Examples from 13 demonstration sites across Asia in the RIICE project. Remote Sens. 2014, 6, 10773–10812. [Google Scholar] [CrossRef] [Green Version]
- Topouzelis, K.; Singha, S.; Kitsiou, D. Incidence angle normalization of Wide Swath SAR data for oceanographic applications. Open Geosci. 2016, 8, 450–464. [Google Scholar] [CrossRef] [Green Version]
- Chen, C.F.; Huang, S.W.; Son, N.T.; Chang, L.Y. Mapping double-cropped irrigated rice fields in Taiwan using time-series Satellite Pour I’Observation de la Terre data. J. Appl. Remote Sens. 2011, 5, 053528. [Google Scholar] [CrossRef]
- Sianturi, R.; Jetten, V.G.; Sartohadi, J. Mapping cropping patterns in irrigated rice fields in West Java: Towards mapping vulnerability to flooding using time-series MODIS imageries. Int. J. Appl. Earth Obs. Geoinform. 2018, 66, 1–13. [Google Scholar] [CrossRef]
- Tsyganskaya, V.; Martinis, S.; Marzahn, P.; Ludwig, R. SAR-based detection of flooded vegetationa—A review of characteristics and approaches. Int. J. Remote Sens. 2018, 39, 2255–2293. [Google Scholar] [CrossRef]
- Boulch, A.; Trouvé, P.; Koeniguer, E.; Janez, F.; Le Saux, B. Learning speckle suppression in SAR images without ground truth: Application to sentinel-1 time-series. In Proceedings of the IGARSS 2018—IEEE International Geoscience and Remote Sensing Symposium, Valencia, Spain, 22–27 July 2018; pp. 2366–2369. [Google Scholar]
- Khabbazan, S.; Vermunt, P.; Steele-Dunne, S.; Ratering Arntz, L.; Marinetti, C.; van der Valk, D.; Iannini, L.; Molijn, R.; Westerdijk, K.; van der Sande, C. Crop Monitoring Using Sentinel-1 Data: A Case Study from The Netherlands. Remote Sens. 2019, 11, 1887. [Google Scholar] [CrossRef] [Green Version]
Figure 1.
Map of the province of Pavia, Italy.

Figure 2.
Overlapping of two descending Sentinel-1 orbits over the region of interest (ROI). Orbit number 66 (top left) and orbit number 168 (bottom right) overlap around our ROI. Background map from Google Maps ©.
Figure 2.
Overlapping of two descending Sentinel-1 orbits over the region of interest (ROI). Orbit number 66 (top left) and orbit number 168 (bottom right) overlap around our ROI. Background map from Google Maps ©.

Figure 3.
Procedure for generation of SAR backscatter time-series.

Figure 4.
Comparison between (a) the reference rice field SAR time-series and other time-series samples: (b) sample rice paddy field, and (c) non-rice agricultural field. Horizontal axes report the order number of acquisitions, and span one calendar year. The left end is the first satellite pass in the year, and the right end the last one.

Figure 5.
Mitigation of high-frequency noise. LPF stands for Low-Pass Filter.

Figure 6.
Plot of frequency spectrum magnitude for the reference rice field. Please note that the horizontal axis is normalized to the Nyquist frequency .
Figure 6.
Plot of frequency spectrum magnitude for the reference rice field. Please note that the horizontal axis is normalized to the Nyquist frequency .

Figure 7.
Smoothed, typical rice field SAR time-series. The horizontal axis is denominated by satellite pass count, and the blue band between 30 and 50 roughly marks the typical rice paddy field flooding period in April/May. The parameters and represent the height above the minimum of the peaks on the two sides of the spring reflectivity plunge associated with the customary, longest flooding period. In the proposed classification algorithm, and are compared with a threshold in the process.

Figure 8.
Scheme of the proposed method. The parameters and represent the height above the minimum of the peaks on the two sides of the reflectivity minimum.
Figure 8.
Scheme of the proposed method. The parameters and represent the height above the minimum of the peaks on the two sides of the reflectivity minimum.

Figure 9.
Some examples of field samples and corresponding original and low-pass filtered SAR time-series. The two upper examples refer to rice paddy fields, whereas the two lower ones refer to other types of crops.
Figure 9.
Some examples of field samples and corresponding original and low-pass filtered SAR time-series. The two upper examples refer to rice paddy fields, whereas the two lower ones refer to other types of crops.

Figure 10.
Overall Accuracy as function of the distance threshold . A connecting line is added between points to increase visibility.
Figure 10.
Overall Accuracy as function of the distance threshold . A connecting line is added between points to increase visibility.


Table 1.
Statistical features of minima in training-set SAR series, before (center column) and after (right column) low-pass filtering.
Table 1.
Statistical features of minima in training-set SAR series, before (center column) and after (right column) low-pass filtering.
| Parameter | Value (Unfiltered) | Value (Filtered) |
|---|---|---|
| earliest DoY | 113 | 116 |
| latest DoY | 150 | 147 |
| average ( ) DoY | 129.13 (May 9th) | 133.00 (May 13th) |
| std.dev. ( ) (days) | 10.74 | 8.80 |
| ine average notch value (dB) | −21.807 | −17.01 |
| std.dev. notch value (dB) | 1.32 | 2.51 |
Publisher’s Note: MDPI stays neutral with regard to jurisdictional claims in published maps and institutional affiliations. |
© 2021 by the authors. Licensee MDPI, Basel, Switzerland. This article is an open access article distributed under the terms and conditions of the Creative Commons Attribution (CC BY) license (https://creativecommons.org/licenses/by/4.0/).
Share and Cite
MDPI and ACS Style
Marzi, D.; Dell’Acqua, F. Mapping European Rice Paddy Fields Using Yearly Sequences of Spaceborne Radar Reflectivity: A Case Study in Italy. Earth 2021, 2, 387-404. https://0-doi-org.brum.beds.ac.uk/10.3390/earth2030023
AMA Style
Marzi D, Dell’Acqua F. Mapping European Rice Paddy Fields Using Yearly Sequences of Spaceborne Radar Reflectivity: A Case Study in Italy. Earth. 2021; 2(3):387-404. https://0-doi-org.brum.beds.ac.uk/10.3390/earth2030023
Chicago/Turabian StyleMarzi, David, and Fabio Dell’Acqua. 2021. "Mapping European Rice Paddy Fields Using Yearly Sequences of Spaceborne Radar Reflectivity: A Case Study in Italy" Earth 2, no. 3: 387-404. https://0-doi-org.brum.beds.ac.uk/10.3390/earth2030023