
Africa GreenCo and the Independent Off-Taker Model: Beyond ‘Single-Buyer’ Power Markets and Uncreditworthy Utilities †

1
Impact Research, Africa GreenCo, Woodlands, 15101 Lusaka, Zambia
2
Department of Economics, School of Oriental & African Studies, 10 Thornhaugh St., London WC1H 0XG, UK
†
Presented at the ICSD 2021: 9th International Conference on Sustainable Development, Virtual, 20–21 September 2021.
Environ. Sci. Proc. 2022, 15(1), 54; https://0-doi-org.brum.beds.ac.uk/10.3390/environsciproc2022015054
Published: 20 May 2022
(This article belongs to the Proceedings of The 9th International Conference on Sustainable Development)
Abstract
:Africa GreenCo is challenging the existing model of how new private-sector-funded grid-scale power is brought online. By introducing the first non-government-owned buyer of renewable energy in sub-Saharan Africa—a region with few creditworthy public utilities—GreenCo will act as a bankable counterparty for independent power producers. The company aims to catalyse private investment and boost the growth of additional clean generation capacity in support of climate change mitigation, adaptation, and energy access. The paper reviews modelled investment- and climate resilience impacts.
1. Introduction
Africa GreenCo (GreenCo) is introducing the first independent (non-government-owned) buyer of renewable energy in sub-Saharan Africa (SSA). GreenCo will act as a creditworthy counterparty for independent power producers (IPPs) to support the growth of additional generation capacity.
Currently, the majority of the utilities in the region are publicly owned and face significant financial and other challenges, which constrain their ability to expand and maintain good-quality power services [1].
GreenCo is challenging the existing model of how new grid-scale generation is brought online, which is currently reliant on a single offtake arrangement between a public utility and infrastructure developer. Where the regulator has put in place a feed in tariff or auction structure, a power purchase agreement (PPA) will be set up. This ensures that the dollar rate per kilowatt hour paid to the developer is fixed for the economic life of the asset. The state entity will commit to ‘take or pay’, and, typically, the government is required to guarantee the PPA of the public utility (in part or full) to make the entire transaction bankable. In the case of non-payment by the public utility to the IPP, the sovereign guarantee is activated, and the government commits to cover the financial obligation. In SSA, the process of structuring and implementing PPAs repeatedly fails, mainly due to the poor creditworthiness of the public utilities and national governments [2].
For the private investor, financing a project with an uncreditworthy counterparty comes at a high cost, which, when combined with technology and macro risks, may explain the spreads observed in the discount rates of renewable energy (RE) infrastructure projects in developing and developed economies (see Ref. [3] on heterogeneity within each group). To reach financial close, the range of project risks will have been allocated, mitigated, or transferred in a way that satisfies all stakeholders [2]. This process has presented a unique set of challenges for RE projects in developing economy contexts, where PPAs are regarded as cornerstone instruments and poor PPA quality undermines the investment rationale.
Alternative measures to mitigate counterparty risk, such as liquidity support instruments, early termination buyout regimes, and partial risk guarantees, do exist, but they are complicated and expensive to negotiate on a project-by-project basis. Where they are implemented, such instruments do not fully capture the perceived risk of these fixed asset investments. They are, likewise, heavily reliant on concessional capital and support from development finance institutions [4]. The literature also raises important political economy questions vis-à-vis traditional derisking interventions, such as sovereign guarantees, which socialise the investment risk among the taxpayers of the developing economy, while the commercial benefits of the project are reserved for private investors [5,6]. In markets where GreenCo acts as an independent off-taker, the requirement for sovereign guarantees will be reduced or removed.
The following pages consider the impact of the Africa GreenCo business model in addressing the limitations associated with the single-buyer model in the region’s power markets, particularly as they relate to the aims of the Paris Agreement and relevant energy and climate sustainable development goals (SDGs). Specifically, these are a shortage of investment and insufficient diversification of energy sources in the region’s fuel mix.
2. Insufficient Investment
2.1. The Challenge
Africa needs a decade of significant investment into low-emissions-intensity and climate-resilient power infrastructure to meet the high watermark of the SDGs and other electricity access and electricity ‘greening’ initiatives: Goal 7 of the SDGs targets universal access to clean, modern, and reliable energy by 2030; Goal 13 calls for urgent action to combat climate change and its effects; the Paris Agreement aims at a reduction in greenhouse gases to limit global warming to well below 2 degrees centigrade; Agenda 2063 of the Africa Union targets both a 50% increase in electricity generation and distribution, and for 70% of Africans to have access to electricity by 2023 [7]. These initiatives are commonly employed as the basis for a pro-investment case, particularly in renewable energy, in which coalitions of capital, with a prominent role for the private sector, are to bankroll the spending necessary to acquire infrastructure and deliver energy access along sustainable pathways.
A number of assessments are doubtful regarding the outlook for achieving these targets [8,9,10]. Investment has failed to scale to the heights of policy intentions. However, with the right level of finance, it would be possible to install 310 gigawatts (GW) of clean renewable electricity—roughly 40% of the continent’s current total electricity generation capacity—to meet nearly a quarter of Africa’s projected energy needs by the end of this decade [11]. To achieve this would require average annual investment of USD 70 billion until 2030. Yet, annual clean energy financing across SSA reached around a tenth of that figure in 2018, at USD 7.4 billion [12]. Some 56% of that sum went to South Africa, the continent’s second largest and arguably most advanced economy.
Several macroeconomic and microeconomic challenges are given to explain the shortage of public investment in the power sector. At the macro level, for local governments, access to finance through sovereign debt raising—a typical method for raising public infrastructure finance—is constrained by poor credit ratings across SSA (and, thus, a high cost of borrowing on international markets) and subdued local capital market development [13]. Debt distress, which was a feature of many African economies prior to the economic catastrophe of the COVID-19 pandemic, significantly weakens the borrowing potential of Africa’s sovereigns. Considering the costly response to the pandemic, the African Development Bank estimates that the average debt-to-GDP ratio in Africa is expected to increase significantly to over 70%, from 60% in 2019 [14]. The corollary is a tightening of fiscal space in the public sector as debt interest payments rise—making a dire fiscal situation worse. In 2018, Southern African Power Pool (SAPP) members were paying 33% more in debt servicing as a percentage of gross national income than the average across sub-Saharan Africa. In single-buyer markets, when added to the fiscal constraints of sovereign guarantees, the above range of factors combine to create a ‘sovereign ceiling’ for public power sector investment and public enablement of private investment.
At the micro level, there are also issues of governance and the (mis)management of public finances, which complicate or impair the public response to infrastructure development challenges. Primarily, public utilities have struggled to integrate break-even or profitable business models. One key challenge is the provision of service below cost, which has the added complication of being tied up with government policy orientation. A 2016 study by the World Bank [1] discovered that, across electricity utilities in 39 countries in SSA, only the Seychelles and Uganda were achieving full operational and capital cost recovery, while as few as 19 successfully generate revenues to cover operating costs. As an indicator of financial ill-health in the sector, quasi-fiscal deficits (QFDs) (i.e., the revenue–expenditure gap of the public utility company) averaged 1.6% of the GDP across SSA, according to the study, and exceeded 3% of the GDP in several countries [1,15]. Based on data from the same study [15], the situation is most acute in southern Africa, where QFDs as a share of the GDP among the members of the SAPP are 140% higher than the next most indebted regional power sector (Table 1).
In Zambia, for example, executives at the state-owned power company, ZESCO, like their regional counterparts, have faced pressure to cap consumer tariffs, while inadequate revenue collection processes undercut their ability to make back the cost of supplying electricity [16]. Nearing the peak of its fiscal crisis and sovereign default, Zambia’s finance minister conceded that foreign currency arrears incurred by state-owned enterprises were weighing on the sovereign balance sheet. The aggregate amount at the end of June 2020 was approximately USD 1.29 billion, nearly 6% of the GDP in 2019. This balance comprised guaranteed and non-guaranteed sums, mostly incurred by ZESCO, through arrears on power purchase agreements [17]. At a sufficiently grand scale, then, the use of implicit subsidies arising from under-pricing and ineffective (or non-existent) metering and billing practices can create financially unsustainable losses that contribute to systemic fiscal weakness and undermine public investment [18]. However, at the company level alone, financial disarray within state-owned utilities limits their ability to credibly enter contractual arrangements with private sector players that would develop new power plant infrastructure.
2.2. GreenCo Impact
As discussed, the financial unviability of SSA’s utilities remains a significant constraint to private investment in electricity generation. Among the SAPP countries (Angola, Botswana, Democratic Republic of Congo, Eswatini, Lesotho, Mozambique, Malawi, Namibia, South Africa, Tanzania, Zambia, and Zimbabwe), where GreenCo will focus its operations, a 2017 master plan document, the SAPP Pool Plan, identified at least USD 121 billion worth of generation capital expenditure (capex) in the period to 2040 (2017 net present value (NPV); the estimate accounts for regional demand projections, national energy security considerations, and trade between countries (referred to as the ‘Realistic Integration Scenario’)) [19]. GreenCo estimates that, of the additional capacity earmarked for commissioning between 2017 and 2019, some 55% did not materialise, measured in megawatts (MW), and approximately 20% had failed to reach the commercial financing stage (based on assessing a sample of projects). An analysis of academic and grey literature supports the GreenCo view that PPA quality is determinative in investment decisions and likely lies behind a substantial portion of these failed investments. A qualitative analysis of the projects that have not come online in that time also indicates a growing threat to large coal-fired power plants, approximately 1GW of which appears to have been shelved or stranded and a further 2.5+GW has been delayed with significant cost overruns and legal challenges.
Governments within the SAPP are aware of the difficulty of coaxing private investment and forecast that 74% of additional capacity in the next 3 years will have to be publicly financed [20]. Using that figure across the cost projections (2022–2040) of the SAPP Pool Plan’s ‘realistic integration scenario’ (a planning-software-based scenario optimised against real-world constraints), GreenCo estimates roughly USD 20 billion (2022 net present value) in IPP investments will be needed to meet the demands of the regional master plan. This is a conservative estimate as the ratio of private to public finance in generation capital expenditure will likely narrow. Assuming a 35% contribution to generation capex from the private sector in the period of 2030 to 2040, the demand for commercial investment rises to USD 24 billion (Table 2).
The perception of GreenCo as a creditworthy off-taker is critical to the operating strategy and sustainability of the business model. The effect of GreenCo’s creditworthiness is a lower cost of capital for IPP developers, which, even after a margin is added, still delivers lower wholesale electricity tariffs for PSA off-takers. One approach to clearly demonstrate GreenCo’s creditworthiness to financiers of the IPP is to ensure that its capital structure includes a guarantee base sufficient to cover the commercial debt lent to IPPs in its PPA portfolio, and an equity base to act as a liquidity buffer. This liquidity buffer will enable GreenCo to exercise its risk mitigation strategies (in the event that the PSA counterparty defaults) and even incur some losses in the process without utilising the capital allocated to cover commercial debt [4].
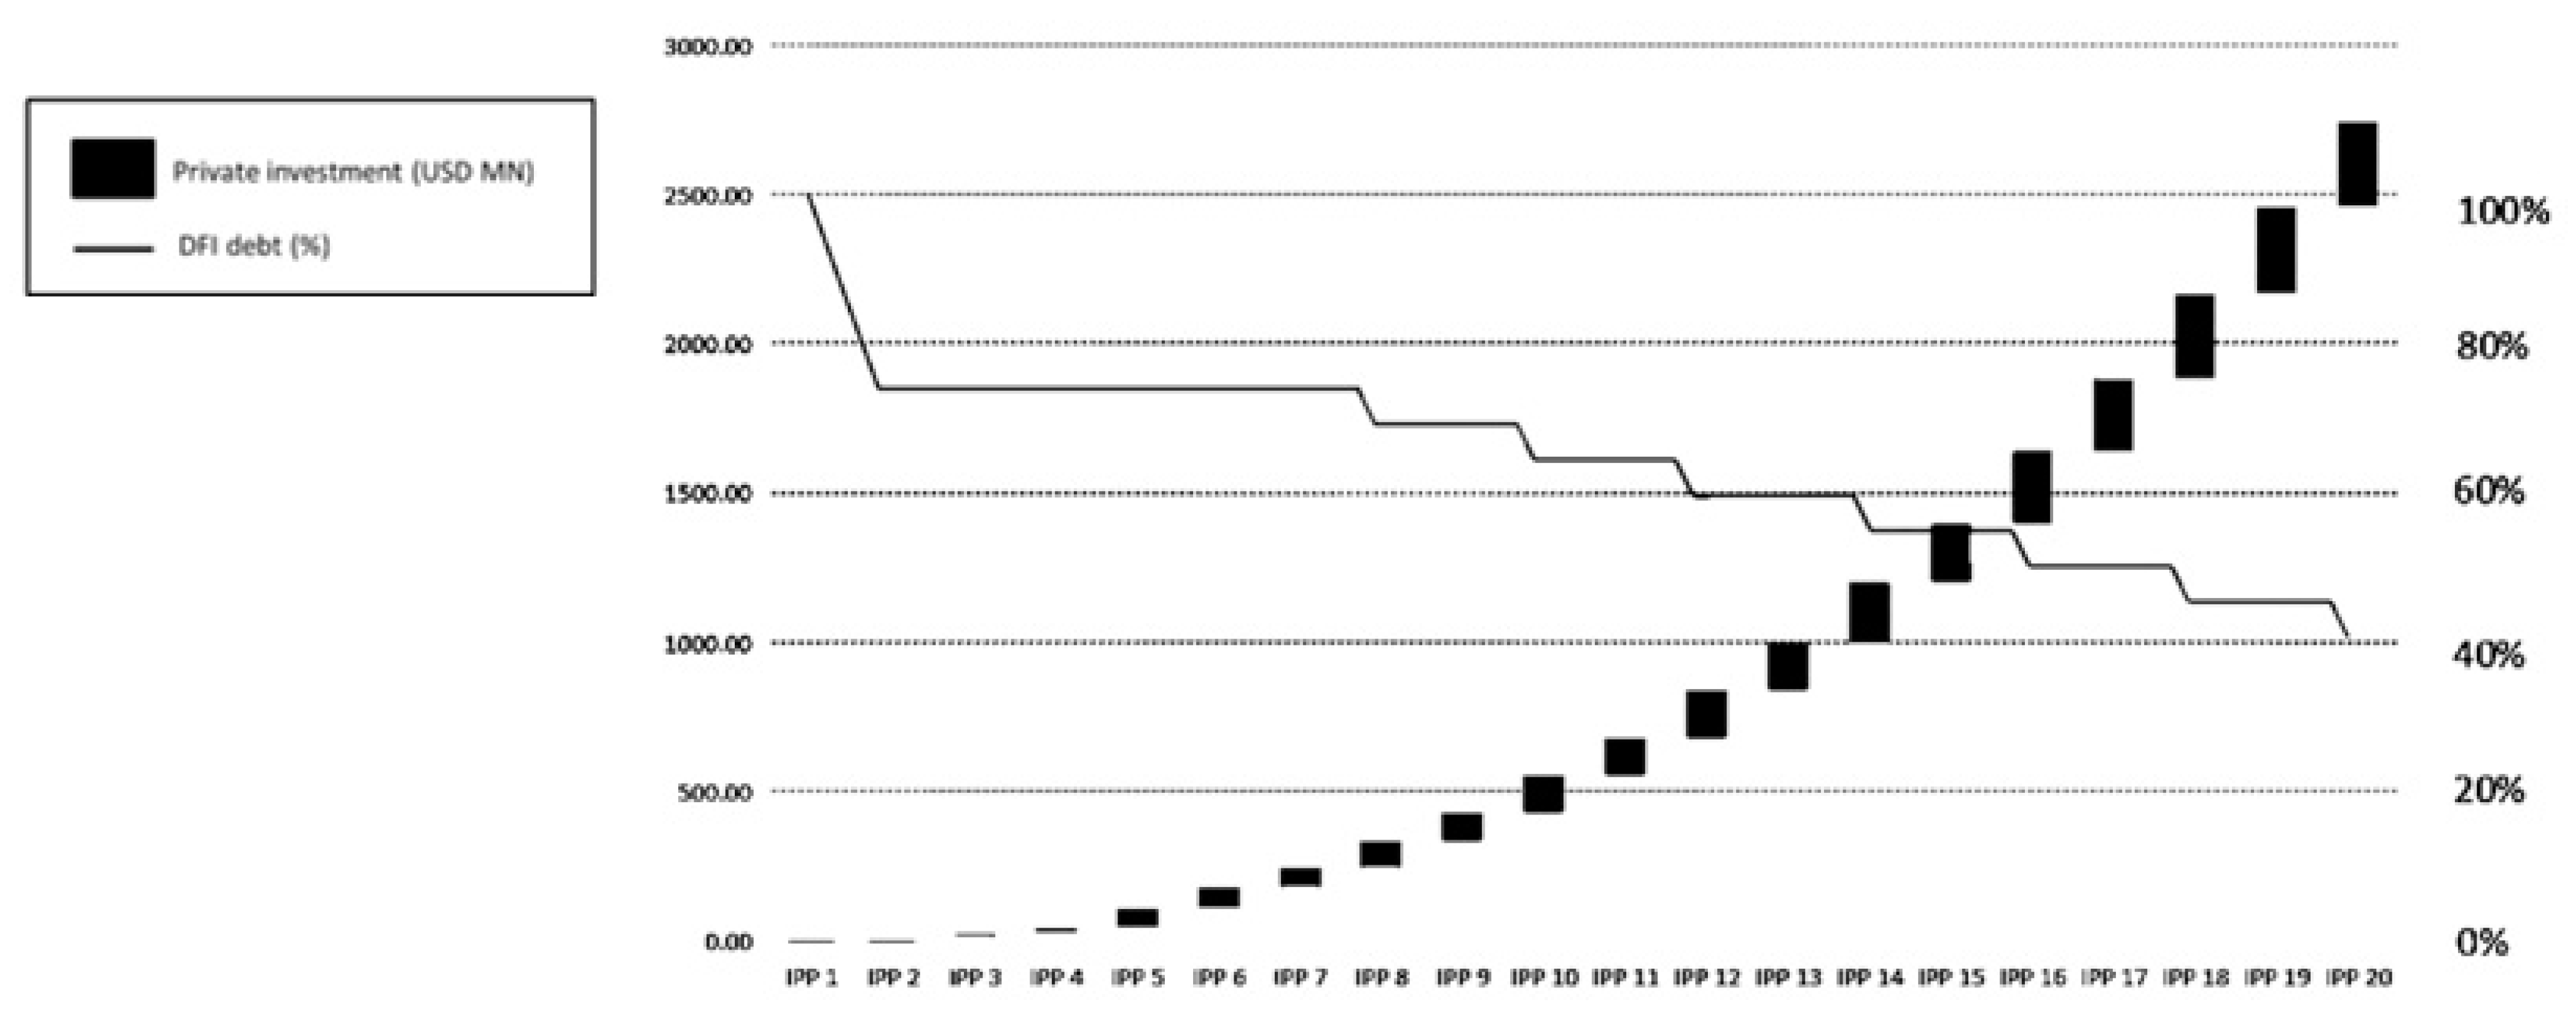
Based upon its modelled portfolio (2021–2031), GreenCo will deliver 2.5 GW of greenfield renewable energy to the SAPP region at an estimated total investment cost of USD 4.7 billion. The use of DFI debt finance to guarantee commercial lending is an option in the early stage but would fall as a portion of IPP costs over the period. Private capital mobilised by the GreenCo model is estimated at USD 2.7 billion (Figure 1), a contribution of between 11.5% and 14% to total private investment in the SAPP (2022–2040). To put this in perspective, GreenCo’s modelled contribution is more than four times (400%) the forecasted investment of all the SAPP countries across non-hydro renewables in a comparable time period (2022–2031, 2017 NPV) in a 2017 ‘pre-masterplan’ stated policies scenario. With successful implementation, GreenCo’s model would make a vital contribution to realising (and, in some cases, stretching) the region’s investment objectives.
3. Climate Resilience
While the direct climate change mitigation impacts of an RE portfolio such as GreenCo’s are significant, they are also well understood by a wide audience and easily calculated using standard methodologies. Instead, GreenCo’s potential impact on the climate resilience of the SAPP is the focus of this section.
3.1. The Challenge
Africa’s economies are ill-equipped to contend with their ‘maximum vulnerability’ to the effects of climate change and climate shocks [21]. The continent’s high population growth, overreliance on subsistence agriculture, high water dependency for power, and low fiscal capacity to respond to shocks constitute a state of high climate-related exposure and low resilience.
National climate vulnerability is generating greater systemic risk for the power sector in SSA. Of the eleven SSA nations with a more than 50% dependency on large hydro (>50 MW), six are SAPP members (Angola, DRC, Malawi, Mozambique, Namibia, and Zambia) and make up 20% of the installed capacity in the SAPP. El-Niño-induced droughts, predicted to occur more frequently as average global temperatures rise, mark this reliance as climate vulnerability [22]. The region’s national utility companies are cash poor and typically unable to adapt fully in the face of lost capacity. SAPP data show that Angola, Botswana, the DRC, Malawi, South Africa, Tanzania, and Zimbabwe all had installed capacities greater than their peak demand in 2016, yet they all experienced capacity shortfalls in that drought-stricken year [22]. In such cases, diesel back-up capacity and emergency imports come at a great cost (and with higher emissions). As a result, utilities resort to ‘load shedding’, brownouts, and blackouts to manage the allocation of a scarce resource. According to a model published by the World Bank, for a handful of hydro-dependent nations in SSA, the use of emergency power obtained by expensive short-term lease due to drought can increase utility deficits by more than 1% of the GDP in certain scenarios [15]. The case, briefly outlined in the introduction of ZESCO in Zambia and the droughts that derailed the utility and the economy, is a cautionary tale [16].
Among several southern African nations, the electricity supply is overly dependent on the water levels in the Zambezi basin [23]. However, an assessment of adaptation and vulnerability published in 2014 by the Intergovernmental Panel on Climate Change forecasted that the region can expect harsher and more frequent droughts in the coming decades [16,23]. Another review suggests that the Zambezi hydropower output could decline by 10 to 20% under a drying climate [24]. Arguably, for these riparian states, hydropower’s techno-economic advantages of being cost-efficient and flexible have negative returns to scale at high levels of dependency, raising questions about the suitability of pursuing greater electricity access through heavy investment in large-scale hydro [25].
In pursuit of the Paris Agreement aims and energy security, there is a need to improve the share of other RE sources in the energy mix, such as solar and wind. Evidence suggests that the current policy pathway is at odds with this stance. In southern Africa, for example, 89% of the new hydro capacity is planned for the Zambezi basin [26]. While not all the areas of the basin are equally drought-prone, the trending hydroclimatic unpredictability is not compatible with the current policy outlook.
One way to explain this policy inflexibility in the face of incremental downside risk is the idea that energy transitions are not purely technical but also socio-political. Unlike entirely technical or techno-economic transitions, socio-technical transitions often encounter multifaceted headwinds that disadvantage movement away from incumbent technological structures [27]. At an intuitive level, with dominant technologies comes an expensive and painstakingly established architecture of skills and training institutions, inelastic regulatory and technical capacity within energy ministries and utilities, and existing upstream and downstream infrastructure with associated jobs. The academic literature also points to the evidence of ‘lock-in’ effects of dominant technologies in the energy mix. Semieniuk and Mazzucato [10] show that financing flows and specific sources of finance create innovation pathways as certain technologies are deployed, proven, and de-risked, resulting in a lower cost of capital in subsequent projects. Ahmed [22] considers Zambia’s commitment to large hydro infrastructure, even following droughts in 2015, 2016, and 2019, and suggests a deep (‘third degree’) path dependency now exists that is based on initial conditions (such as early financial support for hydropower from multilateral development banks) and ignores new information that implies course correction is required. Important political economy dynamics are thought to contribute to lock-in [28,29].
Whether path dependency encroaches more directly in markets with a dominant single player is unclear. It is plausible, however, that multiple actors with a wider pool of capital and stakeholders, and a broader array of strategic objectives, might behave less uniformly and be capable of delivering power generation infrastructure that contributes to greater diversification (including diversity of scale) and climate resilience.
3.2. GreenCo Impact
A comparison of portfolio energy mixes (GreenCo forecast portfolio versus SAPP forecast additional capacity) shows an equal split among solar PV, wind, and small-hydro in GreenCo’s indicative portfolio (2021–2031) compared to a substantial addition of large hydropower capacity across the SAPP based on the masterplan projections (2021–2031). However, as discussed, it is right to account for the outsized effect of dominant technologies on market concentration and possible future dependency. The empirical evidence is supportive; there are few historical cases of developing economies that have charted a path out of hydro-dependency. By adopting the Herfindahl–Hirschman Index (HHI), typically used to measure market concentration as an indicator of competition, we can more appropriately capture the significance of dominant technologies. A similar approach is used by Rubio-Varas and Muñoz-Delgado [30] in conceptualising their Energy Mix Concentration Index (EMCI). The HHI method takes the sum of squared market shares for all energy sources in an economy in period (t).
Adapted from their work:
where xi is the percentage share of the energy source i in the energy mix. Smaller values of the HHI indicate greater diversification [30]. Table 3 below proposes two dynamic SAPP EMCI scenarios: (a) SAPP Pool Plan capacity additions in the ‘realistic integration case’ 2021–2031; (b) SAPP Pool Plan capacity additions in the ‘realistic integration case’ with GreenCo capacity additions, 2021–2031. The simplifying assumptions are an equally weighted split of GreenCo’s additional 2.5 GW across solar PV, small hydro, and wind, and an equally weighted displacement of new fossil fuel and large hydropower capacity across the period. In each case, the HHI is calculated. As a point of reference, the HHI for SAPP’s existing stock of generating assets (2018) is 4190, with coal being the dominant technology (60% share of the energy mix) [20].
Evidently, continued and significant investment in large hydro is built into the current SAPP masterplan projections. The data show that, with GreenCo’s contribution to new capacity, SAPP can see a slight improvement in the diversification of capacity additions, but, in both cases, the concentration of hydro is high. In terms of emissions reduction, however, the fall in new coal capacity in the GreenCo-impacted case is a positive indicator. Focusing policymakers’ attention on the concentration impacts of additional capacity (i.e., ∆HHI) in 5-to-10-year periods, for example, may help to improve the accountability of investment decision-making and align the narrative of climate-resilient power infrastructure more closely to the policy cycle.
Beyond fuel mix concentration, another indicator for resilience is capacity utilisation in various climate scenarios. Emerging from the recent literature are useful quantitative starting points for further climate modelling. As Ahmed notes [22], there are nearly two decades of forecasting that point to harsher and more frequent drought and low reservoir levels in the Zambezi basin, with clear direct impacts for hydropower capacity factors. As a possible benchmark, comparing 2014 and 2016, the average capacity utilisation rate fell from 71% to 54% across Zambia’s four large hydropower dams as drought struck. Spalding-Fecher and others [24] consider the impact of electricity generation costs due to wet and dry climate in the SAPP region. Across SAPP, they estimate that increases in electricity generation costs are circa $10 billion—representing less than 1% over the long-term but unevenly distributed geographically and in terms of time horizon. Zambia and Mozambique could see hikes of up to 35% in long-term generation costs, being the hardest hit, and as much as 20% in the near-term [24].
Historical performance data of hydropower assets alongside hydroclimatic data will improve the modelling potential to develop a clearer picture of climate resilience in region-specific RE portfolios, as well as in cases where markets are interconnected via power pools and an improvement in the climate resilience in one country has positive network effects. The SAPP Pool Plan makes a useful start in this direction, as does the work of Spalding-Fecher and others [24]. In the medium-term, GreenCo will contribute to this area of research to draw attention to the positive impact that non-traditional electricity market participants can make.
4. Conclusions
The paper has focused on GreenCo’s systemic impact as an enabler of RE investment and its ability to contribute to a more diversified and climate-resilient regional fuel mix in the future. GreenCo will act as an independent off-taker in the SAPP region, entering into sound, bankable, and long-term PPAs with IPPs and securing a diversified pool of energy buyers, whether on a bilateral basis or through short-term local and regional trading.
Ample evidence exists to uphold counterparty creditworthiness and PPA quality as critical determinants of private investment in a single-buyer market. Addressing the ‘sovereign ceiling’ and the financially onerous approach of the existing derisking instruments, the GreenCo intervention demonstrates a pathway of evolution for the regional power sector beyond the flaws of its current structure.
Funding
The author is employed and funded by Africa GreenCo.
Institutional Review Board Statement
Not applicable.
Informed Consent Statement
Not applicable.
Data Availability Statement
Data supporting analysis can be found on the website of the Southern African Power Pool [19].
Conflicts of Interest
The author declares no conflict of interest. The author is employed and funded by Africa GreenCo. The funders had no role in the design of the study; in the collection, analyses, or interpretation of data; in the writing of the manuscript, or in the decision to publish the work.
References
- Trimble, C.; Kojima, M.; Perez Arroyo, I.; Mohammadzadeh, F. Financial Viability of Electricity Sectors in Sub-Saharan Africa: Quasi-Fiscal Deficits and Hidden Costs; World Bank: Washington, DC, USA, 2016. [Google Scholar]
- IRENA. Renewable Energy Finance: Sovereign Guarantees; International Renewable Energy Agency: Abu Dhabi, United Arab Emirates, 2020; Available online: https://www.irena.org/-/media/Files/IRENA/Agency/Publication/2020/Jan/IRENA_RE_Sovereign_guarantees_2020.pdf (accessed on 12 April 2021).
- Steffen, B. Estimating the cost of capital for renewable energy projects. Energy Econ. 2020, 88, 104783. [Google Scholar] [CrossRef]
- GreenCo. Africa GreenCo—An Overview; AGC-AGG: Lusaka, Zambia, 2020. [Google Scholar]
- Bayliss, K.; Bonizzi, B.; Dimakou, O.; Laskaridis, C.; Sial, F.; Van Waeyenberge, E. The Use of Development Funds for De-Risking Private Investment: How Effective Is It in Delivering Development Results? European Parliament’s Committee on Development: Brussels, Belgium, 2020; Available online: https://www.europarl.europa.eu/RegData/etudes/STUD/2020/603486/EXPO_STU(2020)603486_EN.pdf (accessed on 22 June 2021).
- Gabor, D. The Wall Street Consensus. Dev. Chang. 2021, 52, 429–459. [Google Scholar] [CrossRef]
- AUDA-NEPAD. Africa Has the Potential to Make Renewable Energy the Engine of Its Growth; NEPAD: Johannesburg, South Africa, 2020; Available online: https://www.nepad.org/news/africa-has-potential-make-renewable-energy-engine-of-its-growth (accessed on 2 March 2021).
- ESMAP. Chapter 6 Outlook for SDG7. In Tracking SDG7 Report 2021; ESMAP: Washington, DC, USA, 2021; Available online: https://trackingsdg7.esmap.org/data/files/download-documents/2021_tracking_sdg7_chapter_6_outlook_for_sdg7.pdf (accessed on 22 June 2021).
- Begashaw, B. Africa and the Sustainable Development Goals: A Long Way to Go; Brookings: Washington, DC, USA, 2019; Available online: https://www.brookings.edu/blog/africa-in-focus/2019/07/29/africa-and-the-sustainable-development-goals-a-long-way-to-go/ (accessed on 1 May 2021).
- Semieniuk, G.; Mazzucato, M. Working Paper 210: Financing Green Growth; SOAS Department of Economics: London, UK, 2018; Available online: https://www.soas.ac.uk/economics/research/workingpapers/file132132.pdf (accessed on 14 December 2020).
- IRENA. Renewable Power Generation Costs in 2019; International Renewable Energy Agency: Abu Dhabi, United Arab Emirates, 2019; Available online: https://www.irena.org/publications/2020/Jun/Renewable-Power-Costs-in-2019 (accessed on 15 April 2021).
- Bloomberg NEF. Sub-Saharan Africa Market Outlook 2020; Bloomberg NEF, Climatescope: London, UK, 2020; Available online: https://global-climatescope.org/assets/data/docs/updates/2020-02-06-sub-saharan-africa-market-outlook-2020.pdf (accessed on 1 September 2020).
- Baumli, K.; Jamasb, T. Assessing Private Investment in African Renewable Energy Infrastructure: A Multi-Criteria Decision Analysis Approach. Sustainability 2020, 12, 9425. [Google Scholar] [CrossRef]
- AfDB. Debt Dynamics & Consequences. In African Economic Outlook 2021; African Development Bank: Abidjan, Côte d’Ivoire, 2021; Available online: https://www.afdb.org/sites/default/files/2021/03/09/aeo_2021_-_chap2_-_en.pdf (accessed on 10 August 2021).
- Kojima, M.; Trimble, C. Making Power Affordable for Africa and Viable for Its Utilities; World Bank: Washington, DC, USA, 2016; Available online: http://hdl.handle.net/10986/25091 (accessed on 11 April 2021).
- Sam, J. Power, Default, and Water Distress: Lessons from Zambia. Available online: https://joel-sam.medium.com/power-default-and-water-distress-lessons-from-zambia-ef89117be9e (accessed on 11 July 2021).
- MoF. The Republic of Zambia Ministry of Finance (MoF)—Q&As following Zambia’s Presentation to Investors; London Stock Exchange: London, UK, 2020; Available online: https://www.londonstockexchange.com/news-article/16EJ/q-a-follow-up-to-presentation-to-creditors/14712037 (accessed on 1 July 2021).
- Saavalainen, T.; ten Berge, J. Quasi-Fiscal Deficits and Energy Conditionality in Selected CIS Countries; IMF: Washington, DC, USA, 2006; Available online: https://www.imf.org/external/pubs/ft/wp/2006/wp0643.pdf (accessed on 2 July 2021).
- SAPP. SAPP Pool Plan; Southern African Power Pool: Harare, Zimbabwe, 2017; Available online: http://www.sapp.co.zw/sapp-pool-plan-0 (accessed on 1 July 2021).
- SAPP. Annual Rreport of the Southern African Power Pool—2019; Southern African Power Pool: Harare, Zimbabwe, 2019; Available online: http://www.sapp.co.zw/sites/default/files/SAPP%20ANNUAL%20REPORT%202019.pdf (accessed on 22 June 2021).
- Aliyu, K.; Modu, B.; Tan, C. A review of renewable energy development in Africa: A focus in South Africa, Egypt and Nigeria. Ren. Sus. Energy Rev. 2018, 81, 2502–2518. [Google Scholar] [CrossRef]
- Ahmed, I.U. The Political Economy of the Energy Mix of Hydropower Dependent Developing Nations—A Case Study of Zambia. Ph.D. Thesis, University College London, London, UK, February 2021. [Google Scholar]
- IPCC. AR5 Climate Change 2014: Impacts, Adaptation, and Vulnerability; IPCC: Geneva, Switzerland, 2014; Available online: https://www.ipcc.ch/report/ar5/wg2/ (accessed on 10 September 2020).
- Spalding-Fecher, R.; Joyce, B.; Winkler, H. Climate change and hydropower in the Southern African Power Pool and Zambezi River Basin: System-wide impacts and policy implications. Energy Policy 2017, 103, 84–97. [Google Scholar] [CrossRef]
- Trace, S. The Impact of Climate Change on Hydropower in Africa; Oxford Policy Management: Oxford, UK, 2019; Available online: https://www.opml.co.uk/blog/the-impact-of-climate-change-on-hydropower-in-africa (accessed on 27 February 2021).
- Conway, D.; Patrick, C.; Gannon, K. Climate Risks to Hydropower Supply in Eastern and Southern Africa; Grantham Research Institute on Climate Change and the Environment: London, UK, 2018. [Google Scholar]
- Geels, F.W.; Sovacool, B.K.; Schwanen, T.; Sorrell, S. Sociotechnical transitions for deep decarbonization. Science 2017, 357, 1242–1244. [Google Scholar] [CrossRef] [PubMed]
- Baker, L. The evolving role of finance in South Africa’s renewable energy sector. Geoforum 2015, 64, 146–156. Available online: https://0-www-sciencedirect-com.brum.beds.ac.uk/science/article/pii/S0016718515001669 (accessed on 8 December 2020). [CrossRef]
- Fine, B.; Rustomjee, Z. The Political Economy of South Africa: From Minerals-Energy-Complex to Industrialisation; C. Hurst & Co., Ltd.: London, UK, 1996. [Google Scholar]
- Rubio-Varas, M.; Muñoz-Delgado, B. The Energy Mix Concentration Index (EMCI): Methodological considerations for implementation. MethodsX 2019, 6, 1228–1237. [Google Scholar] [CrossRef] [PubMed]
Figure 1.
Private IPP investment across GreenCo modelled portfolio.


Table 1.
The SAPP has the widest quasi-fiscal deficits across Africa’s power pools.
| Power Pool 1 | % GDP |
|---|---|
| Central Africa | 0.62 |
| East Africa | 0.87 |
| West Africa | 1.46 |
| Southern Africa | 2.07 |
1 Data source: Ref. [15]—where country data were available.
Table 2.
Implementing the SAPP Pool Plan will demand significant private investment.
| Private Investment Requirement ′22-′40 (USD bn) | |
|---|---|
| Low | High |
| 19.6 | 23.8 |
Author’s calculations with data from Ref. [19].
Table 3.
GreenCo’s RE portfolio improves fuel mix diversification in the SAPP.
| Energy Source | SAPP Additions ′21-′31 (MW) | SAPP + GreenCo Additions ′21-′31 (MW) |
|---|---|---|
| Natural gas | 4766 | 3933 |
| Coal | 1502 | 669 |
| Hydro small | 890 | 1723 |
| Hydro large | 14,025 | 13,192 |
| Solar thermal CSP | 100 | 100 |
| Solar PV | 120 | 953 |
| Wind | 155 | 988 |
| Total | 21,558 | 21,558 |
| HHI | 4788 | 4192 |
Publisher’s Note: MDPI stays neutral with regard to jurisdictional claims in published maps and institutional affiliations. |
© 2022 by the author. Licensee MDPI, Basel, Switzerland. This article is an open access article distributed under the terms and conditions of the Creative Commons Attribution (CC BY) license (https://creativecommons.org/licenses/by/4.0/).
Share and Cite
MDPI and ACS Style
Sam, J. Africa GreenCo and the Independent Off-Taker Model: Beyond ‘Single-Buyer’ Power Markets and Uncreditworthy Utilities. Environ. Sci. Proc. 2022, 15, 54. https://0-doi-org.brum.beds.ac.uk/10.3390/environsciproc2022015054
AMA Style
Sam J. Africa GreenCo and the Independent Off-Taker Model: Beyond ‘Single-Buyer’ Power Markets and Uncreditworthy Utilities. Environmental Sciences Proceedings. 2022; 15(1):54. https://0-doi-org.brum.beds.ac.uk/10.3390/environsciproc2022015054
Chicago/Turabian StyleSam, Joel. 2022. "Africa GreenCo and the Independent Off-Taker Model: Beyond ‘Single-Buyer’ Power Markets and Uncreditworthy Utilities" Environmental Sciences Proceedings 15, no. 1: 54. https://0-doi-org.brum.beds.ac.uk/10.3390/environsciproc2022015054