Proceeding Paper

Elaboration of the Relationship between the Groundwater Level in Unconfined Aquifer and the Value of Precipitation and Evapotranspiration †

University of Warmia and Mazury in Olsztyn, Department of Geoengineering, Oczapowskiego 2, 10-719 Olsztyn, Poland
Presented at the 4th EWaS International Conference: Valuing the Water, Carbon, Ecological Footprints of Human Activities, Online, 24–27 June 2020.
Published: 13 August 2020

Abstract

:
A very important part of water cycle monitoring is observing atmospheric energy balance (AB) which describes an interaction between atmosphere and land. The AB can be computed as a difference between precipitation (P) and evapotranspiration (EV). In this paper, trends and correlations between the groundwater level in an unconfined aquifer from the National Hydrogeological Service database and values of precipitation and evapotranspiration are part of the assimilation models. Based on the research, it is concluded that, groundwater level changes measured in wells are correlated with P and EV values.

1. Introduction

Groundwater sources are the largest and most important fresh drinking water supplies. Especially in climate conditions characterized by changeable meteorological conditions of variable precipitation rate, it is needed to monitor its state frequently [1]. For an effective groundwater management, the knowledge about groundwater system fluxes is needed [2]. A way of observing and monitoring groundwater level or storage is outflow and inflow examination (pumping and recharge) [3,4]. A very important part here is water infiltration through the saturated zone [5,6]. In groundwater system management, sustainable water management plays a key role, and its principle is that the rate of groundwater recharge is strictly related to the rate of water incharge, which is also dependent upon the rate at which the portion of water can infiltrate, thus escaping by evaporation [4,5].
In this paper, an assessment of the response of unconfined groundwater aquifers to the rate of precipitation and evapotranspiration over hydrological years November 2002–October 2017 using data acquired from well measurement stations published every year in the Bulletins of the National Hydrogeological Service (in Polish: Państwowa Służba Hydrogeologiczna) and from the MERRA-2 model (The second Modern-Era Retrospective analysis for Research and Applications) is presented.

2. Materials and Methods

2.1. MERRA-2

Atmospheric models were determined for the purpose of global, good spatial and time resolution recording of meteorological units, taking into consideration the Earth’s atmosphere. They were created by introducing the data assimilation methodology, such as [7,8], combining satellite and terrestrial observations with GCM (General Circulation Model) simulations in such a way to obtain a statistically optimal result [9].
MERRA2 is a NASA (National Aeronautics and Space Administration) atmospheric reanalysis model that started in 1980 [10]. The model’s aim is to combine model parameters with observations which are irregularly distributed in space and time. A final model presents a spatially complete meteorological database [11]. The data provided by MERRA-2 is in a grid form, at a 0.625° longitude and a 0.5° latitude resolution [10]. Using the web-service: https://giovanni.gsfc.nasa.gov/giovanni/, two sets of data were obtained in a one-month time resolution: precipitation and evapotranspiration. The data were averaged for every month over the two researched areas (the North part: left-down: 15° E, 52° N and right-up: 23° E, 54° N; the South part: left-down: 15° E, 50° N and right-up: 23° E, 52° N); both areas consist of 70 grid cells.
Precipitation can be measured by calculating the rain volume that falls to the Earth’s surface per area unit per time unit. The rainfall rate is used in applications concerning water and energy cycle evaluation, considering environmental and agricultural issues, predicting weather, climate change monitoring, in hydrology applications and natural disaster management [12].
Evapotranspiration is usually computed as the water movement to the air from diverse sources on Earth (such as soil, river basins, ocean, plants, etc.). The rate of evapotranspiration distributed by assimilation models is the volume of water lost from a surface unit per time unit. Evapotranspiration is very important in applications concerning water and atmospheric cycle evaluation, weather and climate prediction models [13].

2.2. Well Measurement in Poland

The National Hydrogeological Service provides measurements (tests on the quantity and quality of groundwater) necessary to assess the quantitative and chemical status of groundwater. These are tasks especially important in the field of management and protection of water resources. In some cases, the measurements were carried out using automatic devices, and the results were transmitted to a database server, which allowed the ongoing assessment of the hydrogeological situation. Depending on the function of a given type of monitoring, measurements were carried out at different time scales. Measurements of the water table were carried out daily at the first order hydrogeological stations or once a week at the second order hydrogeological stations. In some of the first and second order hydrogeological stations, automatic measurements of the groundwater level were introduced [14].
The groundwater level direct measurement data were obtained from the Polish Hydrogeological Annual Reports, from the years of 2002 to 2017 [15]. Polish wells are very diversified, considering the depth and seasonal changes in level. More than one thousand wells are reported, from which 140 wells were selected, 70 in the North part of Poland (young–glacial range) and 70 in the South part of Poland (old–glacial range); the observations were averaged over the specified areas. The selection criteria were as follows:
  • Wells continuously measured throughout the whole period;
  • Only deep wells—deeper than the range of a soil moisture;
  • Omission of wells with atypical infiltration behaviour;
  • Omission of wells near the basins—due to influence of water surface run-off.

3. Discussion

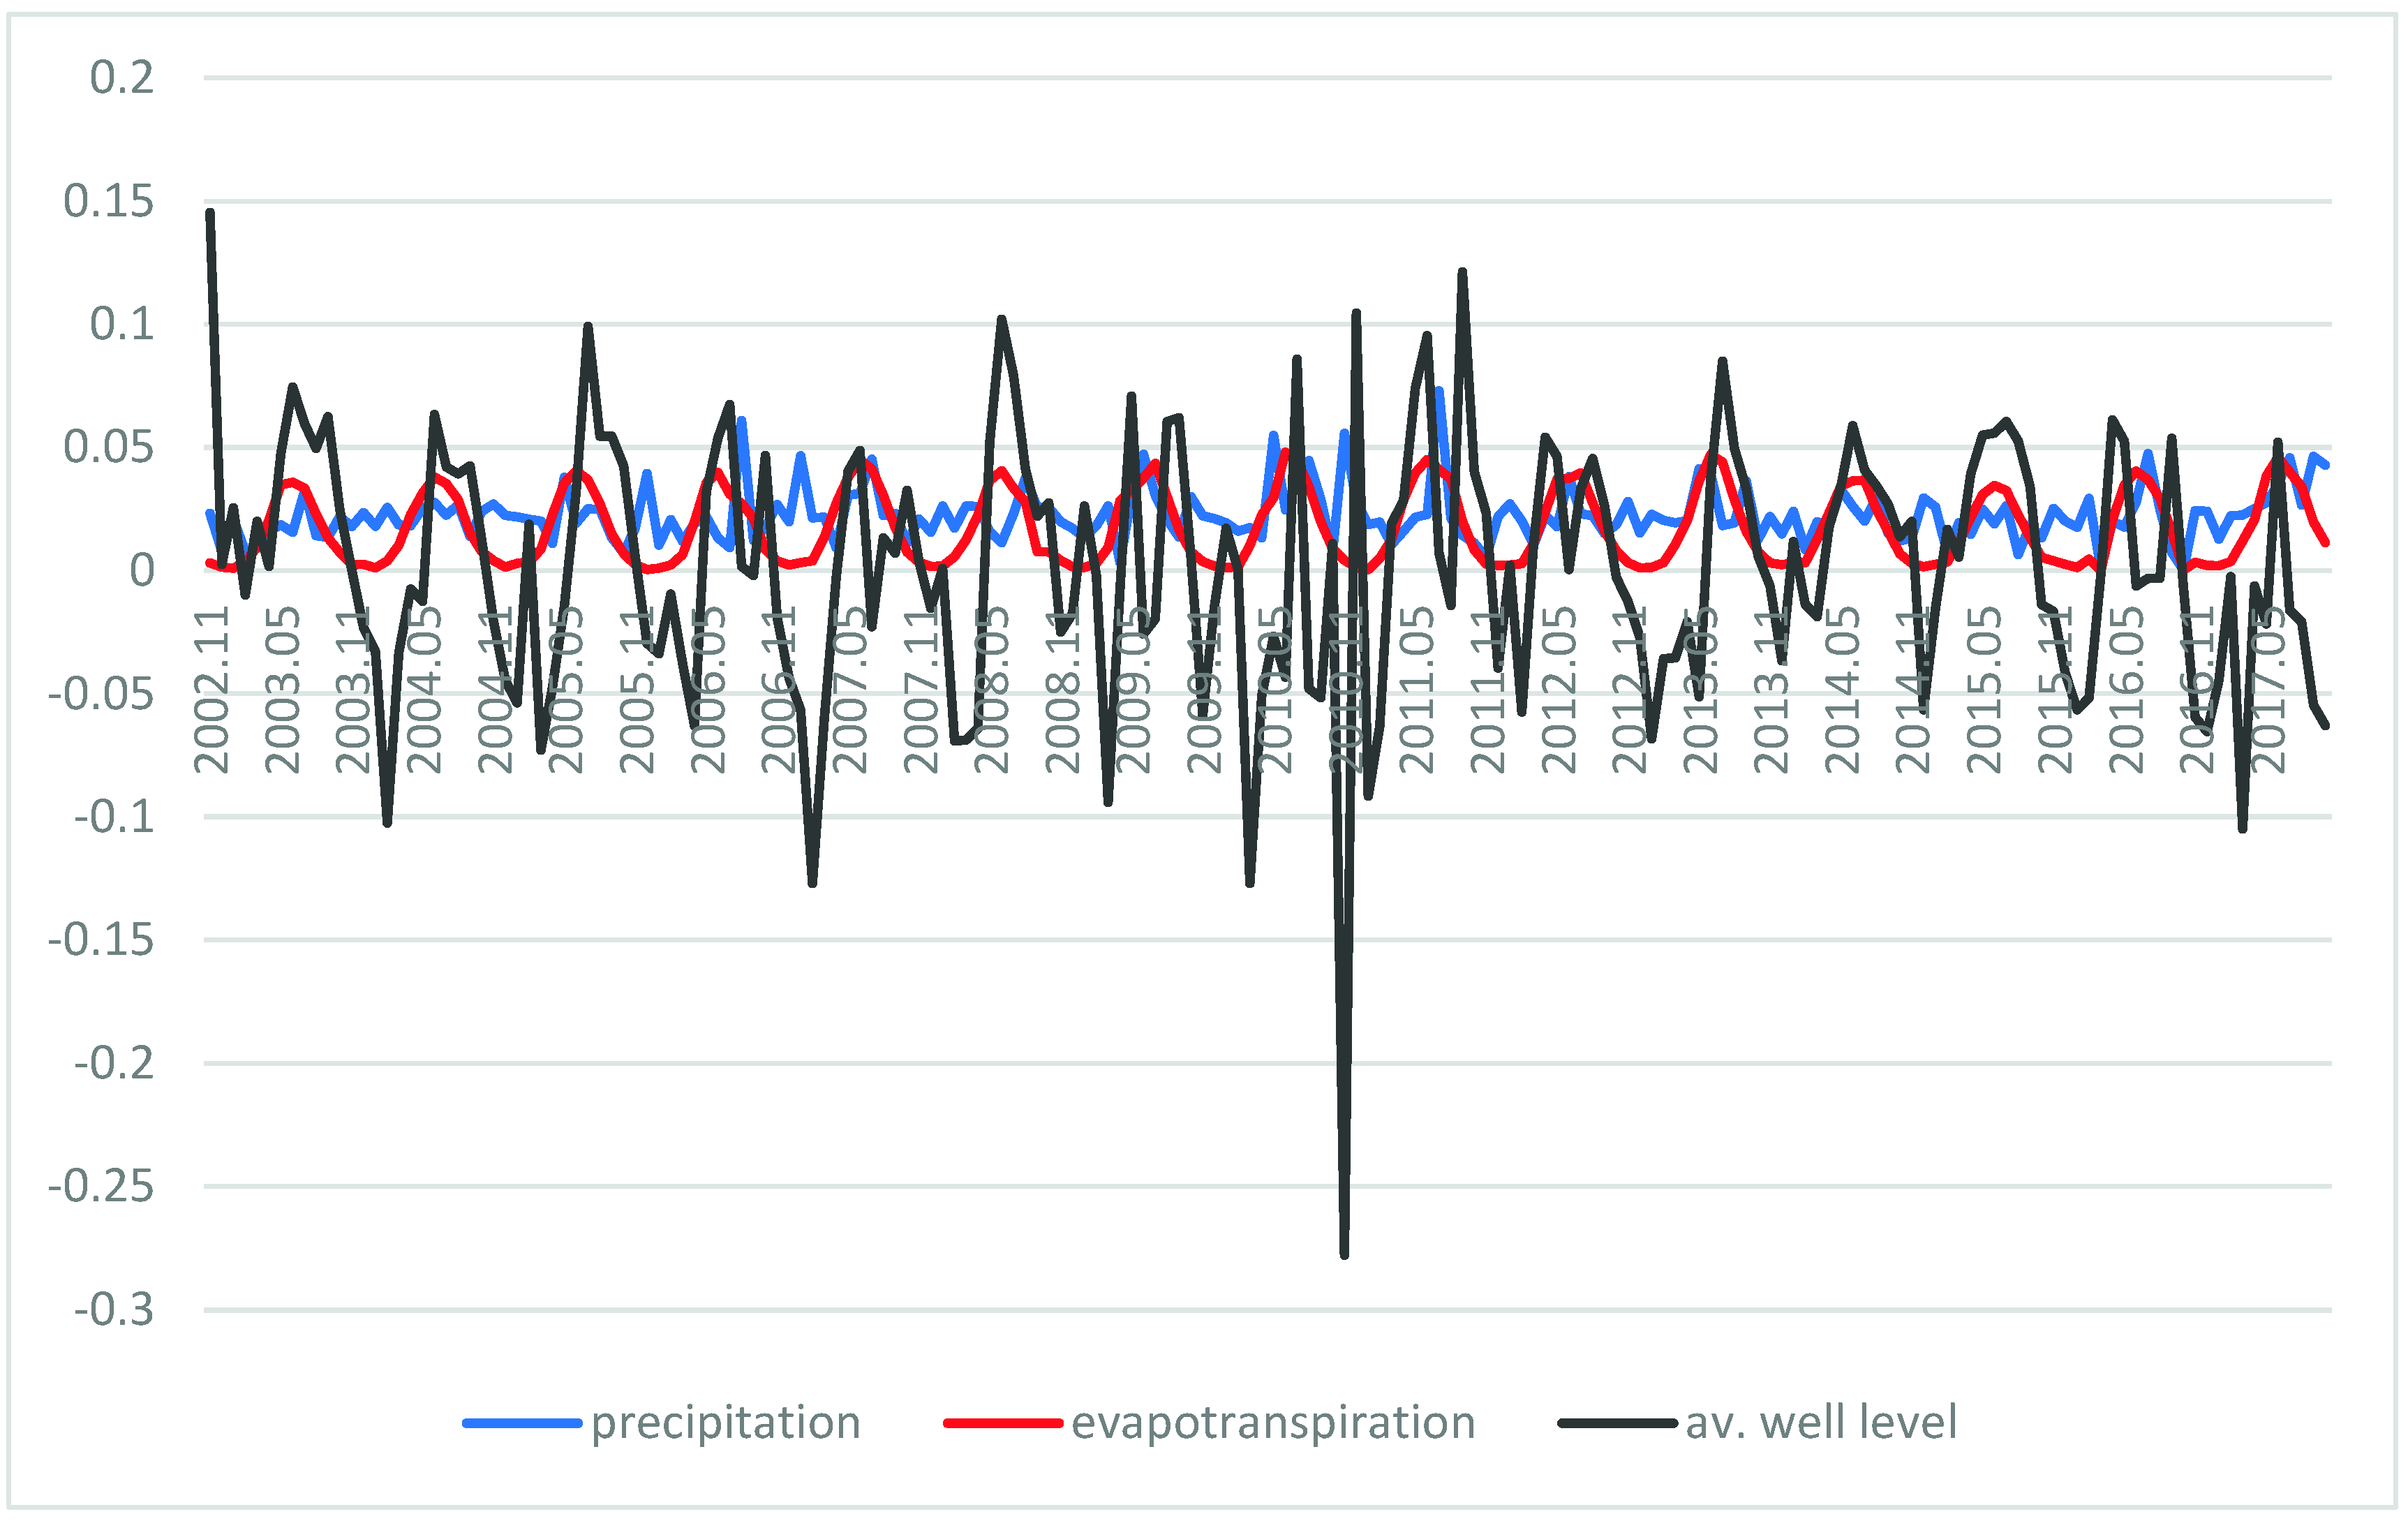
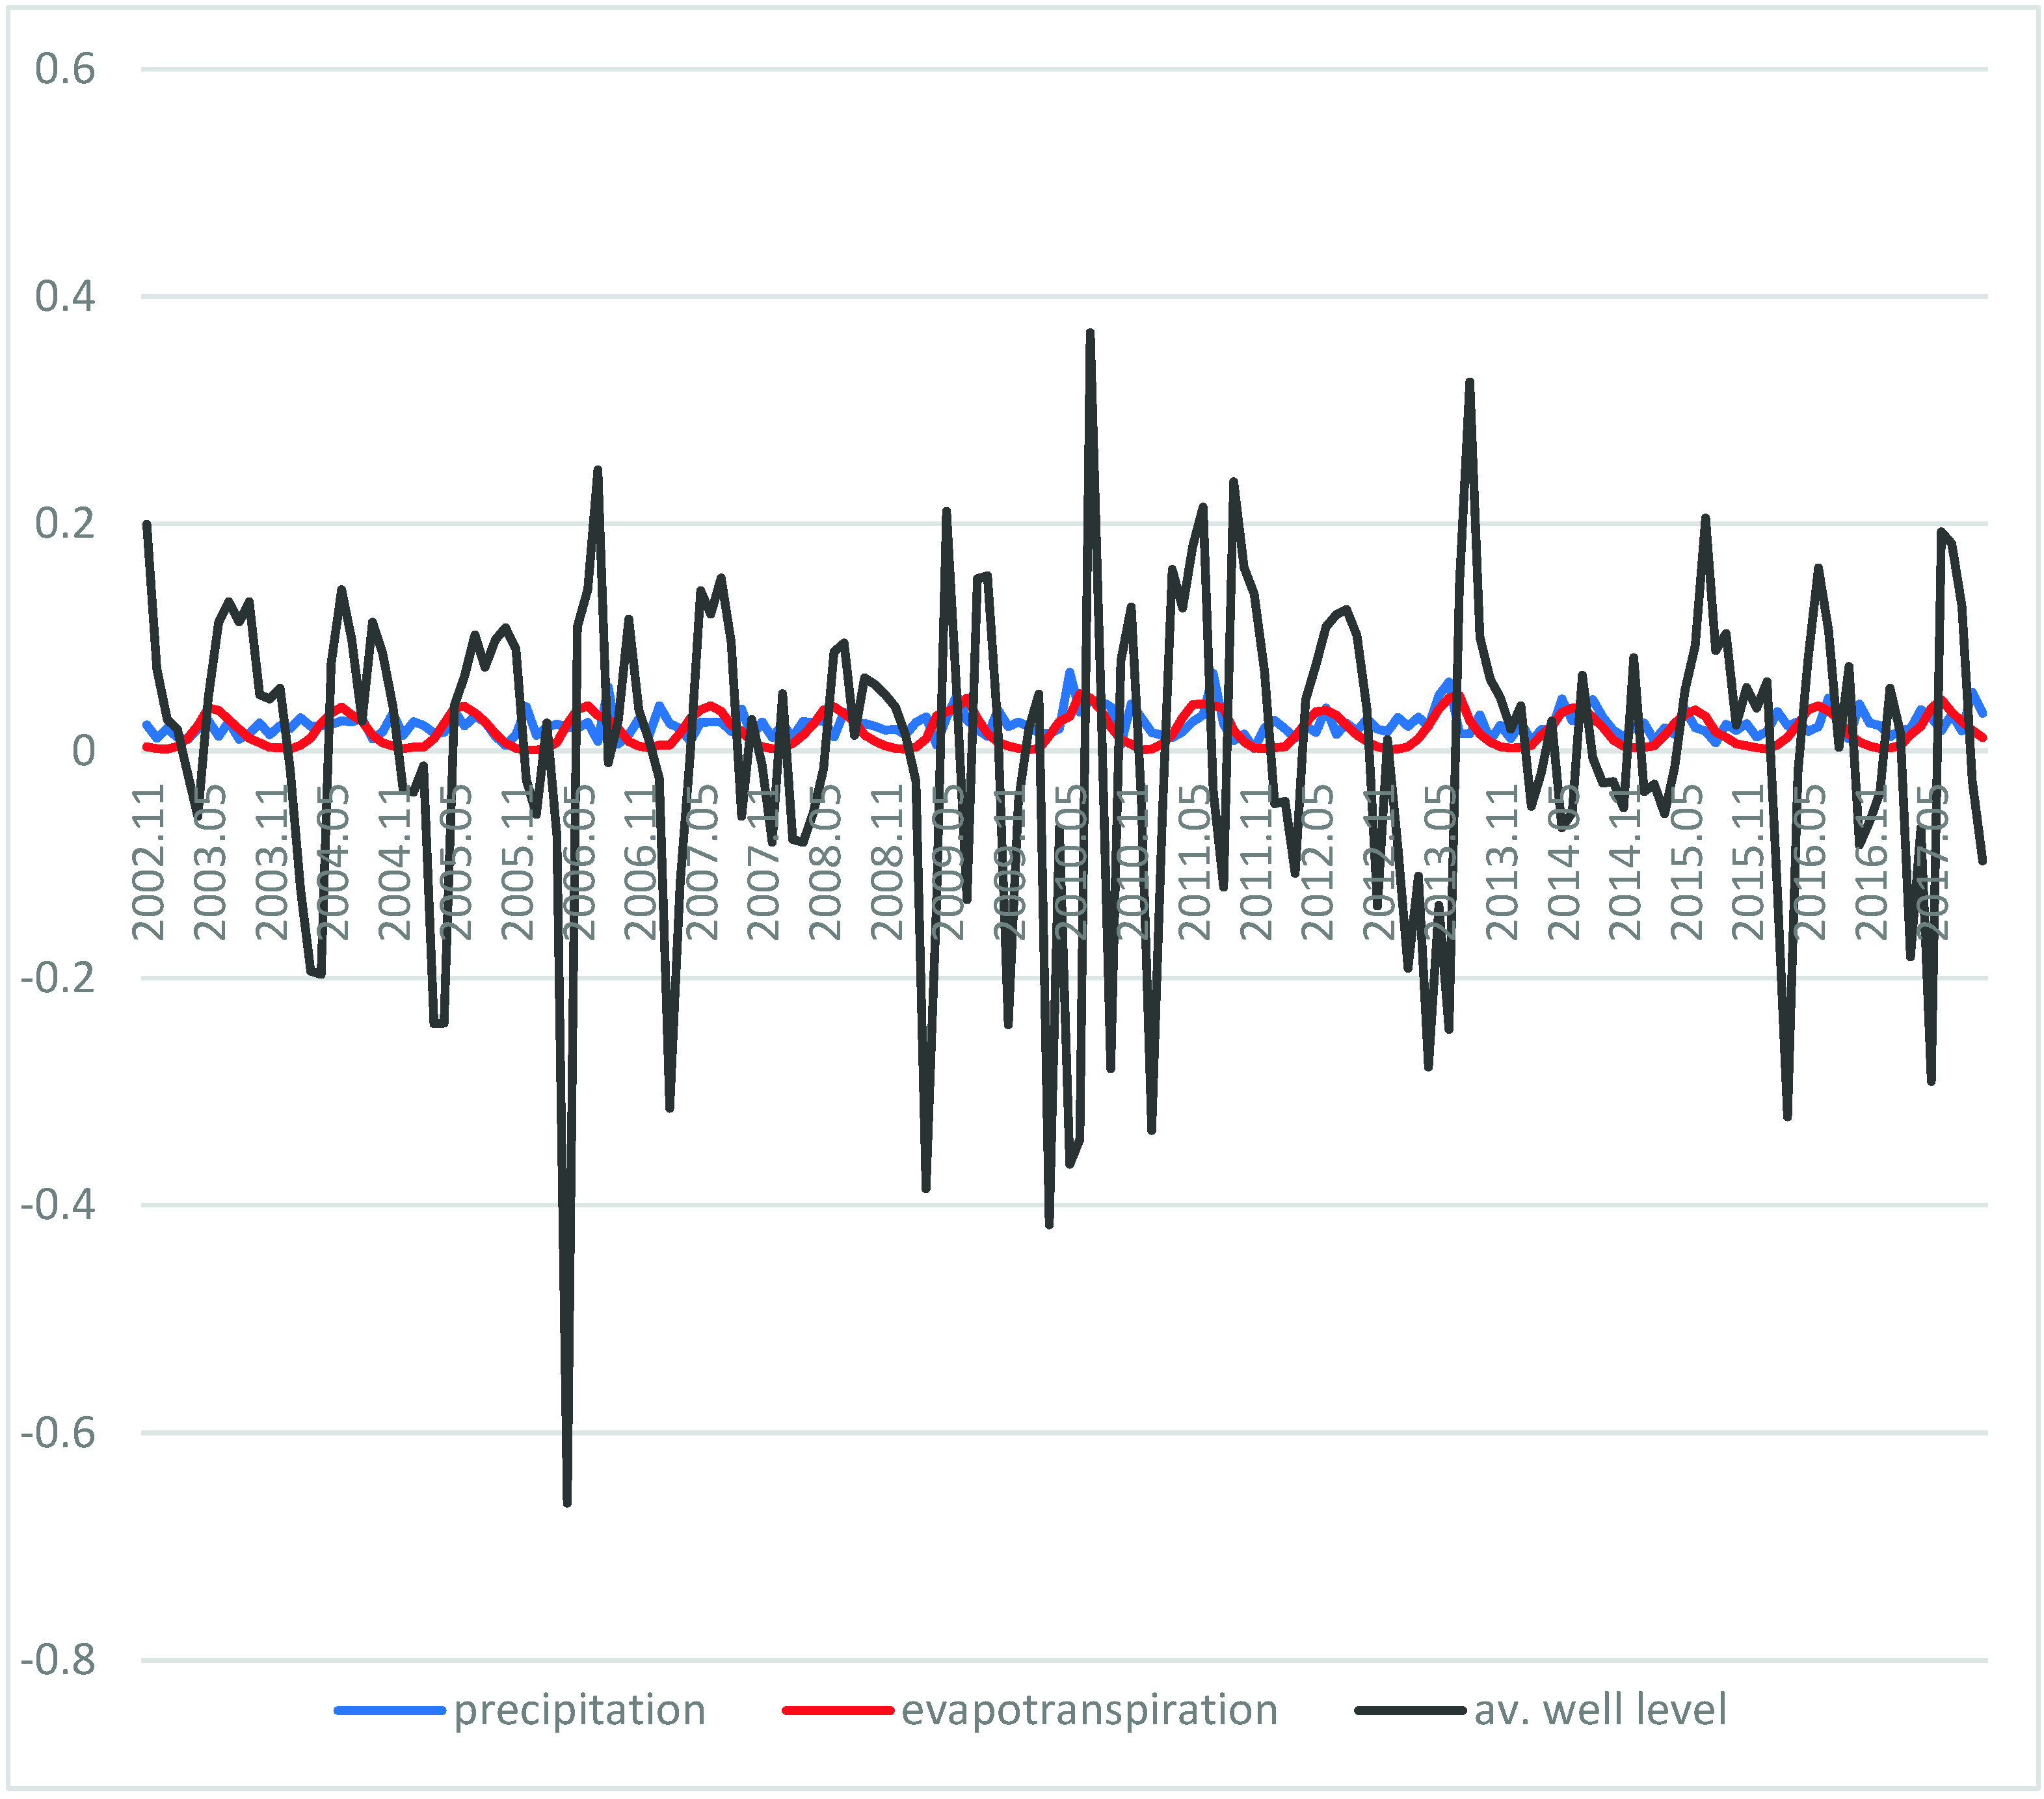
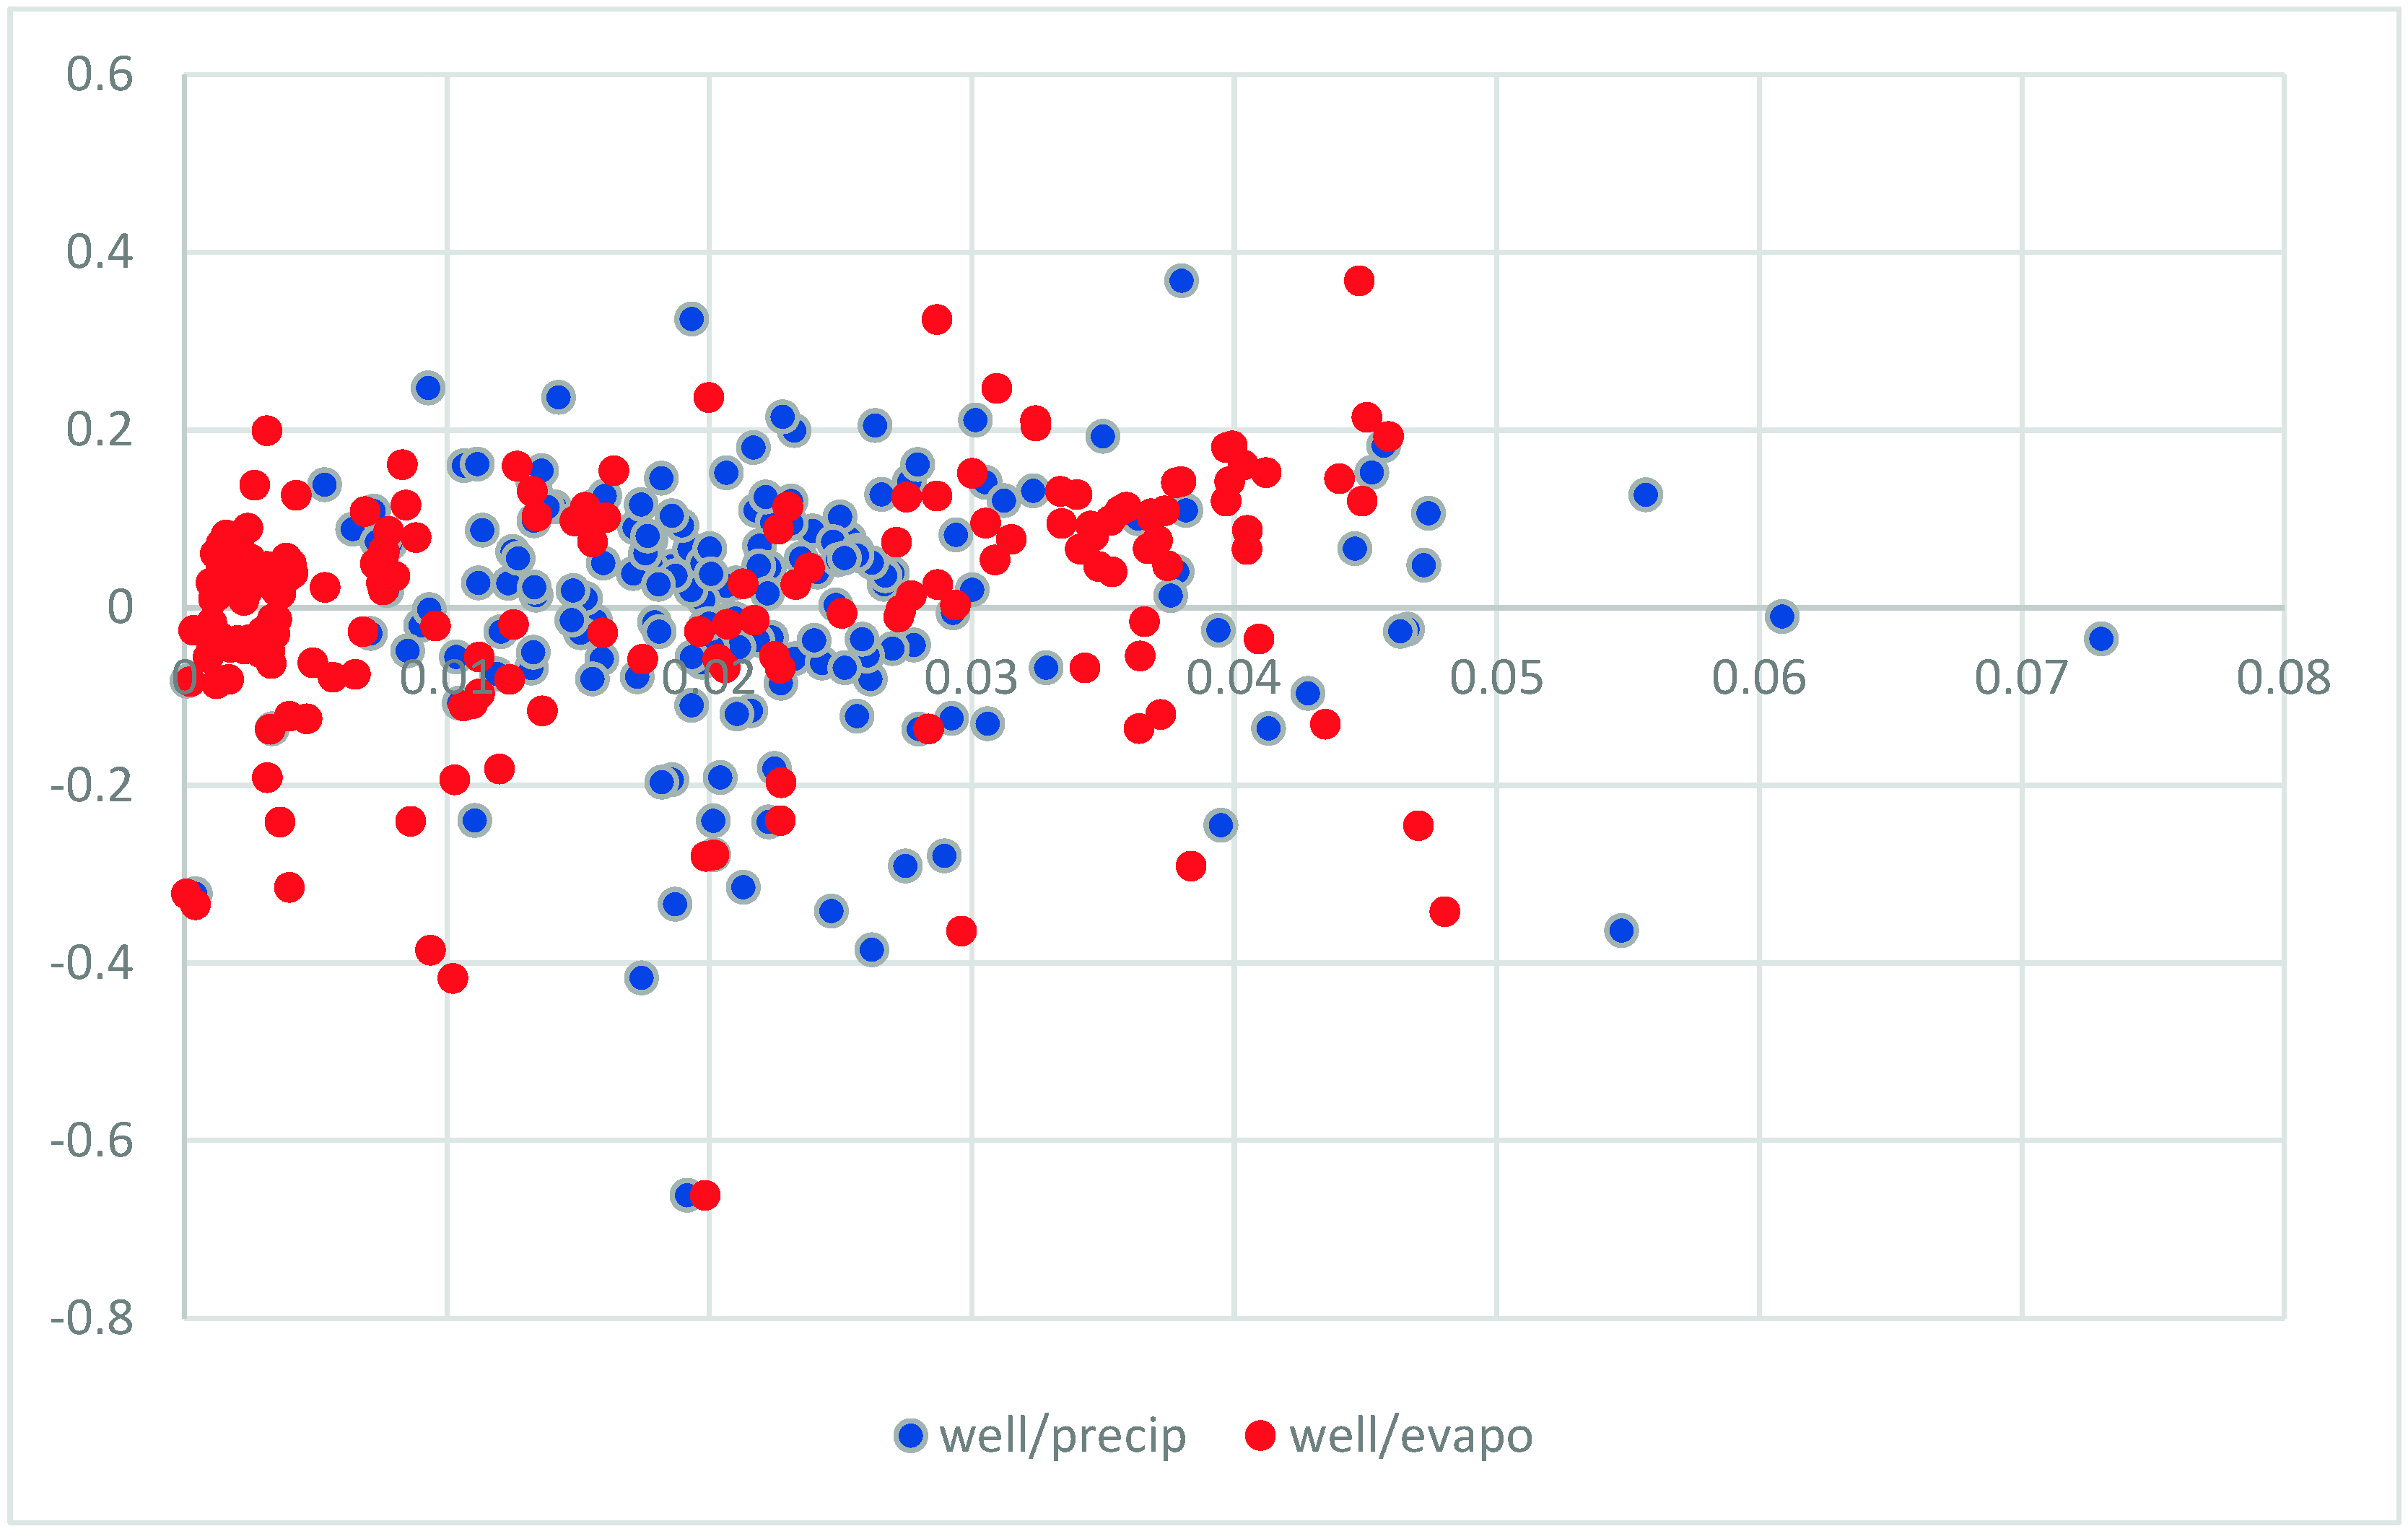
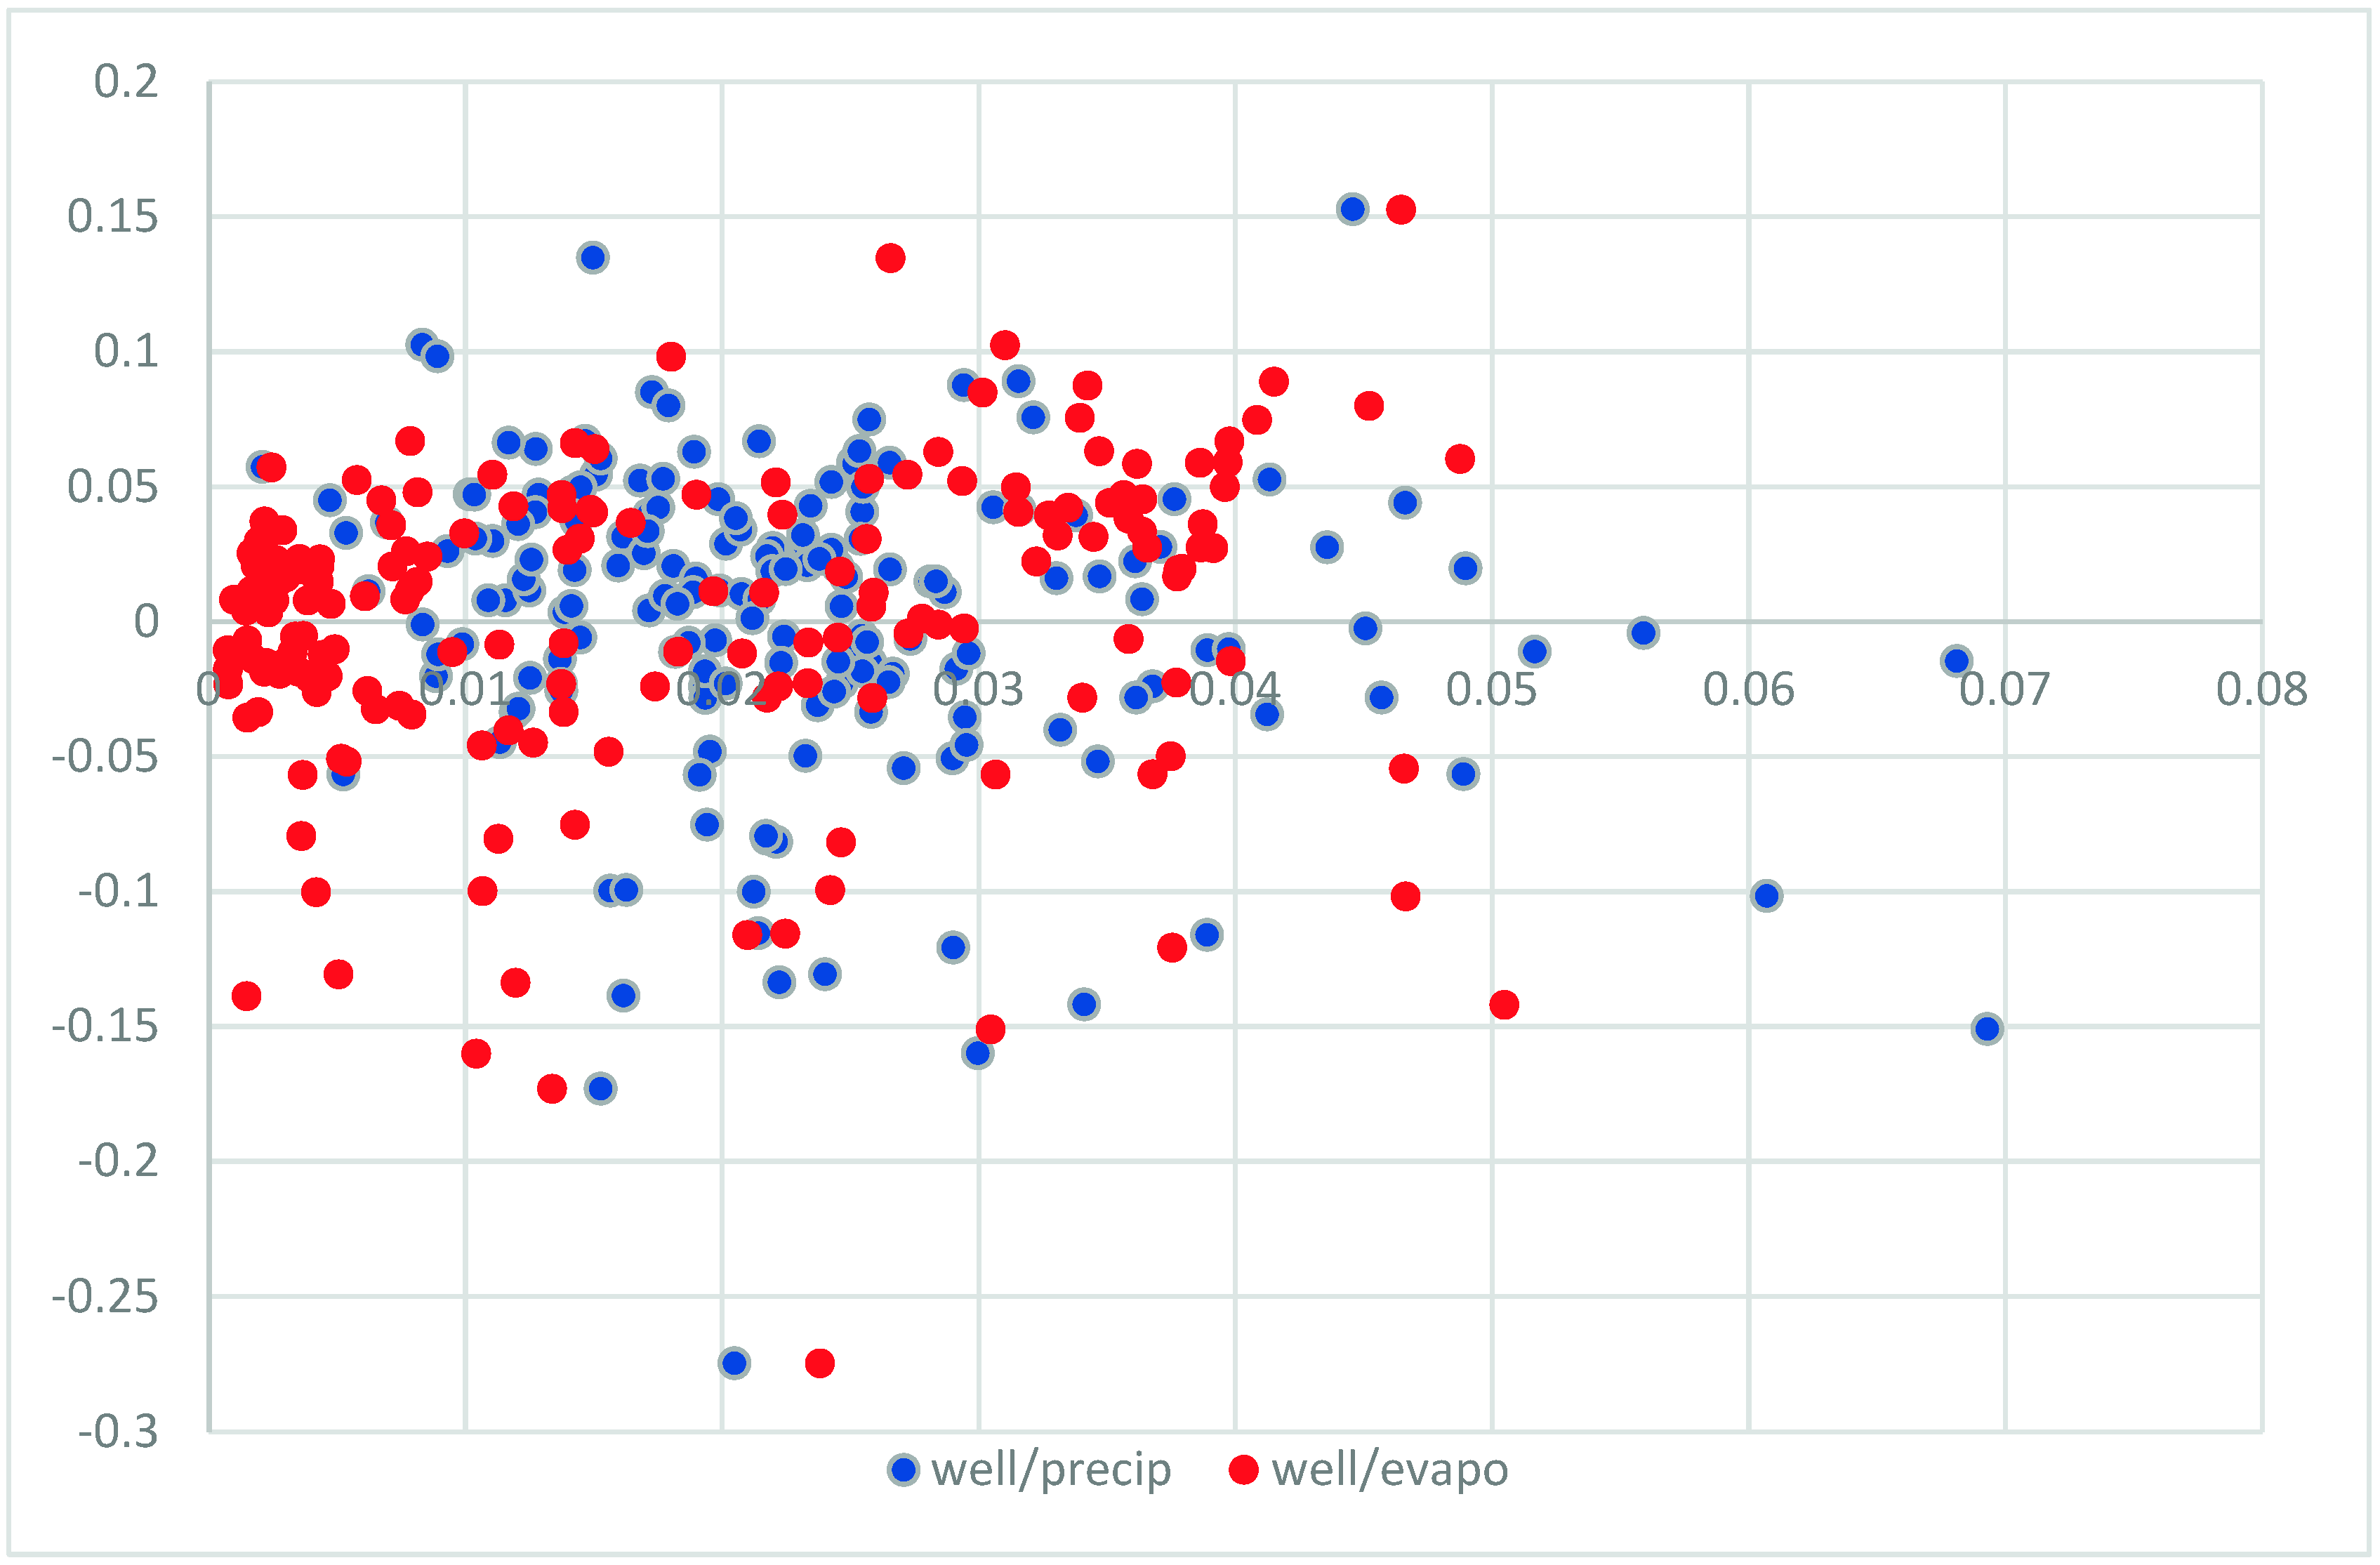
3.1. Comparison of Precipitation and Evapotranspiration Values with Polish Well Data in 2002–2017

For the purpose of the research values of precipitation, evapotranspiration and well table changes were averaged over the regions. In Figure 1, monthly values of precipitation and evapotranspiration over the area of North Poland are presented; in Figure 2, monthly values of precipitation and evapotranspiration over the area of South Poland are presented. In both cases, a strong seasonality of evapotranspiration was observed—the highest values in summer months (up to about 4 × 10⁻⁴ kg/m2/s), and almost no evapotranspiration in the winter months (low temperatures in Poland; very short time of Sun radiation during the day). The maximum values of precipitations in North Poland were about 7.5 × 10⁻⁵ (in July 2011) and 6.9 × 10⁻⁵ kg/m2/s (in May 2010). It needs to be mentioned that more “peak” values of a precipitation were noticed in South Poland. Generally, the values of mean precipitation usually reached 4 × 10⁻⁵ kg/m2/s; analyzing both regions (usually during springs and summers), the minimum mean values were about 10−5 kg/m2/s (in winter months), but from 2016 in North Poland, the mean precipitation values were about 0. For the purpose of comparison, P and EV were recomputed into meters.
In Northern Poland (Figure 1), the highest values of a groundwater level change were noticed in September 2011 (0.12 m), while the lowest value of a groundwater level changes were in November 2010 (−0.27 m). What was very surprising, the highest value was noticed in the well in Northern Poland, but at the same time, the averaged values of groundwater in Southern Poland (Figure 2) achieved the highest value (0.36 m). The lowest value was in January 2006 (−0.66 m). It should also be added that the Southern Poland values of groundwater change were much lower, especially in the years 2009–2010.
It can be noticed that mostly the highest and the lowest values of evapotranspiration and well levels were obtained at the same time in Northern Poland. Therefore, it can be said that the seasonality of both values is similar. In Southern Poland, a two month lag was observed; moreover, from the beginning of 2009, there was a disappearance of similarity in the highest and lowest values between the values of evapotranspiration and the averaged well level changes. The values of precipitation are not as regular and seasonal as the evapotranspiration values. In the case of a small rate of precipitation, no response in the groundwater level change was noticed. It can be concluded that most of the water stayed in the ground in the shallow parts, constituting soil moisture, and/or was gathered by a basin (surface and sub-surface run-off). In the Northern part of Poland, a 3–4 month lag of groundwater level was observed when analyzed in reference to the “peak” value of precipitation. In the Southern part of Poland, the lag period seemed to be shorter—about 2–3 months.

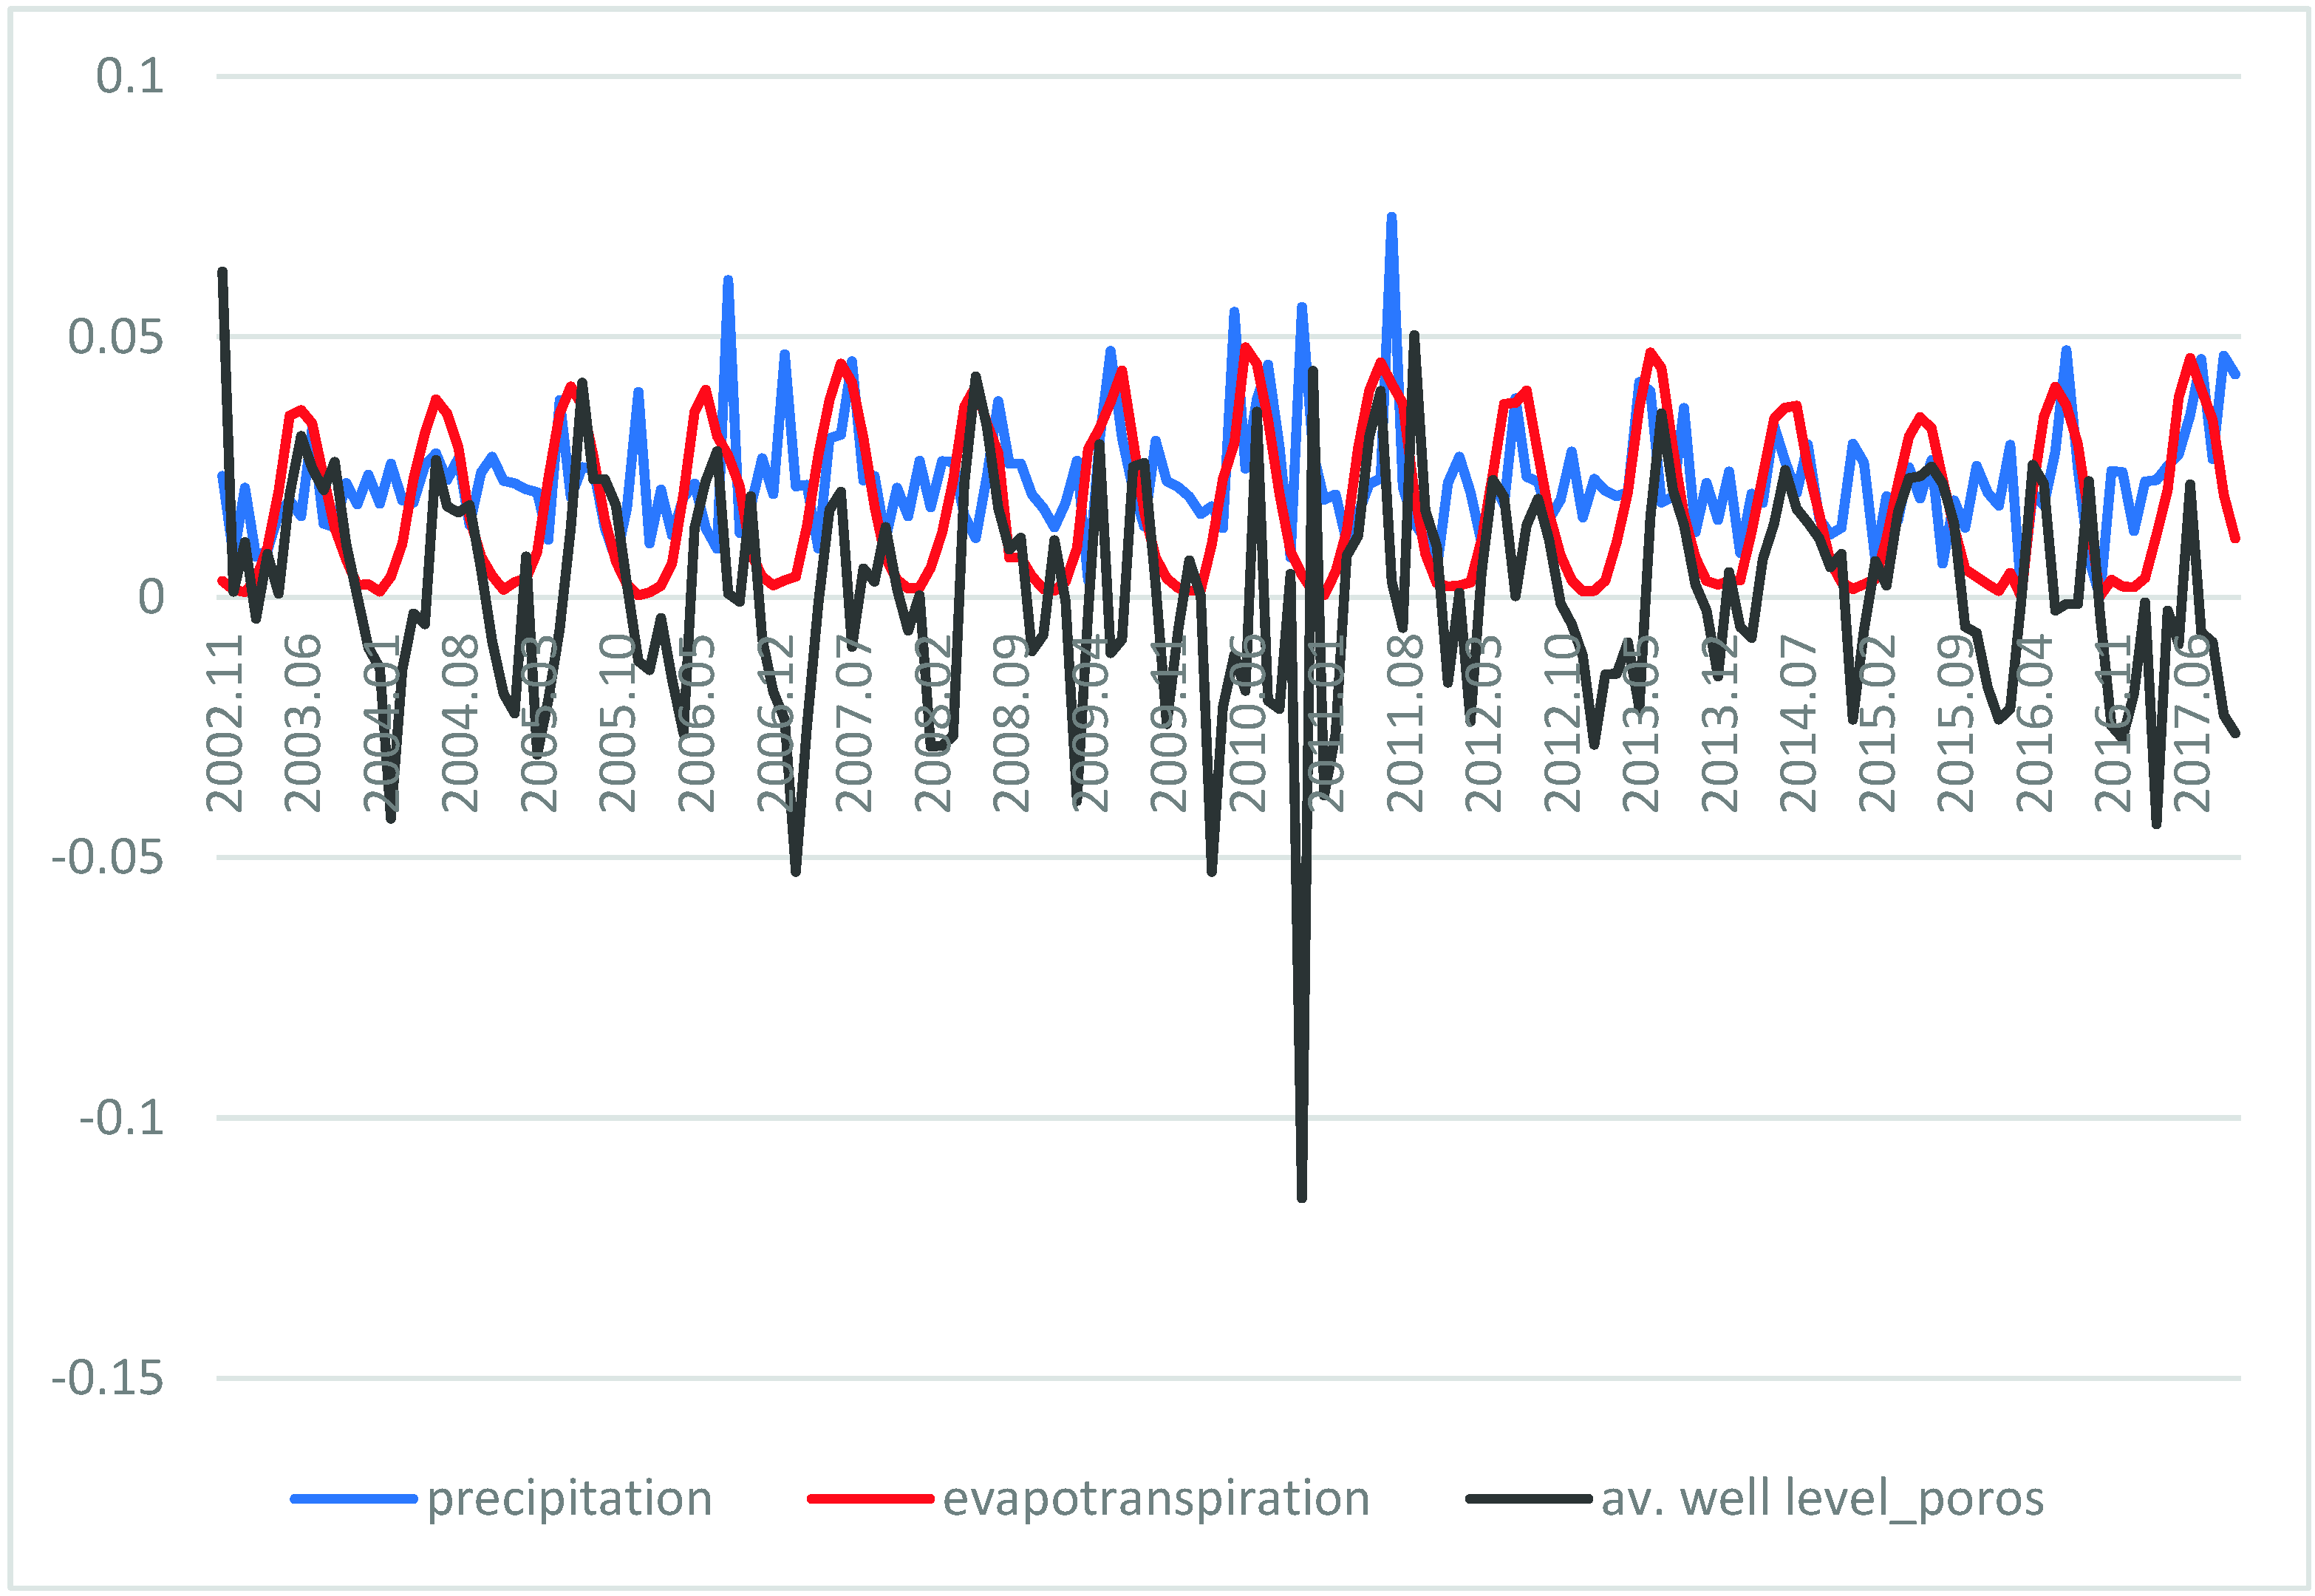
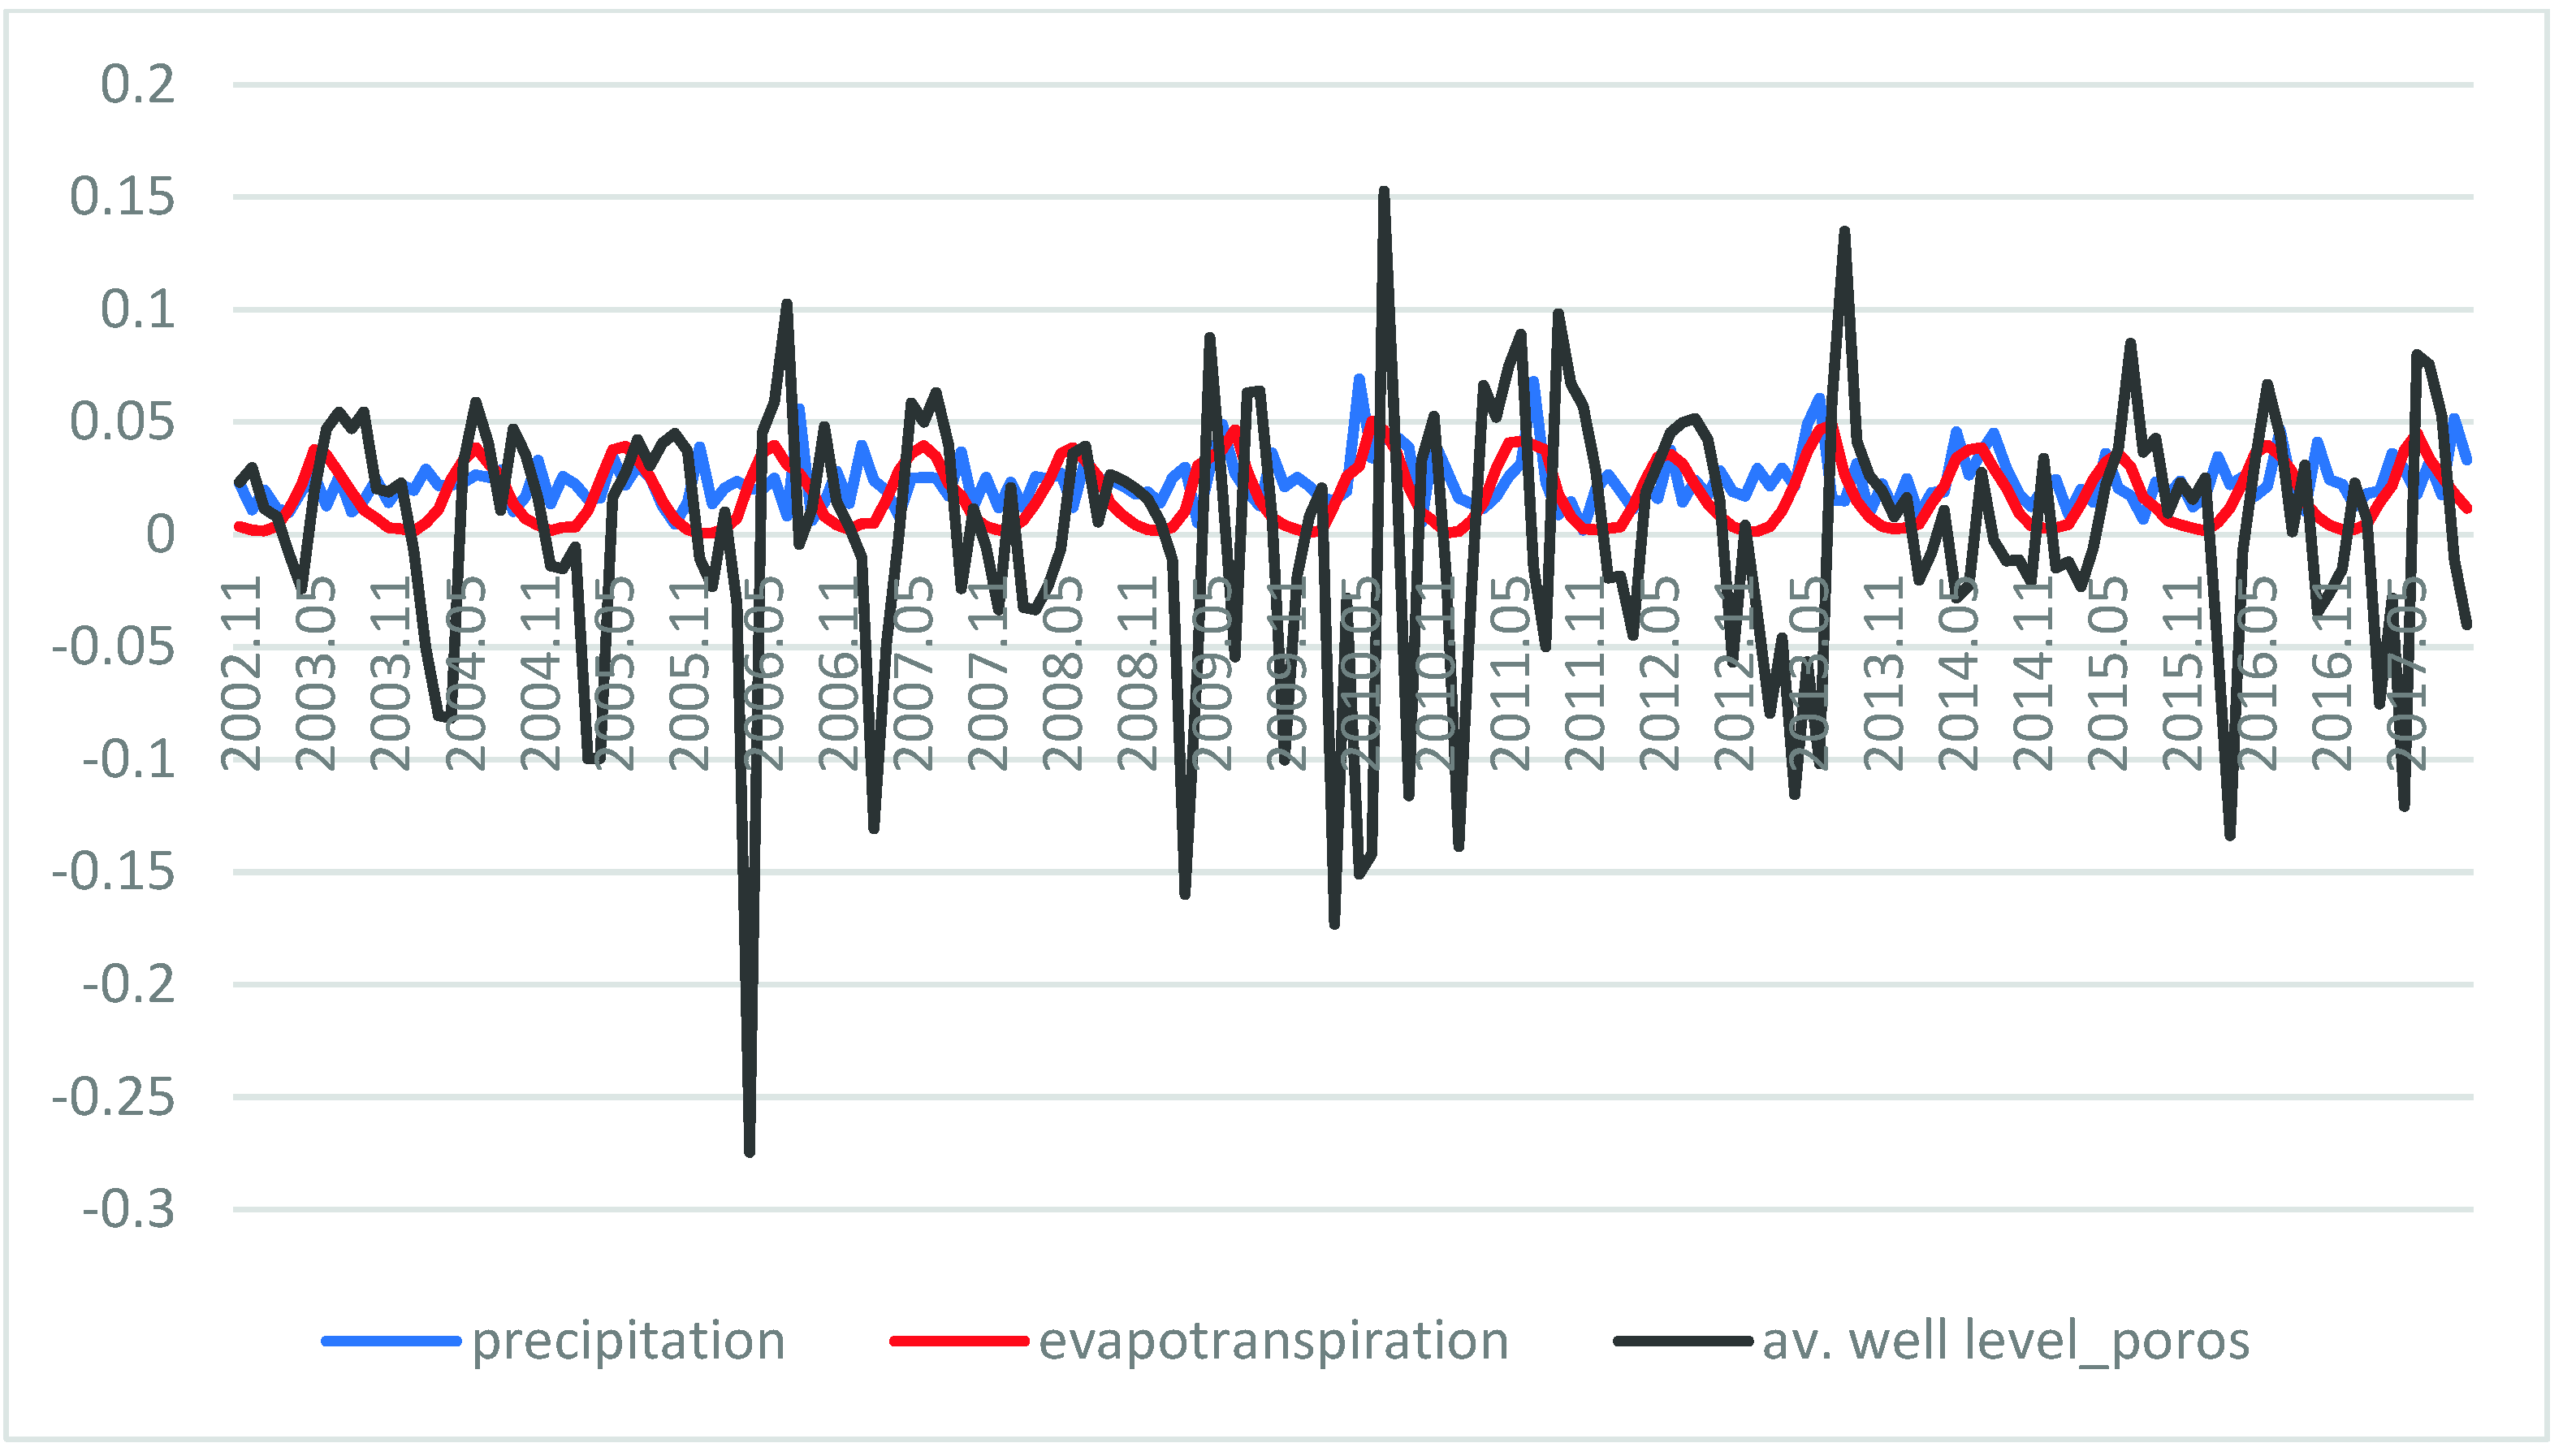
3.2. Introducing Porosity Coefficient

To be able to understand the velocity of water and the way it infiltrates into the ground, a porosity coefficient needs to be known. Porosity is a sum of all free spaces in the soil [16]. This parameter is dependent on soil mineral content, its granulometric composition and structure, organic matter content and agrotechnical interventions. It is different according to the vertical profile; usually, the deeper the soil the lower the porosity coefficient [17]. For soils produced from sands and loams, especially sandy loams, the lowest porosity is observed [18]. On the other hand, the highest value of a porosity coefficient can be estimated for soils based on organic matter [18]. In [6], the porosity coefficient for the Polish territory was computed. The average value for the two biggest Polish basins were 0.41–0.42. This was also proved by a statistical approach [6]. In the presented research, a value of 0.4 was used for the purpose of weighting well level values. Results are presented in Figure 3 and Figure 4.
When analyzing the values of evapotranspiration versus the groundwater level in Northern Poland, a very good compatibility in maximum values was noticed—regularly, in the summer months, a value of about 0.04 m was achieved (Figure 3); minimum values had the same phase, but the amplitude of the groundwater level was higher. In the case of Southern Poland, weighting well values did not align with the maximum values of groundwater change and evapotranspiration. Maximum and minimum values of the groundwater level were much higher/lower than evapotranspiration values (Figure 4). Analyzing both areas, it can be concluded that when comparing precipitation with a weighted groundwater level change, some discrepancies were noticed, but now, a lag can be observed much more easily.

3.3. Statistics—Correlograms and Pearson Coefficient

For the purpose of evaluating the results, some statistics were performed. For both areas (Northern and Southern Poland), and for both relations (well/precipitation and well/evapotranspiration), correlograms were carried out to search for a linear correlation, and the Pearson coefficient was computed for estimating the strength of a correlation.
Based on Figure 5 and Figure 6, it can be said that between well level changes and precipitation, and between well level changes and evapotranspiration, a partially positive linear correlation was detected in both researched areas, but some outstanding points were noticed, especially in Southern Poland.
For the purpose of the assessment of the linear correlation and stating a range of the rate of a linear dependence, a Pearson correlation coefficient was estimated. The Pearson coefficient is a quotient of a covariance and a ratio of standard deviations. The coefficient is very susceptible to extreme observations, so the results must be interpreted carefully and consciously. Three strategies were taken into consideration for both analyzed areas (Table 1):
1.
A dependence between groundwater level changes and precipitation/evapotranspiration;
2.
A dependence between groundwater level changes and precipitation/evapotranspiration with a 3 month lag;
3.
A dependence between groundwater level changes and precipitation/evapotranspiration excluding extreme observations.
It can be said that the correlation between groundwater level change and precipitation was negative and weak in both cases. The correlation between evapotranspiration and well observation was positive, but in Southern Poland, it was very weak; for Northern Poland, the value was 0.416 (much stronger). Because a mean lag of a 3 months was noticed, the correlation including lag was also computed. In this case, the precipitation and groundwater level correlation was much better (about |0.3|), but then, a positive correlation was noticed in Northern Poland. Almost no difference in the correlation between evapotranspiration and groundwater level was observed when analyzing evapotranspiration. As the Pearson coefficient is very susceptible to extreme observations, when estimating the correlation in the third scenario, a few maximas and minima were omitted. In this case, a very big difference was observed in Northern Poland. A strong and positive correlation was noticed between the well values and evapotranspiration, but the correlation was strong and but also negative when analysing values of well level and precipitation. On the other hand, omitting extreme values did not give a better Pearson coefficient for the area of Southern Poland for either correlation with precipitation and evapotranspiration (about 0.2).

4. Conclusions

The aim of the paper was to elaborate the reaction of unconfined groundwater aquifers to the rate of precipitation and evapotranspiration over hydrological years November 2002–October 2017 using data acquired from well measurement stations published every year in the Bulletins of the National Hydrogeological Service and from the MERRA-2 model.
Based on the research, it is concluded that, groundwater level changes measured in wells are correlated with precipitation and evapotranspiration values with a 3 month lag. Some outstanding values were observed; omitting them rises the correlation coefficient estimated by the Pearson coefficient (a strong dependence in Northern Poland). Appropriate values were 0.20 and 0.21 for lag = 0, and 0.61 and 0.59 for lag = 3. Higher values of correlation were noticed when comparing groundwater level changes with evapotranspiration (appropriate values in Northern Poland were about 0.4 for lag = 0 and for lag = 3 without outstanding values: 0.6; and in Southern Poland were about 0.2 for lag = 0 and for lag = 3 without outstanding values: 0.3)

Funding

This research received no external funding.

Conflicts of Interest

The authors declare no conflict of interest.

References

  1. Lorenzo-LaCruz, J.; Garcia, C.; Morán-Tejeda, E. Groundwater level responses to precipitation variability in Mediterranean insular aquifers. J. Hydrol. 2017, 552, 516–531. [Google Scholar] [CrossRef]
  2. Pandey, V.P.; Shrestha, S.; Chapagain, S.K.; Kazama, F. A framework for measuring groundwater sustainability. Environ. Sci. Policy 2011, 14, 396–407. [Google Scholar] [CrossRef]
  3. Sophocleous, M. Groundwater recharge and sustainability in the High Plains aquifer in Kansas, USA. Hydrogeol. J. 2005, 13, 351–365. [Google Scholar] [CrossRef]
  4. Birylo, M.; Rzepecka, Z.; Kuczynska-Siehien, J. Analysis of water budget prediction accuracy using ARIMA models. Water Sci. Technol. Water Suppl. 2018, 18, 2017156. [Google Scholar]
  5. Theis, C.V. The source of water derived from wells. Civ. Eng. 1940, 10, 277–280. [Google Scholar]
  6. Sliwinska, J.; Birylo, M.; Rzepecka, Z.; Nastula, J. Analysis of groundwater and total water storage changes in Poland using GRACE observations, in-situ data, and various assimilation models. Remote Sens. 2019, 11, 2949. [Google Scholar] [CrossRef]
  7. Cohn, S.E. An introduction to estimation theory. J. Meteor. Soc. Jpn. 1997, 75, 257–288. [Google Scholar] [CrossRef]
  8. Kalnay, E. Atmospheric Modeling, Data Assimilation and Predictability; Cambridge University Press: Cambridge, UK, 2003; p. 368. [Google Scholar]
  9. Wargan, K.; Labow, G.; Frith, S.; Pawson, S.; Livesey, N.; Partyka, G. Evaluation of the Ozone Fields in NASA’s MERRA-2 Reanalysis. J. Clim. 2017, 30, 2961–2988. [Google Scholar] [CrossRef] [PubMed]
  10. Rienecker, M.M.; Suarez, M.J.; Gelaro, R.; Todling, R.; Bacmeister, J.; Liu, E.; Bosilovich, M.G.; Schubert, S.D.; Takacs, L.; Kim, G.-K.; et al. MERRA: NASA’s Modern-Era Retrospective Analysis for Research and Applications. J. Clim. 2011, 24. [Google Scholar] [CrossRef]
  11. Global Modeling and Assimilation Office (GMAO). MERRA-2 tavgM_2d_flx_Nx: 2d, Monthly Mean, Time-Averaged, Single-Level, Assimilation, Surface Flux Diagnostics V5.12.4; Goddard Earth Sciences Data and Information Services Center (GES DISC): Greenbelt, MD, USA, 2015. Available online: https://disc.gsfc.nasa.gov/information/glossary?keywords=giovanni%20measurements&title=Giovanni%20Measurement%20Definitions:%20Precipitation (accessed on 10 January 2020).
  12. Available online: http://ldas.gsfc.nasa.gov/faq/#NLDAS_evap (accessed on 10 January 2020).
  13. Available online: www.pgi.gov.pl (accessed on 21 December 2019).
  14. Sadurski, A. Hydrogeological Annual Reports. Polish Hydrological Survey; Hydrological Year 2015; National Hydrological Service: Warsaw, Poland, 2016. [Google Scholar]
  15. Brewer, R.; Sleeman, J.R. Soil structure and fabric. Their definition and description. J. Soil Sci. 1960, 11, 172–185. [Google Scholar] [CrossRef]
  16. Rząsa, S.; Owczarzak, W. Porosity limits of Polish soils. Zesz. Probl. Postępów Nauk Rol. 1992, 398, 139–144. [Google Scholar]
  17. Kobiersk, I.M.; Dąbkowska-Naskręt, H. Skład mineralogiczny i wybrane właściwości fizykochemiczne zróżnicowanych typologicznie gleb Równiny Inowrocławskiej. Cz. I. Morfologia oraz właściwości fizyczne i chemiczne wybranych gleb (Mineralogical composition and selected physicochemical properties of soils from Inowrocław Plain. Part, I. morphology and physical and chemical properties of selected soils). Rocz. Glebozn. Soil Sci. Annu. 2003, 54, 17–27. [Google Scholar]
  18. Paluszek, J. Water-air properties of eroded lessives soils developed from loess. Acta Agrophys. 2001, 56, 233–245. [Google Scholar]
Figure 1. Average well levels changes, precipitation and evapotranspiration values in North Poland in meters.
Environsciproc 02 00017 g001
Figure 2. Average well levels changes, precipitation and evapotranspiration values in South Poland in meters.
Environsciproc 02 00017 g002
Figure 3. Average well level changes weighted with porosity coefficient, precipitation and evapotranspiration values in North Poland in meters.
Environsciproc 02 00017 g003
Figure 4. Average well level changes weighted with porosity coefficient, precipitation and evapotranspiration values in South Poland in meters.
Environsciproc 02 00017 g004
Figure 5. Correlations versus weighted well depths: between precipitation and weighted wells (blue); between evapotranspiration and weighted wells (blue) in North Poland.
Environsciproc 02 00017 g005
Figure 6. Correlations versus weighted well depths: between precipitation and weighted wells (blue); between evapotranspiration and weighted wells (blue) in South Poland.
Environsciproc 02 00017 g006
Table 1. Pearson coefficient between matrixes weighted well/precipitation and weighted well/evapotranspiration for North and South Poland—different strategies.
N-PolandS-PolandN-PolandS-PolandN-PolandS-Poland
3-month lag3-month lagOutstanding omitOutstanding omit
Well/precipitation−0.203−0.1780.323−0.370−0.4870.248
Well/evapotranspiration0.4160.1720.4080.1710.6240.269
Publisher’s Note: MDPI stays neutral with regard to jurisdictional claims in published maps and institutional affiliations.

