Proceeding Paper

The New Set Up of Local Performance Indices into WaterNetGen and Application to Santarém’s Network †

1
Department of Environmental Engineering (DIAm), Università della Calabria, Cubo 42/B, 87036 (CS) Arcavacata di Rende, Italy
2
Department of Computer Science, Universidade da Beira Interior, Rua Marquês d’Ávila e Bolama, 6201-001 Covilhã, Portugal
3
Department of Civil Engineering, Instituto Politécnico de Coimbra, Rua Pedro Numes, 3030-199 Coimbra, Portugal
*
Author to whom correspondence should be addressed.
Presented at the 4th EWaS International Conference: Valuing the Water, Carbon, Ecological Footprints of Human Activities, Online, 24–27 June 2020.
Published: 13 August 2020

Abstract

:
A new set of local performance indices has recently been introduced within a mathematical framework specifically designed to promote a local–global analysis of water networks. Successively, some local indices were also set up and implemented on WaterNetGen to better exploit their potential. In this paper, after a very brief overview of tools and main notations, Santarém’s (Portugal) water distribution network (WDN) is examined, applying to it the mentioned set of local indices, as a new real case study. The paper also focuses on the Hypotesis required to assess these indices in a pressure driven analysis (PDA) approach, analyzing and discussing the results obtained from such a simulation.

1. Introduction

A new set of local performance indices for a water distribution network (WDN) has been recently introduced in [1], together with a suitable mathematical framework that allows us to work with them. Local indices can be used as a basis for a local–global analysis of WDNs and, from the beginning of 2020, they have been also set up and implemented in WaterNetGen. The software WaterNetGen is a standalone EPANET plugin developed by J. Muranho, A. Ferreira, J. Sousa, A. Gomes, and A. Sa Marques (see, for example, [2,3]); it incorporates the well-known EPANET capabilities [4] and also adds some new ones (see Section 2). The theme of local indices is also present in [5], where the use of local indices is considered in the case of WDNs with non-uniform minimal design pressure, and in [6], where the network of Kang and Lansey [7] is considered as a case study for testing local indices. In addition to promoting a local analysis of a WDN, the local performance indices can be viewed as “elementary building bricks” to construct new global indices and to write well-known global others in a new way. Examples are represented by the resilience indices as formulated by Todini [8] and by Di Nardo and others [9]. Using their new formulation through local indices, it is in fact very easy to conduct a deeper analysis on them and on their reciprocal differences; see, for instance, [1,5,6].
In this paper, local indices are applied to a new case study, i.e., the WDN from a city in Portugal, namely Santarém. The pressure driven analysis (PDA) approach, provided by the software WaterNetGen, is used for simulations of the network. This approach is more expensive from a computational point of view if compared to the demand driven analysis (DDA) methodology provided, for instance, by EPANET 2.0.12, but it can give results which are more representative of the realty in the case of WDNs characterized by a scarcity of pressure regime in all or in parts of the network. Instead, in the cases where pressure is high enough to fully satisfy the water demand in all the nodes, there is no tangible advantage to using a PDA approach in place of a more common DDA one. This because the PDA approach of WaterNetGen comprises additional and more complex equations than the DDA approach used by EPANET, allowing us to perform calculations also in the case of pressure deficit in some nodes in such a way that the water demand is not completely satisfied (in these cases, EPANET produces nonrealistic results, showing full demand satisfaction even in nodes with pressure deficit).
This paper aims to test some local indices on the WDN of medium dimension of the city of Santarém, using a DDA approach and, above all, the PDA approach provided by WaterNetGen. In particular, the needed hypotheses for the real use of the set of local indices over the chosen WDN are investigated, discussing the results of simulations obtained through the two approaches and, finally, the relationships between them and the resilience indices mentioned above (computed with the two different approaches) deepened.
Similar indices to evaluate the vulnerability of supply infrastructures, various types of potable risk, and the sustainability of water resources can be found in [10,11,12,13].

2. Materials and Methods

The first subsection briefly recalls the set of local indices as introduced in [1], and the second gives more information about DDA and PDA approaches to solving a WDN.

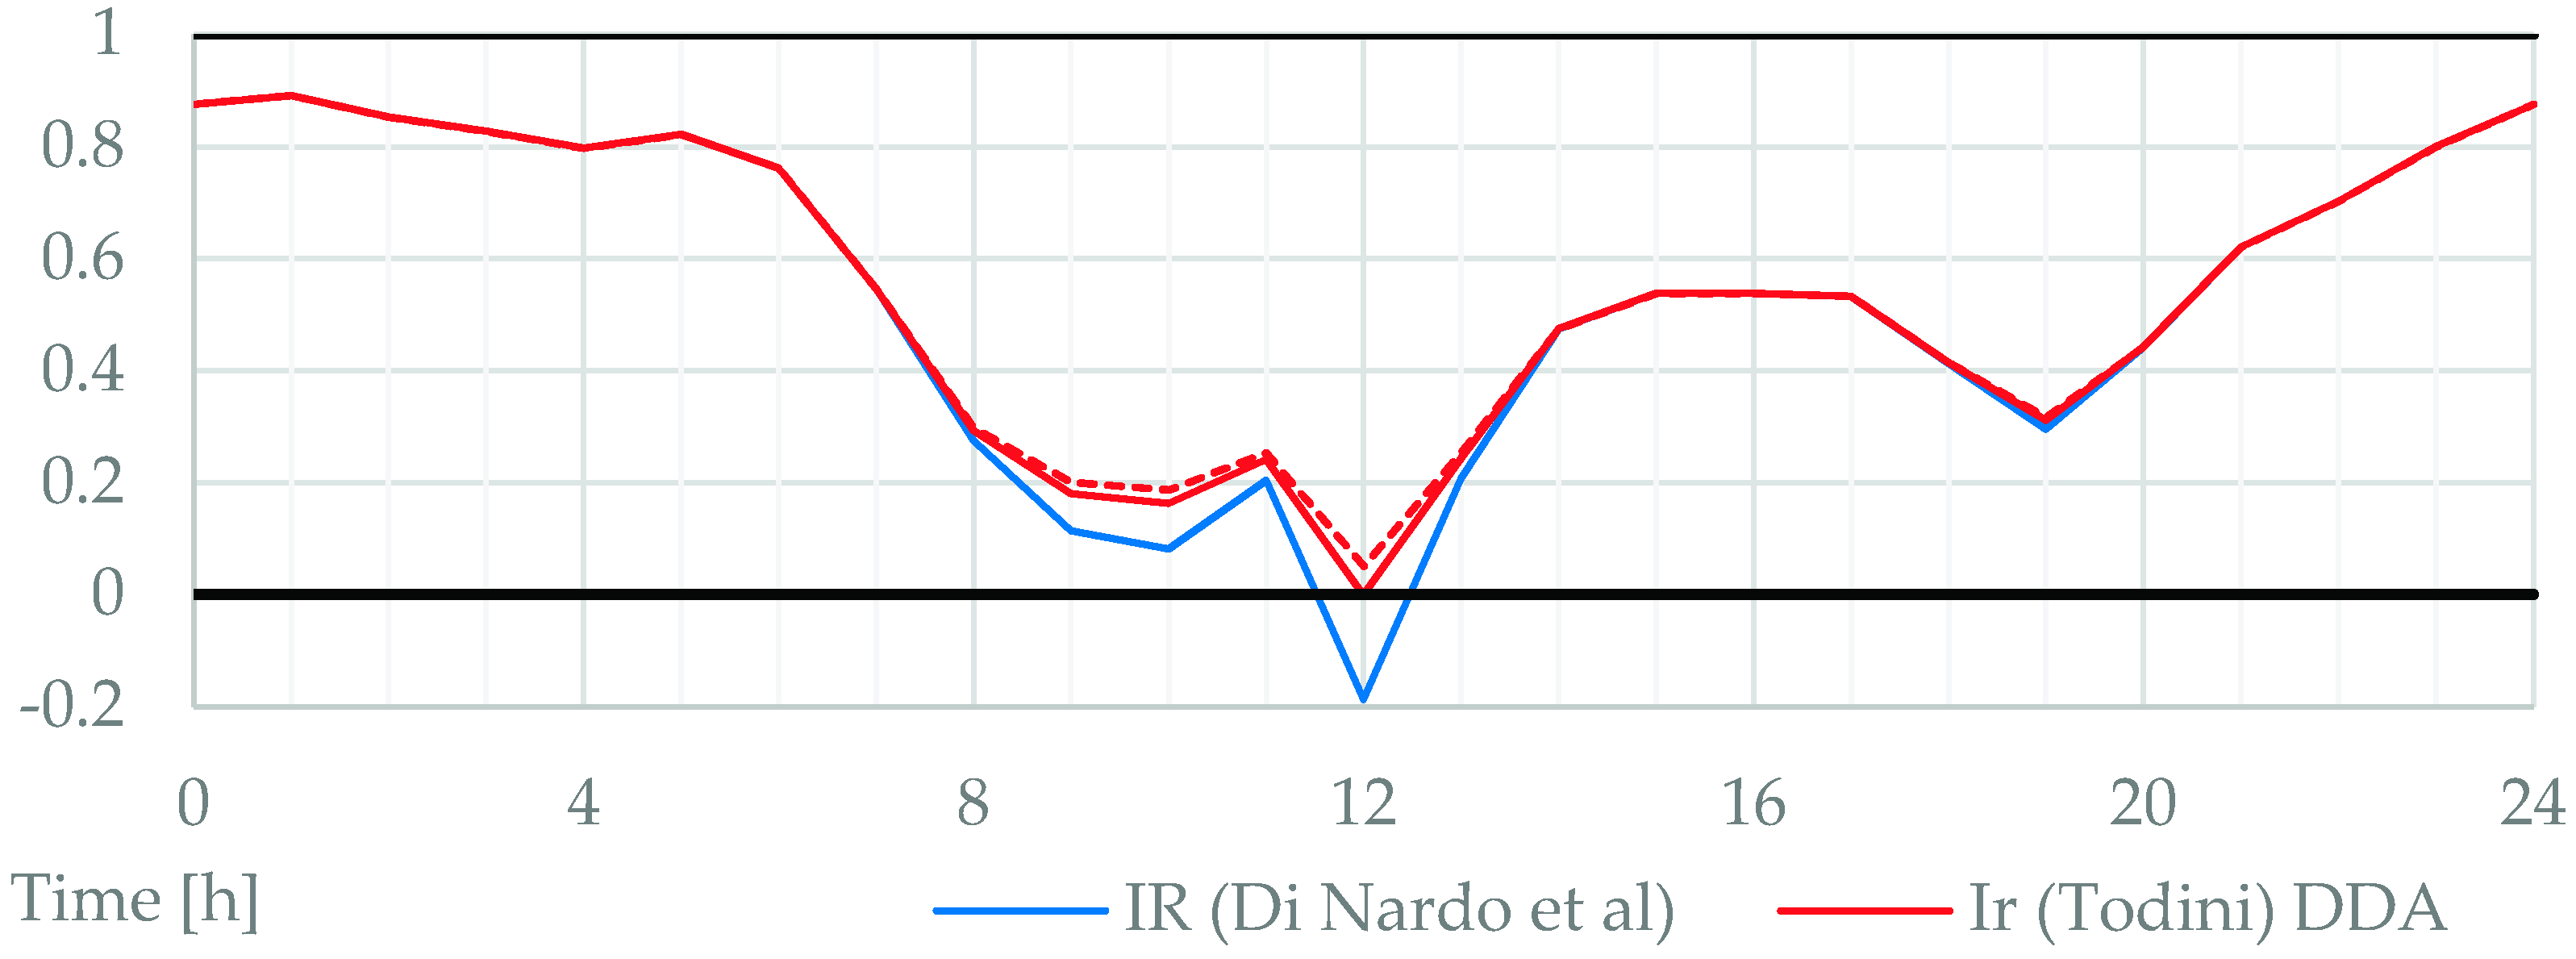
2.1. Local Performance Indices

The presented local surplus indices and some global indices, such as the resilience index presented by Todini [8] or the one by di Nardo et al. [9], refer to “design conditions”. In accordance with what was found in [6], these conditions are often linked to simplified hypotheses, which vary from author to author. As this paper is dealing with an existing network, it properly refers to the design conditions as “requested” conditions.
Let n be the number of junction nodes of a given WDN. For any i = 1 ,   2 ,   ,   n ,   q i denotes the nodal demand, p i the hydraulic power, and H i   and h i are, respectively, the piezometric head and pressure head. ρ is the water specific mass, g is the gravitational acceleration and γ is the specific weight. Q k t a n k and H k t a n k refer to the flow and piezometric head of the tanks. Values that have “*” as superscript refer to the required conditions.
I r = i = 1 n q i * ( H i   H i * ) k = 1 r Q k t a n k H k t a n k i = 1 n q i * H i *  
I R   i = 1 n ( H i q i - q i * H i * ) γ k = 1 r Q k t a n k H k t a n k - γ i = 1 n q i * H i *
Local   discharge   surplus   index   q i s = q i q i * 1 ,
Local   pressure   head   surplus   index   h i s = h i h i * 1 ,
Local   piezometric   head   surplus   index   H i s = H i H i * 1 ,
Local   power   surplus   index   p i s = p i p i * 1 =   g   ρ   q i H i g   ρ   q i * H i * 1 .

2.2. Water Distribution Network Modeling: DDA and PDA Approaches

For the hydraulic characterization of the WDN model, the hydraulic solver uses both PDA and DDA. WaterNetGen was used for the analysis. The software is a standalone plugin; it incorporates EPANET [4] capabilities and adds new ones. WaterNetGen allows us to perform both DDA and PDA analysis.
Hydraulic solvers like WaterNetGen, in order to perform PDAs, add an equation to the system that describes the hydraulics of the network. This introduced equation describes the possibility that the flow provided in a junction differs from the required value. In conditions of pressure deficit, the water supply lowers, and the supply can be null if the minimum threshold (imposed) is not reached.
Regarding the drinking water requested value, it refers to the value needed by the users to satisfy their needs for potable water. Since it is used as input for the hydraulic system solution, there can be two cases depending on the type of hydraulic solver used:
  • DDA: If there is a solution, the requested demand value will always coincide with the provided one.
  • PDA: In a good pressure regime, the results will be the same as DDA. Otherwise, in the presence of pressure deficit, since the PDA models the relationship between pressure and demand, the supplied water quantity can be lower than that requested.
The requested pressure head (or, equivalently, the requested piezometric head) is usually taken as an average value for the entire network. As more information was available about the network, it was possible to better characterize the needs of the users in a more realistic way. To assign the pressure requirement, this relationship, as given by the Portuguese regulation, is used:
h * = 100 + 40 * N   [ kPa ]     10.2 + 4.08   N   [ m ] ,
in which the requested pressure depends on the number of floors above ground N of the supplied building. In order to characterize pressure requirement with Equation (4), the city structure needs to be investigated.

3. Results and Discussion

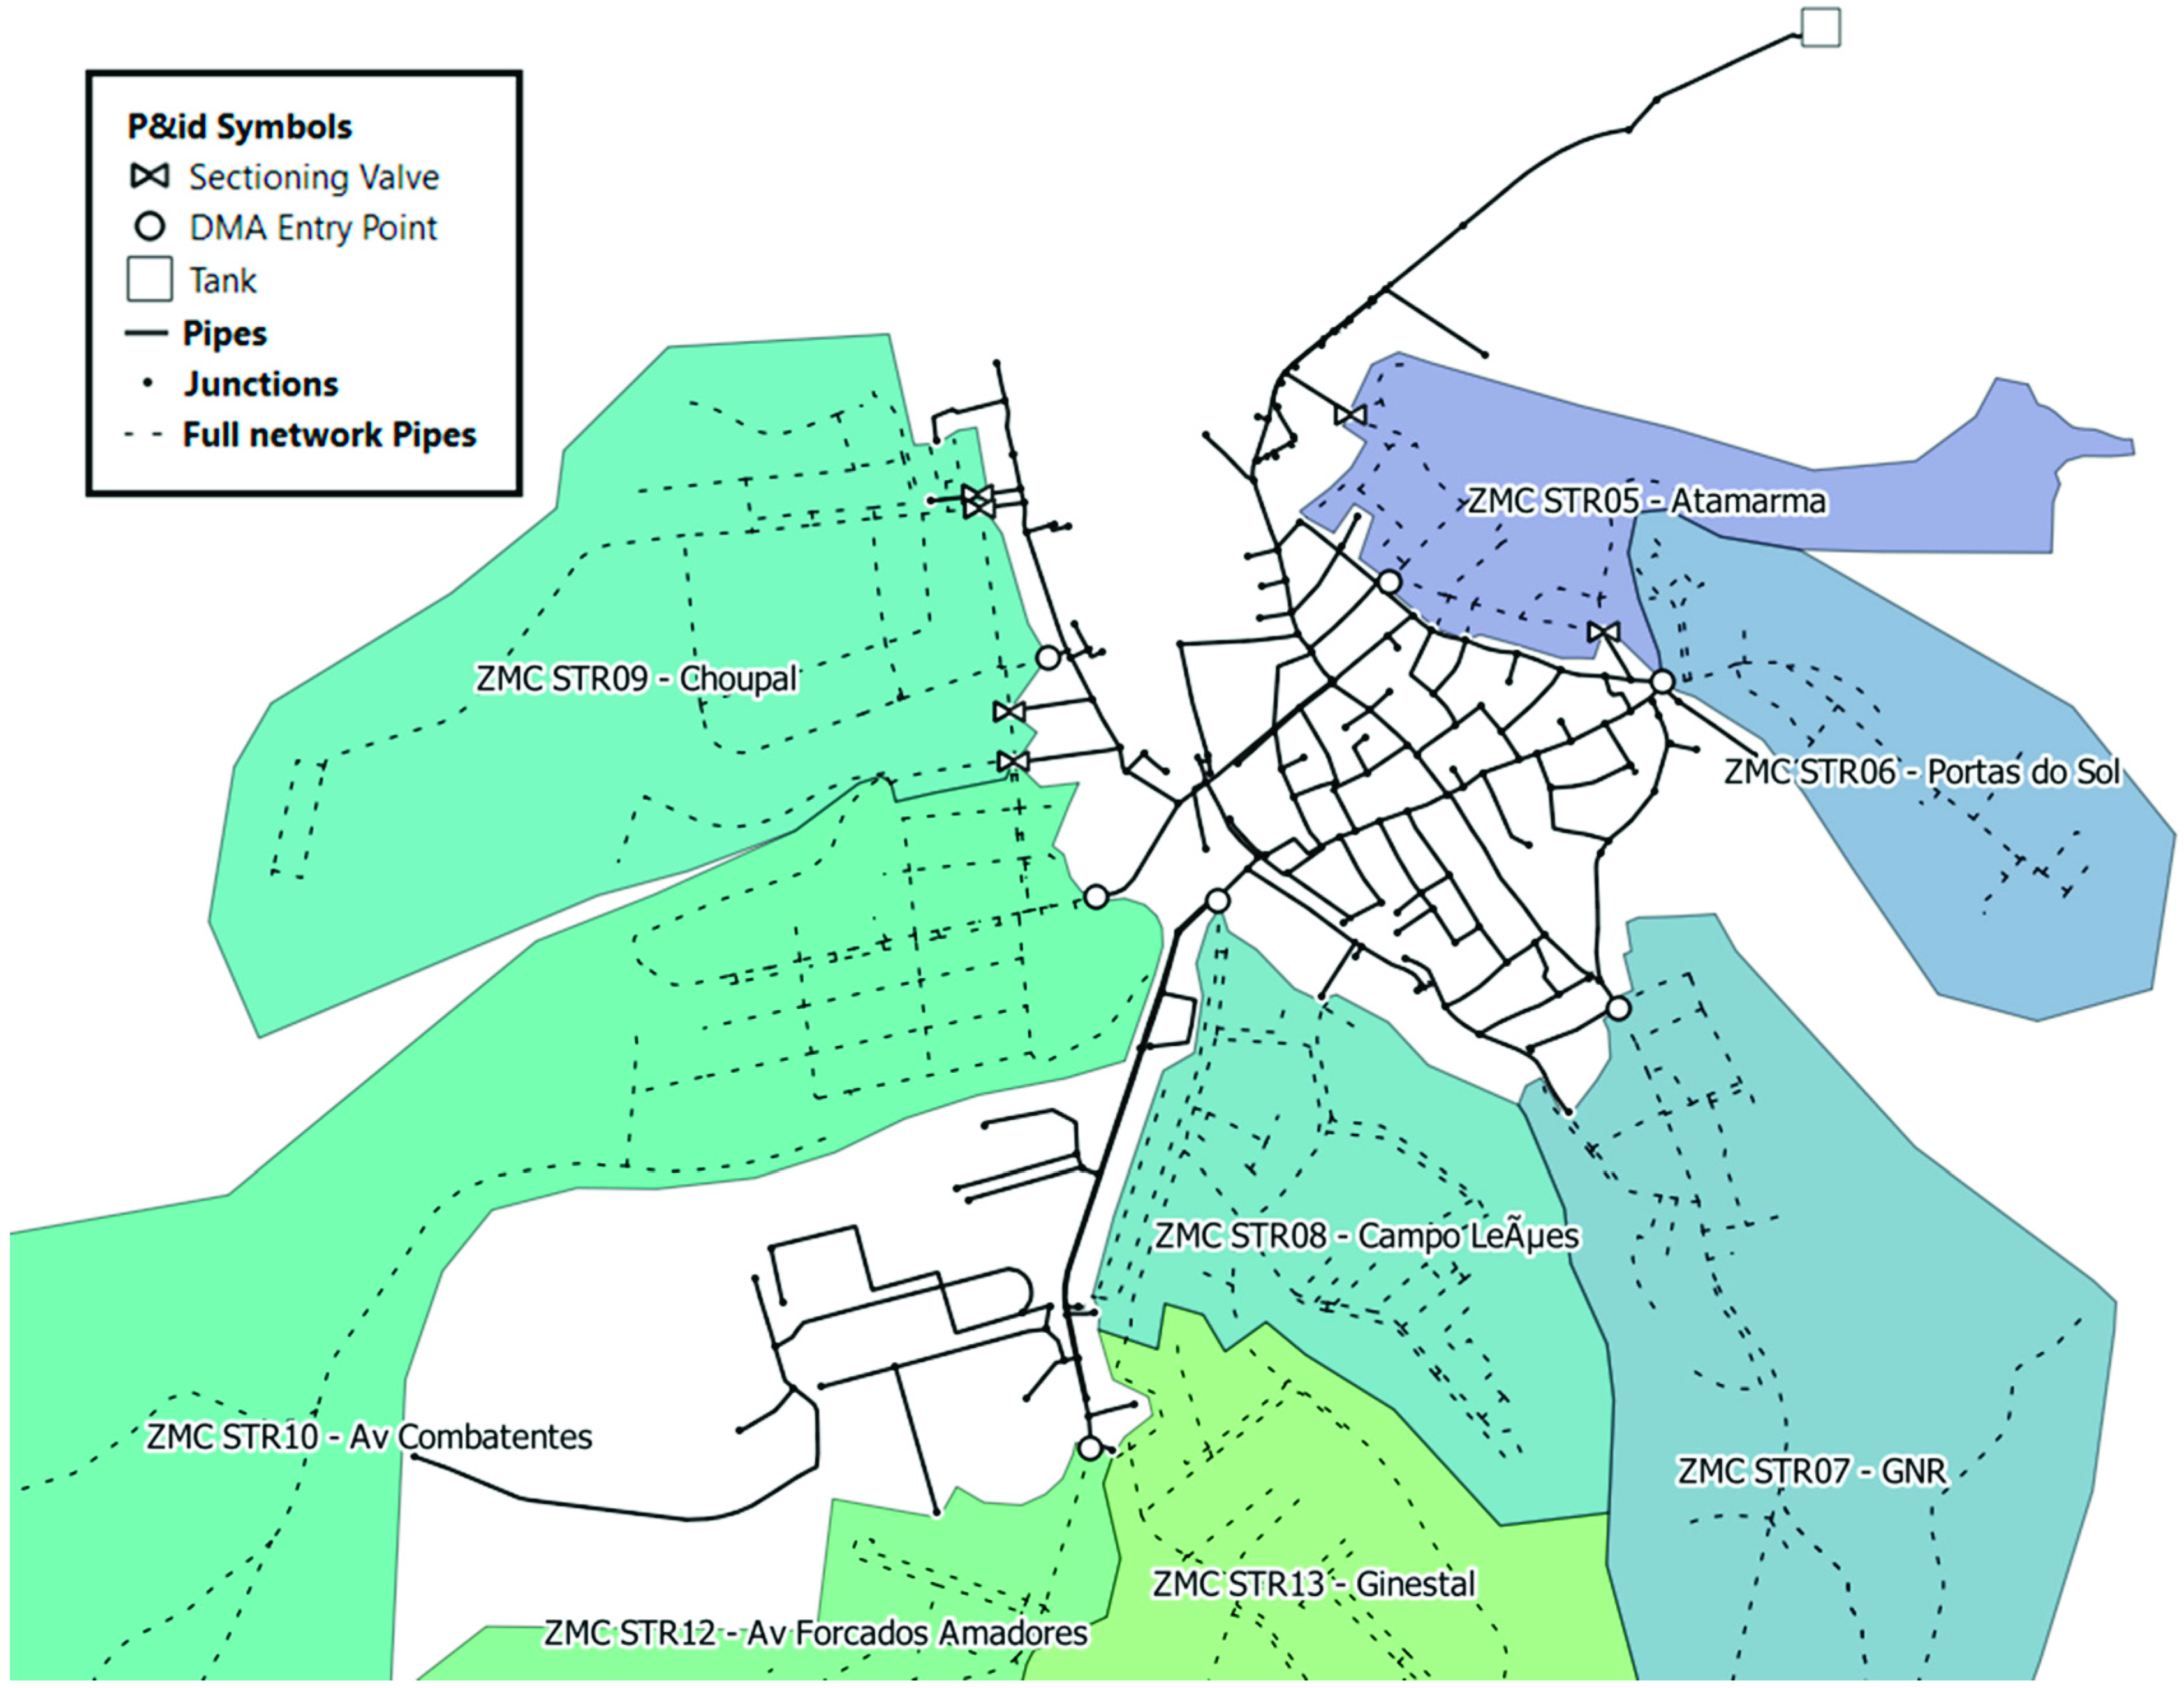
3.1. The Case Study: Santarém’s Water Distribution Network

In order to assess the use in practice of these indices, this paper uses the model of an existing WDN. The modeling of a real network enabled access to additional information that provides a more precise definition of the requested conditions. In this paper, the drinking WDN of a part of the city of Santarém was digitized. Santarém is a Portuguese city of around 30,000 inhabitants.
In order to build the model, it was necessary to define a minimum information content composed by the following:
  • Junction and tank characteristics (position and elevation);
  • Required water demand and hydraulic load;
  • Characteristics of the pipes (geographical location, material, and diameter);
  • Network topology.
For digitizing, geographical information system (GIS) files containing information about the topology of the network and the characteristics of the pipes were used.
The junction elevations were sampled from a digital terrain model built up by the contour lines (placed every 2 m). The pipe roughness was set depending on the material, as described in Table 1. The WDN that supplies Santarém city is partially divided into District Metered Areas (DMAs). In this paper, only the part directly served by the tank was taken into consideration. This part of the network delivers water to the old city (Figure 1) and is supplied by a single raised tank which is around 35 m high. The full network is composed of 715 nodes and 775 pipes, and it extends for more than 55 km, supplying an area of around 12 km2. The considered part consists of 285 pipes which extend for around 13 km, covering an area of around one square kilometer.
In order to perform both DDA and PDA, it is mandatory to define the requested values for pressure head (or piezometric head) and demand in each node.

3.2. Pressure Requested Condition

As mentioned in Section 2.2, the requested pressure depends on the number of storeys of the supplied buildings. In order to characterize the pressure need of the inspected network, the town was divided into blocks containing buildings of similar height. Each block was associated with the maximum number of floors of the buildings in them and consequently it was possible to estimate the requested piezometric head H* (and pressure head h*) for each junction of the network.
For the suburban area peripheral to the city, a minimum required pressure for a two-storey building was imposed (around 18.3 m of pressure head). In the presented area, the pressure value required for buildings above four storeys was set to be equivalent to that required for two-storey buildings because they have private tanks with pumping stations.
In PDA, it is also necessary to define the minimum pressure head value below which there is no supply ( h m i n ). For this network, the minimum pressure threshold was set to 0 m.

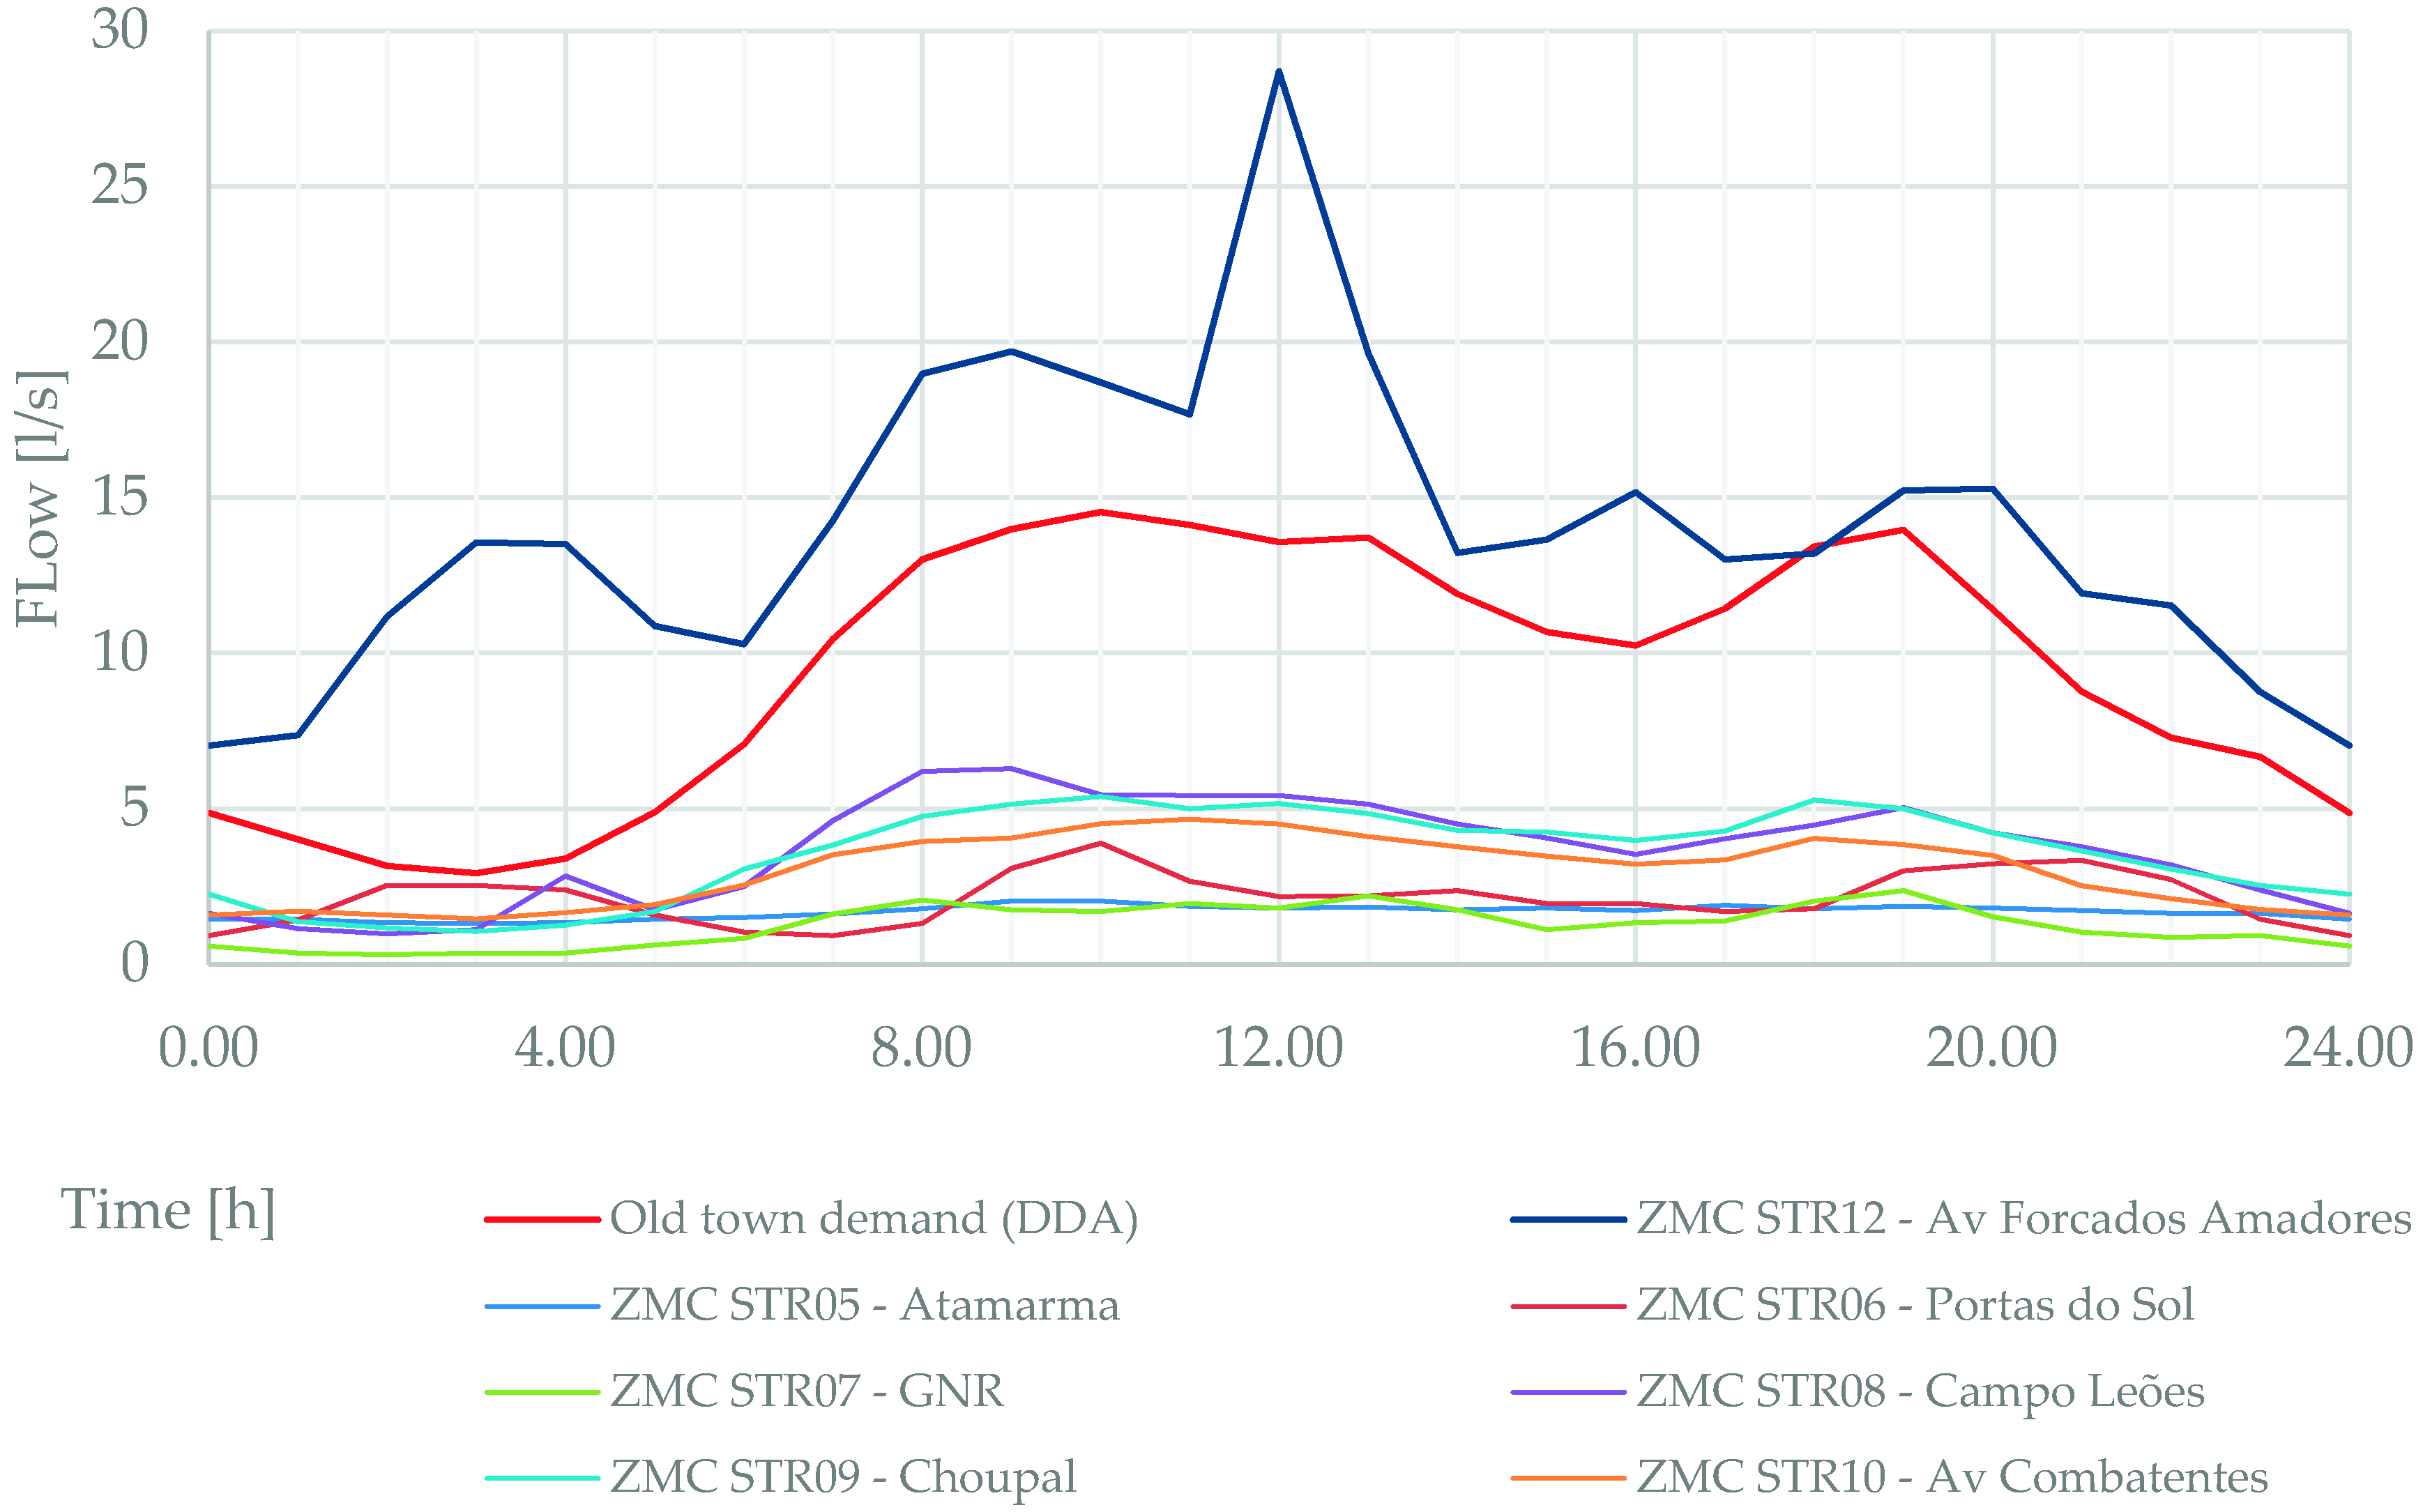
3.3. Water Demand and Water Loss Definition

To characterize the water demand in the network, it is necessary to determine the demand associated with the old part of the city and the demand from the DMAs connected to the network. The Santarém DMAs are equipped with flow meters, placed in their entrance points. In the model, the measured flow values were assigned to the entry points of the DMAs as concentrated demand in order to model the supplied flow.
There was no flow meter in the tank. To characterize the consumption of the old city, the water company (Águas de Santarém) provided customers’ consumption data.
In order to link this data to the network model, the position of the streets was identified and the demand from every street was assigned to its pipes. Some pipes were split into parts to improve the assignment precision. The demand assigned to each pipe was uniformly divided between both end nodes.
The demand value obtained is an average consumption. To assign a time variation, a pattern was built from the flow measurements of the DMAs; see Figure 2. DMA Av. Forcados Amadores and DMA Portas do Sol were excluded from the pattern definition as their behavior was very different from that of the others.
A water loss from leakage of 5 m3/h (1.4 L/s) was assumed for the entire area of the old city. The leakage was evenly distributed according to the length of the pipes.

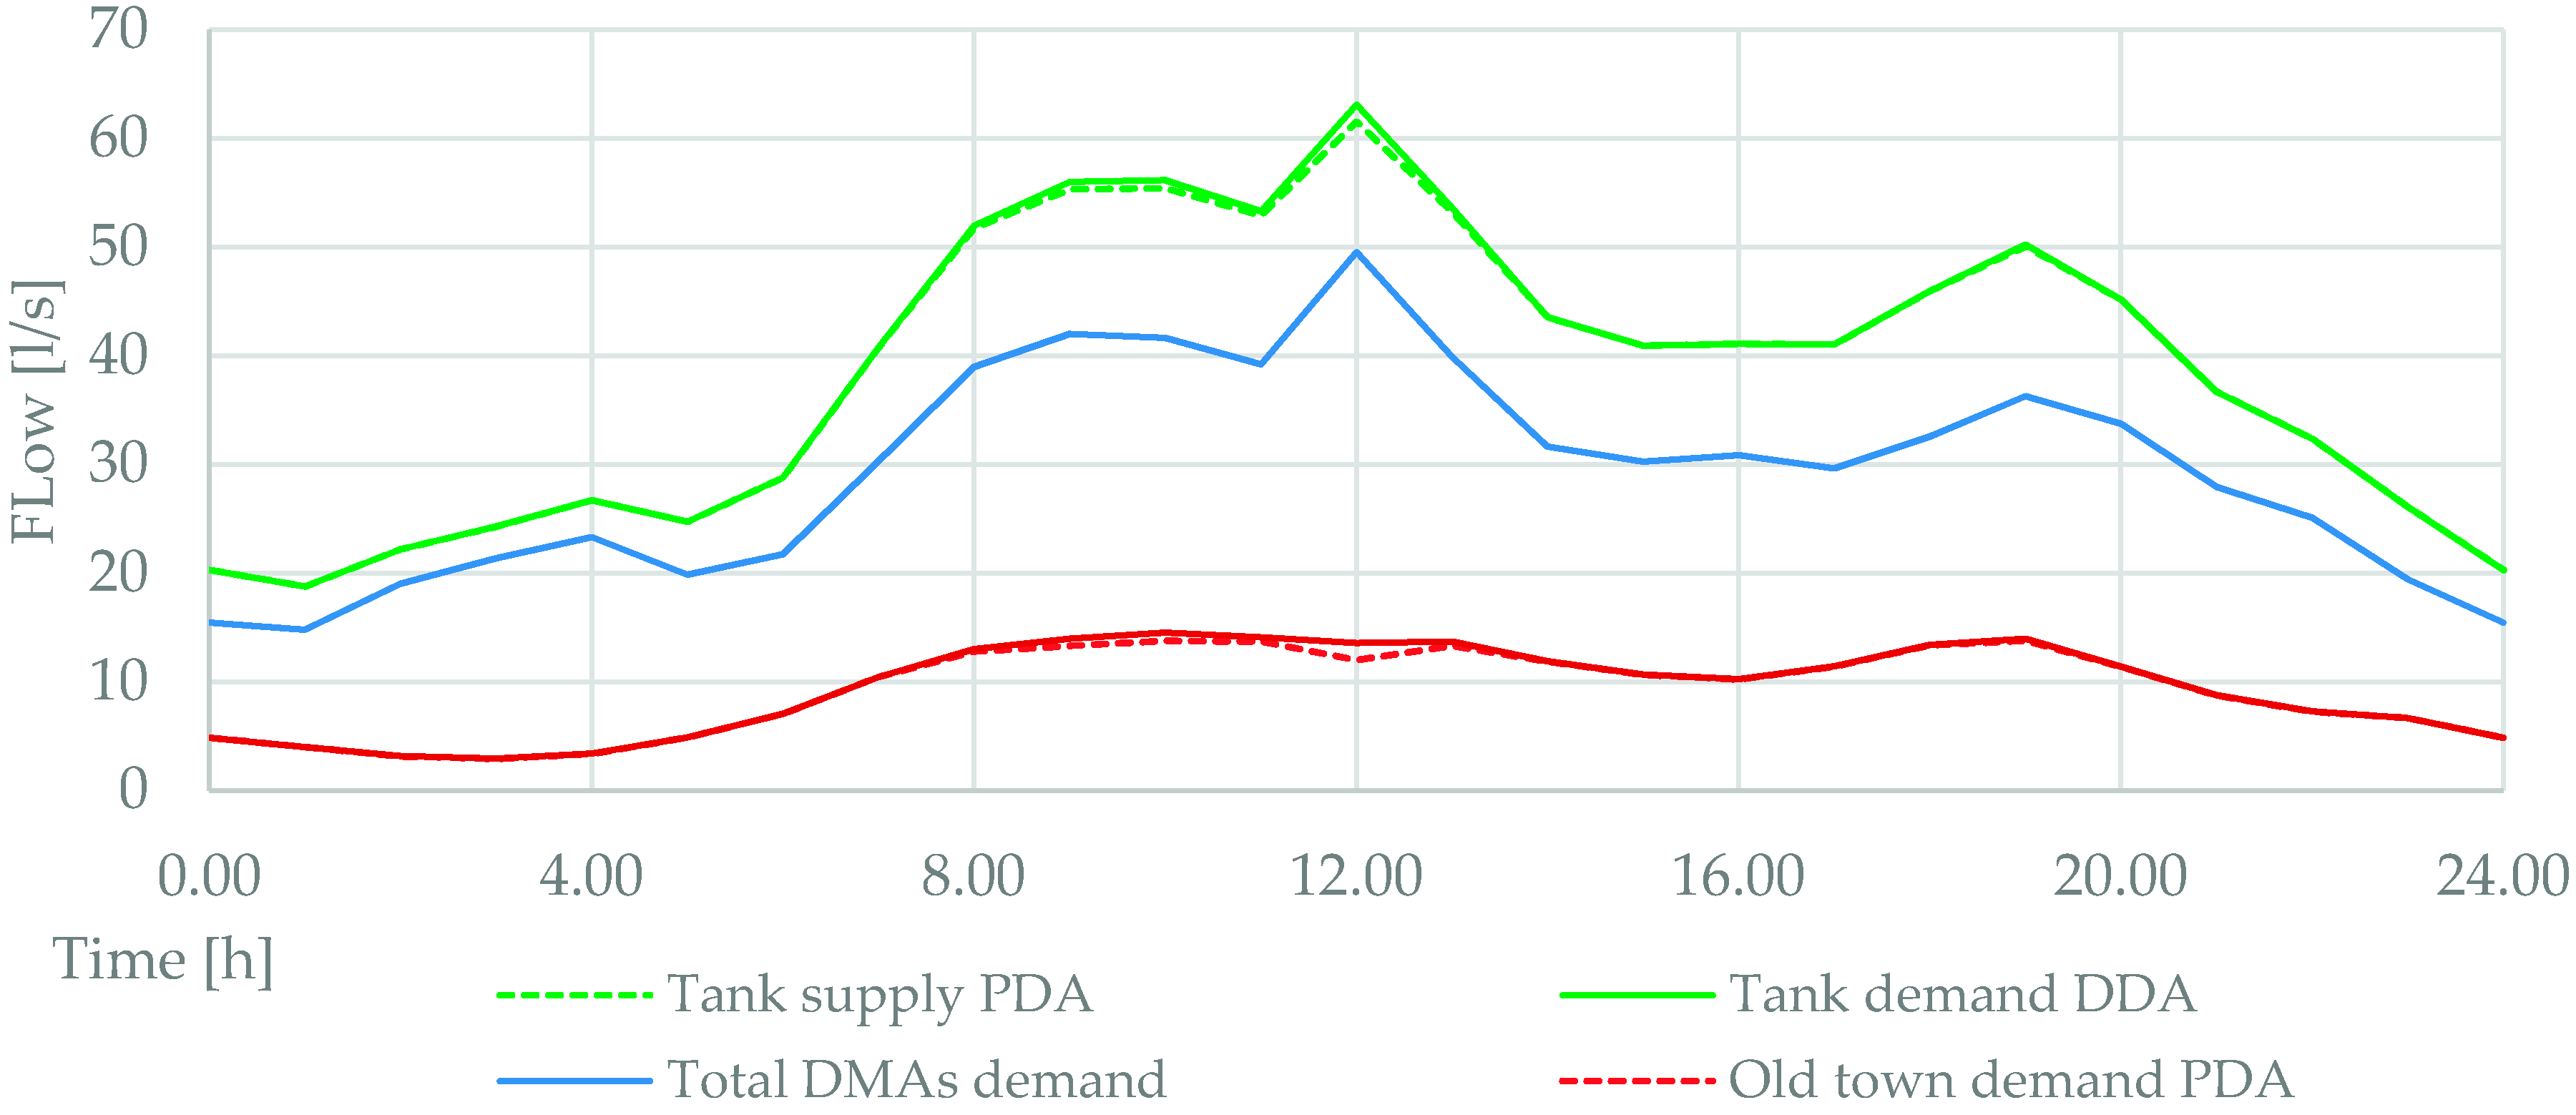
3.4. Hydraulic Calculations

Having defined all the components necessary for the hydraulic model, two simulations were carried out. The network was simulated for a period of 24 h, with both DDA and PDA.
Figure 3 shows that there are two consumption peaks. The first peak at 10:00 corresponds to the maximum consumption of the old city. The second, at 12:00, corresponds to the global peak, mostly due to the peak from the DMA Av. Forcados Amadores. At these peaks, the resulting supply in PDA is lower due to some pressure deficits.
The surplus local indices calculation procedure was included in WaterNetGEN (development version). This modified version of WaterNetGEN also allows the calculation of other global indices introduced in Di Nardo et al. 2010 and Todini 2000. In addition to the numerical calculation of local indices, WaterNetGen also allows their graphic display.
The resilience indices of Todini [8] and Di Nardo et al. [9] were estimated for each hour of simulation (See Figure 4). Todini’s resilience index was estimated for both simulations. For PDA simulation, this index is higher because, under deficit conditions, the demand is reduced and consequently the pressure regime improves. It is possible to calculate the index of Di Nardo et al. [9] only for PDA. For DDA simulations, this index coincides with Todini’s, being q i = q i * . At the peaks, the net has very little resilience.
The local surplus indices used as synthetic indicators can provide information about the level of satisfaction relating to the water demand and the pressure requirement.

4. Conclusions

The assessment of the set of local indices presented in [1,5] has been integrated into WaterNetGen in order to evaluate their use in practice. The indices have been calculated for a portion of the city of Santarém’s WDN. The use of a real model enabled us to evaluate how the phases of the model construction and the definition of the “requested” conditions are both particularly delicate.
Both the local pressure head surplus index (Equation (3a)) and the local discharge surplus index (Equation (3b)) can be used as direct synthetic indicators (Figure 5); the piezometric and the power surplus indices (Equations (3c) and (3d)) do not present significant results since the values that characterize the head are “flattened” by the value of the elevation. For high-elevation networks, these indices would be very small and not very variable.

Author Contributions

All authors contributed equally to the development of the contents of this work. All authors have read and agreed to the published version of the manuscript.

Funding

This work is partially supported by the Industrial PhD (PON) funded by FSE-FESR “Ricerca e Innovazione 2014-2020” CUP: H25D18000210006. This research was partially funded by Portuguese Foundation for Science and Technology under project UIDB/00308/2020.

Acknowledgments

We thank Águas de Santarém for providing the data and permission for its use.

Conflicts of Interest

The authors declare no conflict of interest.

References

  1. Caldarola, F.; Maiolo, M. Local indices within a mathematical framework for urban water distribution systems. Cogent. Eng. 2019, 6, 1643057. [Google Scholar] [CrossRef]
  2. Muranho, J.; Ferreira, A.; Sousa, J.; Gomes, A.; Sa Marques, A. Waternetgen: An epanet extension for automatic water distribution network models generation and pipe sizing. Water Sci. Technol. Water Supply 2012, 12, 117–123. [Google Scholar] [CrossRef]
  3. Muranho, J.; Ferreira, A.; Sousa, J.; Gomes, A.; Sa Marques, A. Pressure dependent demand and leakage modelling with an epanet extension—Waternetgen. Procedia Eng. 2014, 89, 632–639. [Google Scholar] [CrossRef]
  4. Rossman, L.A. EPANET 2: Users Manual. 2000. Available online: https://epanet.es/wp-content/uploads/2012/10/EPANET_User_Guide.pdf (accessed on 28 July 2020).
  5. Caldarola, F.; Maiolo, M. Algebraic tools and new local indices for water networks: Some numerical examples. In International Conference Numerical Computations: Theory and Algorithms; Sergeyev, Y., Kvasov, D., Eds.; LNCS 11973; Springer: Cham, Switzerland, 2020; pp. 517–524. [Google Scholar] [CrossRef]
  6. Bonora, M.A.; Caldarola, F.; Muranho, J.; Sousa, J.; Maiolo, M. Numerical experimentations for a new set of local indices of a water network. In International Conference Numerical Computations: Theory and Algorithms; Sergeyev, Y., Kvasov, D., Eds.; LNCS 11973; Springer: Cham, Switzerland, 2020; pp. 495–505. [Google Scholar] [CrossRef]
  7. Kang, D.; Lansey, K. Revisiting optimal water-distribution system design: Issues and a heuristic hierarchical approach. J. Water Res. Plan. Manag. 2012, 138, 208–217. [Google Scholar] [CrossRef]
  8. Todini, E. Looped water distribution networks design using a resilience index based heuristic approach. Urban Water J. 2000, 2, 115–122. [Google Scholar] [CrossRef]
  9. Di Nardo, A.; Di Natale, M. A design support methodology for district metering of water supply networks. Water Distr. Syst. Anal. 2012, 2010, 870–887. [Google Scholar]
  10. Maiolo, M.; Pantusa, D. A methodological proposal for the evaluation of potable water use risk. Water Pract. Technol. 2015, 10, 152–163. [Google Scholar] [CrossRef]
  11. Maiolo, M.; Pantusa, D. An optimization procedure for the sustainable management of water resources. Water Sci. Technol. Water Supply 2016, 16, 61–69. [Google Scholar] [CrossRef]
  12. Maiolo, M.; Pantusa, D. Infrastructure vulnerability index of drinking water supply systems to possible terrorist attacks. Cogent. Eng. 2018, 5, 1456710. [Google Scholar] [CrossRef]
  13. Maiolo, M.; Pantusa, D.; Chiaravalloti, F.; Carini, M.; Capano, G.; Procopio, A. A new vulnerability measure for water distribution network. Water 2019, 10, 1005. [Google Scholar] [CrossRef]
Figure 1. Part of the water distribution network (WDN) supplying the old town and the DMAs supplied by this network.
Environsciproc 02 00018 g001
Figure 2. DMA demand along the 24 h period.
Environsciproc 02 00018 g002
Figure 3. The DMAs and old town consumption along the 24 h period (both DDA and PDA results).
Environsciproc 02 00018 g003
Figure 4. Resilience indices of Todini [8] and Di Nardo et al. [9] along the 24 h of simulation.
Environsciproc 02 00018 g004
Figure 5. Graphical views of local surplus indices. PDA analysis, comparison of the results obtained along the peak condition. (a) Local pressure head surplus index, at 10:00. (b) Local pressure head surplus index, at 12:00. (c) Local discharge surplus index, at 10:00. (d) Local discharge surplus index, at 12:00.
Environsciproc 02 00018 g005
Table 1. Hazen–Williams roughness coefficients defined depending on the pipe material.
MaterialHazen–Williams Roughness
Asbestos cement140
Ductile Iron120
High-density polyethylene140
PVC140
Publisher’s Note: MDPI stays neutral with regard to jurisdictional claims in published maps and institutional affiliations.

