1. Introduction
Water and energy are inextricably connected especially in urban environments, where most of the population and economic activities are constantly concentrated at a global scale. Wastewater treatment consists of energy-consumptive stages (collection of effluent, conveyance, treatment processes, treated effluent disposal, etc.). Therefore, efficiency and energy savings measures are essential to maintain them as environmentally sustainable and economically viable.
As it is evident at every stage of sewage treatment, significant energy consumption is required for the proper operation of the plant. According to estimates by the International Energy Agency, total energy consumption for the water treatment industry is expected to increase by 130% until 2040 [
1], with the main expected increase in alternative wastewater methods of treatment (reuse, desalination, etc.). Globally, energy consumption for wastewater treatment is estimated at 14% of the water treatment industry, with a greater share of 55% in drinking water purification and distribution stages [
2]. In the European Union, according to the most recent data, a total of 29,000 waste water treatment plants (WWTPs) (with a capacity of more than 800 million inhabitants equivalent) are operating sewage treatment plants with the largest numbers being concentrated in Italy, Germany, France and Spain [
3].
As mentioned above, energy is a key factor in the proper and efficient operation of a WWTP with the stages of secondary treatment processes being the most important consumer. Worldwide wastewater treatment consumes about 200 TWh or 1% of world energy consumption, while at local administration, WWTPs consume 30–50% of their total energy expenditure (International Energy Agency, 2016). The same sources report that future energy consumption forecasts are expected to increase by 50–80% in various parts of the world. A total of five factors affect energy consumption in WWTPs: the percentage of treated wastewater in relation to the total collection volume, underground and rainwater penetration levels in the sewage systems, treatment level, contamination levels and finally the overall energy efficiency of all processes [
1]. With this in mind, detailed information of WWTPs’ energy consumption is becoming increasingly important with key objectives being to reduce economic costs and greenhouse gas emissions mitigating the global warming effects [
4]. Reducing energy costs is therefore an environmental but also an economic challenge for the future [
5]. International experience has shown that only through a detailed energy audit, per stage, process and unit within the WWTP, can the energy of the plant be fully comprehended, and the energy footprint reduced. Applying the principle of "measured and manageable" is critical in the sense that it can quantify the potential energy savings and therefore the overall efficiency of the wastewater treatment plant [
6]. The selection of treatment methods plays a key role in energy consumption. High-capacity WWTPs generally have more demanding energy requirements than smaller plants. Equally, larger plants can use energy more efficiently when comparing to the population equivalent. In wastewater treatment plants, it is the blowers, mechanical aerators, pumps, and solids-handling systems that consume the largest amounts of electrical energy [
7].
In recent years, most efforts to improve WWTP performance have focused on achieving good effluent quality [
8,
9,
10,
11,
12]. However, new challenges are currently being addressed, which are geared to ensuring the viability of wastewater treatment plants in terms of economic feasibility and environmental impact. Recent technological advancements in monitoring, as well as enhanced anaerobic digestion of sludge for biogas production, direct the evolution of WWTPs to almost self-sustainable facilities [
13]. Energy self-sustainability in Czech plants can rise to 70–80% via optimized biogas production due to two main reasons: high efficiency of primary sedimentation and the high efficiency of the upgraded anaerobic digestion process [
14]. Energy consumption and greenhouse gas (GHG) emissions are among the factors affecting the carbon neutrality of WWTPs [
15,
16]. Methane (CH4) and nitric oxide (N2O) during biological wastewater treatment processes and CO2 are also emitted during the production of the energy required to operate the plant. CO2 released due to energy demand can be directly reduced by increasing the energy efficiency of wastewater treatment plants. In this way, reducing both environmental impacts and treatment costs by increasing energy savings can be achieved simultaneously [
17]. Several national benchmark studies have already been published for Italian, Austrian, Scandinavian, Portuguese, Australian and Japanese WWTPs. The objective of this study is to contribute to the international benchmarking efforts to reduce energy consumption in WWTPs and to achieve higher energy efficiency levels, without undergoing treated effluent quality standards.
2. Materials and Methods
An important and crucial part of this survey was to collect, process and integrate all necessary data, relevant to the current energy status of existing WWTPs, in a database. Actual focus was given during their collection phase to utilize available national or international data sources. The main sources used were the Greek Wastewater Treatment Plants Database [
18] as well as the European Database of WWTPs [
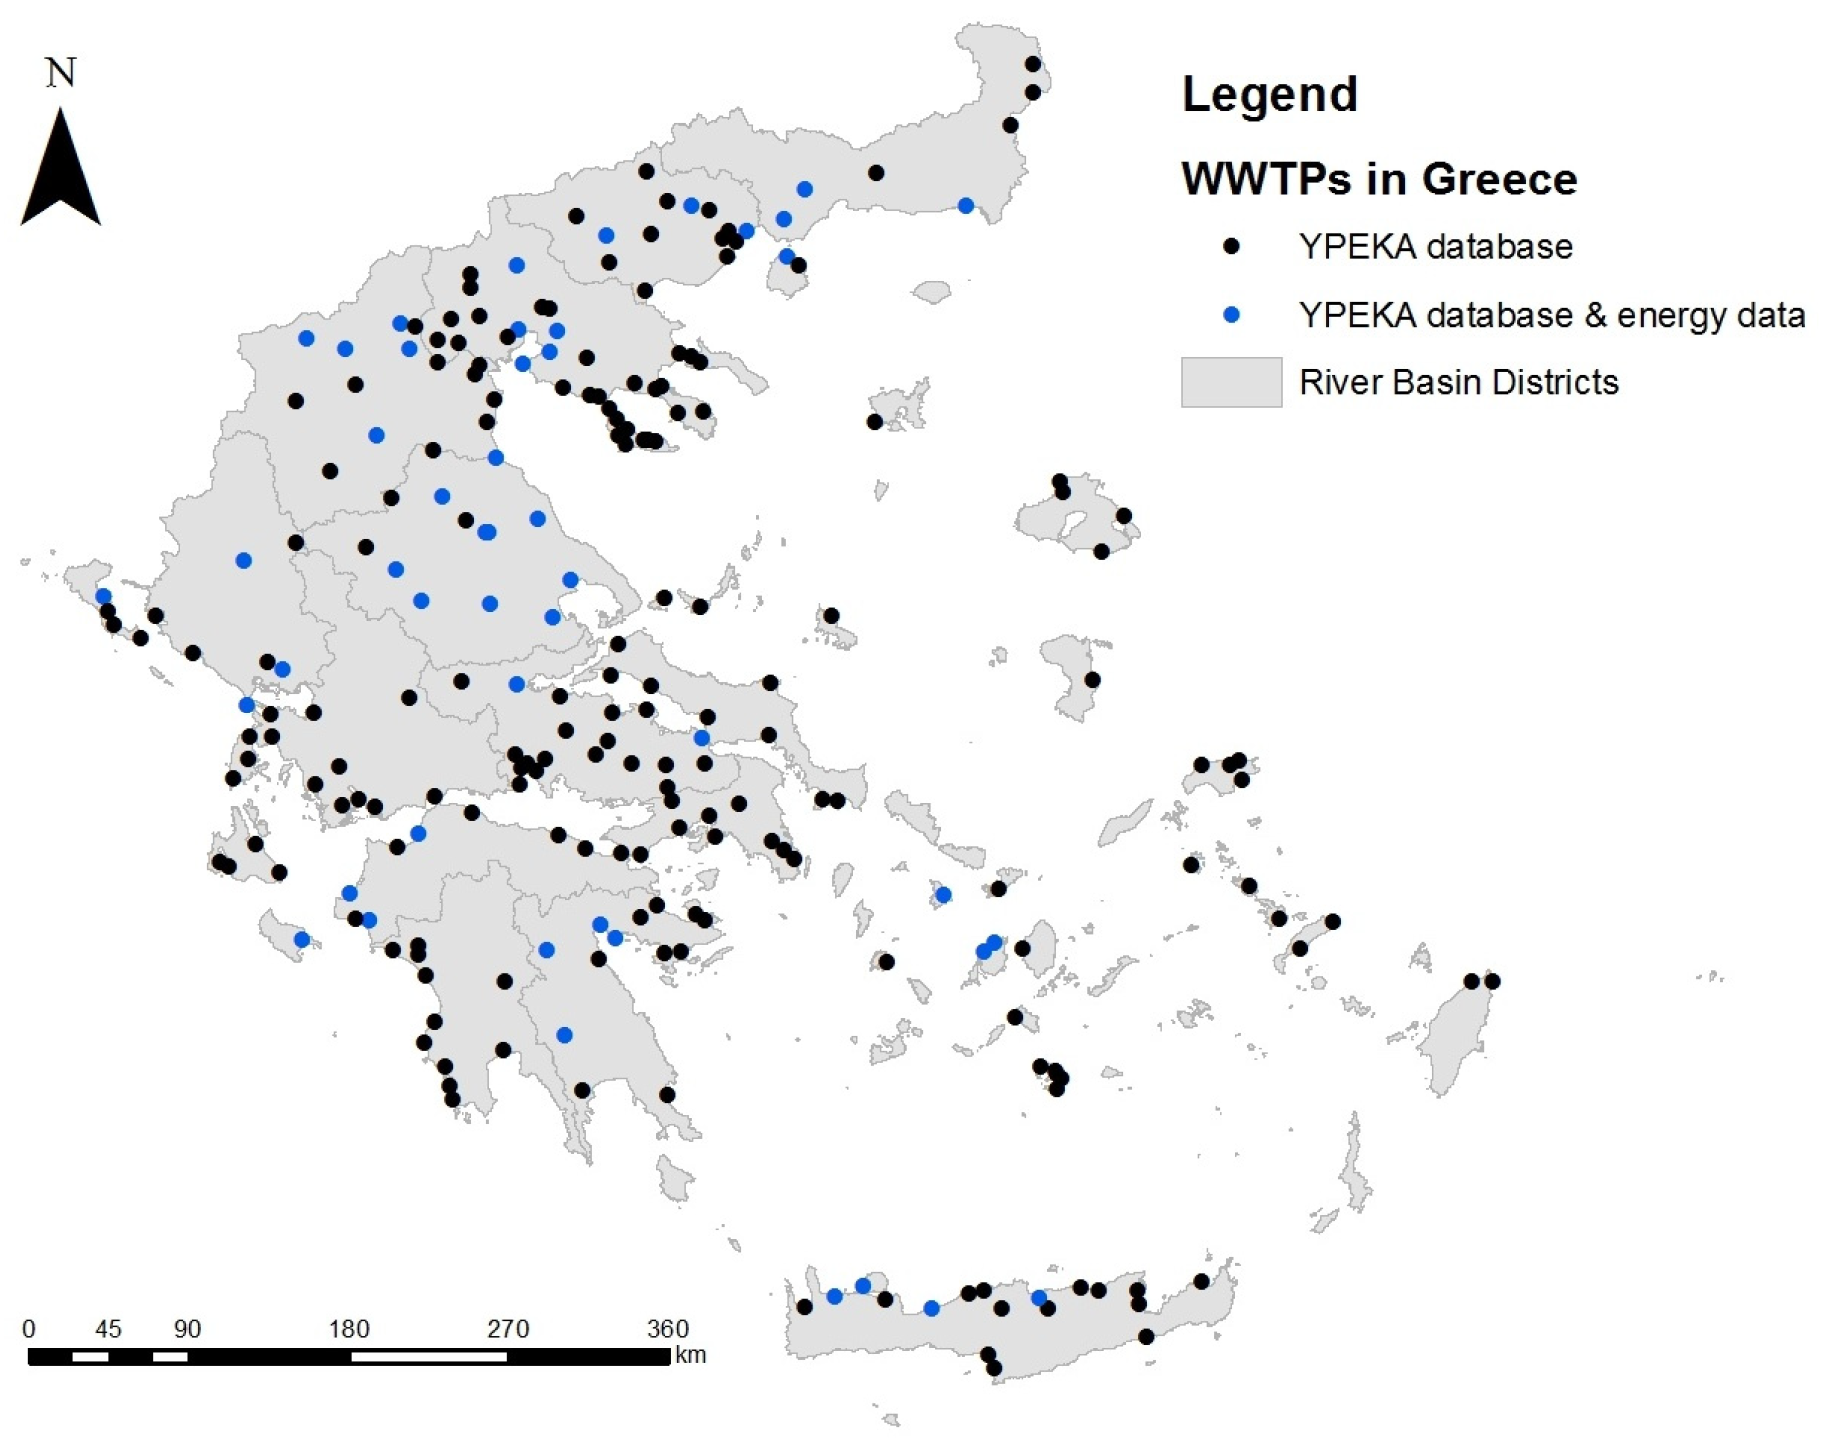
19] on the implementation of Directive 91/271/EEC. The results of the data collection phase for WWTPs across Greece were integrated into a database, with the reference period 2016–2017. In total, we managed to collect operational and technical specifications data for all the 243 licensed WWTPs, while energy profile data per treatment stage were managed to be collected for a sample of 61 WWTPs as shown in
Figure 1. The main data collected from the 61 WWTPs were: list of main electromechanical equipment in use, energy consumption and energy cost data where available. The whole database represents all reported facilities in the Greek national registry with a total capacity of almost 14 million population equivalent (P.E), while 25% of the facilities have tertiary treatment available. This represents more the 50% of the nation’s P.E. capacity. Influent volumes rise to 836,000 m
3 while the total dry sludge (DS) production is about 92,000 tons/year. Based on the present 302 million m
3 of treated effluent, only 8% of it is currently reused: mainly in the River Βasin District (RBD) of Crete (2.5 million m
3 per year) and Western, Central and Eastern Macedonia RBDs (1.7 million m
3 per year). Regarding the sample of 61 WWTPs with energy profile data, they represent 4.5 million P.E (32% of the population), 15 of which (25%) have tertiary treatment technology. The anaerobic digestion process is already applied in a small subset (12 facilities—20%) of them.
The grouping of WWTPs was based on the Directive 91/271/EEC; Class A P.E. > 100,000, Class B 100,000 > P.E. > 10,000, Class C 10,000 > P.E. > 2000 and Class D P.E < 2000. Based on the energy data deployed, classes C and D have been merged to avoid single plant grouping for class D.
The spatial distribution of the data collected covers both the mainland and island parts of Greece, taking into account both seasonal fluctuations due to climate and inflows especially in tourist areas (coastal areas and islands). As for the total number of WWTPs, the 61 facilities which cover the full range of facilities’ capacities represent 25% of the total number of plants. In the Water Districts of Thessaly (GR08) and Western Macedonia (GR09) it was possible to collect most of the data (63 and 57%, respectively). Additionally, 12 (B, C and D class) out of the 61 WWTPs with available energy data are not yet included in the national database. In three Water Districts (W. Peloponnese—GR 01, W. St. Ellada—GR 04, Attiki—GR06), the gathering of energy data was not feasible mainly due to the additional processing required by operators. The completeness of the data reaches more than 50% (in terms of PE; 4.495.476 PE), particularly high given the relative homogeneity and capacity size of the WWTPs. The WWTP of the capital city of Athens (Psytalleia plant) is excluded from this analysis due to its heavily influential magnitude (5.200.000 P.E.) to the sample. From the above it was regarded that the sample collected is representative for the following energy analysis.
The methodological approach followed in order to adequately assess the energy profile of the WWTPs in Greece was mainly based on the elaboration of key performance indicators (KPIs). The indicators examined were based on the volume of untreated inflows (KPI 1 in kWh/m3), total capacity of the plant (KPI 2 in kWh/PE) and the overall organic load removal performance (KPI 3 in kWh/kg CODremoved). Each one of the abovementioned indicators has specific advantages and drawbacks in the representativeness of energy consumption of the WWTP which is mainly focused in the capability to describe the complexity of all the processes which are taking place in each of the treatment stages.
As an example, KPI 1 appears misleading because plants with significant stormwater inflows seem erroneously more energy-efficient, due to a higher denominator in the calculation of the indicator kWh/m
3. On the other hand, the use of KPI 2 and KPI 3 is analogous and similar, as the constant per capita load of 120gCOD/P.E.day is used to convert the organic load to P.E. and vice versa. However, KPI 2 does not represent the removal of pollutants directly. Therefore, it can be concluded that KPI 2 and KPI 3 are interchangeable, the use of one or the other can be left to the user’s discretion, while KPI 1 may lead to significantly different conclusions [
20]. Novel methods combining the energy efficiency indicators with the organic load removal efficiency proved to be a tool for holistically improved operation of WWTPs [
21].
All the collected data from the national authorities as well as the regional plant operators have been analyzed based on all available information reported, cross-checked and validated with the available data and techniques. The main objective of this statistical analysis was an overall energy evaluation of WWTPs including intra-comparisons among different energy-consumptive treatment stages with respect to average daily flow, population equivalent, COD removed, treatment stage, biological treatment method, plant size, type of sewer network, aeration method and sludge treatment process. The final step was the establishment of energy consumption benchmarks per WWTP class.
3. Results
The energy analysis results for the different treatment stages revealed that on average WWTPs in Greece consume most of their energy in secondary treatment (72%) and pretreatment (13%) stages. Sludge management consumes 8% and tertiary treatment 6%. Primary treatment and rest of equipment follow with only 1%.
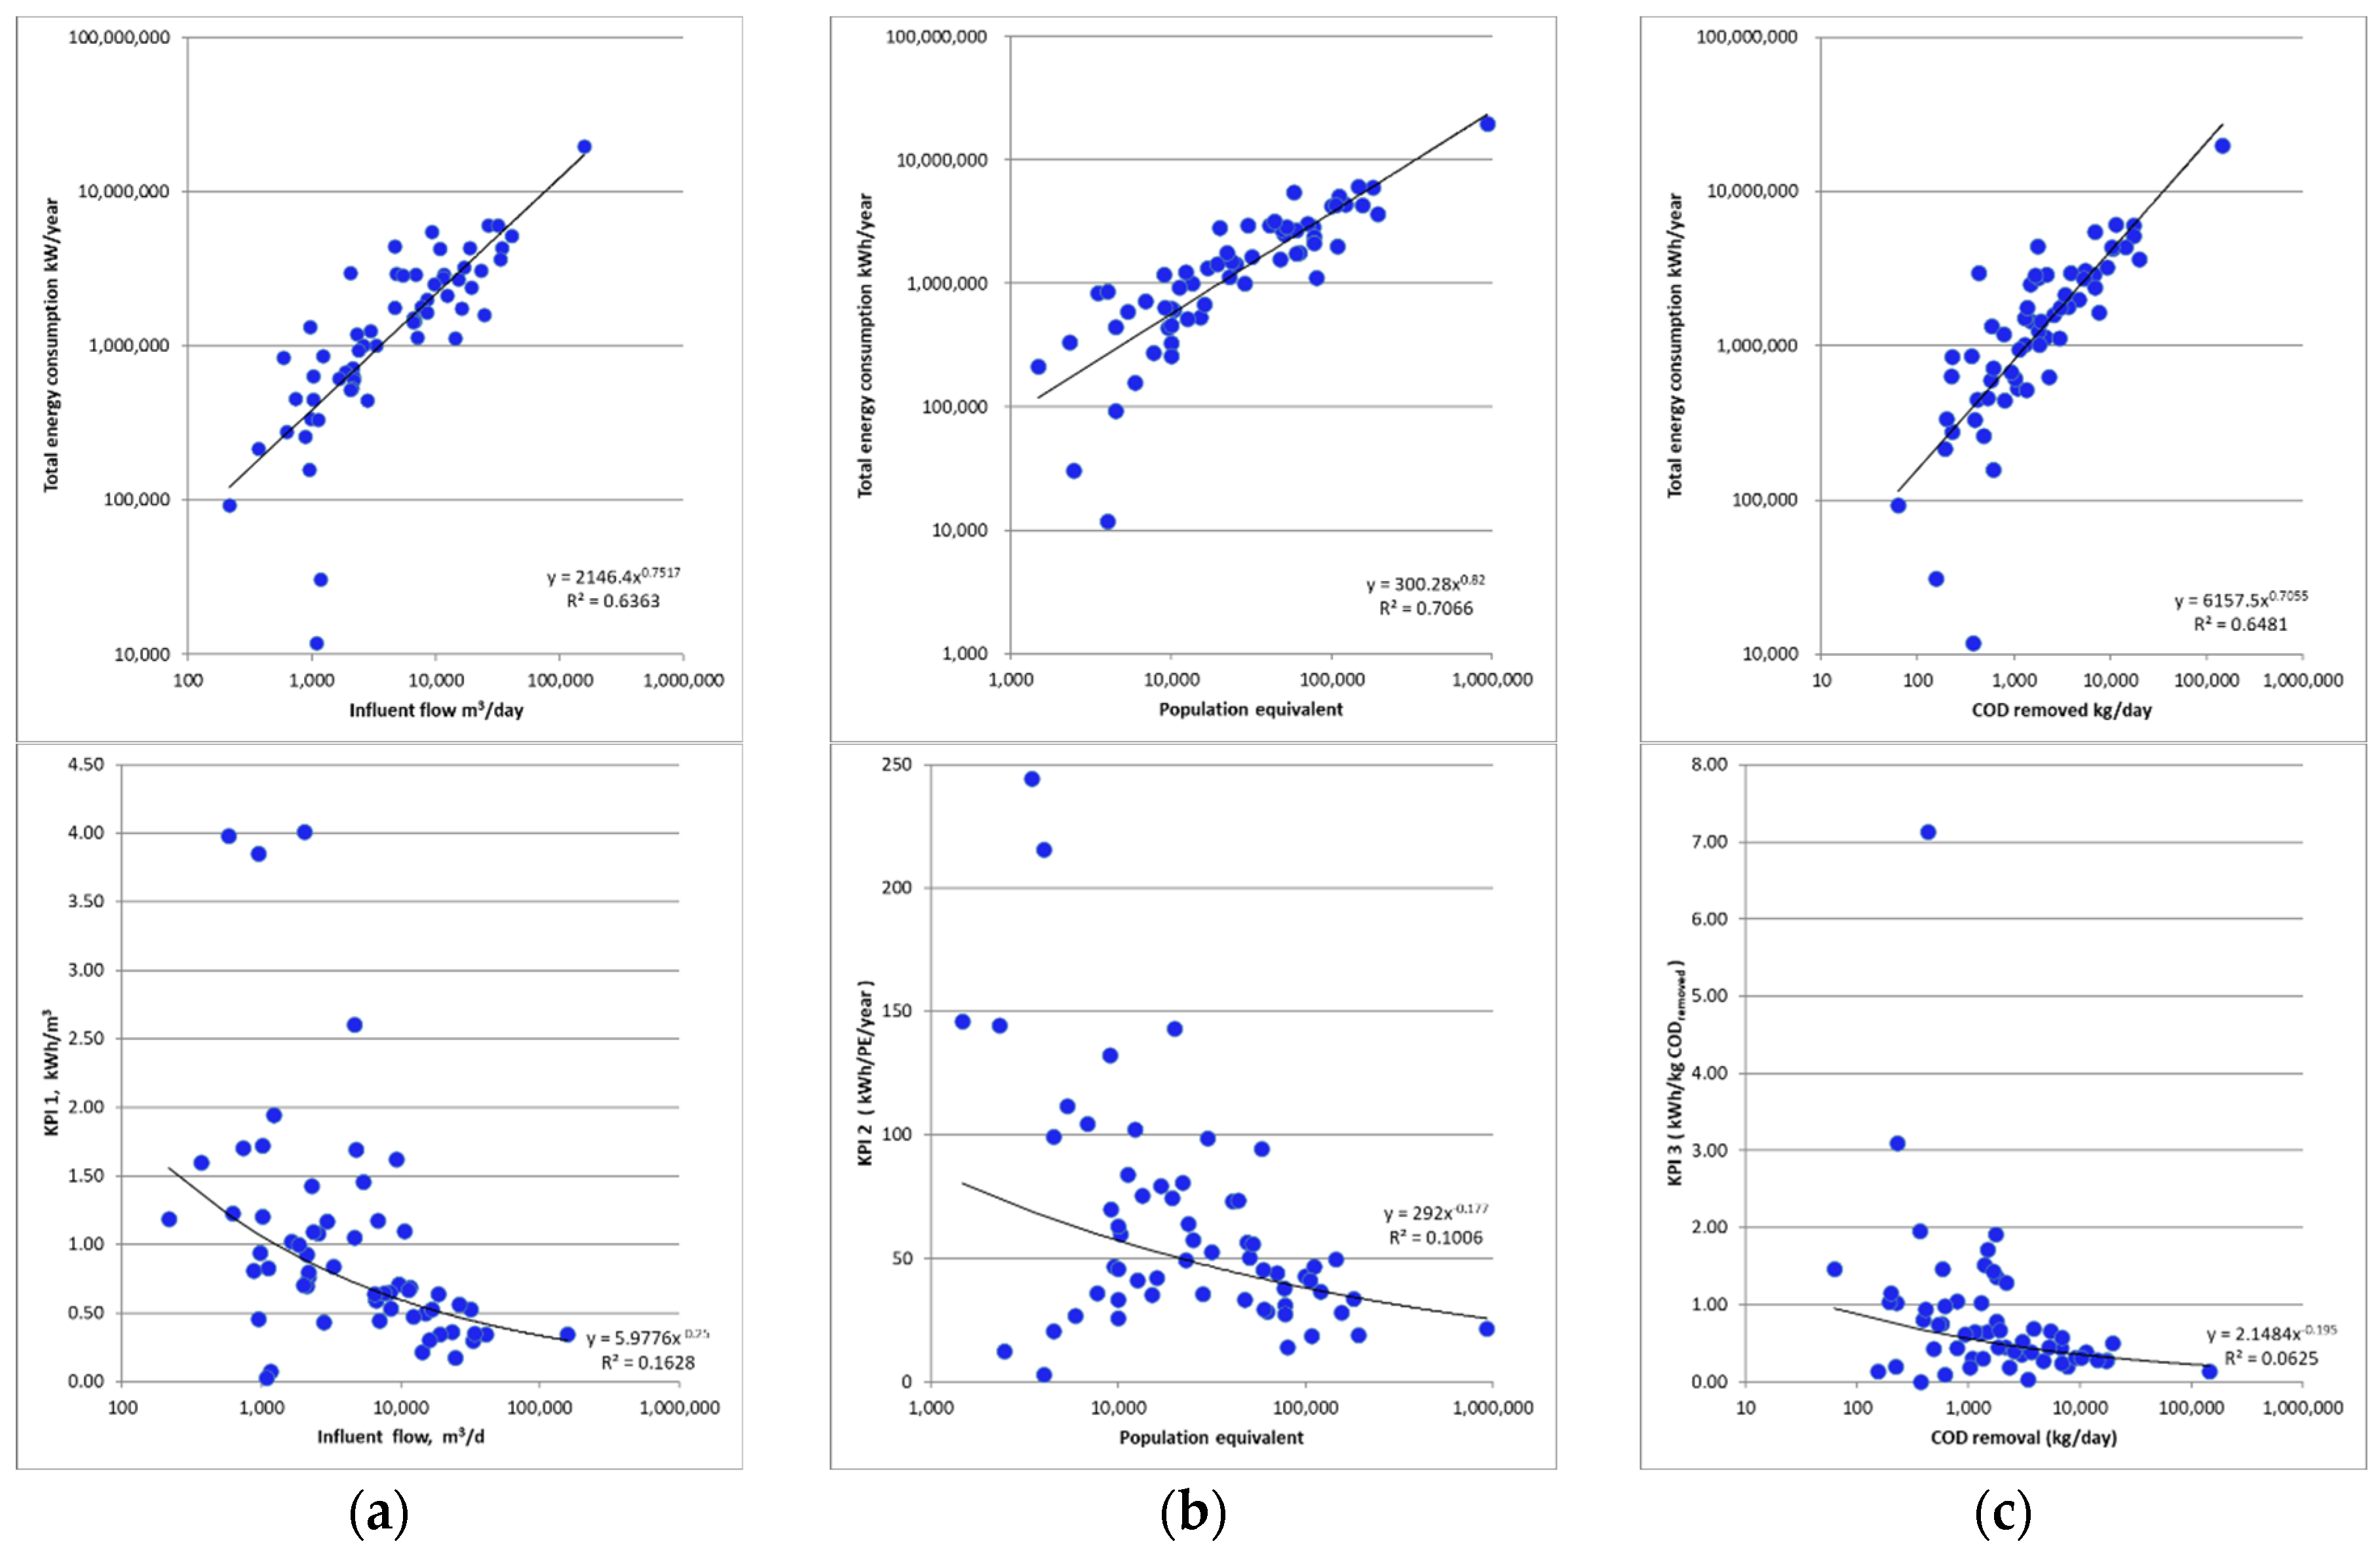
The total energy consumption of the Greek WWTPs is presented in a bilogarithmic graph in
Figure 2 and expressed as kWh/year for an immediate estimation of the annual bill. In all cases, data can be described by the use of a power law. The total energy consumption increases with increasing flow, population equivalent and organic load removal, an expected behavior and in agreement with the literature.
The KPI results of the energy consumption analysis are also presented in
Figure 2. Energy consumption per volume of treated wastewater varies with the dimension of the plant, being lower for larger plants. Energy consumption per PE varies considerably within the samples analyzed. Values up to 245 kWh/P.E. yr. were found for small plants, while larger plants are characterized by energy consumption between 22 and 95 kWh/P.E.yr. As far as specific energy consumption per kg of COD removed is concerned, it can be observed that this index is normally higher for smaller plants and presents a very large variability for medium to large plants.
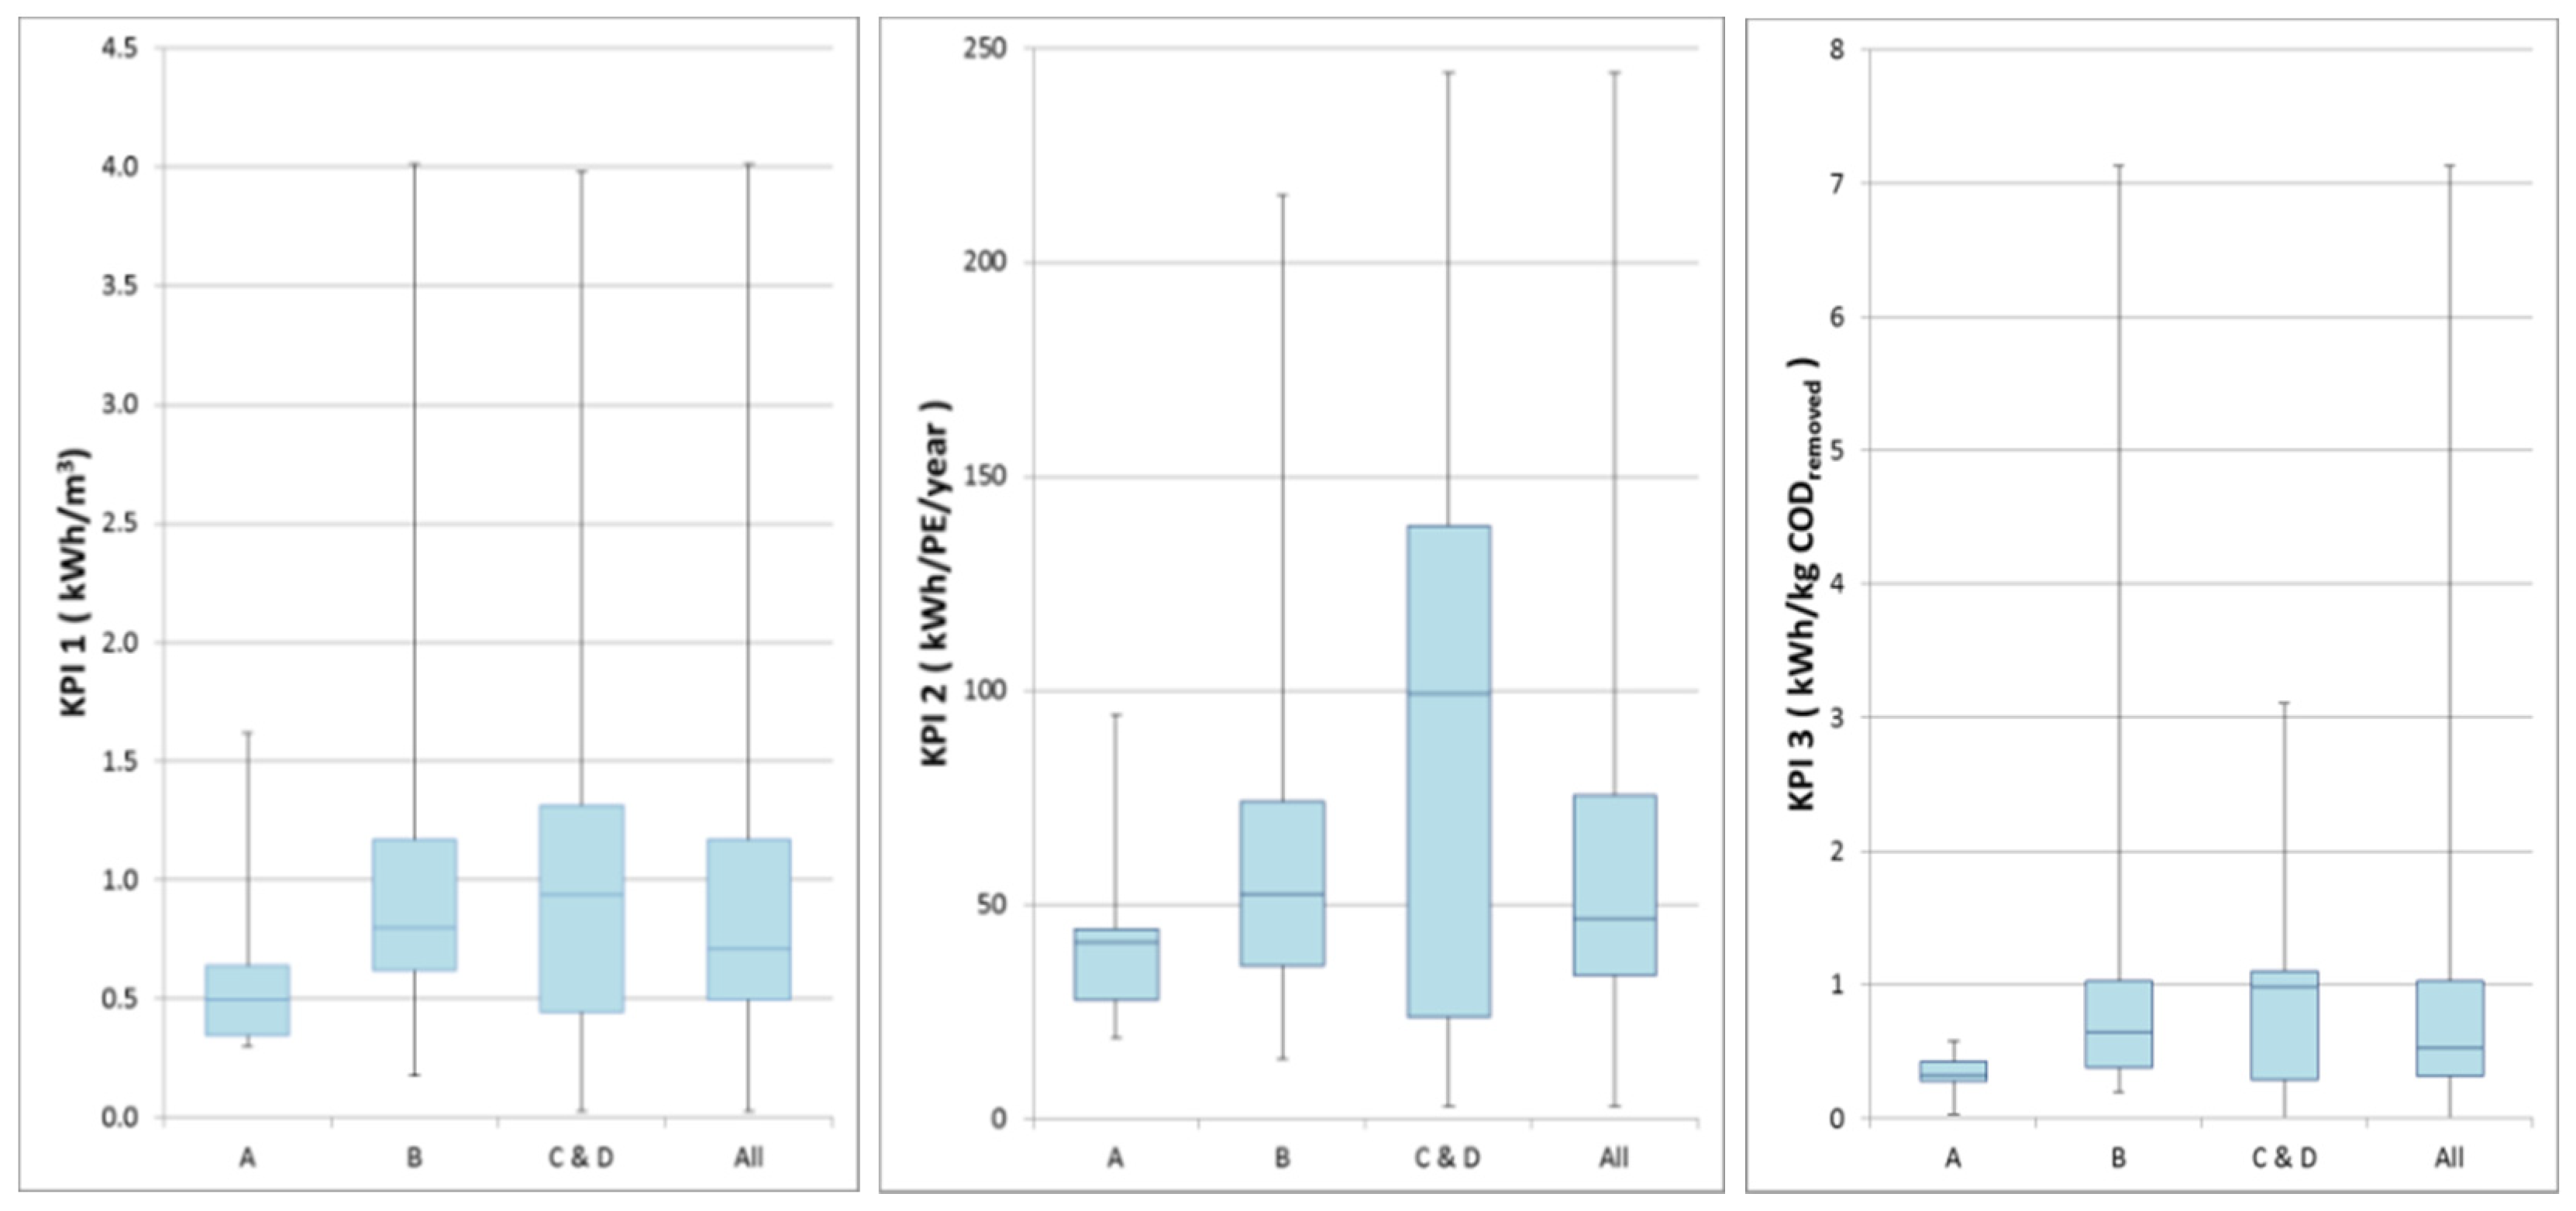
Further analysis of the distribution of KPI values among different capacity classes reveals the variance and total extent differences among them as shown in
Figure 3. In all cases, it is confirmed once more that the largest WWTPs (Class A and B) are the most efficient both operationally and in terms of energy efficiency. The largest variance is met in small WWTPs (C and D classes) for KPI 1 and KPI 2.
In A Class, WWTPs’ specific energy values for organic load removal were found to be 0.35 kWh/kg COD, 5.95 kWh/kg Ν, 6.38 kWh/kg P and 0.07 kWh/kg total pollution equivalent [
22] (ΤΡΕ = COD (kg) + 20 TN (kg) + 100 TP (kg). B Class WWTPs show 0.9 kWh/kg COD, 11.5 kWh/kg Ν, 12.8 kWh/kg P και and 0.16 kWh/kg ΤPE. Last, C-D Class WWTPs are the most energy consuming with 0.95 kWh/kg COD, 18.46 kWh/kg Ν, 5.02 kWh/kg P και and 0.23 kWh/kg ΤPE. Considering the relatively low specific energy value of phosphorus removal, this is probably attributed to the fact that most of the C-D WWTPs lack phosphorus removal equipment.
A comparison of processes applied during wastewater treatment based on all three energy performance indicators is presented in
Table 1. Plants with Moving Bed Biofilm Reactor (MBBR), Membrane Bioreactor (MBR), oxidation ditch-MBR are excluded from the analysis due to insufficient data. Constructed wetland is another physical treatment method, with practically no installed electromechanical equipment. In terms of kWh/PE.yr. the least energy-consuming process was from conventional activated sludge systems—CAS (43.8 kWh/PE.yr.), followed by oxidation ditch systems (47.1 kWh/PE.yr) and extended aeration systems (81.1 kWh/PE.yr. On the other hand, CAS exhibits the highest value in terms of organic load removal (1.0 kWh/kg COD
removed,) followed by extended aeration (0.95 kWh/kg COD
removed).
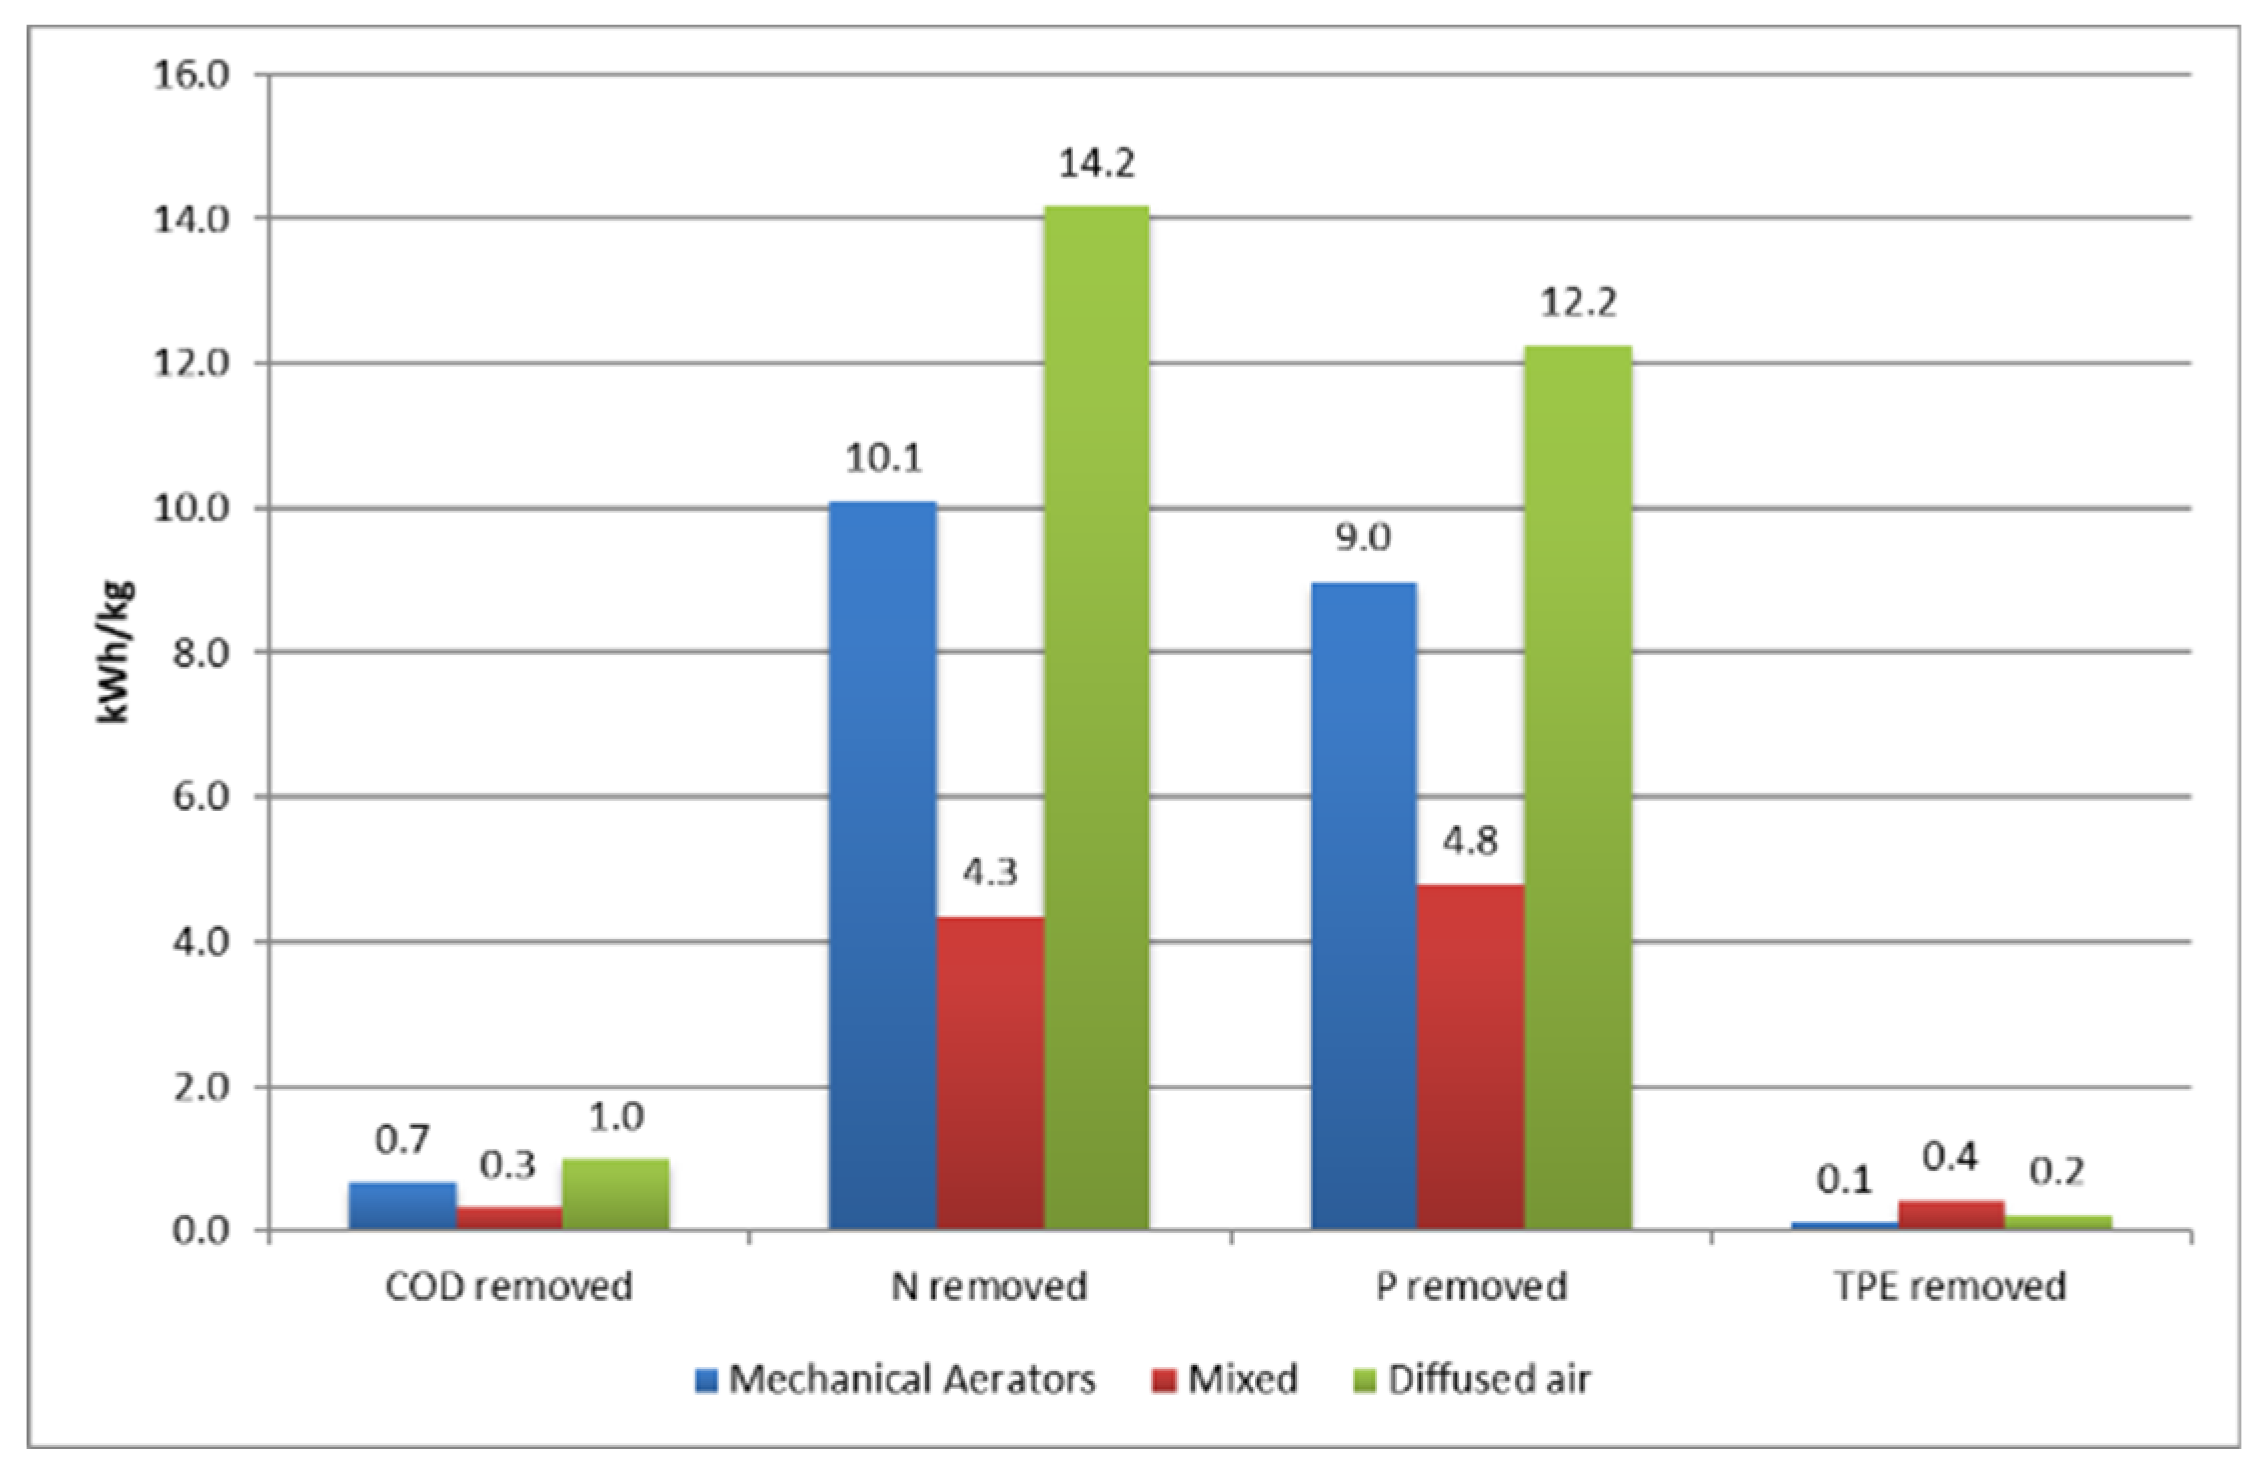
Among the parameters studied in this survey was the aeration system. Higher values of specific energy consumption for organic load removal were found in diffused air than in mechanical aeration (
Figure 4). The diffused air method is mainly used in smaller plants, which are less energy-efficient as mentioned above.
As far as the sludge treatment process is concerned, different configurations were analyzed, including thickening and dewatering. The most energy-consuming method was found to be the combination of thickening tanks–centrifuge (26.17 kWh/kg SS processed), followed by a sophisticated complex system of pre-thickening tanks–centrifuge and post-thickening tanks–centrifuge–belt filterpress (8.4 kWh/kg SS processed) and filterpress (6.66 kWh/kg SS processed).
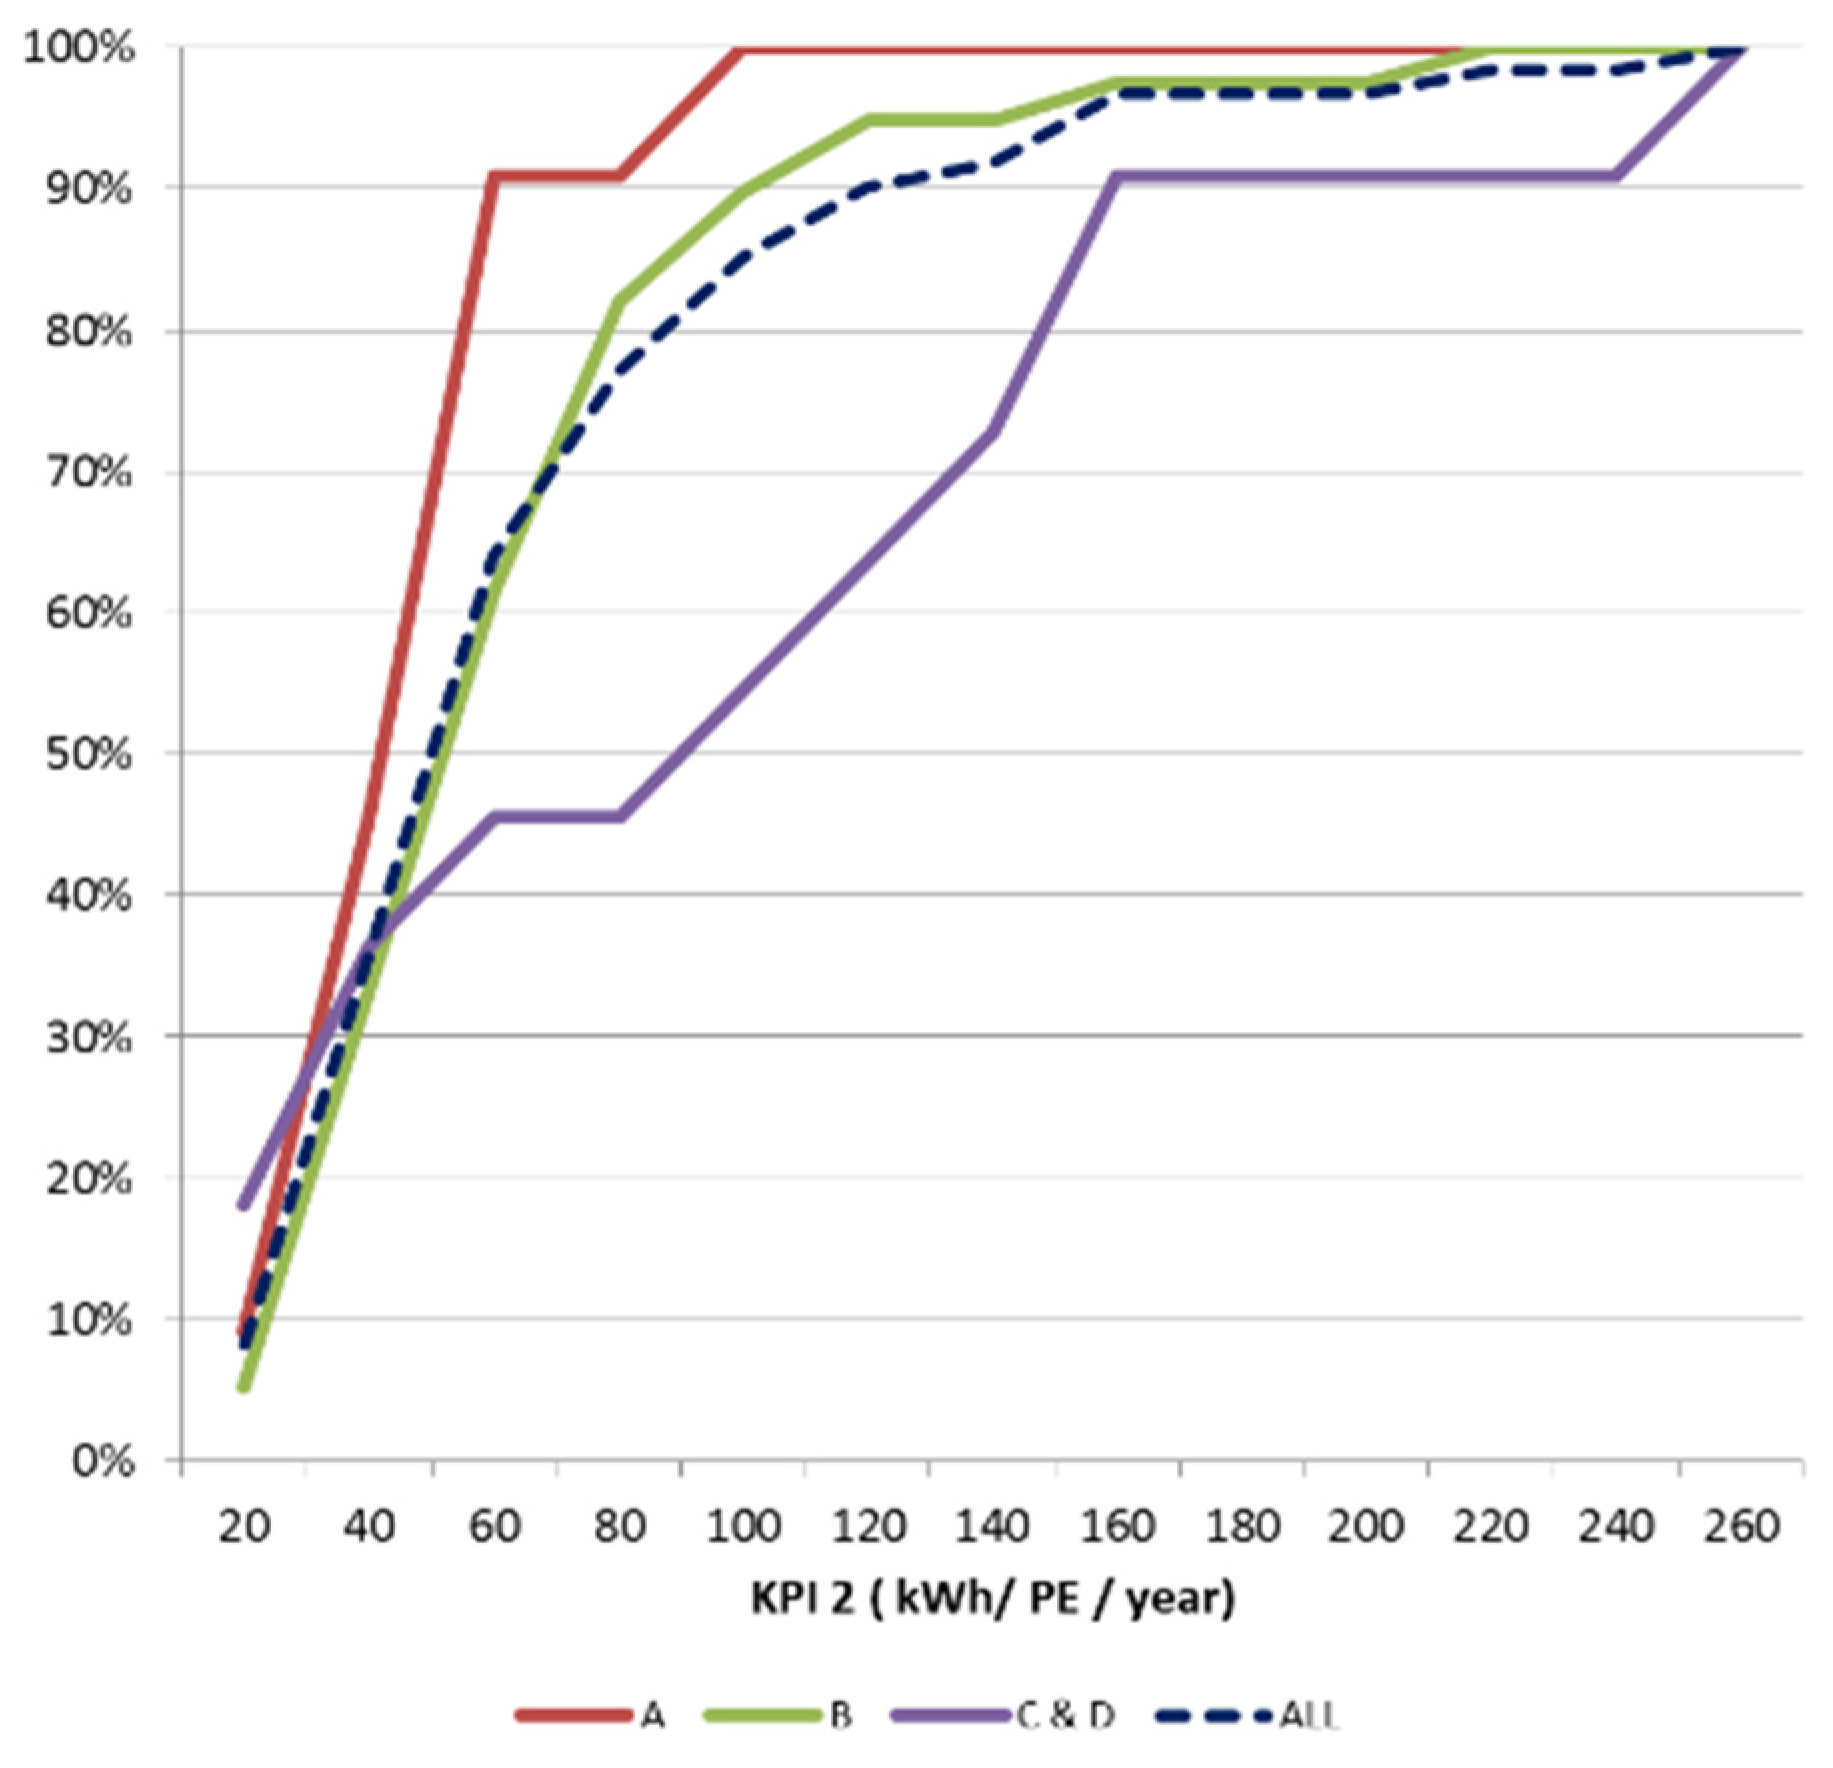
As this is the first effort to assess the energy performance of WWTPs in Greece, the process had to take into account that a credible benchmarking is and will be a perpetual effort. This will allow to adequately assess the energy status (via periodic energy audits, e.g., on an annual basis) and afterwards to optimize the operations in situ based on priorities and budget savings. This requires the definition of benchmark values, which in our case had to be defined at capacity class level as shown in
Figure 5. As the monitoring programs expand, more detailed data will be available, and the curves are expected to be reshaped especially for the B and C classes. Several studies conducted in Europe propose the indicator kWh/P.E.yr. as the most meaningful for benchmark purposes, because the organic pollution load correlates best with energy consumptions and also ensures a better comparison among different plants. A suitable and feasible benchmark value per capacity class is selected on the 60th percentile (ranging from 40 to 90 kWh/PE.yr.) based on the current energy status of Greek WWTPs.
4. Conclusions
Energy consumption benchmark values are a powerful management tool, using specific indicators to determine the optimal energy efficiency assessment of a WWTP. Benchmarking supports the identification of opportunities for energy savings and can help prioritize optimization with targeting measures. Comparing the performance of a sewage treatment plants with the benchmark values, energy optimization can be performed and potentially reduce energy costs. From the statistical analysis of energy data, it appears that the stage which contributes the most in energy consumption is the secondary processing, by means of 72%. This is followed by the pre-treatment with an average of 13% of the treatment sludge with 8%, tertiary treatment with 6% and primary treatment with 1%.
Regarding the use of benchmark energy indicators, it was found that the indicator kWh/m3 is not fully representative of the energy consumption of a WWTP, and, as in the case of combined or mixed systems, is affected by dilution due to the inflow of rainwater. On the contrary, energy indicators kWh/P.E.yr and kWh/ kg CODremoved are similar in use and generally proposed for energy benchmarking purposes. WWTPs served by a combined sewage system show high specific energy values in terms of kWh/P.E.yr., due to the additional energy consumption of equipment sized hydraulically such as pumps, screens and filters, among others. This fact is opposed to low values of kWh/m3 reduced by dilution.
The largest plants with PE > 100,000 appear quite independent from COD concentration, while a decreasing trend was observed for plants up to 100,000 PE. Further, these plants exhibit the lowest values of organic load removal performance indicators such as kWh/kg COD, kWh/kg Ν, kWh/kg P και and kWh/kg ΤPE. This is attributed to facts such as: advantage of sharing a fixed quota of energy consumption on a greater organic load (in the denominator); more stable operating conditions, while small plants undergo frequent transitional periods which are particularly energy-intensive; and automation and optimization tools such as variable-frequency drives in aeration or pumping, among others.
With respect to treatment technology, the highest value of 1.0 kWh/kg COD removed is observed in CAS systems, as it is applied in the largest WWTPs of Thessaloniki, Larisa, Aineia, Volos, Ioannina and Chania. It seems that in CAS systems, the increased total energy exceeds the increased loads in the denominator, so the high value of the indicator is met. The extended aeration system follows with 0.95 kWh/kg COD removed as it is applied to medium and small size plants.
On the other hand, the least energy-consuming method in terms of kWh/P.E.yr. is CAS. This agrees with the results of other relevant publications as well. As far as the aeration method is concerned, most A Class WWTPs use surface aerators, while in B-C-D Class WWTPs, submerged air diffusers are dominant. Higher specific energy indicators for organic loads removal are observed in diffused air systems. Lastly, the most energy-consuming sludge treatment configuration in terms of kWh/kg SS processed and KWh/PE.yr was found to be the thickening tank followed by centrifuge.
Based on the current energy status of Greek WWTPs’ best available technics, optimized measures and solutions can be proposed for their operation.


