Reduction of Nitrogen Load in a Zootechnical Wastewater Using a Natural Chabazite Zeolite: An Investigation on Sorption Mechanisms †


Abstract
:1. Introduction
2. Materials and Methods
2.1. Materials, Experimental Design and Analytical Methods
2.2. Data Analysis and Calculations
3. Results and Discussions
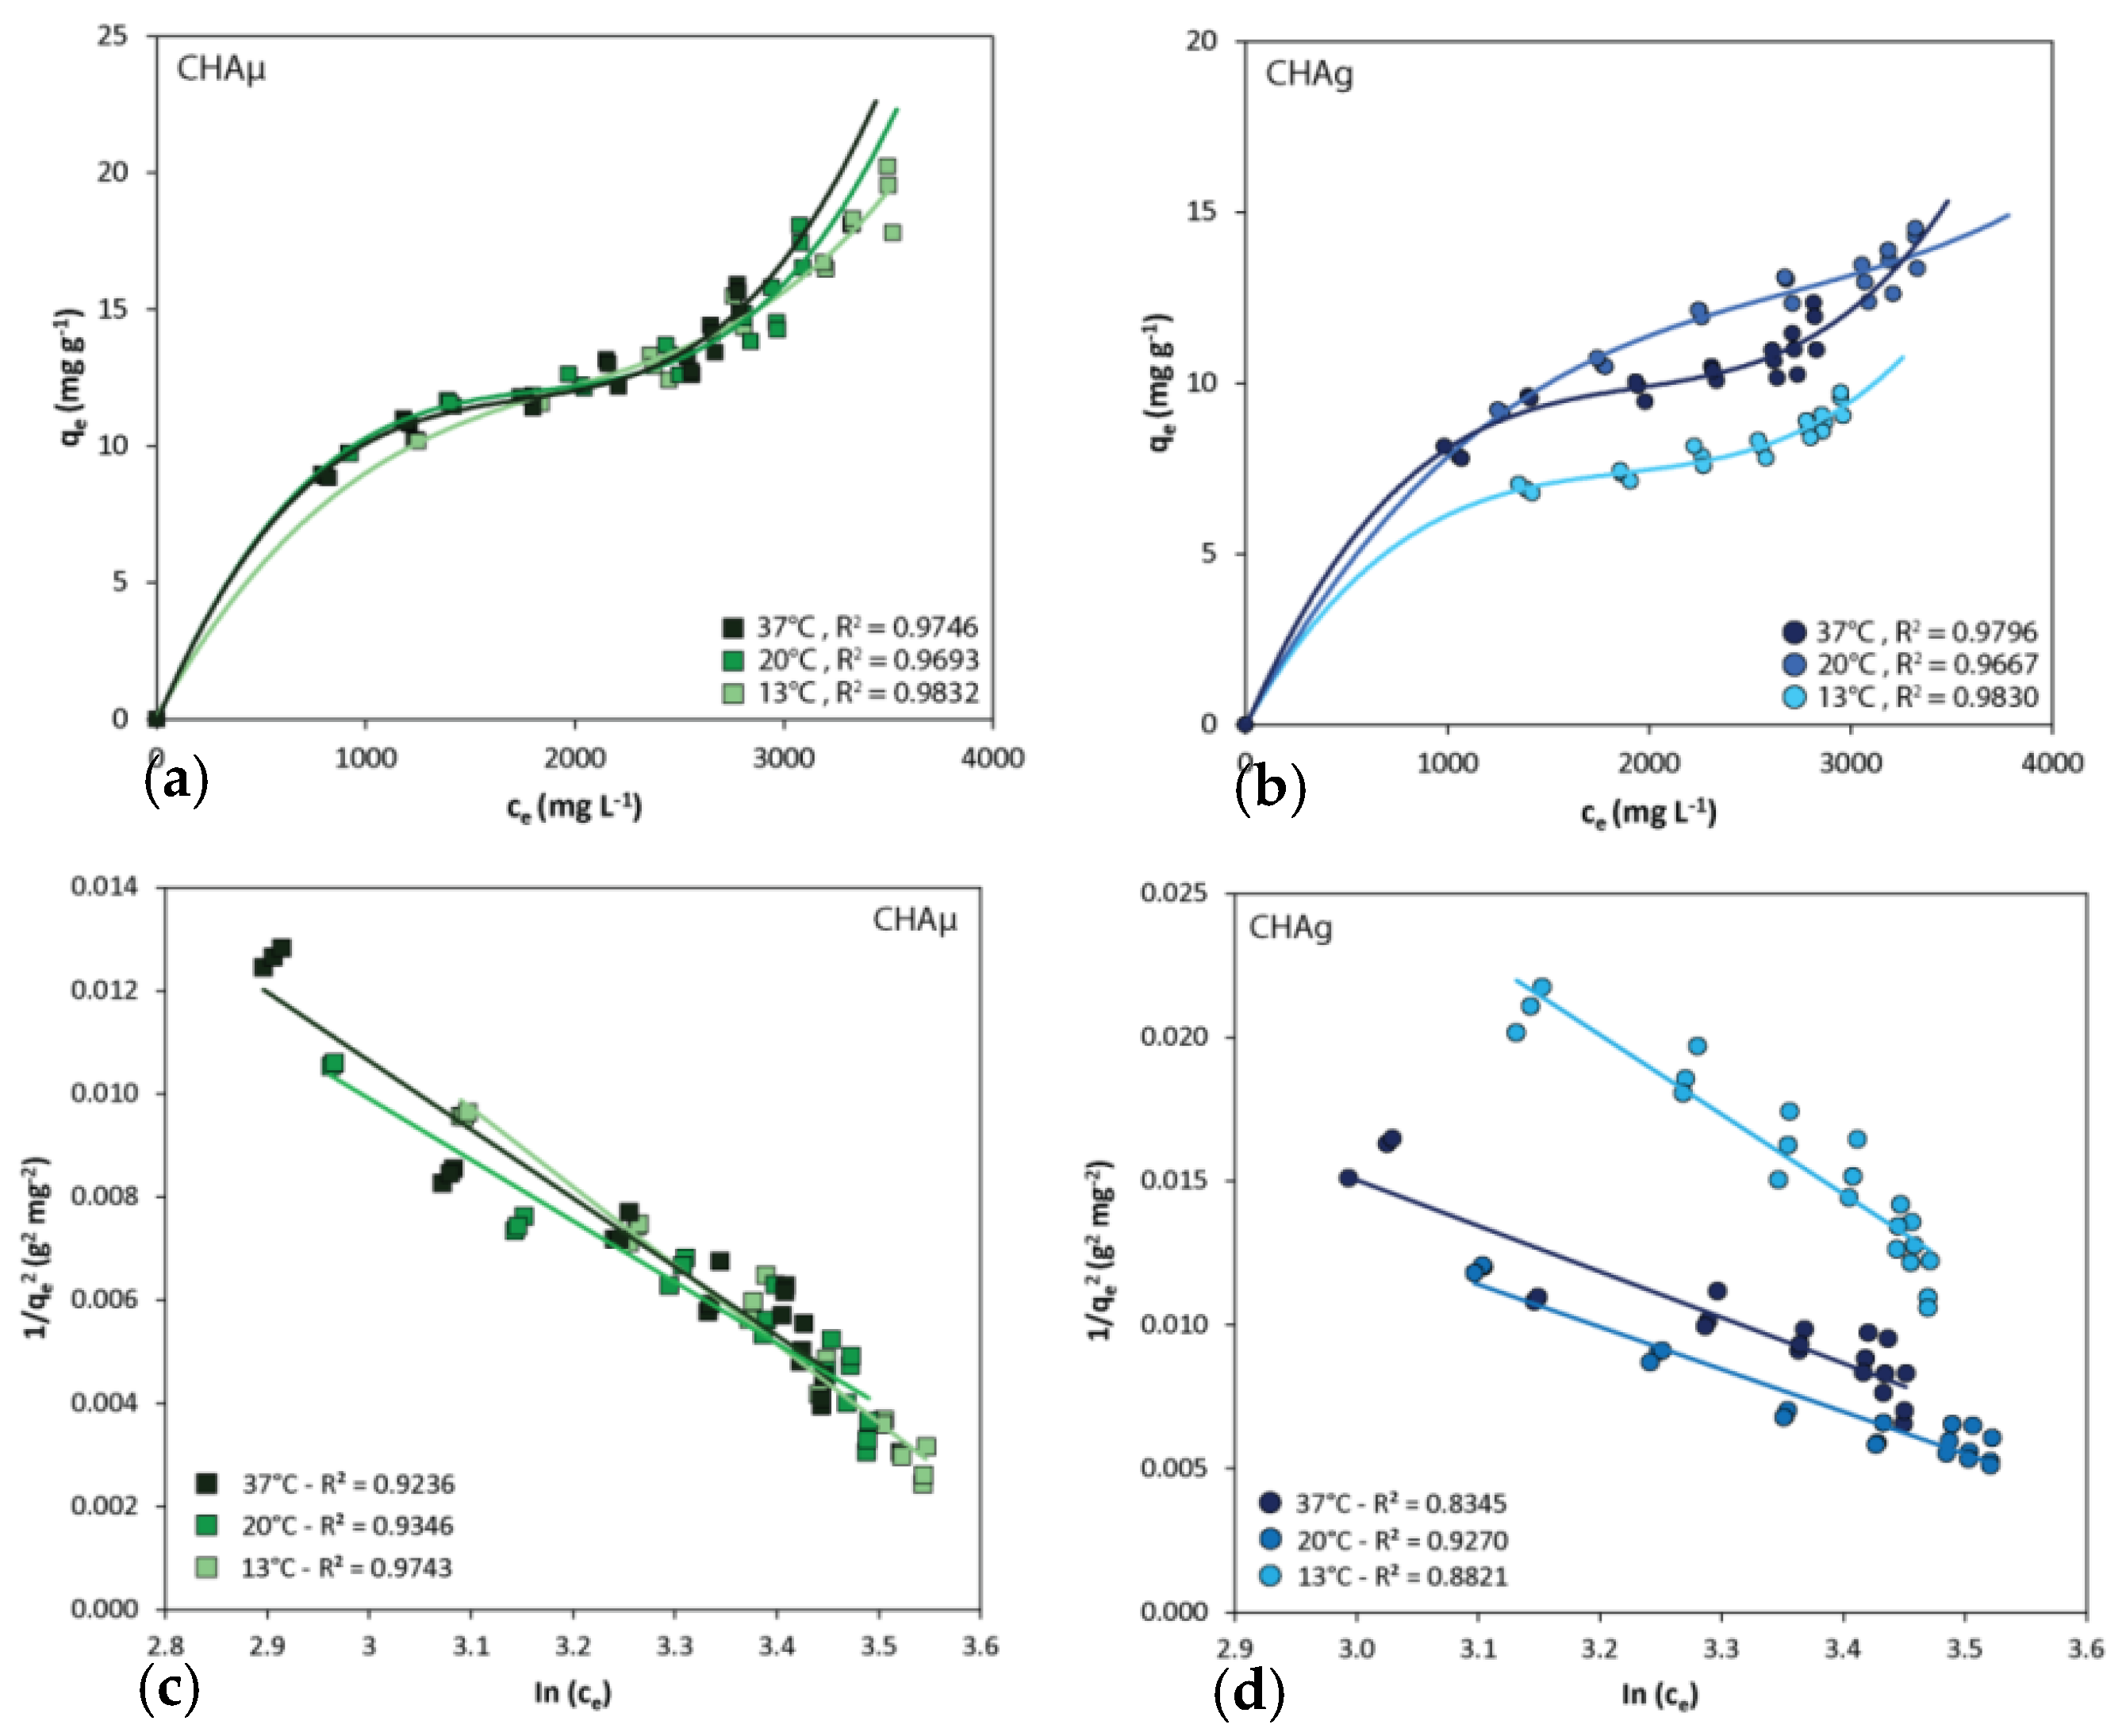
3.1. Isotherms
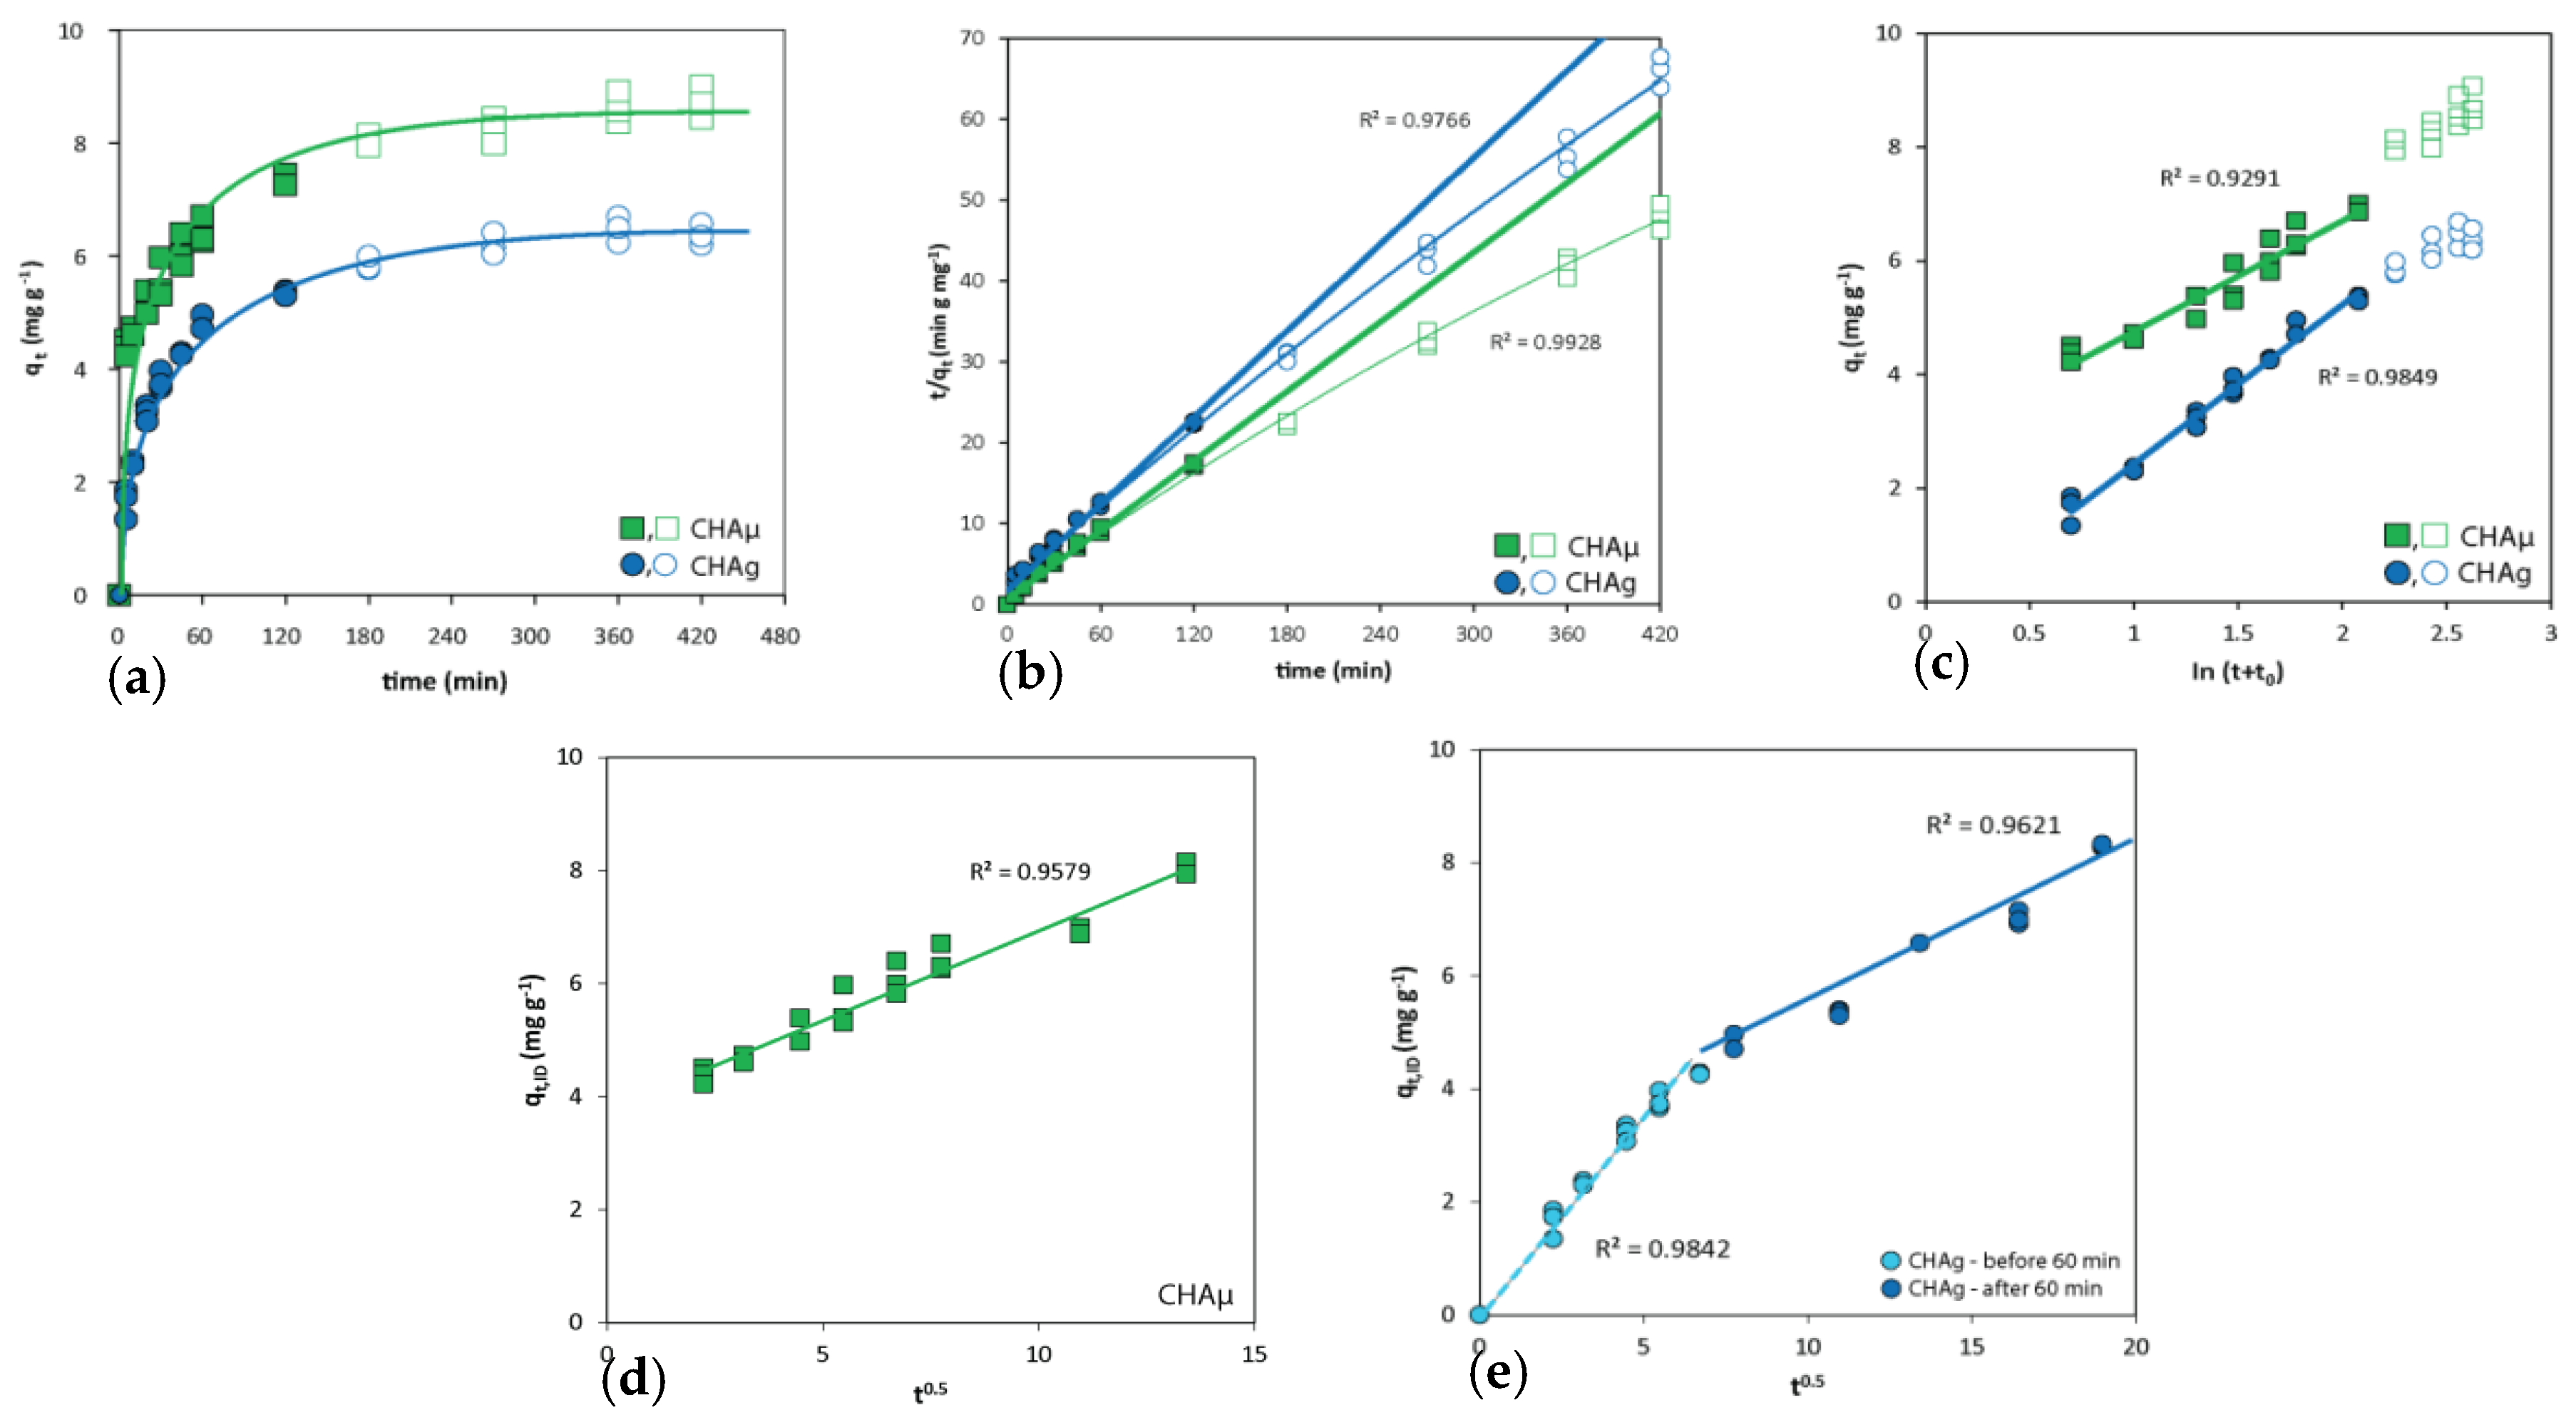
3.2. Kinetics
3.3. Thermodynamics
4. Conclusions
Author Contributions
Funding
Acknowledgments
Conflicts of Interest
References
- Ferretti, G.; Galamini, G.; Medoro, V.; Coltorti, M.; Di Giuseppe, D.; Faccini, B. Impact of Sequential Treatments with Natural and Na-Exchanged Chabazite Zeolite-Rich Tuff on Pig-Slurry Chemical Composition. Water 2020, 12, 310. [Google Scholar] [CrossRef]
- Ferretti, G.; Faccini, B.; Vittori Antisari, L.; Di Giuseppe, D.; Coltorti, M. 15N Natural Abundance, Nitrogen and Carbon Pools in Soil-Sorghum System Amended with Natural and NH4+-Enriched Zeolitites. Appl. Sci. 2019, 9, 4524. [Google Scholar] [CrossRef]
- Ferretti, G.; Keiblinger, K.M.; Zimmermann, M.; Di Giuseppe, D.; Faccini, B.; Colombani, N.; Mentler, A.; Zechmeister-Boltenstern, S.; Coltorti, M.; Mastrocicco, M. High resolution short-term investigation of soil CO2, N2O, NOx and NH3 emissions after different chabazite zeolite amendments. Appl. Soil Ecol. 2017, 119, 138–144. [Google Scholar] [CrossRef]
- Faccini, B.; Di Giuseppe, D.; Ferretti, G.; Coltorti, M.; Colombani, N.; Mastrocicco, M. Natural and NH4+-enriched zeolitite amendment effects on nitrate leaching from a reclaimed agricultural soil (Ferrara Province, Italy). Nutr. Cycl. Agroecosystems 2018, 110, 327–341. [Google Scholar] [CrossRef]
- Lin, L.; Lei, Z.; Wang, L.; Liu, X.; Zhang, Y.; Wan, C.; Lee, D.J.; Tay, J.H. Adsorption mechanisms of high-levels of ammonium onto natural and NaCl-modified zeolites. Sep. Purif. Technol. 2013, 103, 15–20. [Google Scholar] [CrossRef]
- Saltali, K.; Sari, A.; Aydin, M. Removal of ammonium ion from aqueous solution by natural Turkish (Yi{dotless}ldi{dotless}zeli) zeolite for environmental quality. J. Hazard. Mater. 2007, 141, 258–263. [Google Scholar] [CrossRef] [PubMed]
- Eslami, M.; Khorassani, R.; Coltorti, M.; Malferrari, D.; Faccini, B.; Ferretti, G.; Di Giuseppe, D.; Fotovat, A.; Halajnia, A. Leaching behaviour of a sandy soil amended with natural and NH4+ and K+ saturated clinoptilolite and chabazite. Arch. Agron. Soil Sci. 2018, 64, 1142–1151. [Google Scholar] [CrossRef]
- Wasielewski, S.; Rott, E.; Minke, R.; Steinmetz, H. Evaluation of Different Clinoptilolite Zeolites as Adsorbent for Ammonium Removal from Highly Concentrated Synthetic Wastewater. Water 2018, 10, 584. [Google Scholar] [CrossRef]
- Malferrari, D.; Laurora, A.; Brigatti, M.F.; Coltorti, M.; Di Giuseppe, D.; Faccini, B.; Passaglia, E.; Vezzalini, M.G. Open-field experimentation of an innovative and integrated zeolitite cycle: Project definition and material characterization. Rend. Lincei 2013, 24, 141–150. [Google Scholar] [CrossRef]
- Huang, H.; Xiao, X.; Yan, B.; Yang, L. Ammonium removal from aqueous solutions by using natural Chinese (Chende) zeolite as adsorbent. J. Hazard. Mater. 2010, 175, 247–252. [Google Scholar] [CrossRef]
- Shanavas, S.; Salahuddin Kunju, A.; Varghese, H.T.; Yohannan Panicker, C. Comparison of Langmuir and Harkins-Jura Adsorption Isotherms for the Determination of Surface Area of Solids: Oriental Journal of Chemistry. Orient. J. Chem. 2011, 27, 245–252. [Google Scholar]
- Dada, A.O. Langmuir, Freundlich, Temkin and Dubinin–Radushkevich Isotherms Studies of Equilibrium Sorption of Zn 2+ Unto Phosphoric Acid Modified Rice Husk. IOSR J. Appl. Chem. 2012, 3, 38–45. [Google Scholar]
- Langmuir, I. The adsorption of gases on plane surfaces of glass, mica and platinum. J. Am. Chem. Soc. 1918, 40, 1361–1403. [Google Scholar] [CrossRef]
- Lagergren, S.Y.; Sven, K. Zurtheorie der sogenannten adsorption gelösterstoffe. K. Sven. Vetenskapsakademiens. Handl. 1898, 24, 1–39. [Google Scholar]
- Qiu, H.; Lv, L.; Pan, B.-C.; Zhang, Q.-J.; Zhang, W.-M.; Zhang, Q.-X. Critical review in adsorption kinetic models *. J Zhejiang Univ Sci A 2009, 10, 716–724. [Google Scholar] [CrossRef]
- Ho, Y.S.; McKay, G. Pseudo-second order model for sorption processes. Process Biochem. 1999, 34, 451–465. [Google Scholar] [CrossRef]
- Ho, Y.S. Review of second-order models for adsorption systems. J. Hazard. Mater. 2006, 136, 681–689. [Google Scholar] [CrossRef]
- Wu, F.C.; Tseng, R.L.; Juang, R.S. Initial behavior of intraparticle diffusion model used in the description of adsorption kinetics. Chem. Eng. J. 2009, 153, 1–8. [Google Scholar] [CrossRef]
- Widiastuti, N.; Wu, H.; Ang, H.M.; Zhang, D. Removal of ammonium from greywater using natural zeolite. Desalination 2011, 277, 15–23. [Google Scholar] [CrossRef]
- Ho, Y.S.; McKay, G. A Comparison of chemisorption kinetic models applied to pollutant removal on various sorbents. Process Saf. Environ. Prot. 1998, 76, 332–340. [Google Scholar] [CrossRef]
- Wu, F.C.; Tseng, R.L.; Juang, R.S. Characteristics of Elovich equation used for the analysis of adsorption kinetics in dye-chitosan systems. Chem. Eng. J. 2009, 150, 366–373. [Google Scholar] [CrossRef]
- Gunay, A. Application of nonlinear regression analysis for ammonium exchange by natural (Bigadiç) clinoptilolite. J. Hazard. Mater. 2007, 148, 708–713. [Google Scholar] [CrossRef] [PubMed]
- Gupta, S.; Bhattacharyya, K.G. Interaction of metal ions with clays: I. A case study with Pb(II). Appl. Clay Sci. 2005, 30, 199–208. [Google Scholar] [CrossRef]
- Giles, C.H.; MacEwan, T.H.; Nakhwa, S.N.; Smith, D. 786. Studies in adsorption. Part XI. A system of classification of solution adsorption isotherms, and its use in diagnosis of adsorption mechanisms and in measurement of specific surface areas of solids. J. Chem. Soc. 1960, 111, 3973–3993. [Google Scholar] [CrossRef]
- Simonin, J.P. On the comparison of pseudo-first order and pseudo-second order rate laws in the modeling of adsorption kinetics. Chem. Eng. J. 2016, 300, 254–263. [Google Scholar] [CrossRef]
- Aydın Temel, F.; Kuleyin, A. Ammonium removal from landfill leachate using natural zeolite: kinetic, equilibrium, and thermodynamic studies. Desalin. Water Treat. 2016, 57, 23873–23892. [Google Scholar] [CrossRef]


| Sorbent | Temp. | Harkins–Jura | Freundlich | Langmuir | ||||||
|---|---|---|---|---|---|---|---|---|---|---|
| T | R2 | α | β | R2 | KF | n | R2 | KL | qmax | |
| (K) | (-) | (g2 mg−2) | (g2 L mg−3) | (-) | (L g−1) | (-) | (-) | (L mg−1) | (mg g−1) | |
| CHAµ | 286 | 0.973 | 0.057 | −0.015 | 0.904 | 0.14 | 1.67 | 0.878 | 3.98 × 10⁻⁴ | 29.5 (2.9) |
| 293 | 0.931 | 0.045 | −0.012 | 0.853 | 0.66 | 2.55 | 0.860 | 10.27 × 10⁻⁴ | 19.6 (1.0) | |
| 310 | 0.920 | 0.051 | −0.013 | 0.896 | 0.77 | 2.71 | 0.911 | 12.03 × 10⁻⁴ | 18.1 (0.7) | |
| CHAg | 286 | 0.876 | 0.109 | −0.028 | 0.826 | 0.45 | 2.68 | 0.798 | 9.12 × 10⁻⁴ | 12.0 (0.7) |
| 293 | 0.937 | 0.057 | −0.015 | 0.937 | 0.56 | 2.55 | 0.954 | 7.40 × 10⁻⁴ | 18.9 (0.6) | |
| 310 | 0.826 | 0.063 | −0.016 | 0.826 | 0.95 | 3.23 | 0.843 | 13.03 × 10⁻⁴ | 14.0 (0.6) | |
| Sorbent | PFO | PSO | Elovich | |||||||
|---|---|---|---|---|---|---|---|---|---|---|
| R2 | k1 | qe,1 | R2 | k2 | qe,2 | h | R2 | α | RE | |
| (-) | (min−1) | (mg g−1) | (-) | (g mg−1 min−1) | (mg g−1) | (mg g−1 min−1) | (-) | (mg g−1 min−1) | (-) | |
| CHAµ | 0.682 | 0.011 | 5.38 | 0.977 | 0.022 | 6.98 | 1.665 | 0.929 | 1.182 | 0.282 |
| CHAg | 0.890 | 0.015 | 4.86 | 0.993 | 0.014 | 5.60 | 0.566 | 0.985 | 0.820 | 0.524 |
| Sorbent | ID Model | |||
|---|---|---|---|---|
| R2 | KID | C | ||
| (-) | (mg g−1 min−0.5) | (mg g−1) | ||
| CHAµ | 0.958 | 0.32 | 3.75 | |
| CHAg | before 60 min | 0.984 | 0.63 | 0.17 |
| after 60 min | 0.962 | 0.31 | 2.24 | |
| Sorbent | Temperature | ΔH | ΔS | ΔG |
|---|---|---|---|---|
| (K) | (J mol−1) | (J K−1 mol−1) | (kJ mol−1) | |
| CHAµ | 286 | 2124 | 13.7 | −1.80 |
| 293 | 2091 | 13.8 | −1.96 | |
| 310 | 2146 | 13.6 | −2.06 | |
| CHAg | 286 | 2654 | 11.9 | −0.74 |
| 293 | 2343 | 13.0 | −1.46 | |
| 310 | 2479 | 12.6 | −1.42 |
Publisher’s Note: MDPI stays neutral with regard to jurisdictional claims in published maps and institutional affiliations. |
© 2020 by the authors. Licensee MDPI, Basel, Switzerland. This article is an open access article distributed under the terms and conditions of the Creative Commons Attribution (CC BY) license (https://creativecommons.org/licenses/by/4.0/).
Share and Cite
Galamini, G.; Ferretti, G.; Medoro, V.; Tescaro, N.; Faccini, B.; Coltorti, M. Reduction of Nitrogen Load in a Zootechnical Wastewater Using a Natural Chabazite Zeolite: An Investigation on Sorption Mechanisms. Environ. Sci. Proc. 2020, 2, 42. https://0-doi-org.brum.beds.ac.uk/10.3390/environsciproc2020002042
Galamini G, Ferretti G, Medoro V, Tescaro N, Faccini B, Coltorti M. Reduction of Nitrogen Load in a Zootechnical Wastewater Using a Natural Chabazite Zeolite: An Investigation on Sorption Mechanisms. Environmental Sciences Proceedings. 2020; 2(1):42. https://0-doi-org.brum.beds.ac.uk/10.3390/environsciproc2020002042
Chicago/Turabian StyleGalamini, Giulio, Giacomo Ferretti, Valeria Medoro, Nicola Tescaro, Barbara Faccini, and Massimo Coltorti. 2020. "Reduction of Nitrogen Load in a Zootechnical Wastewater Using a Natural Chabazite Zeolite: An Investigation on Sorption Mechanisms" Environmental Sciences Proceedings 2, no. 1: 42. https://0-doi-org.brum.beds.ac.uk/10.3390/environsciproc2020002042