Proceeding Paper

A Gridded Database for the Spatiotemporal Analysis of Rainfall in Southern Italy (Calabria Region) †

by
Tommaso Caloiero
1,
Roberto Coscarelli
2,* and
Gaetano Pellicone
1
1
National Research Council-Institute for Agricultural and Forest Systems in Mediterranean (CNR-ISAFOM), 87036 Rende, Italy
2
National Research Council-Research Institute for Geo-Hydrological Protection (CNR-IRPI), 87036 Rende, Italy
*
Author to whom correspondence should be addressed.
Presented at the 4th EWaS International Conference: Valuing the Water, Carbon, Ecological Footprints of Human Activities, Online, 24–27 June 2020.
Published: 8 August 2020

Abstract

:
In this work, a gridded database was obtained from a rainfall dataset of 129 monthly series collected for the period 1951–2016 in the Calabria region (southern Italy). The Inverse Distance Weighted (IDW) interpolation method was applied to build 603 rainfall grid series with a spatial resolution of 5 km × 5 km. In order to detect possible trends, for each grid point, the seasonal and annual rainfall series were analyzed with the Mann–Kendall non-parametric test and the Theil–Sen estimator. Results showed a decreasing trend for the annual and winter–autumn rainfall and an increasing trend for the summer one.

1. Introduction

In recent decades, climate change has received considerable attention for its possible impacts on long- and short-term variability of water resources in several areas of the world. In fact, climate change could influence extreme dry events, increasing their frequency and magnitude and thus causing changes in mean renewable water supplies [1]. In this context, the analysis of the spatial and temporal variability of rainfall and runoff has become paramount for water resource management purposes [2]. In particular, trend analysis has been widely used to detect the possible consequences of climate change in different hydrological temporal series, especially in the Mediterranean basin, which is considered a hot spot [3]. In the Mediterranean area, different results have been obtained between the eastern and western side of the region. In fact, while the west-central part is characterized by a negative rainfall trend [4], although highly variable across the decades, the eastern side presents contrasting results with positive rainfall tendencies in some areas [5,6], and negative trend in others, such as Israel [7,8]. In regard to Italy, many studies on annual rainfall have been performed on a regional level. These studies displayed a decrease in annual rainfall amounts, particularly evident in the southern part of the country [9]. Conversely, on a seasonal scale, a different trend behavior has been demonstrated in thorough analyses on a regional scale performed in Campania [4,10], Basilicata [11], Sicily [12], Calabria [13], and Sardinia [14,15].
In this study, in order to detect possible changes in rainfall data in southern Italy, seasonal and annual rainfall series recorded in the Calabria region were analyzed and the temporal changes of the different series were detected using two non-parametric tests. The Calabria region is one of the centermost region within the Mediterranean basin, where the climate change dynamics are directly caused by the influence of the central Europe and the North Africa climates. It is one of the regions of Italy most affected by drought [16] and is prone to desertification phenomena [17].

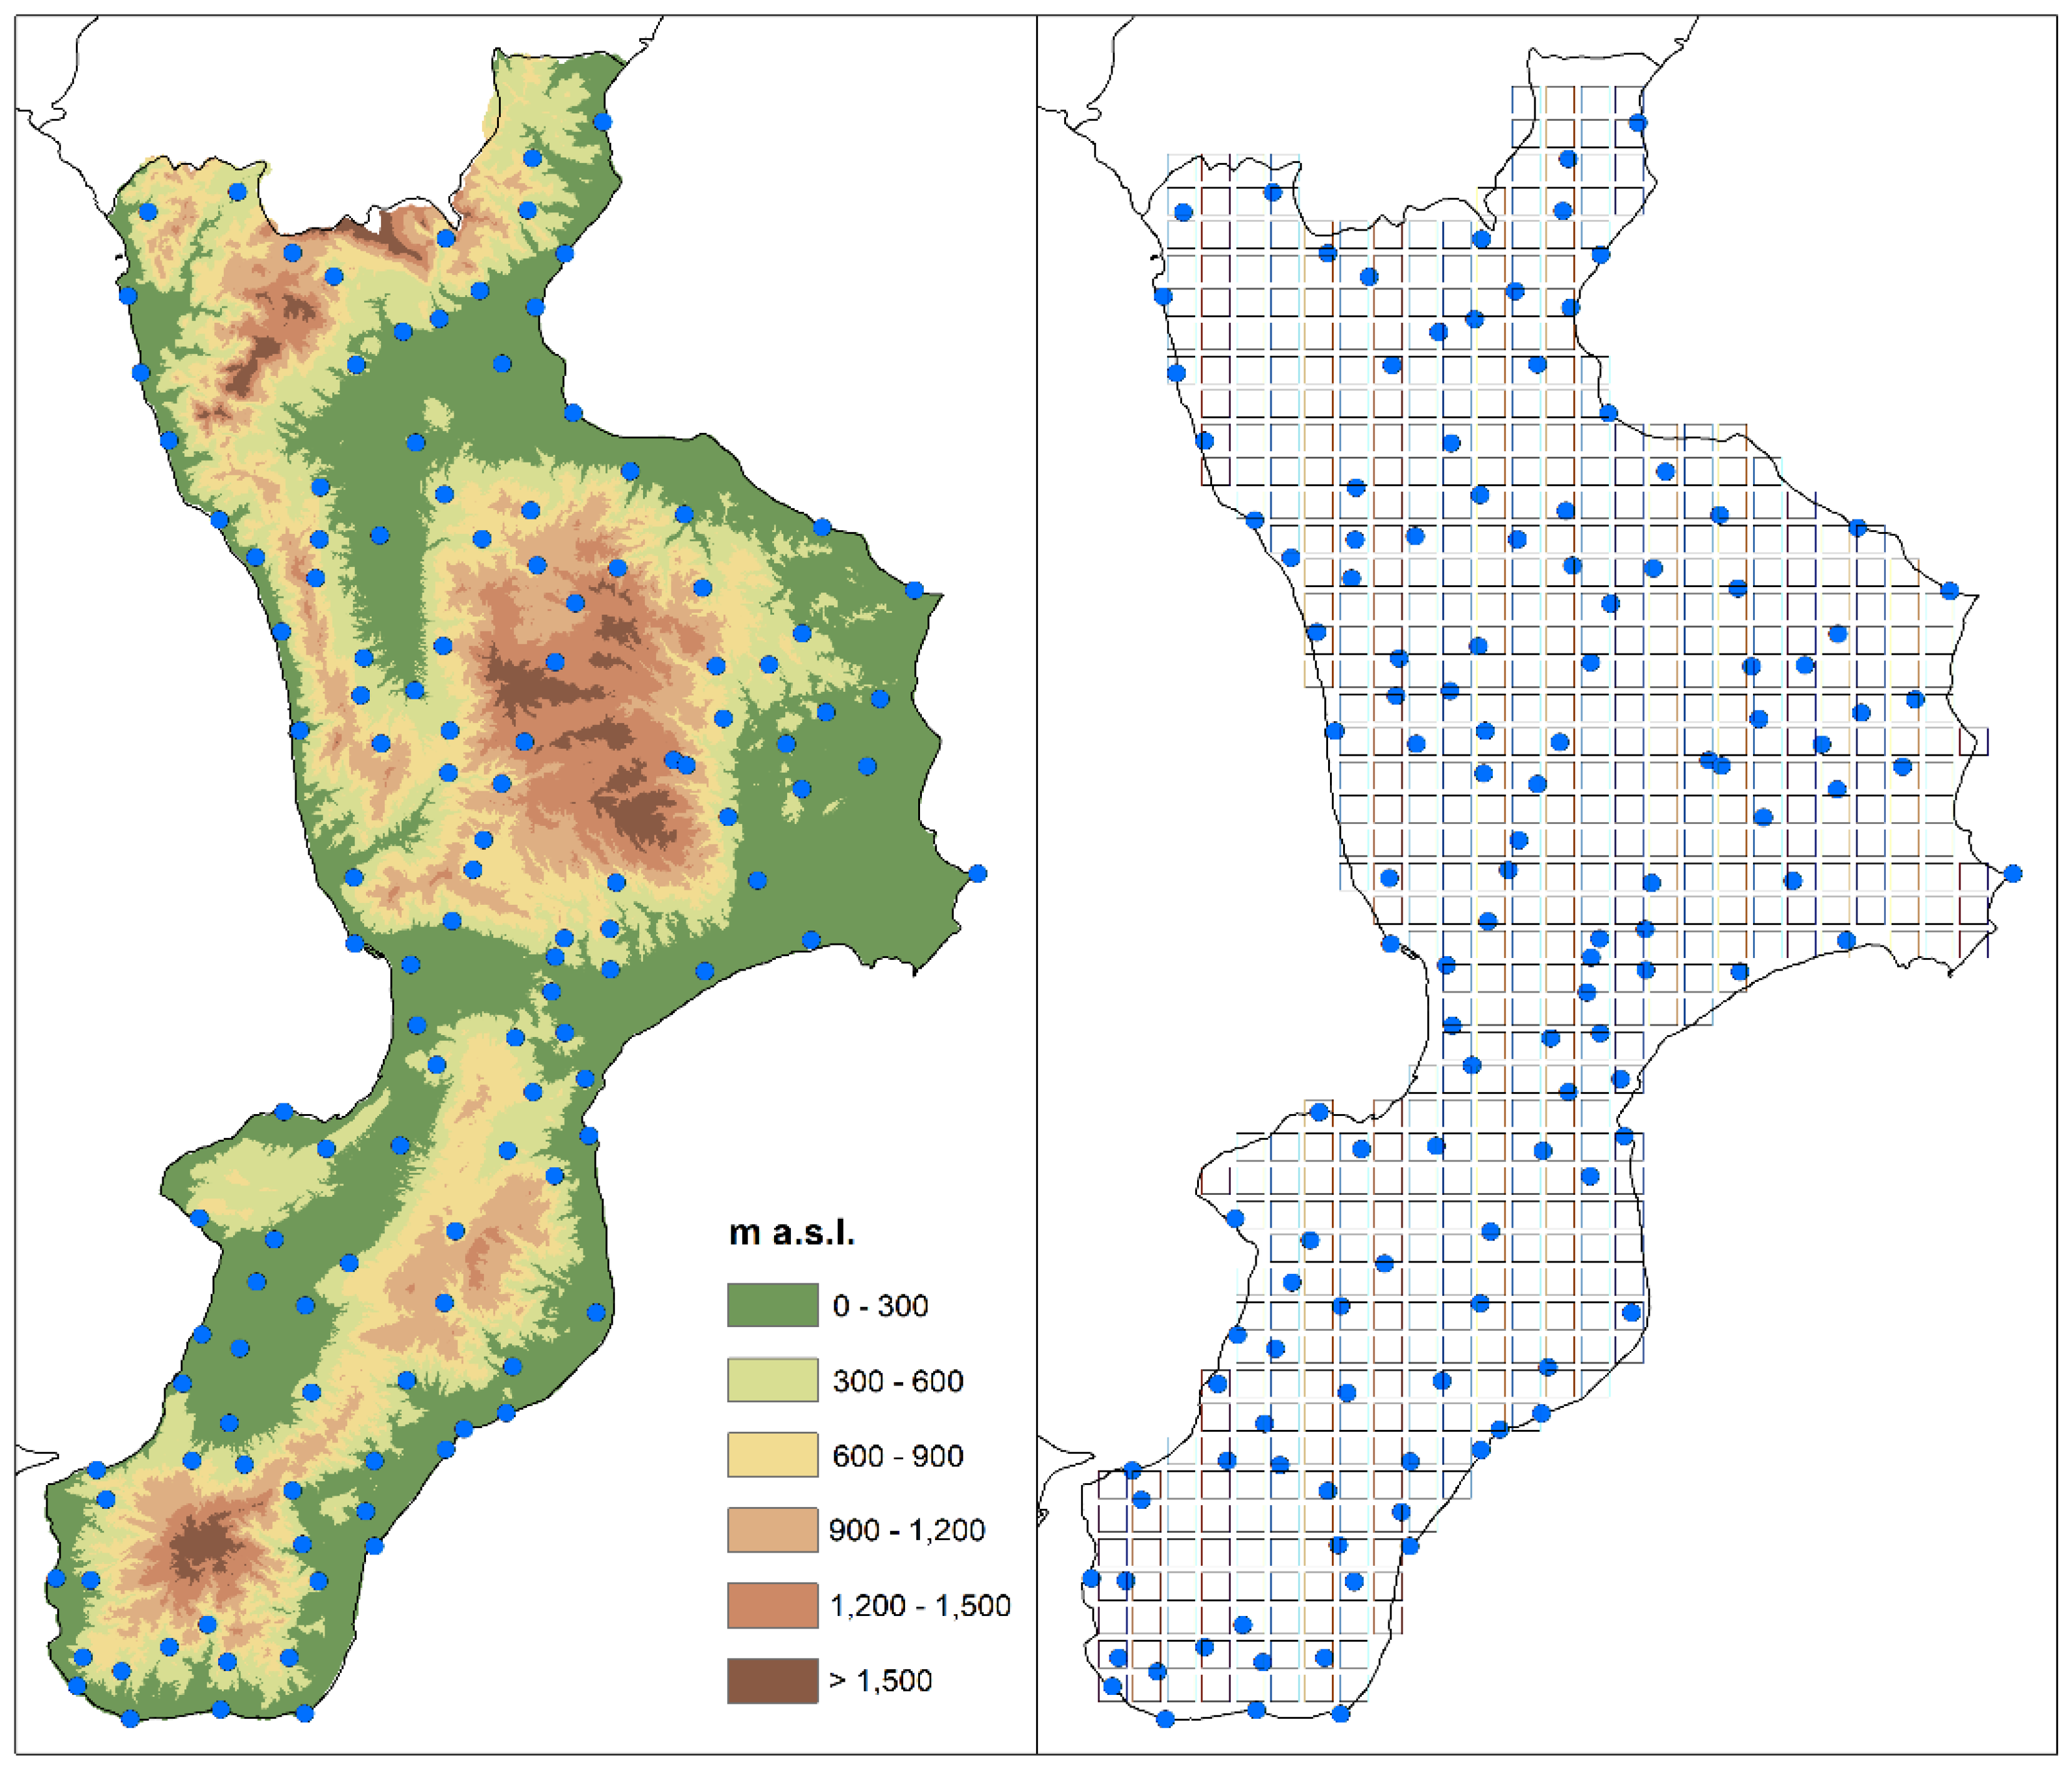
2. Study Area and Data

Located at the toe of the Italian peninsula, Calabria has a surface of 15,080 km2. On average its altitude is 597 m a.s.l. and its tallest relief is 2266 m a.s.l. Calabria does not present many high peaks, yet it is one of the most mountainous areas in the country, as mountains (over 500 m a.s.l. high) occupy 42% of the regional area, while hills cover 49% of the territory and only 9% of the region is under 50 m a.s.l. (Figure 1). It is a region characterized by a typically Mediterranean climate, presenting sharp contrasts due to its position within the Mediterranean Sea and its orography. Specifically, warm air currents coming from Africa affect the Ionian side, leading to high temperatures and short and heavy rainfall. The Tyrrhenian side, instead, is affected by western air currents which cause milder temperatures and higher precipitation (often convective) amounts than on the Ionian side. Cold and snowy winters and fresh summers with some precipitation are typical of the inner areas of the region [18].
In this study, a gridded monthly rainfall database with a spatial resolution of 5 km × 5 km was used. This database was obtained starting from that presented in [19], but was updated at 2016. The original precipitation series registered in the Calabria region from 1916, and stored by the Multi-Risk Functional Centre of the Regional Agency for Environment Protection, were checked to eliminate inhomogeneities from the data series and lack of data. As a result, the analysis focused on a total of 129 rainfall series (Figure 1) for the period 1951–2016 in order to study the rainfall series falling within the same time range and presenting the same length. Finally, the monthly rainfall data were spatially distributed to build 603 monthly rainfall grid series (Figure 1).

3. Methods

3.1. Inverse Distance Weighted

The Inverse Distance Weighted (IDW) method was the chosen method to build 603 monthly rainfall grid series with a spatial resolution of 5 km × 5 km. This technique is based on the algorithm of [20,21]. It relates the unknown value of a certain variable in a defined point to the values of the same variable measured in other locations on the basis of the distance between the locations. The closer an observation is to the point of estimation, the higher its influence. This influence is expressed through a weight (w), which has the following formulation [20]:
w i ( x ) = 1 d ( x , x i ) p ,
where x is the point where the estimate is wanted, xi is one of the points where observations are available, d is the distance between the two locations, and p is an exponent that allows one to give different forms to the weighting function. The higher the value of p, the less importance given to more remote observations. An exponent p equal to 2 was set as default in the used R function so as not to penalize too much of the contribution to the estimation of far-away points. The number of observations used for each estimation was set to 12.

3.2. Trend Analysis

In this paper, in order to analyze possible trends in rainfall series, two non-parametric tests for trend detection were used. In particular, the slopes of the trends were calculated by the Theil–Sen estimator [22] and the statistical significance was assessed with the Mann–Kendall (MK) non-parametric test [23,24]. The Theil–Sen estimator was selected because it is more powerful than linear regression methods in trend slope evaluation in the presence of outliers in the series. In fact, the Theil–Sen estimator is not susceptible to the influence of extreme values.
Given N pairs of data:
Q i = x j x k j - k        for    i = 1 ,   ,   N ,
in which xj and xk are the data values at times j and k (with j > k), respectively.
If there is only one datum in each time period, then N = n(n − 1)/2, where n is the number of time periods. If there are multiple observations in one or more time periods, then N < n(n − 1)/2, where n is the total number of observations.
The N values of Qi are ranked from smallest to largest, and the median of the slope or Sen’s slope estimator is computed as:
Q m e d = { Q [ ( N + 1 ) / 2 ]     if   N   is   odd Q [ N / 2 ] + Q [ ( N + 2 ) / 2 ] 2   if   N   is   even ,
The Qmed sign reflects the behavior of the data trend, while its value indicates the steepness of the trend.
For a series with dimension n, the MK statistic is obtained as:
S = i = 1 n 1 j = i + 1 n sgn ( x j x i )   ; with sgn ( x j x i ) = { 1    if    ( x j x i ) > 0   0    if    ( x j x i ) = 0 1    if    ( x j x i ) < 0 ,
where xj and xi are the data values at times j and i with j > i.
If xi are independent and randomly ordered, for n > 10, the statistic S follows a normal distribution with zero mean and variance given by:
V a r ( S ) = [ n ( n 1 ) ( 2 n + 5 ) i = 1 n t i i ( i 1 ) ( 2 i + 5 ) ] / 18 ,
with ti number of ties of extended i.
Finally, the standardized test statistic ZMK is computed as:
Z M K = { S 1 V a r ( S ) for   S > 0 0      for   S = 0 S + 1 V a r ( S ) for   S < 0 ,
Using a two-tailed test for a specified significance level α, the null hypothesis is rejected if |ZMK| is greater than Z1−α/2 and the trend can be considered significant.

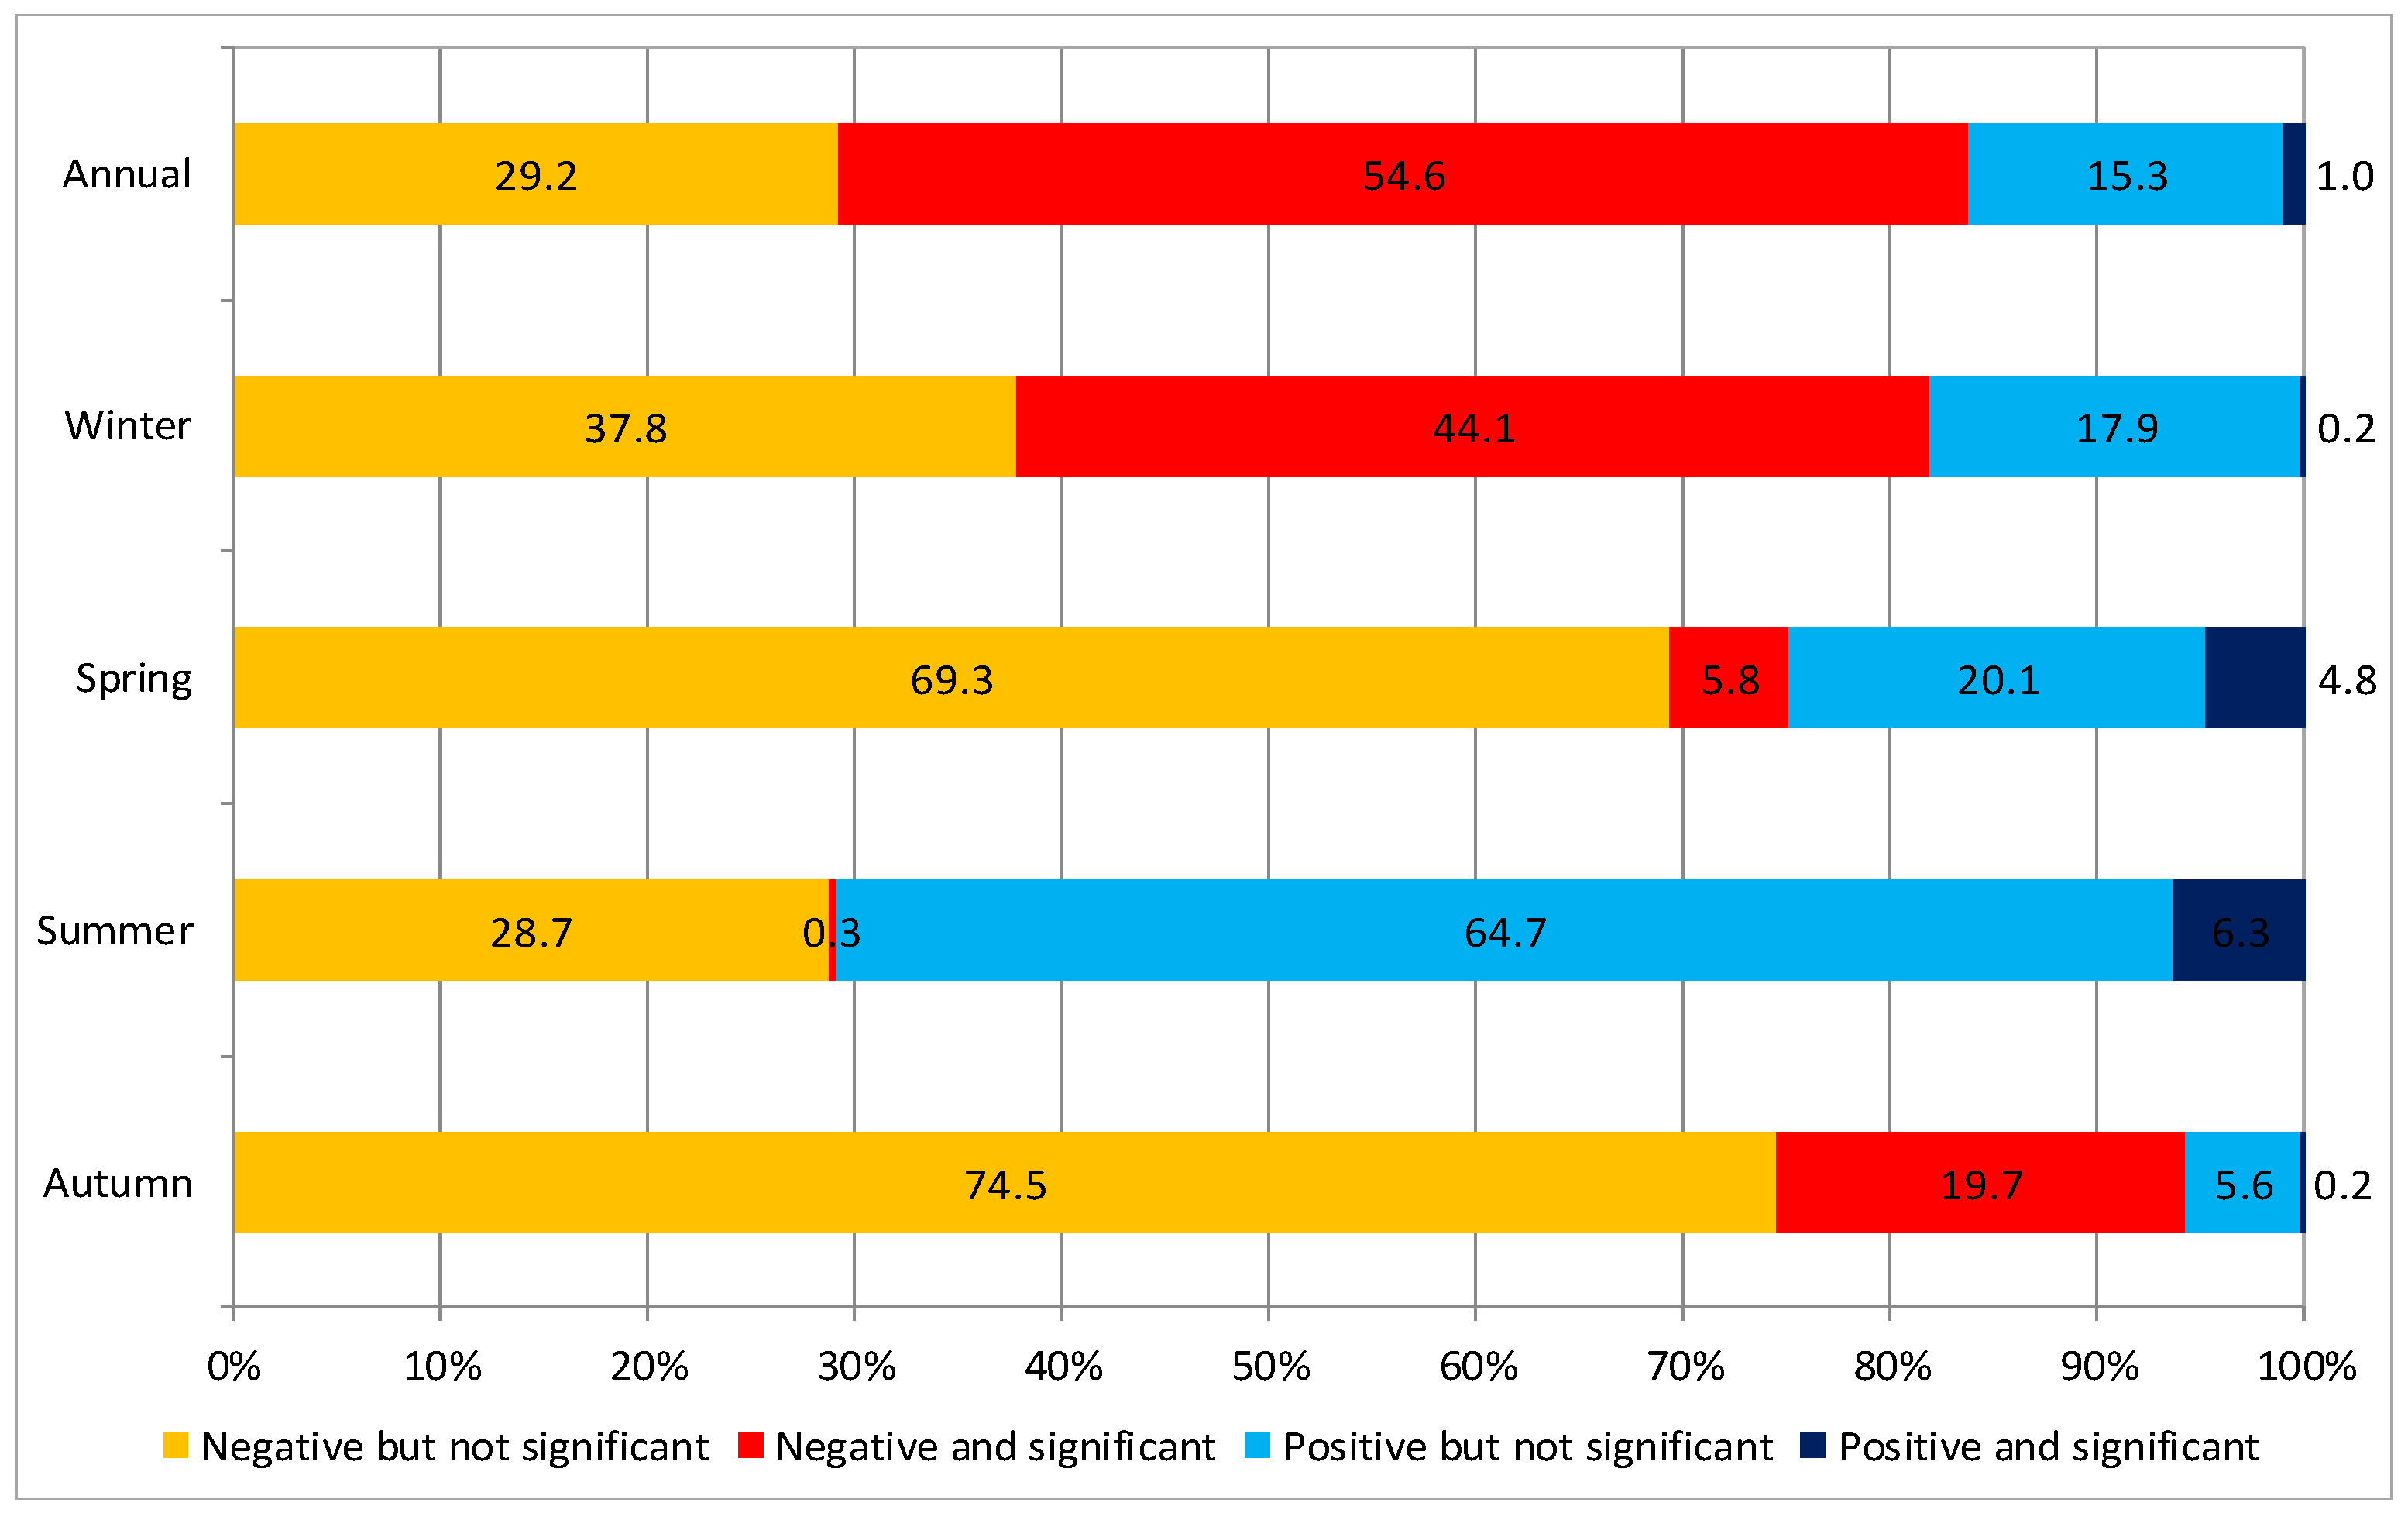
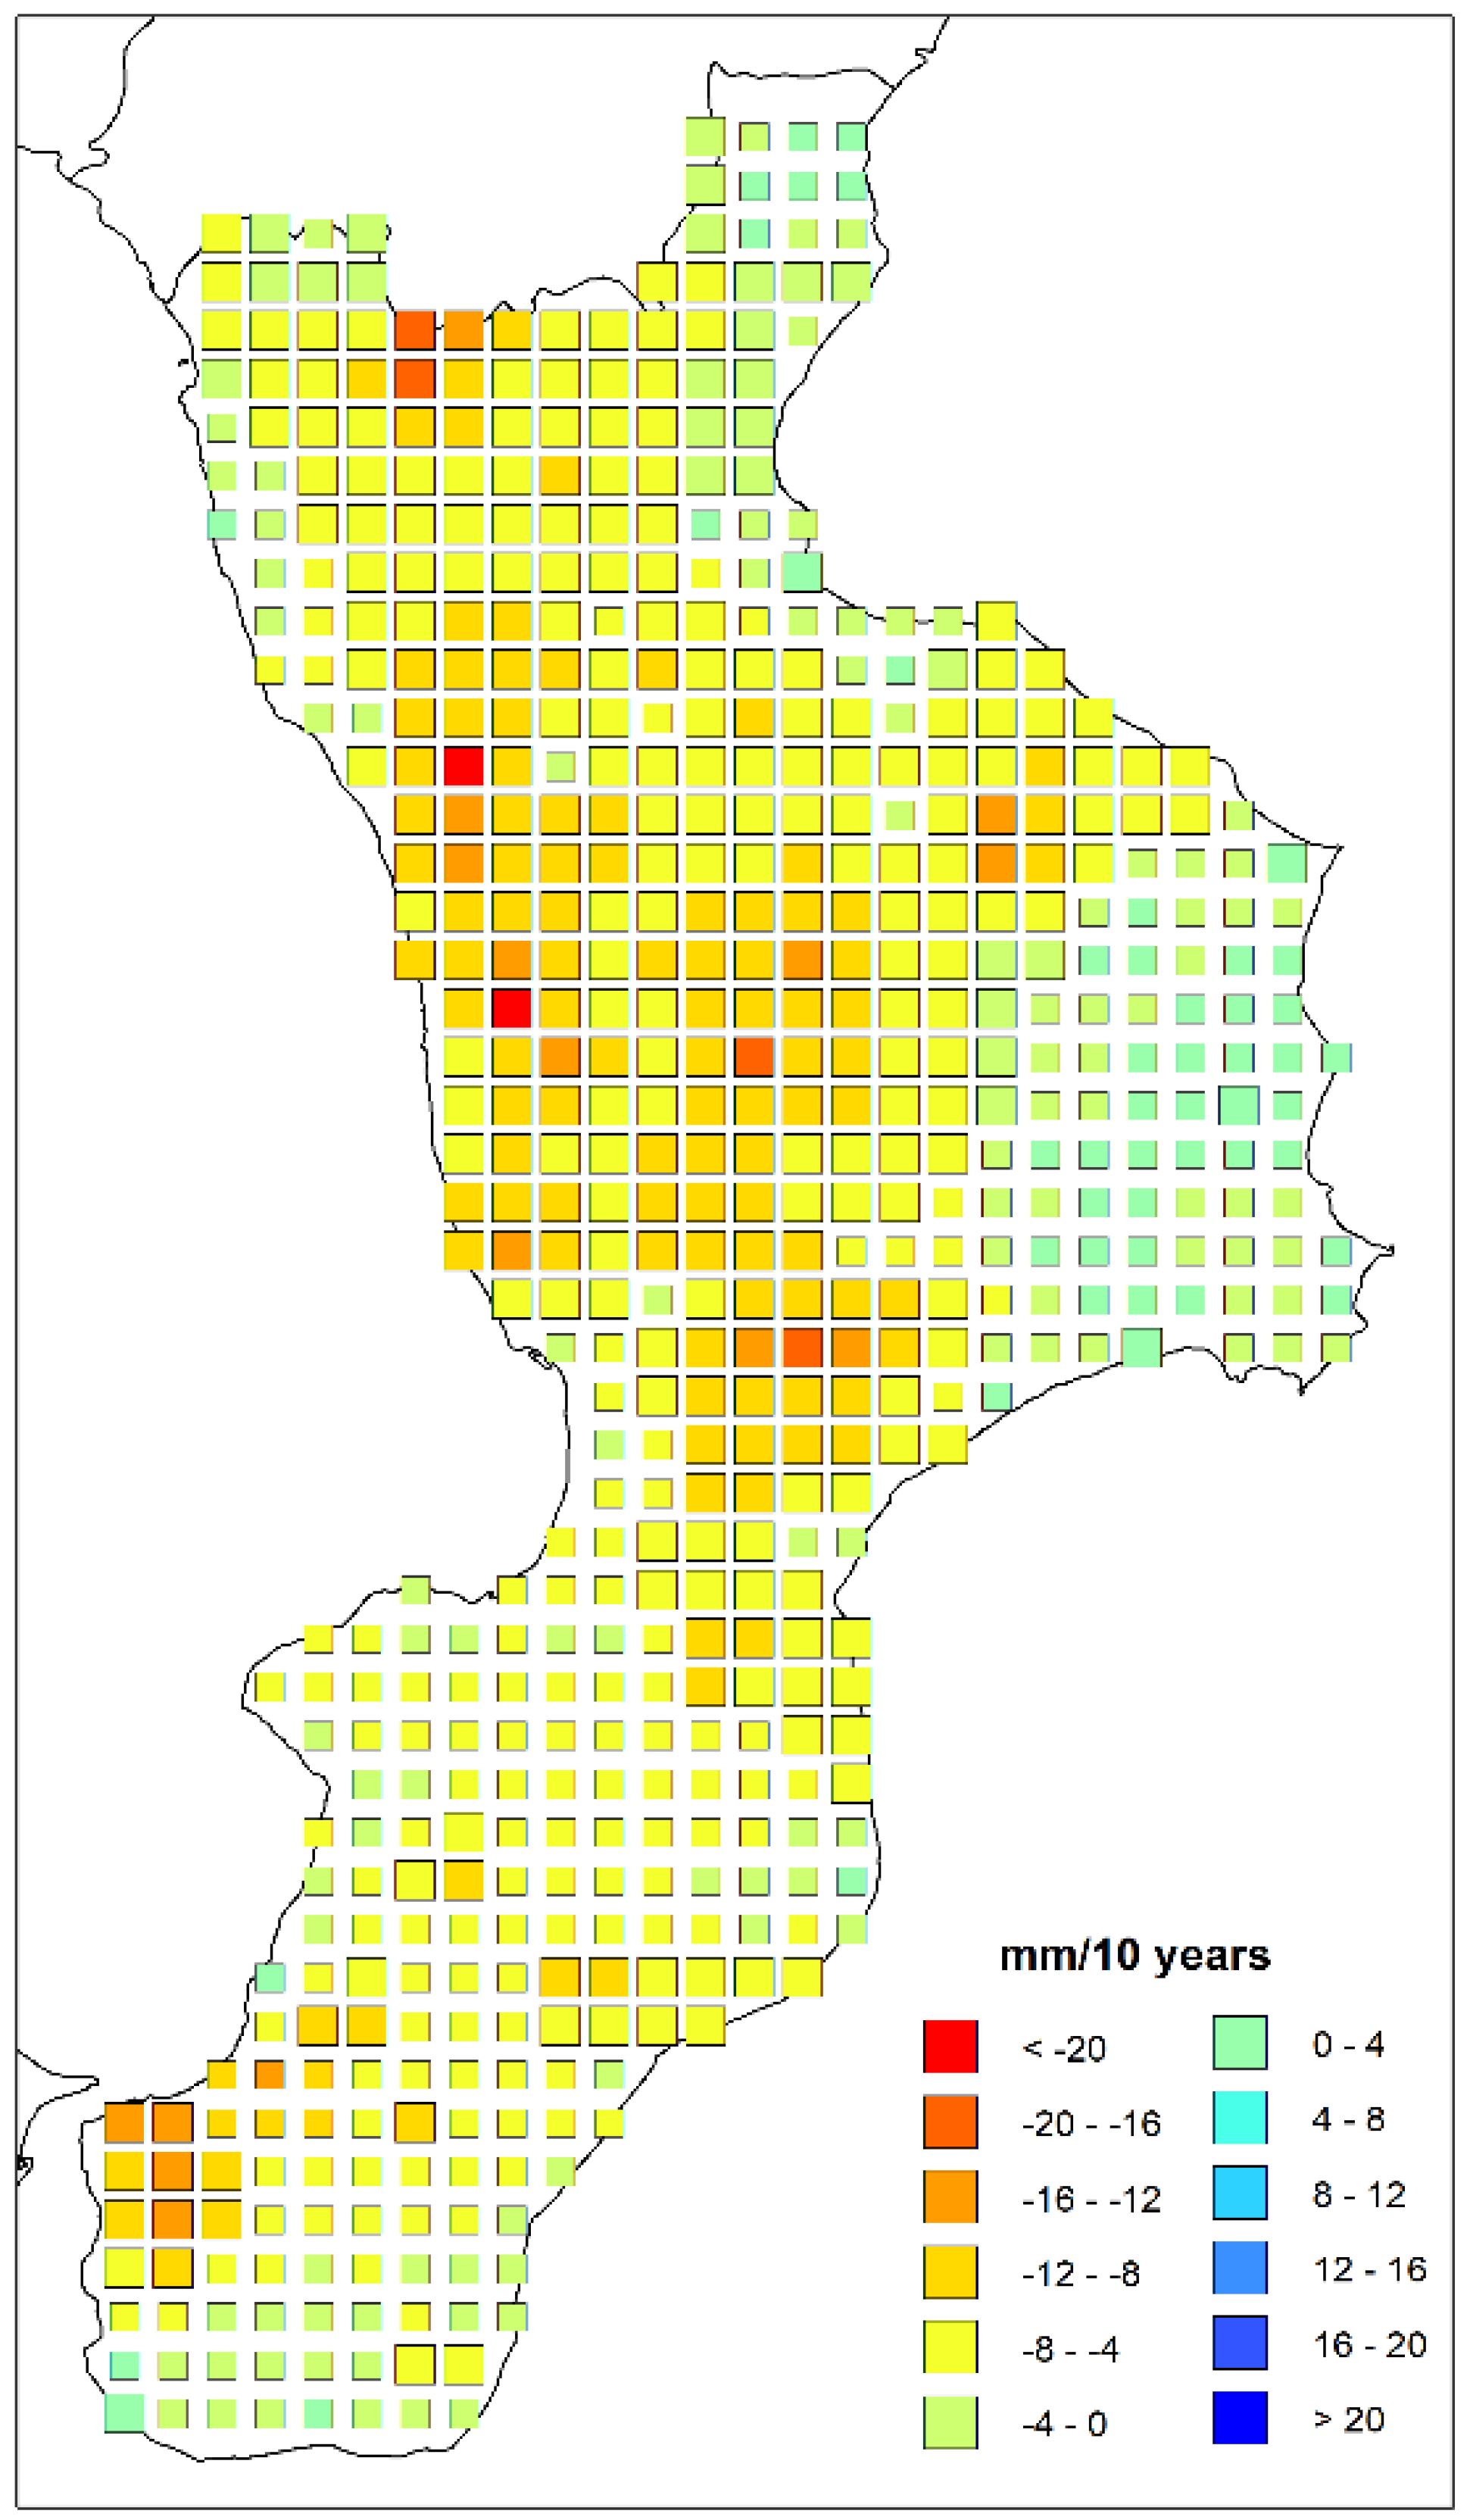
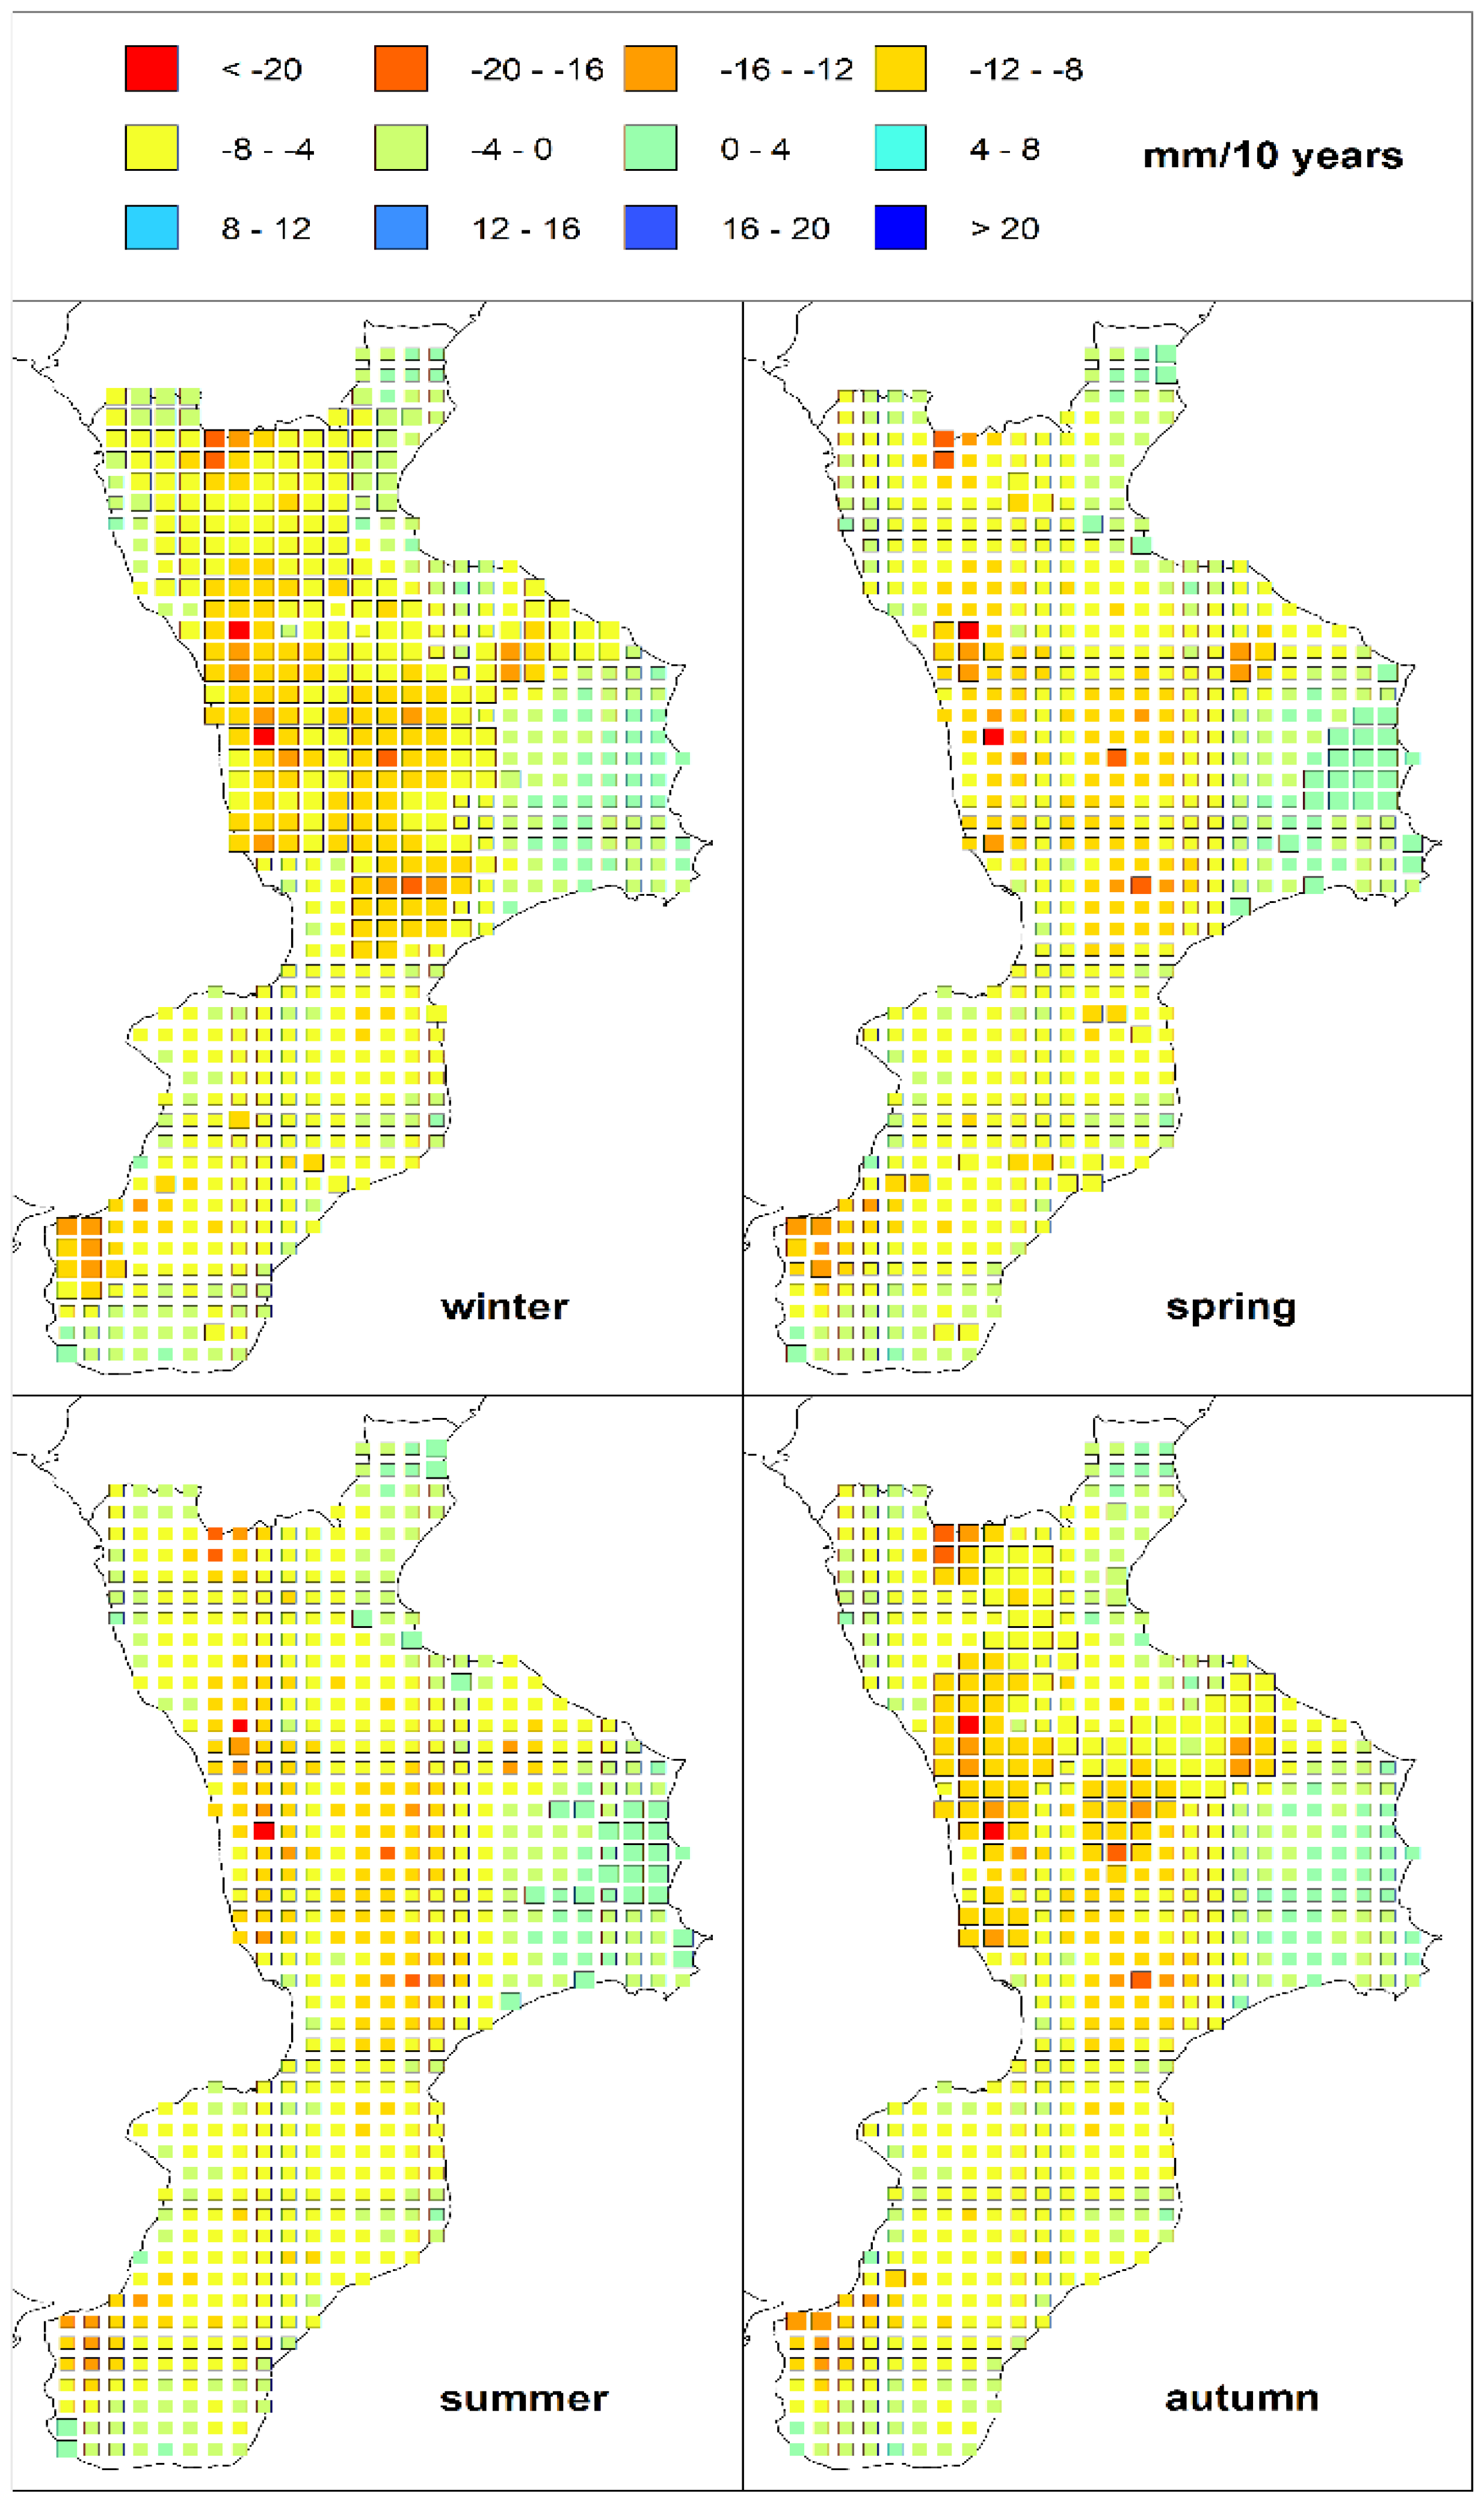
4. Results and Discussion

The gridded database was obtained from a rainfall dataset of 129 monthly rainfall series (about one station per 117 km2) collected in the period 1951–2016 in the Calabria region. The inverse distance weighed (IDW) method was the chosen method to build 603 monthly rainfall grid series with a spatial resolution of 5 km × 5 km (Figure 1). For each grid point a trend analysis was performed. The results of the trend analysis applied to the annual and seasonal precipitation, for a 95% significance level, are presented in Figure 2, which shows the percentages of grid points with a positive or negative trend.
On the annual scale, a clear negative trend was detected. In fact, about 54% of the grid points showed a negative trend, while significantly positive trends were identified only in 1% of the grid points. The negative trend is spatially distributed throughout the entire region and, in particular, in the northwestern side (with slopes also lower than −20 mm/10 year), while the positive trend is located on the Ionian side of the study area but with low rates (Figure 3).
This negative trend of the annual rainfall is mainly due to the negative trend detected in winter, with more than 44% of the grid points showing significant values. In regard to spring, only a few grid points showed significant trends (about 10%) and with opposite signs. In fact, in spring, 5.8% of the grid points showed a negative trend and 4.8% a positive one. As opposed to the winter precipitation, that of summer showed a positive trend, although significant only for 6.3% of the grid points. Finally, in autumn, a marked negative trend was detected, with 19.7% of the grid points showing a negative trend and only 1 grid point (0.2% of the total) displaying a positive one (Figure 2).
The spatial results of the trend analysis applied to the seasonal precipitation are presented in Figure 4. In particular, the spatial analysis of the winter trend displayed similar behavior with the annual one, with negative trends spreading across northwestern part of the region and rates also lower than −20 mm/10 years. In spring, clearly opposite trends (but often not significant) were detected between the two sides of the region: a prevalent negative trend in the western side (with rates lower than in winter as absolute values) and a positive trend in the eastern side (with slopes higher than in winter). In summer, positive trends were identified in the eastern side of the region, while the western side showed a significant negative tendency only for one cell. Finally, in autumn, the spatial distribution of the trend is similar to that of winter, although with less grid points showing a significant trend.
These results, which demonstrated a reduction in the winter season and a slight increase during summer, confirmed those obtained in other Italian regions [4,10,25]. Moreover, the orography of Calabria seems to influence the rainfall trends, with a different behavior emerging in some seasons between the two sides of the region. In fact, the particular orography of the region, trending south–north, constitutes an important barrier to the mean airflow approaching from the west [26].

5. Conclusions

In this study a 65-year old rainfall database, updated in 2016, was used in relation to an extended rain gauge network (129 stations). Moreover, the application of the IDW method allowed us to build 603 rainfall grid series with a spatial resolution of 5 km × 5 km. For these reasons, the obtained results can be considered spatially and temporally completed and updated to recent years. The main output is the significant negative tendency of the rainfall amount that emerged in winter and autumn, seasons which, for Calabria, are characterized by more frequent rainfall events essential for renewable water supplies. If these results are confirmed in the next years, modifications and integrations in water resource management will be required to cope with possible drought and desertification risks in the Calabrian territory.

Author Contributions

Conceptualization, G.P. and R.C.; methodology, G.P.; software, G.P. and T.C.; formal analysis, G.P. and T.C.; validation, T.C. and R.C.; investigation, G.P.; data curation, R.C. and T.C.; writing—original draft preparation, T.C.; writing—review and editing, R.C. and T.C.; visualization, G.P. and T.C.; supervision, R.C. All authors have read and agree to the published version of the manuscript.

Funding

This research received no external funding.

Conflicts of Interest

The authors declare no conflict of interest.

References

  1. IPCC. Summary for Policymakers. Fifth Assessment Report of the Intergovernmental Panel on Climate Change; Cambridge University Press: Cambridge, UK, 2013. [Google Scholar]
  2. Elmeddahi, Y.; Mahmoudi, H.; Issaadi, A.; Goosen, M.F.A.; Ragab, R. Evaluating the ef-fects of climate change and variability on water resources: A case study of the Cheliff basin in Algeria. Am. J. Eng. Appl. Sci. 2016, 9, 835–845. [Google Scholar] [CrossRef]
  3. Caloiero, T.; Caloiero, P.; Frustaci, F. Long-term precipitation trend analysis in Europe and in the Mediterranean basin. Water Environ. J. 2018, 32, 433–445. [Google Scholar] [CrossRef]
  4. Longobardi, A.; Villani, P. Trend analysis of annual and seasonal rainfall time series in the Mediterranean area. Int. J. Climatol. 2010, 30, 1538–1546. [Google Scholar] [CrossRef]
  5. Maheras, P.; Tolika, K.; Anagnostopoulou, C.; Vafiadis, M.; Patrikas, I.; Flocas, H. On the relationships between circulation types and changes in rainfall variability in Greece. Int. J. Climatol. 2004, 24, 1695–1712. [Google Scholar] [CrossRef]
  6. Altin, T.B.; Barak, B. Changes and trends in total yearly precipitation of the Antalya District, Turkey. Proc. Soc. Behv. 2014, 120, 586–599. [Google Scholar] [CrossRef]
  7. Shohami, D.; Dayan, U.; Morin, E. Warming and drying of the eastern Mediterranean: Additional evidence from trend analysis. J. Geophys. Res. 2011, 116, D22101. [Google Scholar] [CrossRef]
  8. Ziv, B.; Saaroni, H.; Pargament, R.; Harpaz, T.; Alpert, P. Trends in rainfall regime over Israel, 1975-2010, and their relationship to large-scale variability. Reg. Environ. Chang. 2014, 14, 1751–1764. [Google Scholar] [CrossRef]
  9. Longobardi, A.; Buttafuoco, G.; Caloiero, T.; Coscarelli, R. Spatial and temporal distribution of precipitation in a Mediterranean area (southern Italy). Environ. Earth Sci. 2016, 75, 189. [Google Scholar] [CrossRef]
  10. Diodato, N. Climatic fluctuations in southern Italy since 17th century: Reconstruction with precipitation records at Benevento. Clim. Chang. 2007, 80, 411–431. [Google Scholar] [CrossRef]
  11. Piccarreta, M.; Capolongo, D.; Boenzi, F. Trend analysis of precipitation and drought in Basilicata from 1923 to 2000 within a Southern Italy context. Int. J. Climatol. 2004, 24, 907–922. [Google Scholar] [CrossRef]
  12. Liuzzo, L.; Bono, E.; Sammartano, V.; Freni, G. Analysis of spatial and temporal rainfall trends in Sicily during the 1921–2012 period. Theor. Appl. Climatol. 2016, 126, 113–129. [Google Scholar] [CrossRef]
  13. Caloiero, T.; Coscarelli, R.; Ferrari, E.; Mancini, M. Trend detection of annual and seasonal rainfall in Calabria (southern Italy). Int. J. Climatol. 2011, 31, 44–56. [Google Scholar] [CrossRef]
  14. Montaldo, N.; Sarigu, A. Potential links between the North Atlantic Oscillation and decreasing precipitation and runoff on a Mediterranean area. J. Hydrol. 2017, 553, 419–437. [Google Scholar] [CrossRef]
  15. Caloiero, T.; Coscarelli, R.; Gaudio, R.; Leonardo, G.P. Precipitation trend and concentration in the Sardinia region. Theor. Appl. Climatol. 2019, 137, 297–307. [Google Scholar] [CrossRef]
  16. Caloiero, T.; Coscarelli, R.; Ferrari, E.; Sirangelo, B. An analysis of the occurrence probabilities of wet and dry periods through a stochastic monthly rainfall model. Water 2016, 8, 39. [Google Scholar] [CrossRef]
  17. Coscarelli, R.; Caloiero, T.; Minervino, I.; Sorriso-Valvo, M. Sensitivity to desertification of a high productivity area in Southern Italy. J. Maps 2016, 12, 573–581. [Google Scholar] [CrossRef]
  18. Caloiero, T.; Callegari, G.; Cantasano, N.; Coletta, V.; Pellicone, G.; Veltri, A. Bioclimatic analysis in a region of southern Italy (Calabria). Plant Biosyst. 2016, 150, 1282–1295. [Google Scholar] [CrossRef]
  19. Brunetti, M.; Caloiero, T.; Coscarelli, R.; Gullà, G.; Nanni, T.; Simolo, C. Precipitation variability and change in the Calabria region (Italy) from a high resolution daily dataset. Int. J. Climatol. 2012, 32, 57–73. [Google Scholar] [CrossRef]
  20. Shepard, D.S. A two-dimensional interpolation function for irregularly-spaced data. In Proceedings of the 1968 ACM National Conference, Las Vegas, NV, USA, 27–29 August 1968. [Google Scholar]
  21. Shepard, D.S. Computer Mapping: The SYMAP Interpolation Algorithm. In Spatial Statistics and Models; Gaile, G.L., Willmott, C.J., Eds.; Springer: New York, NY, USA, 1984; pp. 133–145. [Google Scholar]
  22. Sen, P.K. Estimates of the regression coefficient based on Kendall’s tau. J. Am. Stat. Assoc. 1968, 63, 1379–1389. [Google Scholar] [CrossRef]
  23. Mann, H.B. Nonparametric tests against trend. Econometrica 1945, 13, 245–259. [Google Scholar] [CrossRef]
  24. Kendall, M.G. Rank Correlation Methods; Hafner Publishing Company: New York, NY, USA, 1962. [Google Scholar]
  25. Caloiero, T.; Coscarelli, R.; Ferrari, E. Application of the Innovative Trend Analysis Method for the Trend Analysis of Rainfall Anomalies in Southern Italy. Water. Resour. Manag. 2018, 32, 4971–4983. [Google Scholar] [CrossRef]
  26. Ferrari, E.; Caloiero, T.; Coscarelli, R. Influence of the North Atlantic Oscillation on winter rainfall in Calabria (southern Italy). Theor. Appl. Climatol. 2013, 114, 479–494. [Google Scholar] [CrossRef]
Figure 1. Localization of the rain gauges on a digital elevation model of the Calabria region (left) and visualization of the grid with a spatial resolution of 5 km × 5 km (right).
Environsciproc 02 00006 g001
Figure 2. Trends of the annual and seasonal rainfall expressed as percentage of grid points.
Environsciproc 02 00006 g002
Figure 3. Annual trend map. The square dimension indicates a significance level of the trend: large squaresindicate p < 0.05, small squares otherwise.
Environsciproc 02 00006 g003
Figure 4. Seasonal trend maps. The square dimension indicates a significance level of the trend: large squares indicate p < 0.05, small squares otherwise.
Environsciproc 02 00006 g004
Publisher’s Note: MDPI stays neutral with regard to jurisdictional claims in published maps and institutional affiliations.

