
A Computational Algorithm to Understand the Evolution of Size Distribution with Successive Breakage Events at Grinding †


Mining Engineering Department, Middle East Technical University, 06800 Ankara, Turkey
†
Presented at the 2nd International Electronic Conference on Mineral Science, 1–15 March 2021;
Available online: https://iecms2021.sciforum.net/.
Environ. Sci. Proc. 2021, 6(1), 7; https://0-doi-org.brum.beds.ac.uk/10.3390/iecms2021-09381
Published: 2 March 2021
(This article belongs to the Proceedings of The 2nd International Electronic Conference on Mineral Science)
Abstract
:The kinetic population balance model (PBM) is widely used to predict the particle size distributions of grinding products. However, the model may not be solved if the rate of particle accelerates or decelerates in the mill hold-up, i.e., non-first-order breakage. This study presents a computational algorithm coupled with a pseudo-matrix model to simulate the product size distributions (PSDs) of successive breakage events at grinding. The algorithm’s applicability and accuracy were validated against PSDs taken from different grinding equipment. The advantages of the algorithm are as follows—(i) time can be implicitly or explicitly added to the algorithm. (ii) The parameters required to run the algorithm are quite few. (iii) The proposed algorithm can predict PSDs in the normal or abnormal breakage region. Even a short-time grinding test will be sufficient to estimate the parameters if abnormal breakage effects are reduced or eliminated. (iv) The algorithm can work with arbitrary sets of parameters that are irrelevant to the mill feed and mill type. Also, the algorithm’s framework shows that grinding is not a chaotic process; yet it may be due to the surface/gravitational attraction forces between particles and grinding media.
1. Introduction
The kinetic population balance model (PBM) is used to predict the progeny size distribution of particles comminuted in
size-reduction equipment [1,2,3,4,5]. It based upon the fundamental size–mass balance, which can be expanded in the following
integrodifferential equation to describe the accumulation (or depletion) of particles of different sizes by breakage:
is the breakage rate (s-) of particles of size x, is the mass fraction of particles of size x in the mill hold-up at time t, and is the breakage function, i.e., the mass fraction of particles of size y broken to size x at a single breakage event. Equation (1) treats the particle as a continuous variable, which can be further discretized for simpler computations:
is the mass fraction of the size class i in the mill hold-up at time t, N is the total number of size fractions, Si is the breakage rate of the size class i, whereas is the breakage function, i.e., the mass fraction of the size class j broken into size class i. The discretization provides iterative matrix solutions [2] to Equation (2) as long as is constant, i.e., particles are broken at a constant rate (first-order breakage kinetics). However, rate of breakage is not constant (non-first-order breakage kinetics) particularly when (i) particles are too big (>1 mm) to be broken in the mill [2], or when (ii) there are multi-particle interactions [6] such as cushioning or agglomeration of particles. In this case, Equation (2) cannot be solved iteratively by using the matrix equations. Alternatively, some scaling (self-similar) functions [7,8,9,10,11,12] can be used as the selection function to solve kinetic PBM, as long as the selected function describes the non-linear breakage kinetics [5,13,14]. All the above discussion indicates that the solution of the kinetic PBM gets complicated because of the uncertainties in the breakage rate.
The size-discretized kinetic PBM (Equation (2)) can be rewritten without involving time if the size-reduction time is taken every minute. This new model (matrix PBM), can be expressed as a set of equations solved in a matrix form [1]. Each row of this matrix represents the size–mass balance around each size class:
is the mass fraction of the size class i in the breakage product, is the mass fraction of size i depleted at breakage, and is the mass fraction of the size class i in the feed. The model can be used to describe crushers [15,16,17] where the retention time of particles is very short. Although the matrix model was previously offered to describe grinding mills [18,19], this model can work only if grinding is oversimplified as a short-time event. On the other hand, given that grinding is formed by too many successive breakage events, it can be solved through an iterative solution of equations where each equation describes a successive breakage event on a different particle. This study presents a computational algorithm to iteratively solve such equations. Therefore, the algorithm can simulate successive breakage events in size-reduction equipment, allowing us to predict the evolution of progeny size distribution. The algorithm iteratively selects the mean particle of a monosize fraction, whose mass is further distributed to its progenies through the corresponding breakage distribution function. Each iterative calculation is actually the matrix PBM (Equation (3)) restricted to a breakage event of a single particle; therefore, each calculation can be defined as a pseudo-matrix PBM. The overall algorithm is capable of demonstrating a realistic picture of size-reduction by taking account individual breakage events. The time can be incorporated to the algorithm either (i) implicitly as the number of breakage events or (b) explicitly if a proper function between grinding time and number of breakage events is known. However, the algorithm does not account for (i) useless ball–ball or ball–particle impacts that do not produce breakage or (ii) the aggregation or agglomeration of fine particles [20,21] occurring at fine grinding. The critical component of the algorithm is the iterative selection of particles, which is accomplished by using a probabilistic number generator coupled with the Mersenne Twister algorithm [22]. This number generator is used to select particles either randomly or non-randomly for simulation.
2. Materials and Methods
Three narrow size fractions of the Portland cement clinker (−3.35 + 2.36 mm, −2.36 + 1.7 mm, −1.7 + 1.18 mm), an artificial feed of −3.35 mm clinker following GGS distribution (distribution modulus = 0.27, size modulus = 3.35 mm), and a single size fraction (−3.35 + 2.36 mm) of feldspar were used as the experimental material. The true densities of the feldspar (2.65 g/cm3) and clinker (3.19 g/cm3) were calculated by using water and helium pycnometer, respectively. Portland cement clinker samples were ground in a batch ball mill (19 × 18 cm) with 25.4 or 31.75 mm monosize steel balls at 56–58% of the mill speed. The feldspar sample was ground in a planetary ball with 12.7 mm balls operating at 300 rpm. The experimental PSDs after grinding were recorded for different grinding times.
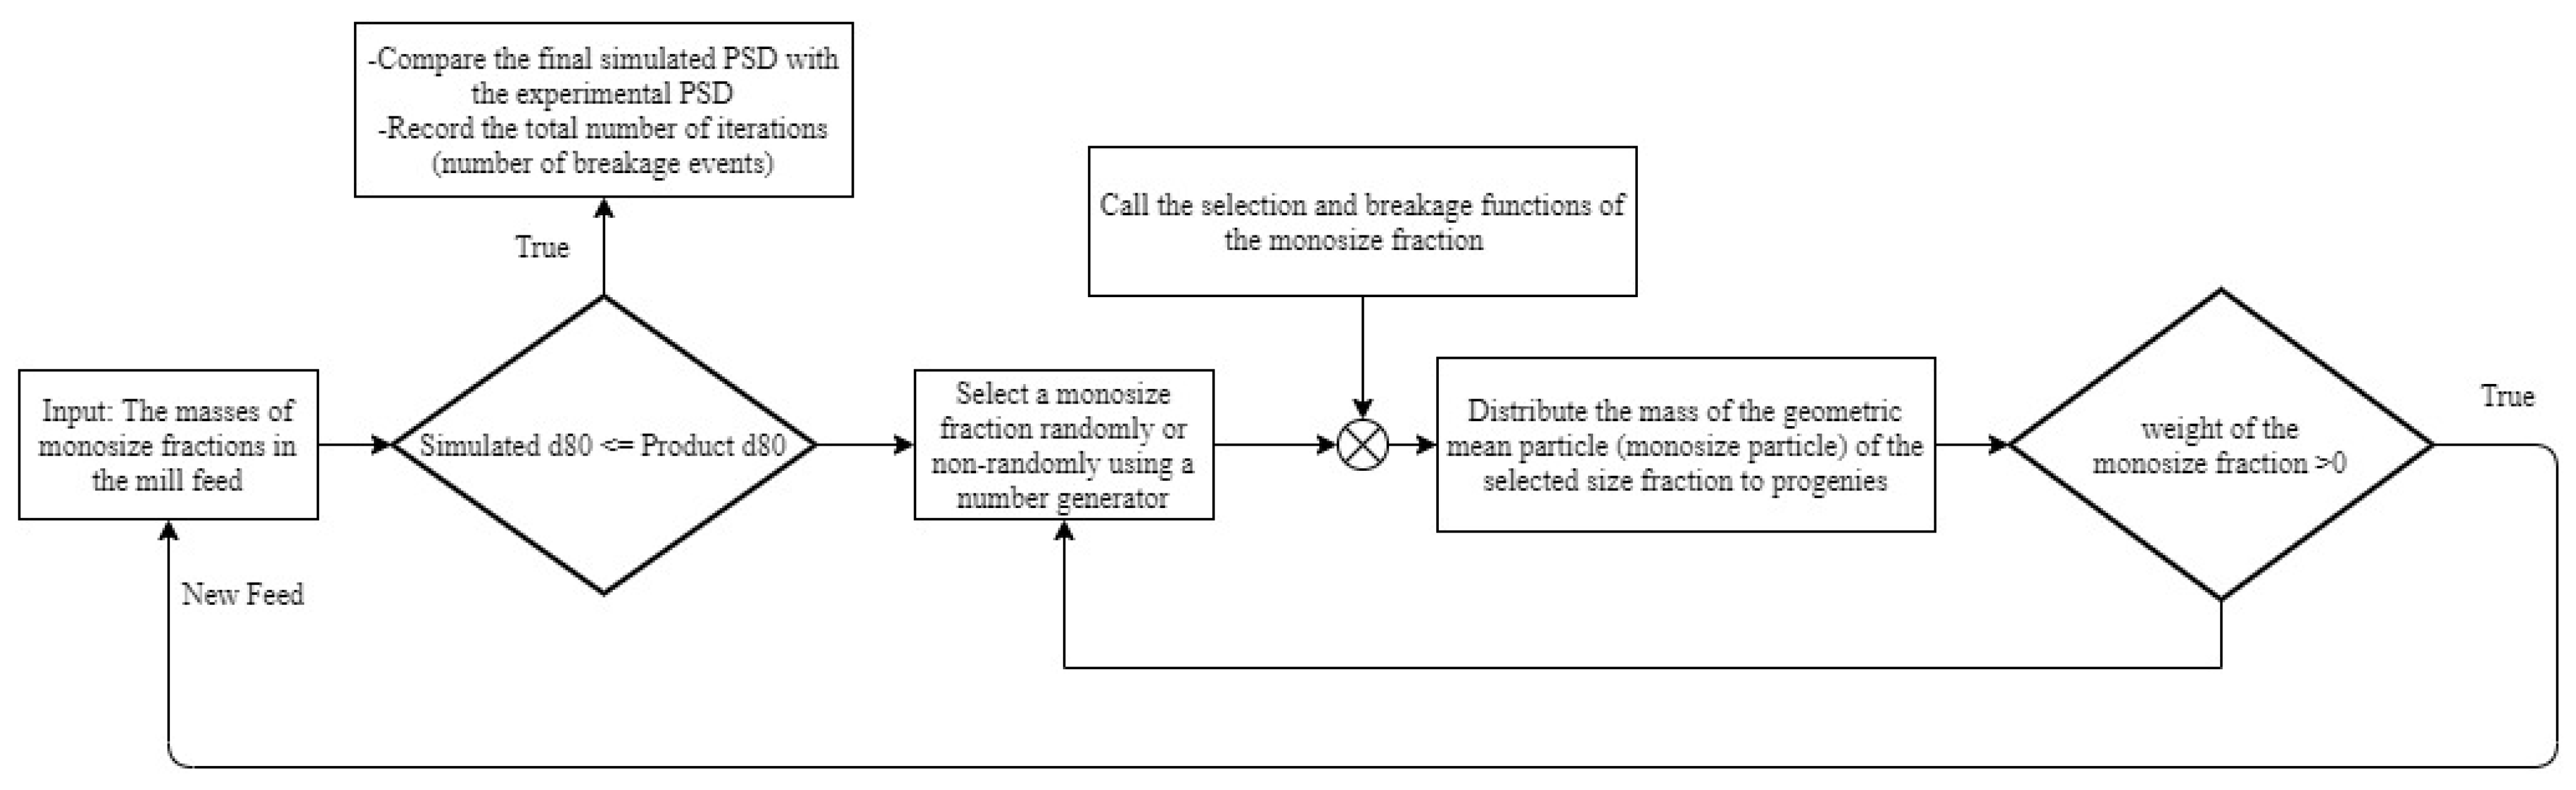
The computational algorithm was executed and tested against any experimental PSD through the following flowsheet (Figure 1)—using the algorithm with a random or non-random selection procedure, a monosize fraction in the experimental feed size distribution (FSD) was selected. Then, the mass of the geometric mean of the selected size fraction was distributed to finer progeny fractions through an assigned breakage distribution function. Also, the mass of the selected particle was calculated assuming that it was a perfect sphere. The size distribution after the iteration was calculated, and then updated as the new FSD for the succeeding iteration. The iterations continued until the 80% passing size (d80) of the simulated product exceeded the d80 of the experimental product size distribution. The final PSD after the simulation was evaluated with the corresponding experimental product size distribution. Also, the total number of iterations (the number of breakage events) was recorded to construct a time-explicit algorithm. All the computations were made by using the MATLAB software.
Particle Selection Algorithm for Breakage
The size fractions were selected for breakage either randomly or non-randomly by using a random number generator.
For random selection, the generator used the Mersenne Twister algorithm [22] to produce a pseudorandom integer from a uniform distribution of the size fraction indices. The corresponding size fraction of the generated index was further selected for breakage. For
non-random selection, the generator used the Mersenne Twister algorithm [22] coupled with a binary search tree algorithm for weighted sampling [23]. In this case, the index of a size fraction was selected with a probability provided in a vector whose elements corresponded to the selection probabilities of the indices of all monosize particles. Table 1 demonstrates the specific probability vectors tested for non-random selections in the simulator. The first vector in Table 1 reflects the relative abundance of size fractions in terms of the mass of the
monosize fractions. However, the last two matrices were considered as empirical values. As the weight % of the size classes (yi in Table 2) may change after each iteration, the corresponding vectors that include yi were updated before each breakage event.
3. Results
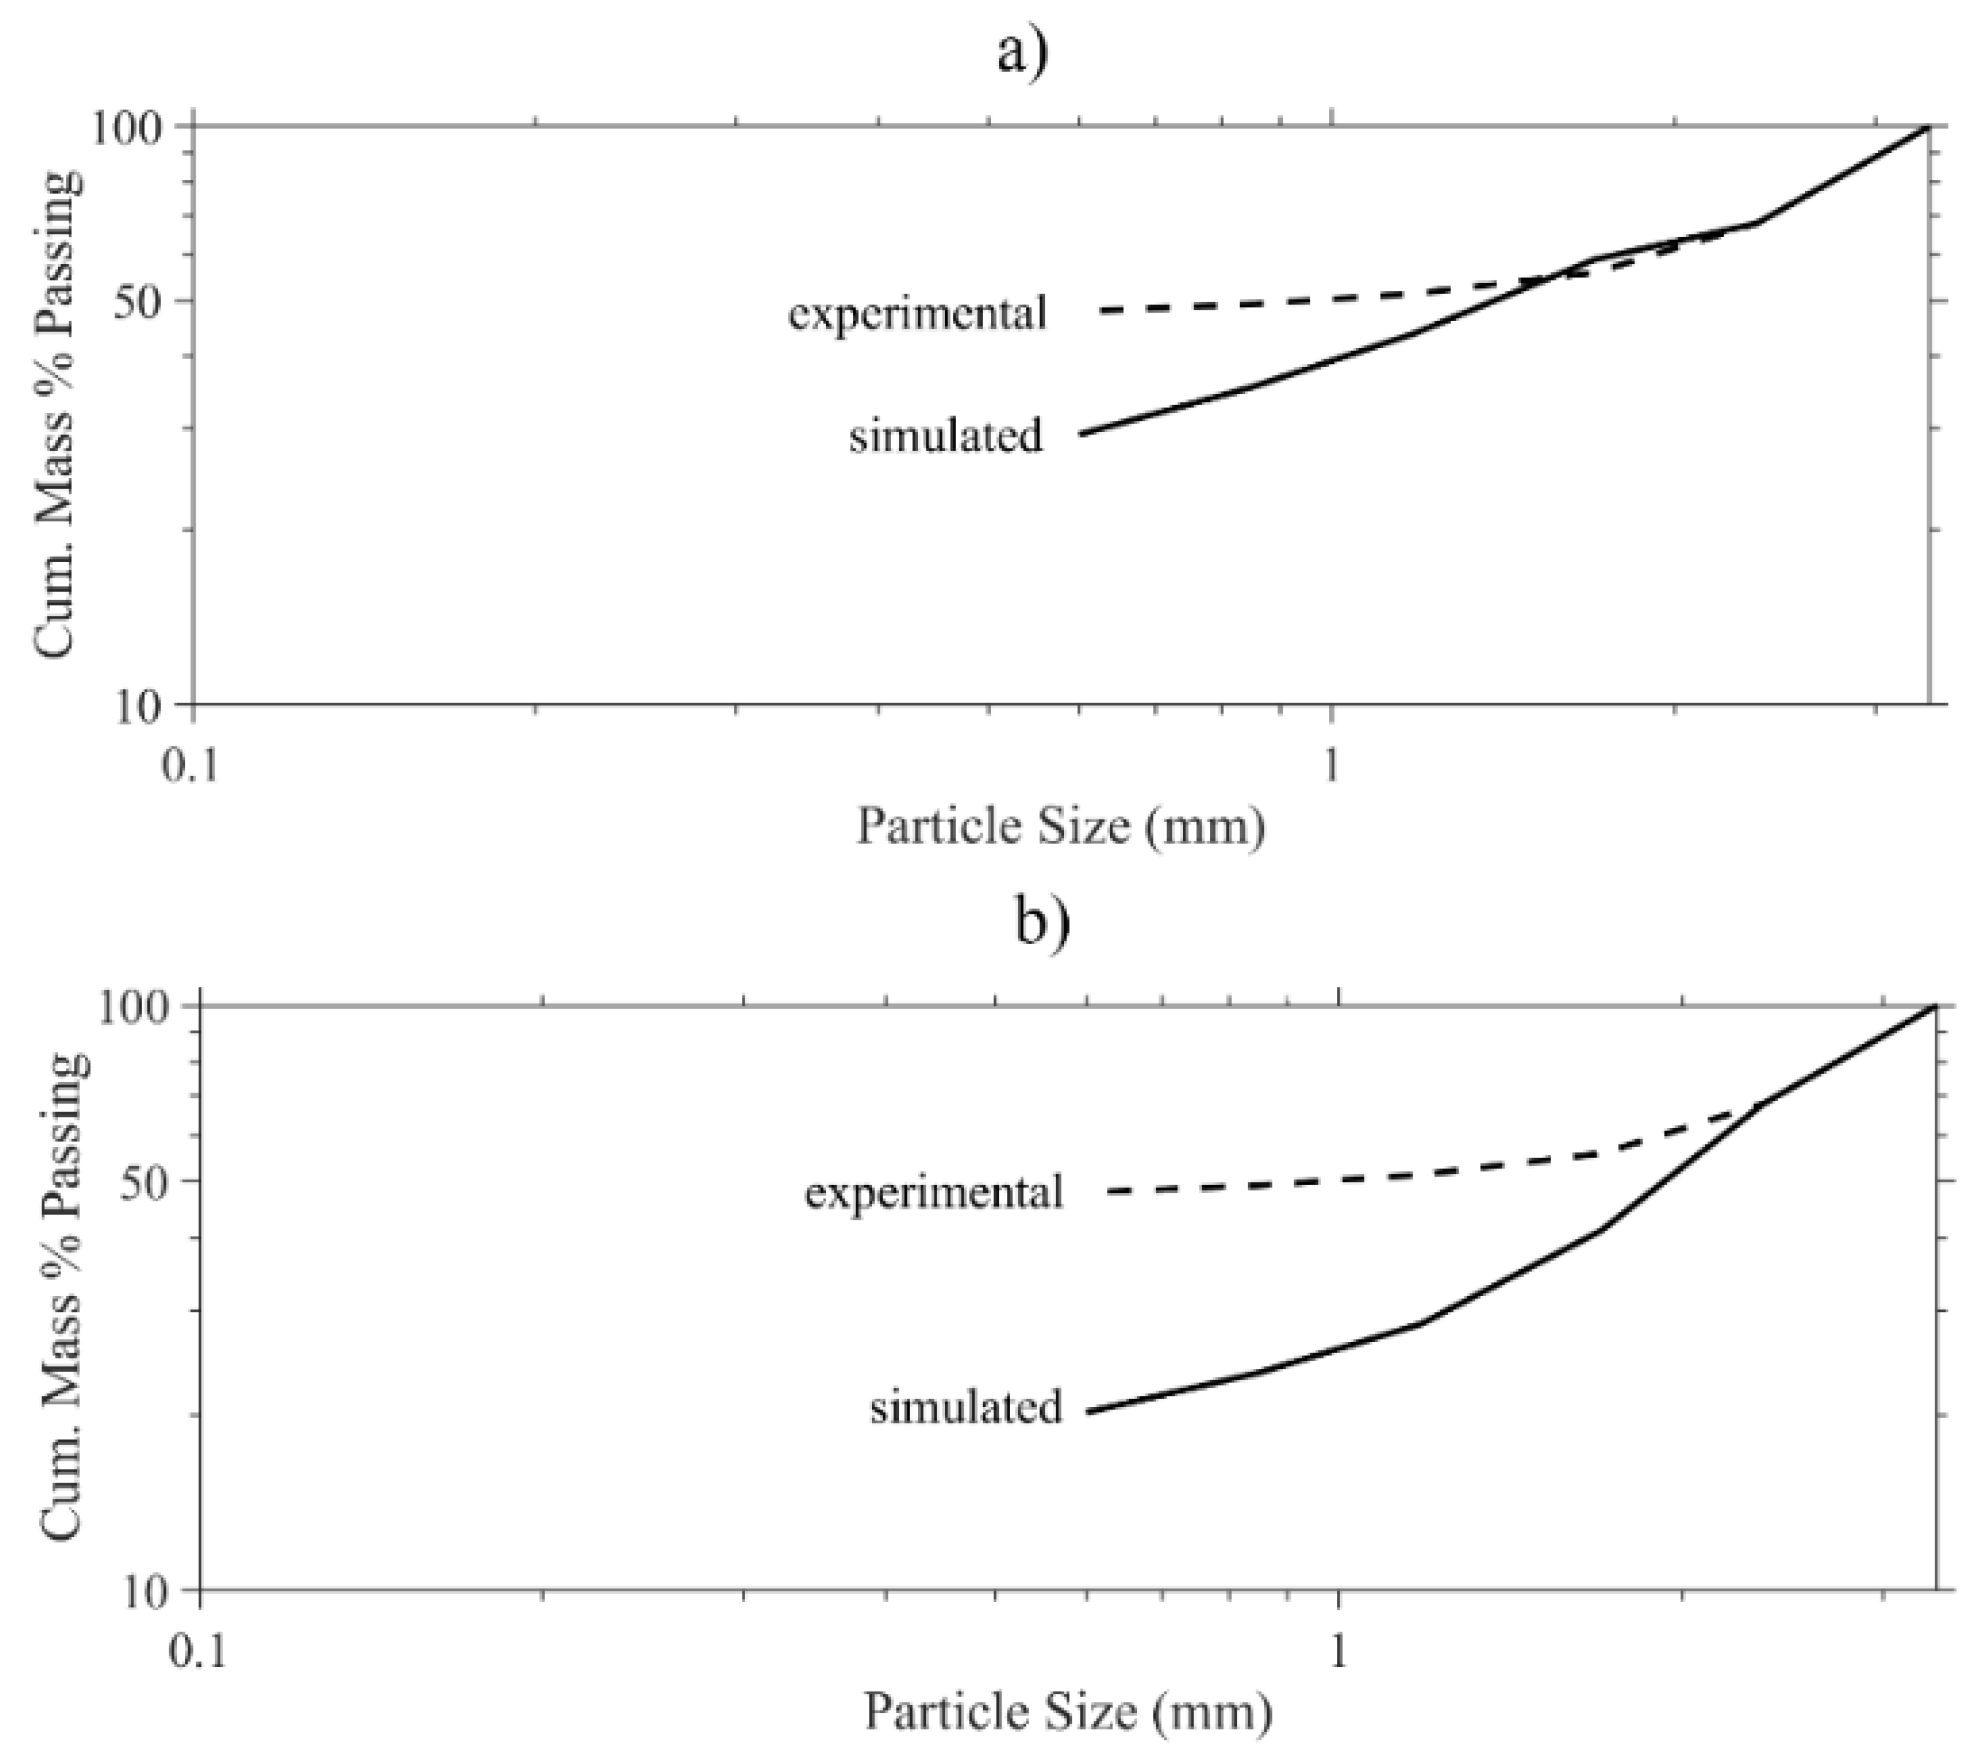
Figure 2 demonstrates the experimental PSDs of the −3.35 + 2.36 mm clinker ground in the ball mill, and the corresponding PSDs simulated with random or non-random particle selection with ‘mass’ probability vector. The breakage distribution functions of the monosize fractions of clinker were taken from the short-time grinding tests at the same milling conditions. The results show that neither random (Figure 2a) nor non-random particle selection with ‘mass’ vector (Figure 2b) can yield the experimental PSD of the sample ground. Meanwhile, Figure 3 presents the experimental PSDs of the −3.35 + 2.36 mm ground clinker, and the corresponding PSDs simulated with non-random selection through Power (P) and Mass and Power (MP) probability vectors. Although using the former cannot produce the experimental PSD (Figure 3a), using the latter can accurately simulate the experimental PSDs (Figure 3b). All the other experimental PSDs can be accurately simulated with the ‘MP’ probability vector, but only some of them are presented for the sake of brevity.
Table 2 presents the range of ‘n’ exponents to construct ‘MP’ probability vectors for the accurate simulation of the experimental PSDs of clinker feeds of different size. The results show that the range of ‘n’ gets narrower as the feed size gets smaller.
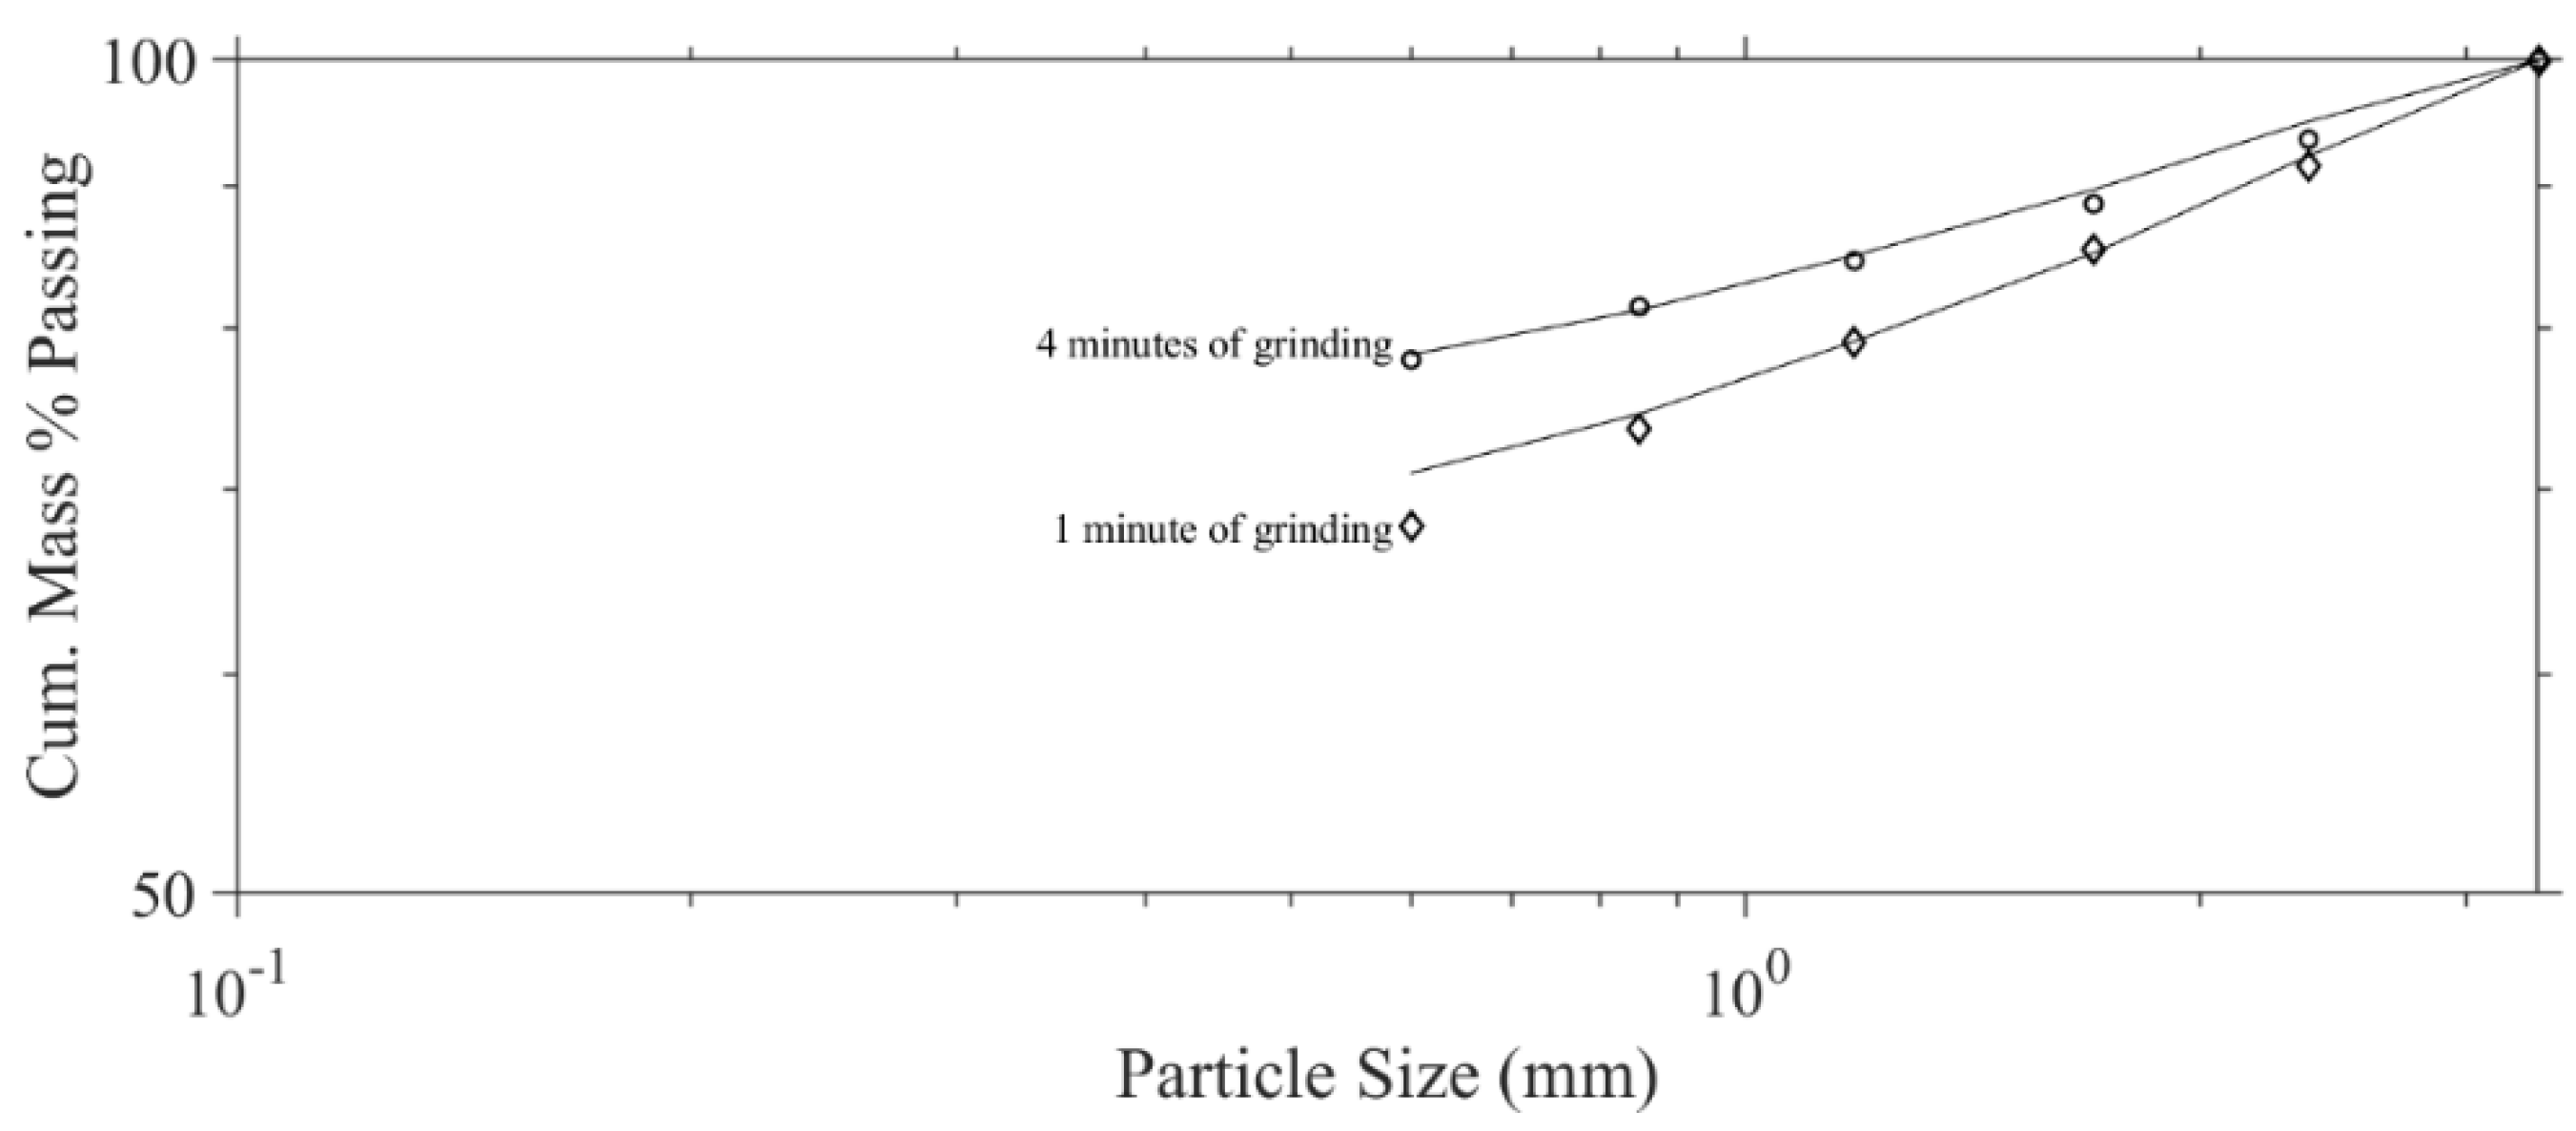
Figure 4 shows the experimental PSDs of the artificial feed of clinker (−3.35 mm), and the corresponding PSDs simulated with the ‘MP’ probability vector. Although each monosize fraction in the feed is simulated with ‘MP’ probability vector with a wide range of exponents (Table 1), the results show that a narrow range of exponents will be sufficient for the accurate prediction of the experimental PSDs of the artificial feed.
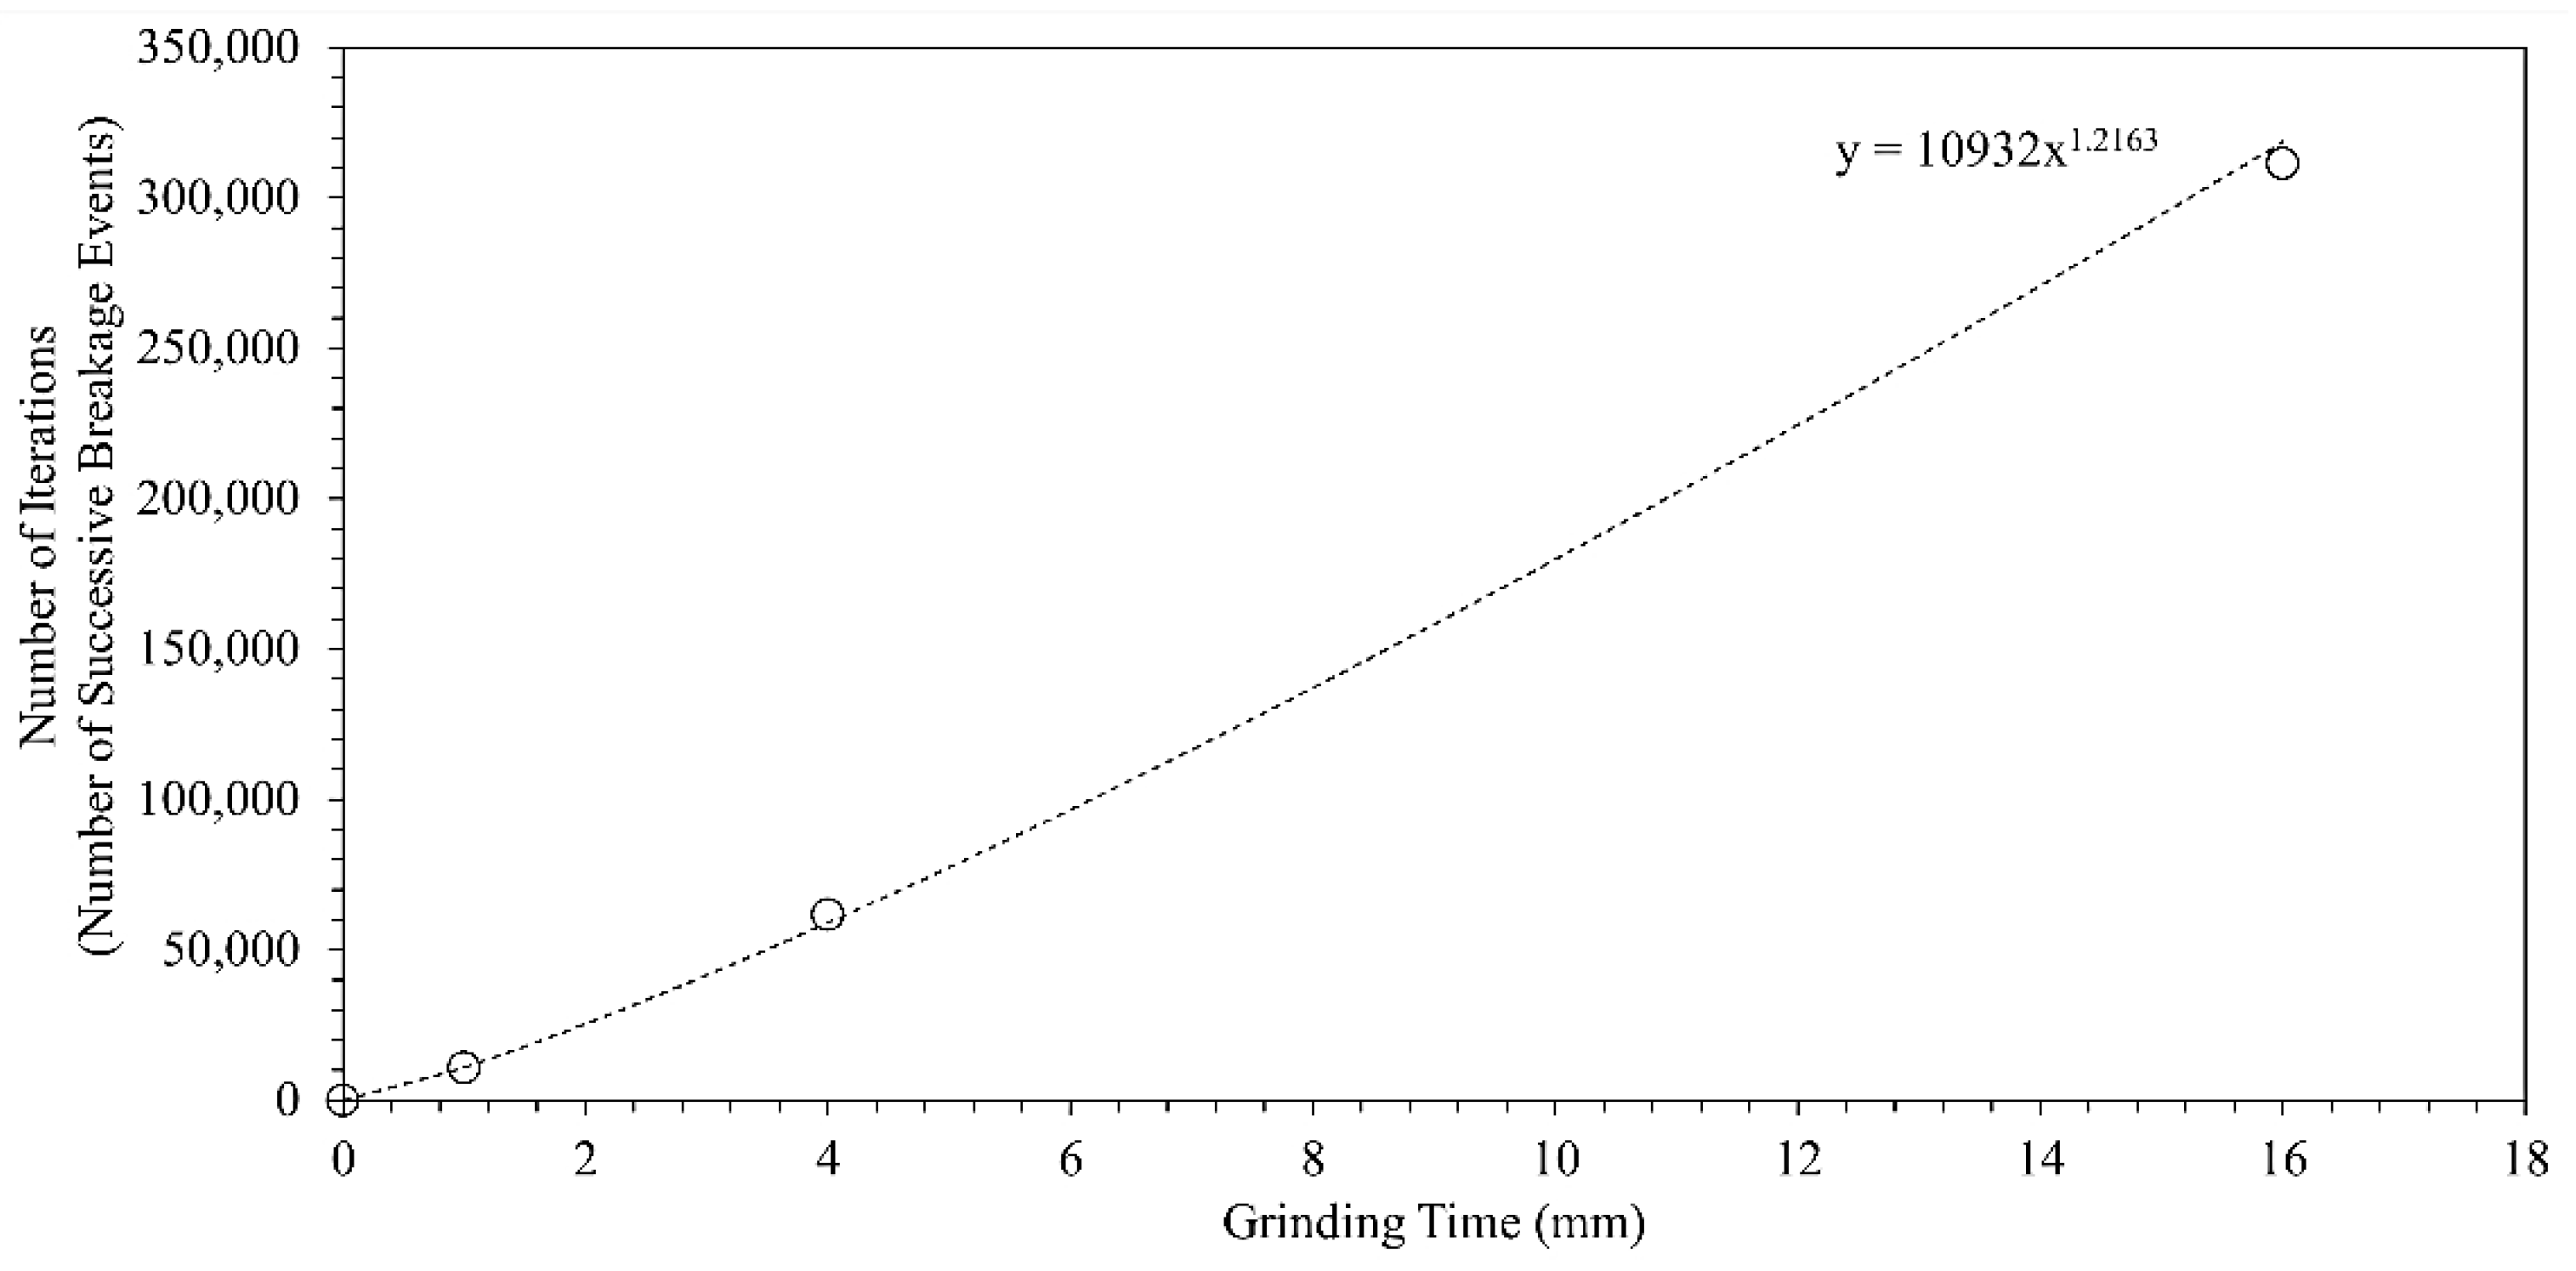
Figure 5 shows the variation of the total number of iterations (number of successive breakage events) with the grinding time at some simulations conducted with ‘MP’ probability vectors. The results show that the number of successive breakage events can be well-fitted to a power function of the grinding time in the form of y = Axb.
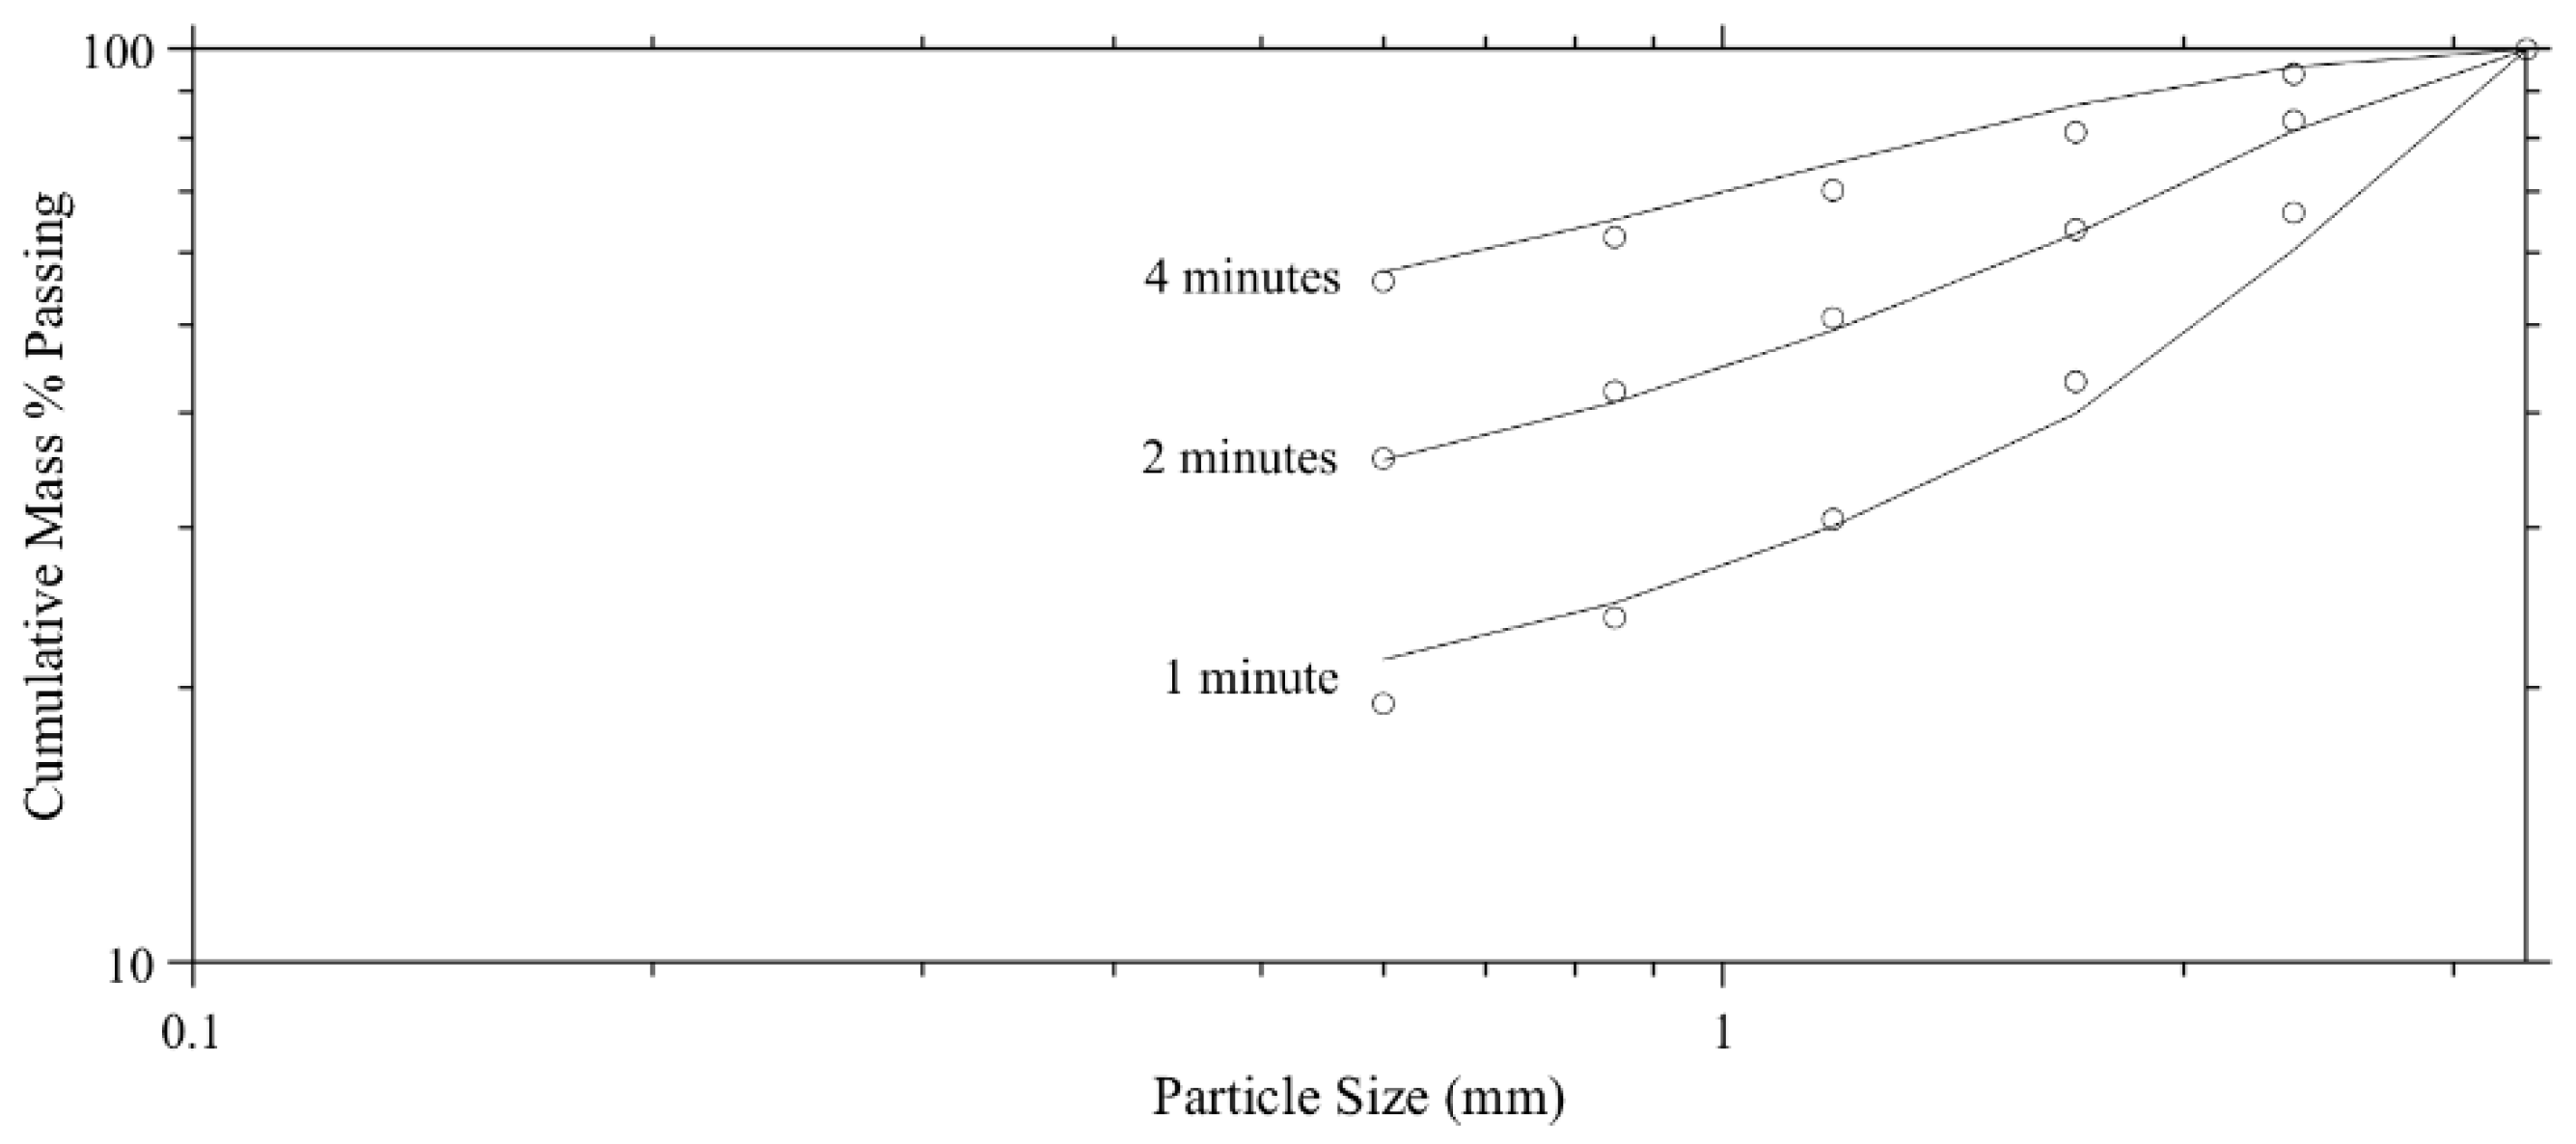
Figure 6 shows the experimental PSDs of −3.35 + 2.36 mm feldspar sample ground with planetary ball mill, and the corresponding PSDs simulated with the MP probability vector. However, for these simulations, the breakage distribution functions of the feldspar sample were arbitrarily selected from the breakage distribution functions of monosize clinker samples ground in the batch ball mill with 31.75 mm balls. The results show the simulation is capable of accurately predicting the experimental PSDs with arbitrary sets of ‘n’ and breakage distribution functions.
4. Discussion
The results initially show that random selection of particles for breakage cannot yield the experimental PSD of the ground sample (Figure 2a). This strongly suggests that the observed chaotic motion of the mill hold-up cannot cause random breakage events inside the mill. Therefore, there should be a single or multiple phenomena causing the particles to participate in the breakage events. As non-probability selection with a ‘mass’ probability vector cannot produce the experimental PSD (Figure 2b), it is likely that particles are not selected for breakage with respect to their abundances in the mill-hold up. Given that the ‘power’ probability vector selects particles with respect to the power of their diameters, the failure of the vector in the simulation (Figure 3a) suggests that the selection of particles cannot be attributed to their sizes. This eliminates the reason that the relative strength of particles, which is observed to be a function of the particle size [24,25], cannot be responsible for particles to participate in the breakage events. The simulation with the ‘MP’ probability vector, on the other hand, can accurately produce a range of PSDs for different combinations of feed sample and grinding environment (Figure 3b, Figure 4 and Figure 6). In this non-random selection routine, particles are selected for breakage with a probability proportional to the total mass of near-size particles and an inverse power of its diameter. Such proportionalities are generally observed while estimating the gravitational [26] and surface [27,28] attraction forces between masses of objects. Therefore, the particles in the mill hold-up may be participating in the breakage events due to the attraction forces between particles and grinding media. However, as there is no current experimental evidence to evaluate this speculation, the author encourages the audience to test the presence of such attraction forces by means of relevant sophisticated measurement techniques [26,27,29]. Meanwhile, the variation of ‘n’ with particle size (Table 1) may indicate some clues regarding the nature of such forces—in coarse feeds (+1 mm), the breakage events only occur at fine particles due to the abnormal breakage effect [2]. Then, the attraction between balls and fine particles may be dominated by the surface attraction, which is reflected with high values of ‘n’. On the other hand, as the feed size gets smaller or the mill environment becomes more disruptive, the abnormal breakage effect should disappear. In this case, as exemplified in Figure 6, the ‘n’ value approaches (−2)–(−2.5). Given that the length scale (−2) of the gravitational attraction is numerically close to this ‘n’ range, the author suspects that gravitational attraction are causing the breakage events when the abnormal breakage effect is reduced or eliminated.
The abovementioned discussion suggests that a single exponent ‘n’ is sufficient for the simulation if the abnormal breakage effect [2] is reduced (Table 2). Even this exponent can be estimated by running the time-implicit simulation on a single experimental PSD of a short-time grinding test. The results also suggest some simplicity associated with the computation algorithm—firstly, the method can run with only two parameters, namely n and breakage distribution functions, which can be arbitrarily selected for different combinations of feed and milling environment (Figure 6). Also, the time can be explicitly added to the algorithm if the number of successive breakage events can be expressed as a power function of grinding time (Figure 5). As the number of parameters in this function is equal to two, there should be two or more datasets of grinding time-total number of iterations for fitting purposes. Therefore, at least two experimental PSD curves should be simulated to construct a time-explicit algorithm.
5. Conclusions
This study presents a computational algorithm coupled with a pseudo-matrix model to simulate the product size distributions (PSDs) of different grinding mills. The algorithm’s applicability and accuracy were validated against experimental PSDs from different grinding equipment. The results show that the evolution of PSDs at grinding may be due to the surface/gravitational attraction forces.
The algorithm is simple to construct, with few parameters. Even a short-time grinding test will be sufficient to execute the time-implicit algorithm if abnormal breakage effects are reduced or eliminated. However, running the time-explicit algorithm requires the simulation and evaluation of two or more experimental PSDs. The algorithm can even work with arbitrary sets of parameters that are irrelevant to the mill feed and mill environment.
Author Contributions
Conceptualization, M.C.; methodology, M.C.; software, M.C.; validation M.C.; formal analysis, M.C.; data curation, M.C.; writing—original draft preparation, M.C.; writing—review and editing, M.C. The author has read and agreed to the published version of the manuscript.
Funding
This research received no external funding.
Institutional Review Board Statement
Not applicable.
Informed Consent Statement
Not applicable.
Acknowledgments
The author would like to thank Çetin Hoşten for the valuable communication.
Conflicts of Interest
The authors declare no conflict of interest.
References
- Gupta, A.; Yan, D.S. Mineral Processing Design and Operation; Elsevier: Amsterdam, The Netherlands, 2006. [Google Scholar]
- Austin, L.G.; Klimpel, R.R.; Luckie, P.T. Process Engineering of Size Reduction: Ball Milling; AIME: New York, NY, USA, 1984; ISBN 0895204215. [Google Scholar]
- Li, W. Exploring the Fundamentals of Impact Breakage Events in Grinding. Master’s Thesis, McGill University, Montreal, QC, Canada, 2005. [Google Scholar]
- King, R.P. Modeling and Simulation of Mineral Processing Systems; Butterworth-Heinmann Publications: Oxford, UK, 2001. [Google Scholar]
- Bilgili, E.; Scarlett, B. Population balance modeling of non-linear effects in milling processes. Powder Technol. 2005, 153, 59–71. [Google Scholar] [CrossRef]
- Bilgili, E. On the consequences of non-first-order breakage kinetics in comminution processes: Absence of self-similar size spectra. Part. Part. Syst. Charact. 2007, 24, 12–17. [Google Scholar] [CrossRef]
- Gupta, V.K.; Kapur, P.C. A Pseudo-Similarity Solution to the Integro-Differential Equation of Batch Grinding. Powder Technol. 1975, 12, 175–178. [Google Scholar] [CrossRef]
- Kapur, P.C. Self-preserving size spectra of comminuted particles. Chem. Eng. Sci. 1972, 27, 425–431. [Google Scholar] [CrossRef]
- Peterson, T.W.; Scotto, M.V.; Sarofim, A.F. Comparison of Comminution Data with Analytical Solutions of the Fragmentation Equation. Powder Technol. 1985, 45, 87–93. [Google Scholar] [CrossRef]
- Williams, M.M.R. An exact solution of the fragmentation equation. Aerosol Sci. Technol. 1990, 12, 538–546. [Google Scholar] [CrossRef]
- Brown, W.K. Comparison of a theory of sequential fragmentation with the initial mass function of stars. Astrophys. Space Sci. 1986, 122, 287–298. [Google Scholar] [CrossRef]
- Ziff, R.M. New solutions to the fragmentation equation. J. Phys. A Math. Gen. 1991, 24, 2821–2828. [Google Scholar] [CrossRef]
- Rao, B.V.; Datta, A. Analysis of nonlinear batch grinding in stirred media mills using self-similarity solution. Powder Technol. 2006, 169, 41–48. [Google Scholar] [CrossRef]
- Bilgili, E.; Yepes, J.; Scarlett, B. Formulation of a non-linear framework for population balance modeling of batch grinding: Beyond first-order kinetics. Chem. Eng. Sci. 2006, 61, 33–44. [Google Scholar] [CrossRef]
- Anticoi, H.; Guasch, E.; Ahmad Hamid, S.; Oliva, J.; Alfonso, P.; Bascompta, M.; Sanmiquel, L.; Escobet, T.; Escobet, A.; Parcerisa, D.; et al. An Improved High-Pressure Roll Crusher Model for Tungsten and Tantalum Ores. Minerals 2018, 8, 483. [Google Scholar] [CrossRef]
- Nikolov, S. A performance model for impact crushers. Miner. Eng. 2002, 15, 715–721. [Google Scholar] [CrossRef]
- Li, H. Discrete Element Method (DEM) Modelling of Rock Flow and Breakage within a Cone Crusher. Ph.D. Thesis, University of Nottingham, Nottingham, UK, 2013. [Google Scholar]
- Whiten, W.J. A matrix theory of comminution machines. Chem. Eng. Sci. 1974, 29, 589–599. [Google Scholar] [CrossRef]
- Weedon, D.M. A perfect mixing matrix model for ball mills. Miner. Eng. 2001, 14, 1225–1236. [Google Scholar] [CrossRef]
- Opoczky, L. Fine Grinding and Agglomeration of Silicates. Powder Technol. 1977, 17, 1–7. [Google Scholar] [CrossRef]
- Beke, B. The Process of Fine Grinding; Akademiai Kiado: The Hague, The Netherlands, 1981; ISBN 9789400982604. [Google Scholar]
- Matsumoto, M.; Nishimura, T. Mersenne Twister: A 623-Dimensionally Equidistributed Uniform Pseudo-Random Number Generator. ACM Trans. Model. Comput. Simul. 1998, 8, 3–30. [Google Scholar] [CrossRef]
- Wong, C.K.; Easton, M.C. An Efficient Method for Weighted Sampling without Replacement. SIAM J. Comput. 1980, 9, 111–113. [Google Scholar] [CrossRef]
- Xu, Y.; Song, D.; Chu, F. Approach to the Weibull modulus based on fractal fragmentation of particles. Powder Technol. 2016, 292, 99–107. [Google Scholar] [CrossRef]
- Tavares, L.M. Breakage of Single Particles: Quasi-Static. In Handbook of Powder Technology; Salman, A.D., Ghadiri, M., Hounslow, M.J., Eds.; Elsevier: Amsterdam, The Netherlands, 2007; Volume 12, pp. 3–68. ISBN 978-0-444-53080-6. [Google Scholar]
- Schmöle, J.; Dragosits, M.; Hepach, H.; Aspelmeyer, M. A micromechanical proof-of-principle experiment for measuring the gravitational force of milligram masses. Class. Quantum Gravity 2016, 33. [Google Scholar] [CrossRef]
- Israelachvili, J.N. Intermolecular and Surface Forces; Elsevier: Amsterdam, The Netherlands, 2011; ISBN 9788578110796. [Google Scholar]
- Leite, F.L.; Bueno, C.C.; Da Róz, A.L.; Ziemath, E.C.; Oliveira, O.N. Theoretical models for surface forces and adhesion and their measurement using atomic force microscopy. Int. J. Mol. Sci. 2012, 13, 12773–12856. [Google Scholar] [CrossRef]
- Speake, C.; Quinn, T. The search for Newton’s constant. Phys. Today 2014, 67, 27–33. [Google Scholar] [CrossRef]
Figure 1.
The flowsheet for the execution and validation of the computational algorithm.

Figure 2.
The experimental PSD of the −3.35 + 2.36 mm clinker ground in the ball mill, and the corresponding PSDs simulated with random (a) or non-random (b) particle selection with ‘mass’ probability vector. Ball size in experimental tests = 25.4 mm, the experimental grinding time = 16 min, n exponent in the ‘MP’ probability vector = −4.9.

Figure 3.
The experimental PSDs of the −3.35 + 2.36 mm clinker ground in the ball mill for different times, and the corresponding PSDs simulated with non-random particle selection through Power (a) and Mass and Power (b) probability vectors. The simulated PSDs are shown with straight lines, while the experimental PSDs are shown with symbols. Ball size in experimental tests = 31.75 mm, n exponent in the ‘MP’ probability vector ranges between −4.0 and −3.5.

Figure 4.
The experimental PSDs of the artificial feed of clinker (−3.35 mm), and the corresponding PSDs simulated with the MP probability vector. The simulated PSDs are shown with straight lines, while the experimental PSDs are shown with symbols. Ball size in experimental tests = 25.4 mm, n exponent in the ‘MP’ probability vector ranges between −4.0 and −3.7.

Figure 5.
The total number of iterations vs. the experimental grinding time in ball milling. The simulations were conducted with ‘MP’ probability vectors. The dashed line represents the power function fitted to the data in the form of y = Axb. The experimental setup—ball size = 31.75 mm, mill feed = −3.35 + 2.36 mm clinker.

Figure 6.
The experimental PSDs of the −3.35 + 2.36 mm feldspar ground in the planetary ball mill for different times, and the corresponding PSDs simulated with non-random particle selection through Mass and Power (b) probability vectors. The simulated PSDs are shown with straight lines, while the experimental PSDs are shown with symbols. Ball size in experimental tests = 12.7 mm, n exponent in the ‘MP’ probability vector = −2.43.


Table 1.
The description and formulation of probability vectors used at the simulation of non-random particle selection.
Table 1.
The description and formulation of probability vectors used at the simulation of non-random particle selection.
| Probability Vector | Formulation | Description of the Terms |
|---|---|---|
| Mass | : the weight % of the size class i in the mill feed (or new feed) before an iteration. : the geometric mean size of the monosize class i n: an empirical constant | |
| Power (P) | ||
| Mass & Power (MP) |
Table 2.
The range of ‘n’ values used in the simulation of particle simulation for predicting the experimental PSDs at a wide range of grinding time (0.5–16 min). Ball size in experimental tests = 25.4 mm.
Table 2.
The range of ‘n’ values used in the simulation of particle simulation for predicting the experimental PSDs at a wide range of grinding time (0.5–16 min). Ball size in experimental tests = 25.4 mm.
| Feed Size | Range of n [Minimum, Maximum] |
|---|---|
| −3.35 + 2.36 mm | [−4.9, −3.7] |
| −2.36 + 1.7 mm | [−4.3, −4.1] |
| −1.7 + 1.18 mm | [−3.9, −3.8] |
Publisher’s Note: MDPI stays neutral with regard to jurisdictional claims in published maps and institutional affiliations. |
© 2021 by the author. Licensee MDPI, Basel, Switzerland. This article is an open access article distributed under the terms and conditions of the Creative Commons Attribution (CC BY) license (https://creativecommons.org/licenses/by/4.0/).
Share and Cite
MDPI and ACS Style
Camalan, M. A Computational Algorithm to Understand the Evolution of Size Distribution with Successive Breakage Events at Grinding. Environ. Sci. Proc. 2021, 6, 7. https://0-doi-org.brum.beds.ac.uk/10.3390/iecms2021-09381
AMA Style
Camalan M. A Computational Algorithm to Understand the Evolution of Size Distribution with Successive Breakage Events at Grinding. Environmental Sciences Proceedings. 2021; 6(1):7. https://0-doi-org.brum.beds.ac.uk/10.3390/iecms2021-09381
Chicago/Turabian StyleCamalan, Mahmut. 2021. "A Computational Algorithm to Understand the Evolution of Size Distribution with Successive Breakage Events at Grinding" Environmental Sciences Proceedings 6, no. 1: 7. https://0-doi-org.brum.beds.ac.uk/10.3390/iecms2021-09381