
Analysis of Copy Number Variations in Solid Tumors Using a Next Generation Sequencing Custom Panel


 ,
,  and
and 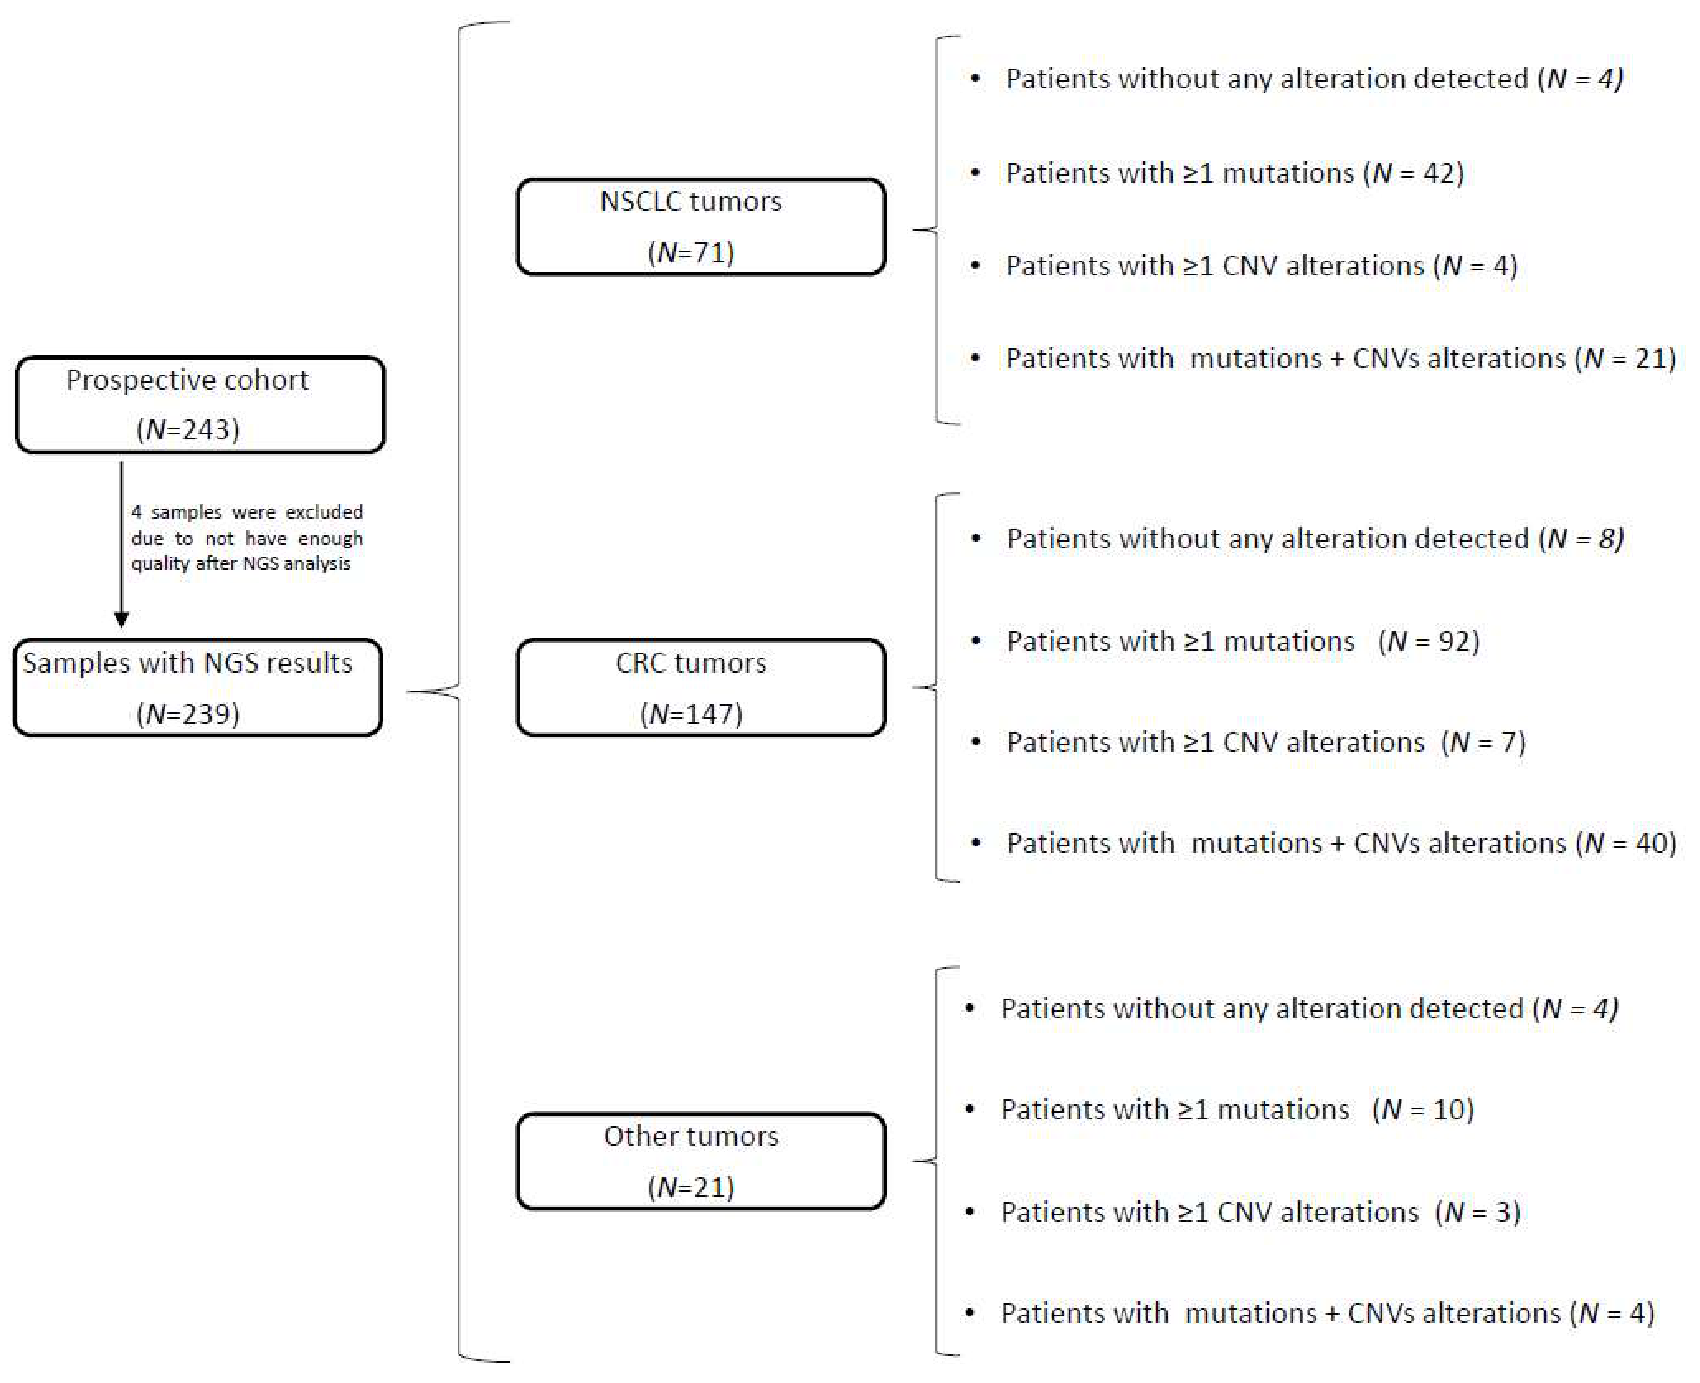
Abstract
:1. Introduction
2. Material and Methods
2.1. Patients and Cell Lines
2.2. Tissue Dissection and DNA Purification
2.3. NGS Sequencing Analysis
2.4. CNVs Analysis Prediction: Algorithm
2.5. FISH Analysis
3. Results
3.1. CNV Analysis in the Validation Cohort
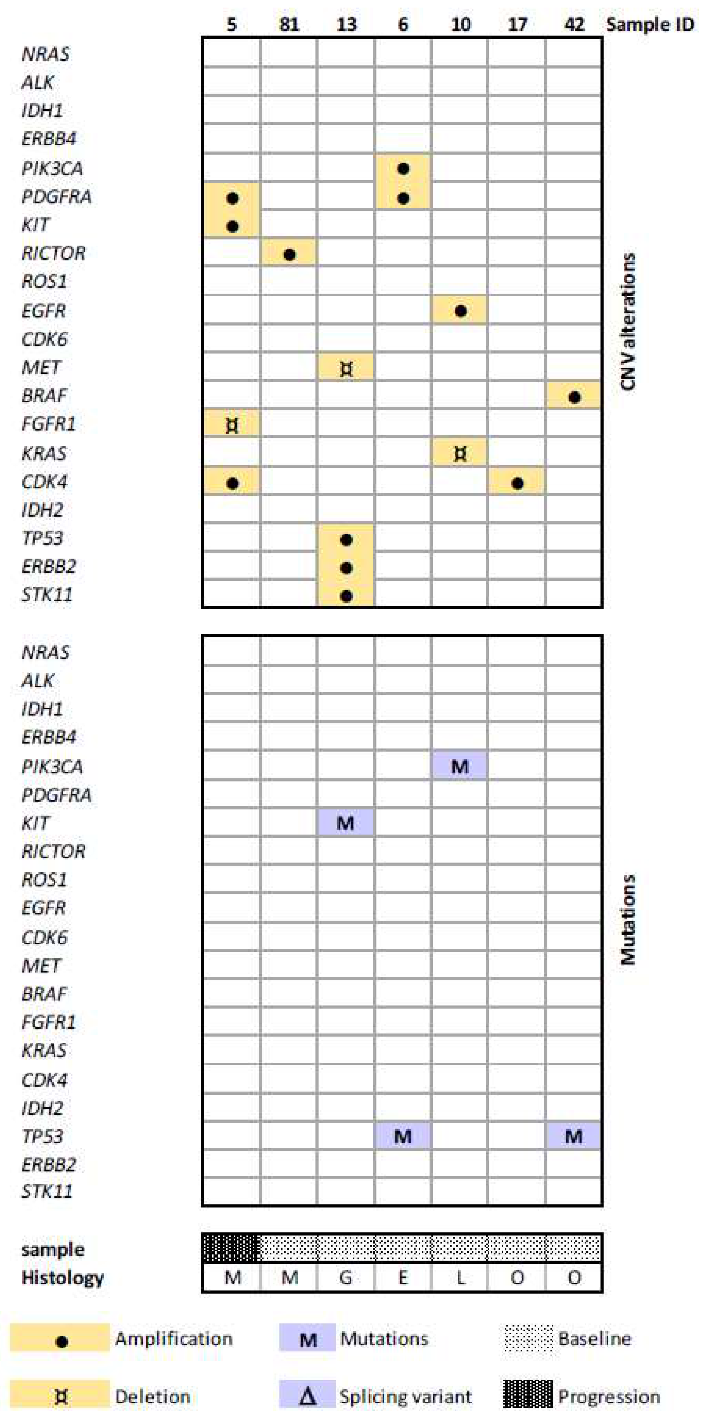
3.2. Mutation and CNV Status in the Prospective Cohort
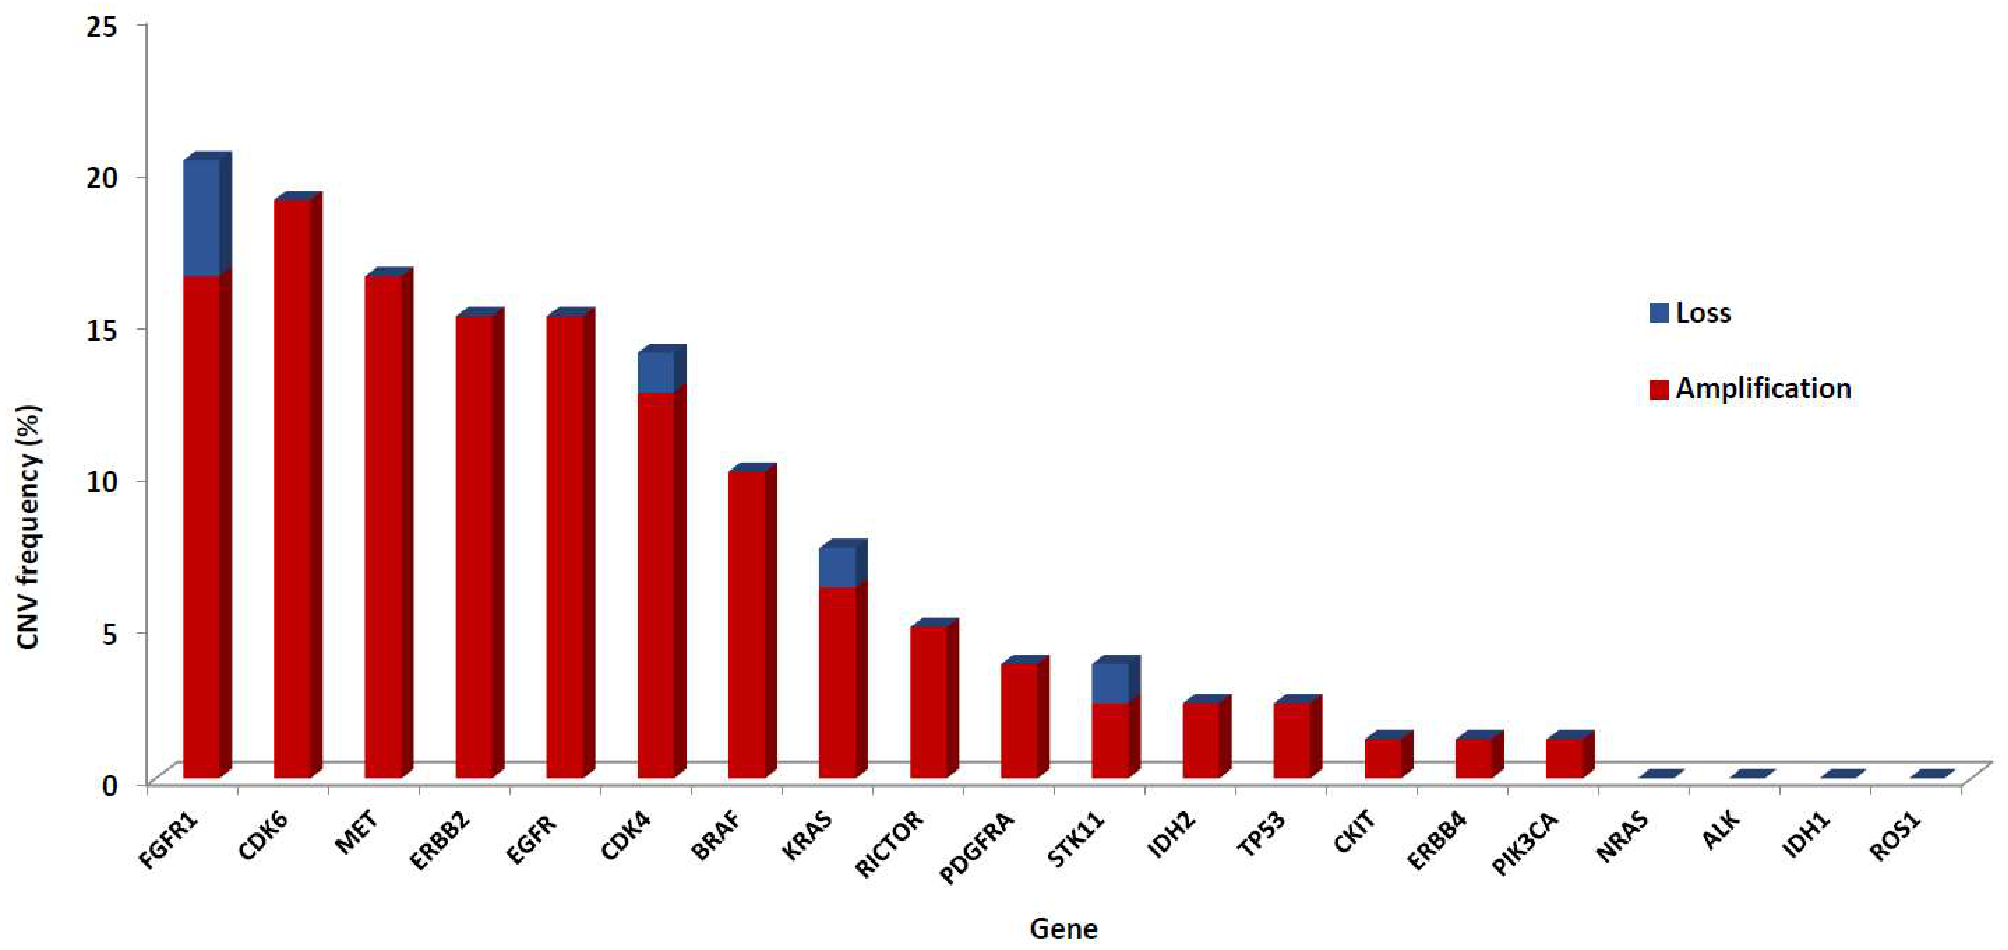
3.3. CNVs Patterns According to Tumor Type
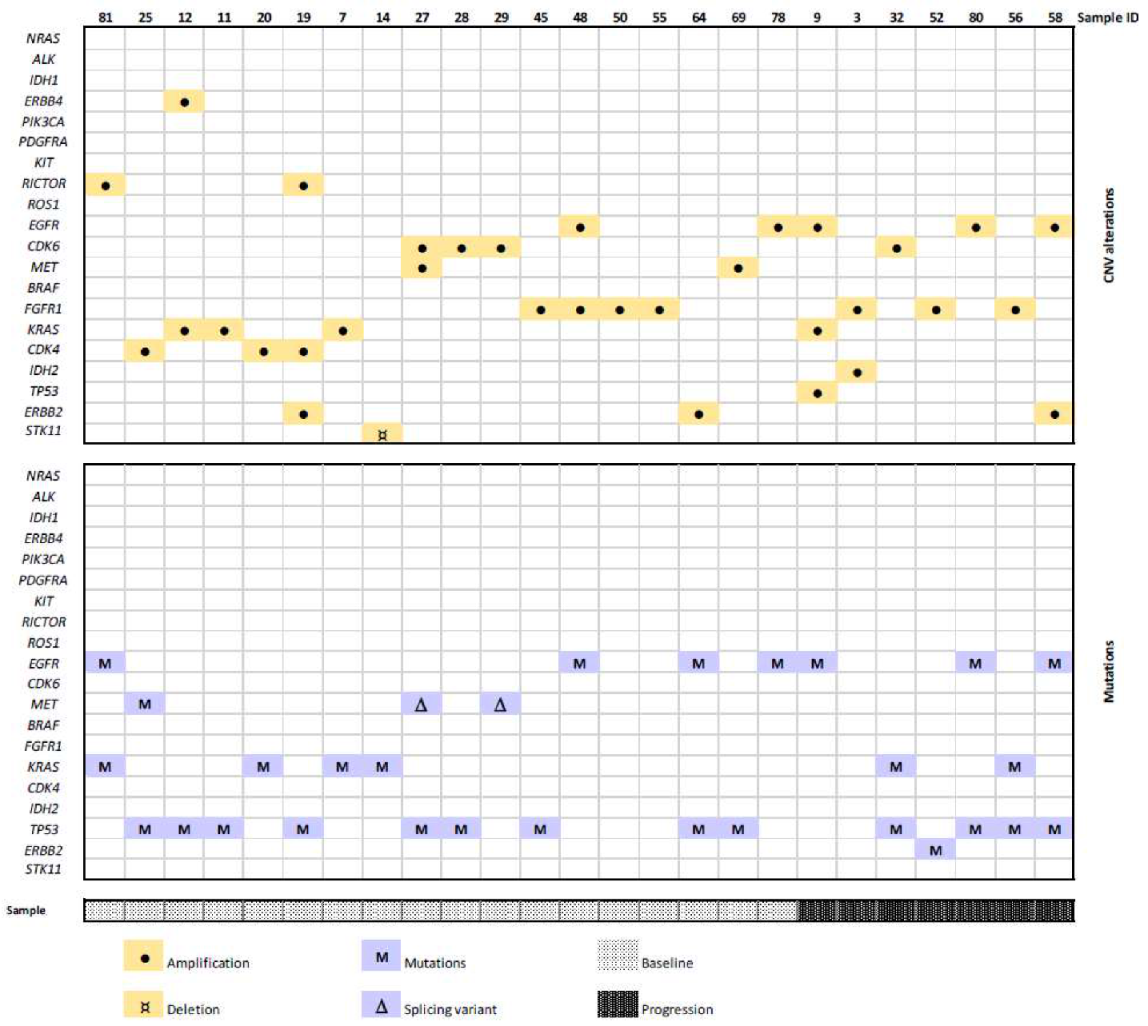
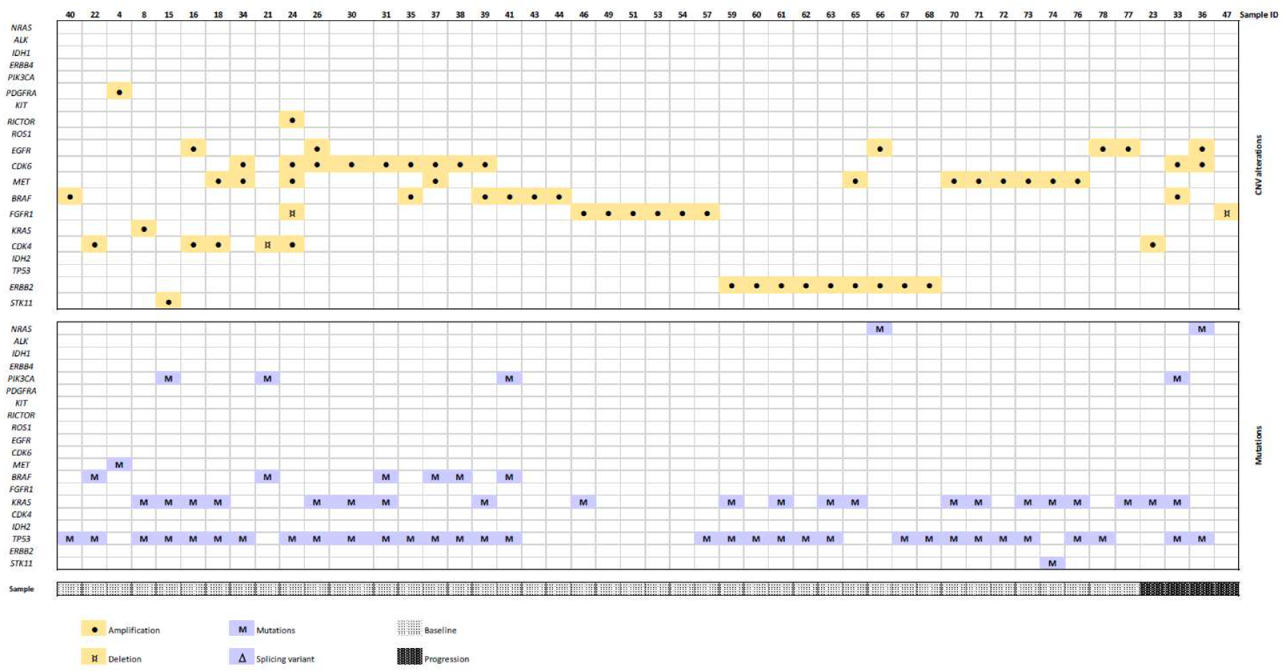
3.4. CNV in Baseline vs. Progression Samples
4. Discussion
5. Conclusions
Supplementary Materials
Author Contributions
Funding
Data Availability Statement
Acknowledgments
Conflicts of Interest
Ethical Statement
Abbreviations
References
- Abel, H.J.; Duncavage, E.J. Detection of structural DNA variation from next generation sequencing data: A review of informatic approaches. Cancer Genet. 2013, 206, 432–440. [Google Scholar] [CrossRef] [Green Version]
- Zhao, M.; Wang, Q.; Wang, Q.; Jia, P.; Zhao, Z. Computational tools for copy number variation (CNV) detection using next-generation sequencing data: Features and perspectives. BMC Bioinform. 2013, 14 (Suppl. S11). [Google Scholar] [CrossRef] [PubMed]
- Shao, X.; Lv, N.; Liao, J.; Long, J.; Xue, R.; Ai, N.; Xu, D.; Fan, X. Copy number variation is highly correlated with differential gene expression: A pan-cancer study. BMC Med. Genet. 2019, 20, 175. [Google Scholar] [CrossRef]
- Kerkhof, J.; Schenkel, L.C.; Reilly, J.; McRobbie, S.; Aref-Eshghi, E.; Stuart, A.; Rupar, C.A.; Adams, P.; Hegele, R.A.; Lin, H.; et al. Clinical Validation of Copy Number Variant Detection from Targeted Next-Generation Sequencing Panels. J. Mol. Diagn. 2017, 19, 905–920. [Google Scholar] [CrossRef] [PubMed] [Green Version]
- Roca, I.; González-Castro, L.; Fernández, H.; Couce, M.L. Free-access copy-number variant detection tools for targeted next-generation sequencing data. Mutat. Res. 2019, 779, 114–125. [Google Scholar] [CrossRef] [PubMed]
- Wolff, A.C.; Hammond, M.E.; Allison, K.H.; Harvey, B.E.; Mangu, P.B.; Bartlett, J.M.; Bilous, M.; Ellis, I.O.; Fitzgibbons, P.; Hanna, W.; et al. Human Epidermal Growth Factor Receptor 2 Testing in Breast Cancer: American Society of Clinical Oncology/College of American Pathologists Clinical Practice Guideline Focused Update. J. Clin. Oncol. 2018, 36, 2105–2122. [Google Scholar] [CrossRef] [PubMed] [Green Version]
- Pilotto, S.; Carbognin, L.; Karachaliou, N.; Ma, P.C.; Rosell, R.; Tortora, G.; Bria, E. Tracking MET de-addiction in lung cancer: A road towards the oncogenic target. Cancer Treat. Rev. 2017, 60, 1–11. [Google Scholar] [CrossRef] [PubMed]
- Cappuzzo, F.; Finocchiaro, G.; Grossi, F.; Bidoli, P.; Favaretto, A.; Marchetti, A.; Valente, M.L.; Cseh, A.; Clementi, L.; Massey, D.; et al. Phase II study of afatinib, an irreversible ErbB family blocker, in EGFR FISH-positive non-small-cell lung cancer. J. Thorac. Oncol. 2015, 10, 665–672. [Google Scholar] [CrossRef] [Green Version]
- Jiang, T.; Gao, G.; Fan, G.; Li, M.; Zhou, C. FGFR1 amplification in lung squamous cell carcinoma: A systematic review with meta-analysis. Lung Cancer 2015, 87, 1–7. [Google Scholar] [CrossRef]
- Boeva, V.; Popova, T.; Bleakley, K.; Chiche, P.; Cappo, J.; Schleiermacher, G.; Janoueix-Lerosey, I.; Delattre, O.; Barillot, E. Control-FREEC: A tool for assessing copy number and allelic content using next-generation sequencing data. Bioinformatics 2012, 28, 423–425. [Google Scholar] [CrossRef]
- Talevich, E.; Shain, A.H.; Botton, T.; Bastian, B.C. CNVkit: Genome-Wide Copy Number Detection and Visualization from Targeted DNA Sequencing. PLoS Comput. Biol. 2016, 12, e1004873. [Google Scholar] [CrossRef]
- Yan, J.; Wu, X.; Yu, J.; Yu, H.; Xu, T.; Brown, K.M.; Bai, X.; Dai, J.; Ma, M.; Tang, H.; et al. Analysis of NRAS gain in 657 patients with melanoma and evaluation of its sensitivity to a MEK inhibitor. Eur. J. Cancer 2018, 89, 90–101. [Google Scholar] [CrossRef]
- Carvajal, R.D.; Antonescu, C.R.; Wolchok, J.D.; Chapman, P.B.; Roman, R.A.; Teitcher, J.; Panageas, K.S.; Busam, K.J.; Chmielowski, B.; Lutzky, J.; et al. KIT as a therapeutic target in metastatic melanoma. JAMA 2011, 305, 2327–2334. [Google Scholar] [CrossRef] [Green Version]
- Salomonsson, A.; Jönsson, M.; Isaksson, S.; Karlsson, A.; Jönsson, P.; Gaber, A.; Bendahl, P.O.; Johansson, L.; Brunnström, H.; Jirström, K.; et al. Histological specificity of alterations and expression of KIT and KITLG in non-small cell lung carcinoma. Genes Chromosomes Cancer 2013, 52, 1088–1096. [Google Scholar] [CrossRef]
- Kato, S.; Okamura, R.; Adashek, J.J.; Khalid, N.; Lee, S.; Nguyen, V.; Sicklick, J.K.; Kurzrock, R. Targeting G1/S phase cell-cycle genomic alterations and accompanying co-alterations with individualized CDK4/6 inhibitor-based regimens. JCI Insight 2021, 6. [Google Scholar] [CrossRef]
- Zhao, D.; Jiang, M.; Zhang, X.; Hou, H. The role of RICTOR amplification in targeted therapy and drug resistance. Mol. Med. 2020, 26, 20. [Google Scholar] [CrossRef] [Green Version]
- Fois, S.S.; Paliogiannis, P.; Zinellu, A.; Fois, A.G.; Cossu, A.; Palmieri, G. Molecular Epidemiology of the Main Druggable Genetic Alterations in Non-Small Cell Lung Cancer. Int. J. Mol. Sci. 2021, 22, 612. [Google Scholar] [CrossRef]
- Colombino, M.; Paliogiannis, P.; Cossu, A.; Santeufemia, D.A.; Sini, M.C.; Casula, M.; Palomba, G.; Manca, A.; Pisano, M.; Doneddu, V.; et al. EGFR, KRAS, BRAF, ALK, and cMET genetic alterations in 1440 Sardinian patients with lung adenocarcinoma. BMC Pulm. Med. 2019, 19, 209. [Google Scholar] [CrossRef] [Green Version]
- Fiala, O.; Pesek, M.; Finek, J.; Minarik, M.; Benesova, L.; Sorejs, O.; Svaton, M.; Bortlicek, Z.; Kucera, R.; Topolcan, O. Epidermal Growth Factor Receptor Gene Amplification in Patients with Advanced-stage NSCLC. Anticancer Res. 2016, 36, 455–460. [Google Scholar]
- Mohd Yunos, R.I.; Ab Mutalib, N.S.; Tieng, F.Y.; Abu, N.; Jamal, R. Actionable Potentials of Less Frequently Mutated Genes in Colorectal Cancer and Their Roles in Precision Medicine. Biomolecules 2020, 10, 476. [Google Scholar] [CrossRef] [Green Version]
- Sun, Y.; Li, G.; Zhu, W.; He, Q.; Liu, Y.; Chen, X.; Liu, J.; Lin, J.; Han-Zhang, H.; Yang, Z.; et al. A comprehensive pan-cancer study of fibroblast growth factor receptor aberrations in Chinese cancer patients. Ann. Transl. Med. 2020, 8, 1290. [Google Scholar] [CrossRef]
- Oxnard, G.R.; Binder, A.; Janne, P.A. New targetable oncogenes in non-small-cell lung cancer. J. Clin. Oncol. 2013, 31, 1097–1104. [Google Scholar] [CrossRef] [PubMed] [Green Version]
- Helsten, T.; Elkin, S.; Arthur, E.; Tomson, B.N.; Carter, J.; Kurzrock, R. The FGFR Landscape in Cancer: Analysis of 4,853 Tumors by Next-Generation Sequencing. Clin. Cancer Res. 2016, 22, 259–267. [Google Scholar] [CrossRef] [PubMed] [Green Version]
- Lee, M.S.; Cho, H.J.; Hong, J.Y.; Lee, J.; Park, S.H.; Park, J.O.; Park, Y.S.; Lim, H.Y.; Kang, W.K.; Cho, Y.B.; et al. Clinical and molecular distinctions in patients with refractory colon cancer who benefit from regorafenib treatment. Ther. Adv. Med. Oncol. 2020, 12, 1758835920965842. [Google Scholar] [CrossRef] [PubMed]
- Patnaik, A.; Rosen, L.S.; Tolaney, S.M.; Tolcher, A.W.; Goldman, J.W.; Gandhi, L.; Papadopoulos, K.P.; Beeram, M.; Rasco, D.W.; Hilton, J.F.; et al. Efficacy and Safety of Abemaciclib, an Inhibitor of CDK4 and CDK6, for Patients with Breast Cancer, Non-Small Cell Lung Cancer, and Other Solid Tumors. Cancer Discov. 2016, 6, 740–753. [Google Scholar] [CrossRef] [Green Version]
- Cao, J.; Zhu, Z.; Wang, H.; Nichols, T.C.; Lui, G.Y.; Deng, S.; Rejto, P.A.; VanArsdale, T.; Hardwick, J.S.; Weinrich, S.L.; et al. Combining CDK4/6 inhibition with taxanes enhances anti-tumor efficacy by sustained impairment of pRB-E2F pathways in squamous cell lung cancer. Oncogene 2019, 38, 4125–4141. [Google Scholar] [CrossRef] [PubMed]
- Gao, X.; Wei, X.W.; Zheng, M.Y.; Chen, Z.H.; Zhang, X.C.; Zhong, W.Z.; Yang, J.J.; Wu, Y.L.; Zhou, Q. Impact of EGFR amplification on survival of patients with EGFR exon 20 insertion-positive non-small cell lung cancer. J. Thorac. Dis. 2020, 12, 5822–5832. [Google Scholar] [CrossRef] [PubMed]
- Dahabreh, I.J.; Linardou, H.; Kosmidis, P.; Bafaloukos, D.; Murray, S. EGFR gene copy number as a predictive biomarker for patients receiving tyrosine kinase inhibitor treatment: A systematic review and meta-analysis in non-small-cell lung cancer. Ann. Oncol. 2011, 22, 545–552. [Google Scholar] [CrossRef]
- Ruiz-Patiño, A.; Castro, C.D.; Ricaurte, L.M.; Cardona, A.F.; Rojas, L.; Zatarain-Barrón, Z.L.; Wills, B.; Reguart, N.; Carranza, H.; Vargas, C.; et al. EGFR Amplification and Sensitizing Mutations Correlate with Survival in Lung Adenocarcinoma Patients Treated with Erlotinib (MutP-CLICaP). Target Oncol. 2018, 13, 621–629. [Google Scholar] [CrossRef]
- Kohsaka, S.; Nagano, M.; Ueno, T.; Suehara, Y.; Hayashi, T.; Shimada, N.; Takahashi, K.; Suzuki, K.; Takamochi, K.; Takahashi, F.; et al. A method of high-throughput functional evaluation of EGFR gene variants of unknown significance in cancer. Sci. Transl. Med. 2017, 9. [Google Scholar] [CrossRef] [Green Version]
- Corcoran, R.B.; Settleman, J.; Engelman, J.A. Potential therapeutic strategies to overcome acquired resistance to BRAF or MEK inhibitors in BRAF mutant cancers. Oncotarget 2011, 2, 336–346. [Google Scholar] [CrossRef] [Green Version]
- Corcoran, R.B.; Ebi, H.; Turke, A.B.; Coffee, E.M.; Nishino, M.; Cogdill, A.P.; Brown, R.D.; Della Pelle, P.; Dias-Santagata, D.; Hung, K.E.; et al. EGFR-mediated re-activation of MAPK signaling contributes to insensitivity of BRAF mutant colorectal cancers to RAF inhibition with vemurafenib. Cancer Discov. 2012, 2, 227–235. [Google Scholar] [CrossRef] [Green Version]
- Corcoran, R.B.; Dias-Santagata, D.; Bergethon, K.; Iafrate, A.J.; Settleman, J.; Engelman, J.A. BRAF gene amplification can promote acquired resistance to MEK inhibitors in cancer cells harboring the BRAF V600E mutation. Sci. Signal. 2010, 3, ra84. [Google Scholar] [CrossRef] [Green Version]


Publisher’s Note: MDPI stays neutral with regard to jurisdictional claims in published maps and institutional affiliations. |
© 2021 by the authors. Licensee MDPI, Basel, Switzerland. This article is an open access article distributed under the terms and conditions of the Creative Commons Attribution (CC BY) license (https://creativecommons.org/licenses/by/4.0/).
Share and Cite
Vives-Usano, M.; García Pelaez, B.; Román Lladó, R.; Garzón Ibañez, M.; Aldeguer, E.; Rodriguez, S.; Aguilar, A.; Pons, F.; Viteri, S.; Cabrera, C.; et al. Analysis of Copy Number Variations in Solid Tumors Using a Next Generation Sequencing Custom Panel. J. Mol. Pathol. 2021, 2, 123-134. https://0-doi-org.brum.beds.ac.uk/10.3390/jmp2020013
Vives-Usano M, García Pelaez B, Román Lladó R, Garzón Ibañez M, Aldeguer E, Rodriguez S, Aguilar A, Pons F, Viteri S, Cabrera C, et al. Analysis of Copy Number Variations in Solid Tumors Using a Next Generation Sequencing Custom Panel. Journal of Molecular Pathology. 2021; 2(2):123-134. https://0-doi-org.brum.beds.ac.uk/10.3390/jmp2020013
Chicago/Turabian StyleVives-Usano, Marta, Beatriz García Pelaez, Ruth Román Lladó, Mónica Garzón Ibañez, Erika Aldeguer, Sonia Rodriguez, Andrés Aguilar, Francesc Pons, Santiago Viteri, Carlos Cabrera, and et al. 2021. "Analysis of Copy Number Variations in Solid Tumors Using a Next Generation Sequencing Custom Panel" Journal of Molecular Pathology 2, no. 2: 123-134. https://0-doi-org.brum.beds.ac.uk/10.3390/jmp2020013