Mental Health of the General Population during the 2019 Coronavirus Disease (COVID-19) Pandemic: A Tale of Two Developing Countries

 , , , and
Abstract
:1. Introduction
2. Methods
2.1. Study Design and Participants
2.2. Procedure
2.3. Outcomes
2.4. Statistical Analysis
3. Results
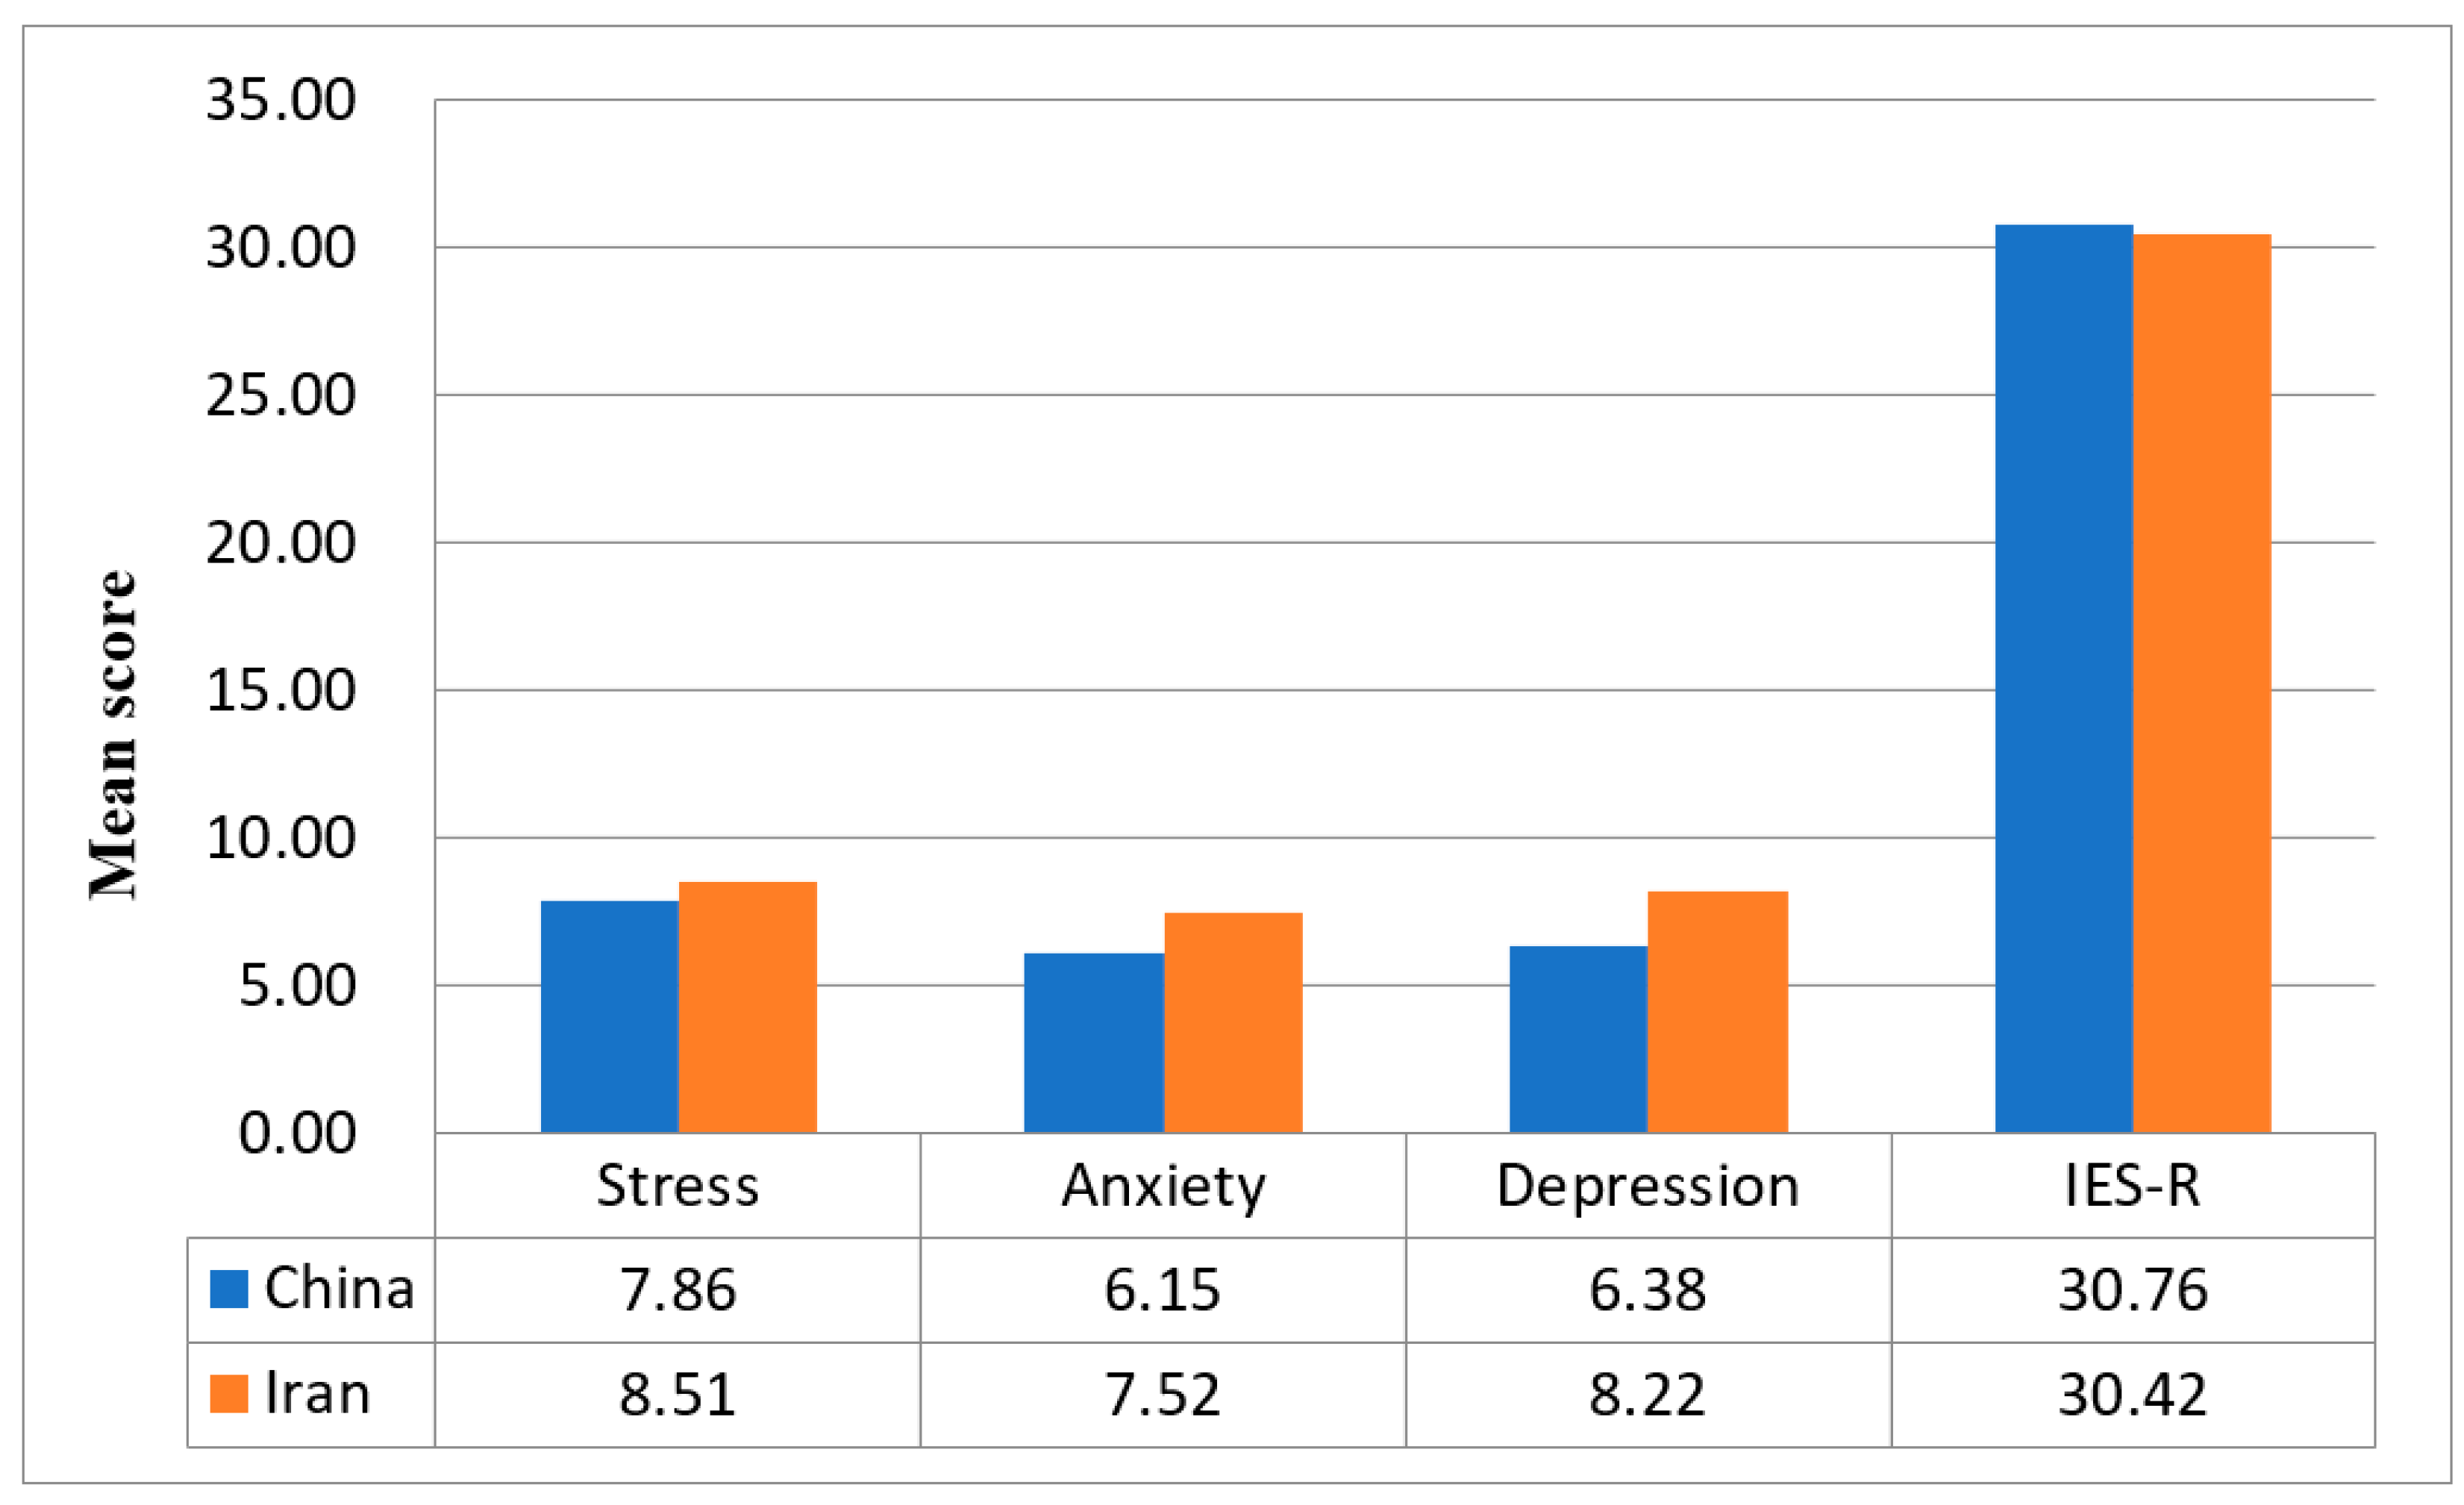
3.1. Comparison between the Iranian and Chinese Respondents
3.2. Comparison between Socio-Demographic Characteristics and Mental Health in Iranian and Chinese
3.3. The Relationship between Socio-Demographic Characteristics and Mental Health in Iranian and Chinese
3.4. Comparison between Physical Health Parameters and Mental Health Status in Chinese and Iranian
3.5. The Relationship between Physical Health Parameters and Mental Health Status in Chinese and Iranian
3.6. Comparison between Knowledge and Concerns about COVID-19 and Mental Health in Chinese and Iranian
3.7. The Relationship between Knowledge and Concerns about COVID-19 and Mental Health in Chinese and Iranian
3.8. Comparison between Precautionary Measures and Mental Health in Chinese and Iranian
3.9. The Relationship between Precautionary Measures and Mental Health in Chinese and Iranian
3.10. Comparison between COVID-19 Information and Mental Health in Chinese and Iranian
3.11. The Relationship between COVID-19 Information and Mental Health in Chinese and Iranian
4. Discussion
5. Strengths and Limitations
6. Conclusions
Supplementary Materials
Author Contributions
Funding
Institutional Review Board Statement
Informed Consent Statement
Data Availability Statement
Conflicts of Interest
References
- Mahase, E. Covid-19: WHO declares pandemic because of “alarming levels” of spread, severity, and inaction. BMJ 2020, 368, m1036. [Google Scholar] [CrossRef] [Green Version]
- Worldmeters. COVID-19 Coronavirus Pandemic. 2020. Available online: https://www.worldometers.info/coronavirus/ (accessed on 4 December 2020).
- Salo, J. China Orders 1400 Military Doctors, Nurses to Treat Coronavirus. 2020. Available online: https://nypost.com/2020/02/02/china-orders-14000-military-doctors-nurses-to-treat-coronavirus/ (accessed on 22 March 2020).
- Zhuang, Z.; Zhao, S.; Lin, Q.; Cao, P.; Lou, Y.; Yang, L.; He, D. Preliminary estimation of the novel coronavirus disease (COVID-19) cases in Iran: A modelling analysis based on overseas cases and air travel data. Int. J. Infect. Dis. 2020, 94, 29–31. [Google Scholar] [CrossRef] [PubMed]
- Zheng, W. Mental health and a novel coronavirus (2019-nCoV) in China. J. Affect. Disord. 2020, 269, 201–202. [Google Scholar] [CrossRef]
- Ho, C.S.; Chee, C.Y.; Ho, R.C. Mental Health Strategies to Combat the Psychological Impact of COVID-19 Beyond Paranoia and Panic. Ann. Acad. Med. Singap. 2020, 49, 1–3. [Google Scholar]
- World Bank. World Bank National Accounts Data, and OECD National Accounts Data Files. 2020. Available online: https://data.worldbank.org/indicator/NY.GNP.PCAP.CD (accessed on 16 April 2020).
- Gorji, A. Sanctions against Iran: The Impact on Health Services. Iran. J. Public Health 2014, 43, 381–382. [Google Scholar]
- Qiu, J.; Shen, B.; Zhao, M.; Wang, Z.; Xie, B.; Xu, Y. A nationwide survey of psychological distress among Chinese people in the COVID-19 epidemic: Implications and policy recommendations. Gen. Psychiatry 2020, 33, e100213. [Google Scholar] [CrossRef] [Green Version]
- Wang, Y.; Di, Y.; Ye, J.; Wei, W. Study on the public psychological states and its related factors during the outbreak of coronavirus disease 2019 (COVID-19) in some regions of China. Psychol. Health Med. 2020, 26, 13–22. [Google Scholar] [CrossRef] [PubMed] [Green Version]
- Bo, H.X.; Li, W.; Yang, Y.; Wang, Y.; Zhang, Q.; Cheung, T.; Wu, X.; Xiang, Y.T. Posttraumatic stress symptoms and attitude toward crisis mental health services among clinically stable patients with COVID-19 in China. Psychol. Med. 2020, 1–7. [Google Scholar] [CrossRef] [PubMed] [Green Version]
- Ahorsu, D.K.; Lin, C.Y.; Imani, V.; Saffari, M.; Griffiths, M.D.; Pakpour, A.H. The Fear of COVID-19 Scale: Development and Initial Validation. Int. J. Ment. Health Addict. 2020, 1–9. [Google Scholar] [CrossRef] [PubMed] [Green Version]
- Jahanshahi, A.A.; Dinani, M.M.; Madavani, A.N.; Li, J.; Zhang, S.X. The distress of Iranian adults during the Covid-19 pandemic—More distressed than the Chinese and with different predictors. Brain Behav. Immun. 2020, 87, 124–125. [Google Scholar] [CrossRef] [PubMed]
- Wang, C.; Pan, R.; Wan, X.; Tan, Y.; Xu, L.; Ho, C.S.; Ho, R.C. Immediate Psychological Responses and Associated Factors during the Initial Stage of the 2019 Coronavirus Disease (COVID-19) Epidemic among the General Population in China. Int. J. Environ. Res. Public Health 2020, 17, 1729. [Google Scholar] [CrossRef] [PubMed] [Green Version]
- Wang, C.; Pan, R.; Wan, X.; Tan, Y.; Xu, L.; McIntyre, R.S.; Choo, F.N.; Tran, B.; Ho, R.; Sharma, V.K.; et al. A longitudinal study on the mental health of general population during the COVID-19 epidemic in China. Brain Behav. Immun. 2020, 87, 40–48. [Google Scholar] [CrossRef]
- Zhang, M.W.; Ho, C.S.; Fang, P.; Lu, Y.; Ho, R.C. Usage of social media and smartphone application in assessment of physical and psychological well-being of individuals in times of a major air pollution crisis. JMIR mHealth uHealth 2014, 2, e16. [Google Scholar] [CrossRef] [Green Version]
- Chew, N.W.; Lee, G.K.; Tan, B.Y.; Jing, M.; Goh, Y.; Ngiam, N.J.; Yeo, L.L.; Ahmad, A.; Khan, F.A.; Shanmugam, G.N.; et al. A multinational, multicentre study on the psychological outcomes and associated physical symptoms amongst healthcare workers during COVID-19 outbreak. Brain Behav. Immun. 2020, 88, 559–565. [Google Scholar] [CrossRef]
- Zhang, M.W.B.; Ho, C.S.H.; Fang, P.; Lu, Y.; Ho, R.C.M. Methodology of developing a smartphone application for crisis research and its clinical application. Technol. Health Care 2014, 22, 547–559. [Google Scholar] [CrossRef]
- Le, T.A.; Le, M.Q.; Dang, A.D.; Dang, A.K.; Nguyen, C.T.; Pham, H.Q.; Vu, G.T.; Hoang, C.L.; Tran, T.T.; Vuong, Q.H.; et al. Multi-level predictors of psychological problems among methadone maintenance treatment patients in difference types of settings in Vietnam. Subst. Abus. Treat. Prev. Policy 2019, 14, 1–10. [Google Scholar] [CrossRef]
- Creamer, M.; Bell, R.; Failla, S. Psychometric properties of the Impact of Event Scale—Revised. Behav. Res. Ther. 2003, 41, 1489–1496. [Google Scholar] [CrossRef]
- Lee, S.M.; Kang, W.S.; Cho, A.-R.; Kim, T.; Park, J.K. Psychological impact of the 2015 MERS outbreak on hospital workers and quarantined hemodialysis patients. Compr. Psychiatry 2018, 87, 123–127. [Google Scholar] [CrossRef] [PubMed]
- Ho, R.C.; Zhang, M.W.; Ho, C.S.; Pan, F.; Lu, Y.; Sharma, V.K. Impact of 2013 south Asian haze crisis: Study of physical and psychological symptoms and perceived dangerousness of pollution level. BMC Psychiatry 2014, 14, 81. [Google Scholar] [CrossRef] [PubMed] [Green Version]
- Midorikawa, H.; Aiba, M.; Lebowitz, A.; Taguchi, T.; Shiratori, Y.; Ogawa, T.; Takahashi, A.; Takahashi, S.; Nemoto, K.; Arai, T.; et al. Confirming validity of The Fear of COVID-19 Scale in Japanese with a nationwide large-scale sample. PLoS ONE 2021, 16, e0246840. [Google Scholar] [CrossRef]
- Touré, A.A.; Camara, L.M.; Magassouba, A.S.; Doumbouya, A.; Camara, G.; Camara, A.Y.; Loua, G.; Cissé, D.; Sylla, M.; Bereté, A.O.; et al. Psychosocial impacts of COVID-19 in the Guinean population. An online cross-sectional survey. PLoS ONE 2021, 16, e0245751. [Google Scholar]
- Ide, K.; Asami, T.; Suda, A.; Yoshimi, A.; Fujita, J.; Nomoto, M.; Roppongi, T.; Hino, K.; Takahashi, Y.; Watanabe, K.; et al. The psychological effects of COVID-19 on hospital workers at the beginning of the outbreak with a large disease cluster on the Diamond Princess cruise ship. PLoS ONE 2021, 16, e0245294. [Google Scholar] [CrossRef]
- Ho, C.S.H.; Tan, E.L.Y.; Ho, R.C.M.; Chiu, M.Y.L. Relationship of Anxiety and Depression with Respiratory Symptoms: Comparison between Depressed and Non-Depressed Smokers in Singapore. Int. J. Environ. Res. Public Health 2019, 16, 163. [Google Scholar] [CrossRef] [Green Version]
- Quek, T.C.; Ho, C.S.; Choo, C.C.; Nguyen, L.H.; Tran, B.X.; Ho, R.C. Misophonia in Singaporean Psychiatric Patients: A Cross-Sectional Study. Int. J. Environ. Res. Public Health 2018, 15, 1410. [Google Scholar] [CrossRef] [Green Version]
- Jowkar, Z.; Masoumi, M.; Mahmoodian, H. Psychological Stress and Stressors Among Clinical Dental Students at Shiraz School of Dentistry, Iran. Adv. Med. Educ. Pract. 2020, 11, 113–120. [Google Scholar] [CrossRef] [PubMed] [Green Version]
- Hao, F.; Tan, W.; Jiang, L.; Zhang, L.; Zhao, X.; Zou, Y.; Hu, Y.; Luo, X.; Jiang, X.; McIntyre, R.S.; et al. Do psychiatric patients experience more psychiatric symptoms during COVID-19 pandemic and lockdown? A Case-Control Study with Service and Research Implications for Immunopsychiatry. Brain Behav. Immun. 2020, 87, 100–106. [Google Scholar] [CrossRef]
- Tan, B.Y.; Chew, N.W.; Lee, G.K.; Jing, M.; Goh, Y.; Yeo, L.L.; Zhang, K.; Chin, H.K.; Ahmad, A.; Khan, F.A.; et al. Psychological Impact of the COVID-19 Pandemic on Health Care Workers in Singapore. Ann. Intern. Med. 2020, 173, 317–320. [Google Scholar] [CrossRef] [Green Version]
- Brooks, S.K.; Webster, R.K.; Smith, L.E.; Woodland, L.; Wessely, S.; Greenberg, N.; Rubin, G.J. The psychological impact of quarantine and how to reduce it: Rapid review of the evidence. Lancet 2020, 395, 912–920. [Google Scholar] [CrossRef] [Green Version]
- Baasher, T.A. Islam and mental health. East. Mediterr. Health J. 2001, 7, 372–376. [Google Scholar]
- WHO. WHO Director-General’s Opening Remarks at the Media Briefing on COVID-19—11 March 2020. 2020. Available online: https://www.who.int/dg/speeches/detail/who-director-general-s-opening-remarks-at-the-media-briefing-on-covid-19---11-march-2020 (accessed on 22 March 2020).
- Sim, S.W.; Moey, K.S.; Tan, N.C. The use of facemasks to prevent respiratory infection: A literature review in the context of the Health Belief Model. Singap. Med. J. 2014, 55, 160–167. [Google Scholar] [CrossRef] [Green Version]
- Motevalli, G. Iran Says U.S. Sanctions Blocked Delivery of U.K.-Made Masks. 2020. Available online: https://www.bloomberg.com/news/articles/2020-03-21/iran-says-u-s-sanctions-blocked-delivery-of-u-k-made-masks (accessed on 12 April 2020).
- Sardarizadeh, S. Coronavirus: Misinformation and False Medical Advice Spreads in Iran. 2020. Available online: https://www.bbc.com/news/world-middle-east-51677530 (accessed on 12 April 2020).


| Demographic Variables | Iran | China | ||||||||||||||
|---|---|---|---|---|---|---|---|---|---|---|---|---|---|---|---|---|
| Impact of Event | Stress | Anxiety | Depression | Impact of Event | Stress | Anxiety | Depression | |||||||||
| B | t | B | t | B | t | B | t | B | t | B | t | B | t | B | t | |
| Gender | ||||||||||||||||
| Male | −0.32 | −2.60 | −0.15 | −1.41 | −0.23 | −1.60 | −0.16 | −1.26 | −0.26 | −2.61 ** | 0.08 | 1.38 | 0.18 | 1.90 | 0.22 | 2.89 ** |
| Female | Reference | Reference | ||||||||||||||
| Age range (years) | ||||||||||||||||
| 12–21.4 | −0.31 | −1.25 | 0.17 | 0.82 | 0.09 | 0.30 | 0.11 | 0.41 | 0.77 | 2.28 | −0.03 | −0.16 | 0.29 | 0.92 | −0.02 | −0.07 |
| 21.4–30.8 | −0.10 | −0.41 | 0.29 | 1.39 | 0.11 | 0.38 | 0.19 | 0.72 | 0.59 | 1.75 | 0.02 | 0.08 | 0.36 | 1.17 | 0.09 | 0.36 |
| 30.8–40.2 | 0.01 | 0.04 | 0.25 | 1.20 | 0.10 | 0.33 | 0.17 | 0.67 | 0.63 | 1.62 | −0.03 | −0.15 | 0.29 | 0.80 | 0.03 | 0.12 |
| 40.2–49.6 | −0.10 | −0.36 | 0.10 | 0.43 | <0.001 | <0.001 | 0.01 | 0.02 | 0.26 | 0.70 | −0.15 | −0.70 | −0.02 | −0.05 | −0.18 | −0.63 |
| >49.6 | Reference | Reference | ||||||||||||||
| Status as a parent | ||||||||||||||||
| Has a child 16 years or younger | 0.20 | 1.61 | −0.20 | −1.96 | −0.15 | −1.04 | −0.21 | −1.68 | 0.12 | 0.94 | 0.03 | 0.34 | 0.11 | 0.87 | 0.09 | 0.88 |
| Has a child older than 16 years | 0.37 | 2.37 | 0.03 | 0.26 | 0.09 | 0.49 | 0.04 | 0.26 | 0.10 | 0.96 | 0.003 | 0.06 | −0.03 | −0.34 | −0.02 | −0.29 |
| No children | Reference | Reference | ||||||||||||||
| Household size | ||||||||||||||||
| 6 people or more | −0.21 | −0.98 | −0.15 | −0.83 | −0.40 | −1.56 | −0.31 | −1.40 | 1.44 | 2.20 | 0.50 | 1.32 | 0.84 | 1.40 | 0.12 | 0.24 |
| 3–5 people | −0.09 | −0.56 | −0.17 | −1.23 | −0.28 | −1.49 | −0.26 | −1.56 | 1.32 | 2.04 | 0.45 | 1.19 | 0.77 | 1.29 | 0.06 | 0.13 |
| 2 people | 0.02 | 0.08 | −0.18 | −0.95 | −0.41 | −1.52 | −0.34 | −1.47 | 1.19 | 1.76 | 0.44 | 1.12 | 0.61 | 0.99 | −0.16 | −0.31 |
| Stay alone | Reference | Reference | ||||||||||||||
| Education Level | ||||||||||||||||
| Primary school | 1.50 | 1.17 | <0.001 | <0.001 | <0.001 | <0.001 | <0.001 | <0.001 | −0.58 | −0.70 | 0.50 | 1.04 | 1.00 | 1.31 | 1.00 | 1.59 |
| Secondary school | 0.83 | 0.88 | 0.67 | 0.83 | 1.38 | 1.24 | 1.00 | 1.02 | 0.51 | 0.94 | 0.49 | 1.54 | 0.84 | 1.68 | 0.63 | 1.54 |
| University–Bachelor | 0.92 | 1.00 | 0.58 | 0.75 | 1.09 | 1.02 | 0.81 | 0.86 | 0.79 | 1.51 | 0.44 | 1.43 | 0.73 | 1.51 | 0.53 | 1.33 |
| University–Master | 0.85 | 0.93 | 0.69 | 0.90 | 1.18 | 1.09 | 0.95 | 1.01 | 0.75 | 1.38 | 0.52 | 1.67 | 0.98 | 1.99 | 0.69 | 1.69 |
| University–Doctorate | 0.61 | 0.66 | 0.39 | 0.50 | 0.72 | 0.66 | 0.54 | 0.57 | 0.17 | 0.25 | 0.33 | 0.85 | 0.33 | 0.54 | 0.56 | 1.08 |
| None | Reference | Reference | ||||||||||||||
| Employment status | ||||||||||||||||
| Student | −0.09 | −0.71 | −0.05 | −0.46 | 0.03 | 0.21 | −0.05 | −0.42 | −0.63 | −0.85 | −0.12 | −0.27 | −0.75 | −1.10 | −0.19 | −0.34 |
| Unemployed | 0.17 | 0.69 | 0.11 | 0.53 | 0.02 | 0.06 | 0.03 | 0.13 | 0.06 | 0.30 | 0.10 | 0.91 | 0.29 | 1.67 | 0.32 | 2.25 |
| Housewife | 0.17 | 0.79 | −0.05 | −0.29 | 0.12 | 0.47 | −0.10 | −0.45 | −0.52 | −1.99 | −0.03 | −0.17 | 0.10 | 0.40 | 0.10 | 0.47 |
| Retired | 0.37 | 0.98 | 0.07 | 0.21 | 0.54 | 1.19 | 0.16 | 0.41 | −0.16 | −1.64 | −0.01 | −0.20 | −0.01 | −0.10 | 0.06 | 0.74 |
| Employed | Reference | Reference | ||||||||||||||
| Symptoms and Physical Health Status | Iran | China | ||||||||||||||
|---|---|---|---|---|---|---|---|---|---|---|---|---|---|---|---|---|
| Impact of Event | Stress | Anxiety | Depression | Impact of Event | Stress | Anxiety | Depression | |||||||||
| B | t | B | t | B | t | B | t | B | t | B | t | B | t | B | t | |
| Persistent Fever | ||||||||||||||||
| Yes | 0.32 | 1.23 | 0.27 | 1.21 | 0.42 | 1.35 | 0.45 | 1.65 | 1.43 | 1.11 | 3.55 | 4.81 *** | 3.24 | 2.75 ** | 3.44 | 3.56 *** |
| No | Reference | Reference | ||||||||||||||
| Chills | ||||||||||||||||
| Yes | 0.28 | 1.14 | 0.23 | 1.12 | 0.30 | 1.06 | 0.30 | 1.22 | 0.69 | 1.84 | 0.90 | 4.16 *** | 0.83 | 2.42 | 0.87 | 3.08 ** |
| No | Reference | Reference | ||||||||||||||
| Headaches | ||||||||||||||||
| Yes | 0.41 | 3.55 *** | 0.49 | 5.13 *** | 0.76 | 5.73 *** | 0.64 | 5.48 *** | 0.59 | 3.02 ** | 0.46 | 4.07 *** | 0.76 | 4.26 *** | 0.51 | 3.45 ** |
| No | Reference | Reference | ||||||||||||||
| Myalgia | ||||||||||||||||
| Yes | 0.19 | 1.21 | 0.56 | 4.41 *** | 0.63 | 3.52 *** | 0.60 | 3.87 *** | 0.50 | 2.83 ** | 0.42 | 4.13 *** | 0.59 | 3.67 *** | 0.58 | 4.42 *** |
| No | Reference | Reference | ||||||||||||||
| Cough | ||||||||||||||||
| Yes | −0.03 | −0.22 | 0.17 | 1.42 | 0.15 | 0.93 | 0.16 | 1.15 | 0.48 | 1.95 | 0.61 | 4.25 *** | 0.69 | 3.03 ** | 0.68 | 3.64 *** |
| No | Reference | Reference | ||||||||||||||
| Difficulty Breathing | ||||||||||||||||
| Yes | 0.11 | 0.55 | 0.23 | 1.44 | 0.29 | 1.29 | 0.25 | 1.26 | 0.77 | 1.46 | 1.06 | 3.47 ** | 1.08 | 2.23 | 1.45 | 3.66 *** |
| No | Reference | Reference | ||||||||||||||
| Dizziness | ||||||||||||||||
| Yes | 0.41 | 2.27 | 0.29 | 1.90 | 0.36 | 1.70 | 0.31 | 1.65 | 0.98 | 4.20 *** | 0.80 | 6.00 *** | 0.95 | 4.42 *** | 0.66 | 3.72 *** |
| No | Reference | Reference | ||||||||||||||
| Coryza | ||||||||||||||||
| Yes | −0.03 | −0.17 | 0.20 | 1.48 | 0.23 | 1.24 | 0.19 | 1.18 | 0.66 | 3.40 ** | 0.33 | 2.90 ** | 0.52 | 2.94 ** | 0.53 | 3.64 *** |
| No | Reference | Reference | ||||||||||||||
| Sore Throat | ||||||||||||||||
| Yes | 0.22 | 1.55 | 0.25 | 2.14 | 0.37 | 2.28 | 0.29 | 2.01 | 0.35 | 1.50 | 0.60 | 4.53 *** | 0.80 | 3.77 *** | 0.75 | 4.31 *** |
| No | Reference | Reference | ||||||||||||||
| Nausea, Vomiting & Diarrhea | ||||||||||||||||
| Yes | 0.50 | 2.70 ** | 0.67 | 4.31 *** | 0.89 | 4.08 *** | 0.80 | 4.21 *** | 0.72 | 1.48 | 1.27 | 4.54 *** | 1.39 | 3.11 ** | 1.31 | 3.56 *** |
| No | Reference | Reference | ||||||||||||||
| Medical Consultation in the past 2 weeks | ||||||||||||||||
| Yes | 0.19 | 1.04 | 0.25 | 1.61 | 0.22 | 1.02 | 0.29 | 1.51 | 0.44 | 1.21 | 0.25 | 1.17 | 0.39 | 1.20 | 0.29 | 1.07 |
| No | Reference | Reference | ||||||||||||||
| Current self-rating of health status | ||||||||||||||||
| Very poor | 0.27 | 0.30 | 1.60 | 2.15 | 1.18 | 1.14 | 1.40 | 1.54 | −0.44 | −0.91 | 0.64 | 2.29 | 0.82 | 1.86 | 0.73 | 2.01 |
| Poor | 0.11 | 0.28 | 0.60 | 1.94 | 0.59 | 1.39 | 0.56 | 1.50 | 1.56 | 3.23 **′ | 1.21 | 4.34 ***′ | 1.68 | 3.81 ***′ | 1.30 | 3.59 ***′ |
| Fair | 0.56 | 4.50 ***′ | 0.64 | 6.17 ***′ | 0.96 | 6.66 ***′ | 0.77 | 6.12 ***′ | 0.37 | 3.99 ***′ | 0.23 | 4.21 ***′ | 0.42 | 4.94 ***′ | 0.39 | 5.64 ***′ |
| Good or Very good | Reference | Reference | ||||||||||||||
| Medical Insurance | ||||||||||||||||
| Yes | 0.04 | 0.21 | −0.11 | −0.69 | −0.21 | −0.97 | −0.15 | −0.79 | 0.02 | 0.13 | −0.17 | −1.89 | −0.34 | −2.43 | −0.21 | −1.79 |
| No | Reference | Reference | ||||||||||||||
| Chronic Illness | ||||||||||||||||
| Yes | 0.64 | 3.34 ** | 0.32 | 1.95 | 0.48 | 2.11 | 0.36 | 1.82 | 0.45 | 2.25 | 0.24 | 2.02 | 0.25 | 1.34 | 0.27 | 1.76 |
| No | Reference | Reference | ||||||||||||||
| Direct contact with patients with a confirmed diagnosis of COVID-19 | ||||||||||||||||
| Yes | −0.13 | −0.27 | 0.17 | 0.44 | 0.30 | 0.55 | 0.19 | 0.40 | −1.57 | −1.73 | 0.05 | 0.09 | 0.24 | 0.28 | 0.44 | 0.64 |
| No | Reference | Reference | ||||||||||||||
| Indirect contact with patients with a confirmed diagnosis of COVID-19 | ||||||||||||||||
| Yes | 0.37 | 0.10 | 0.29 | 1.02 | 0.40 | 1.00 | 0.40 | 1.15 | −0.24 | −0.45 | 0.05 | 0.16 | 0.07 | 0.14 | 0.11 | 0.27 |
| No | Reference | Reference | ||||||||||||||
| Knowledge and Concerns Related to COVID-19 | Iran | China | ||||||||||||||
|---|---|---|---|---|---|---|---|---|---|---|---|---|---|---|---|---|
| Impact of Event | Stress | Anxiety | Depression | Impact of Event | Stress | Anxiety | Depression | |||||||||
| B | t | B | t | B | t | B | t | B | t | B | t | B | t | B | t | |
| Route of transmission | ||||||||||||||||
| Droplets | ||||||||||||||||
| Agree | −0.12 | −0.94 | 0.03 | 0.24 | 0.01 | 0.05 | −0.01 | −0.09 | 0.07 | 0.45 | −0.11 | −1.36 | −0.12 | −0.91 | −0.15 | −1.33 |
| Disagree | 0.07 | 0.23 | −0.26 | −0.97 | −0.46 | −1.25 | −0.42 | −1.29 | 0.13 | 0.30 | 0.46 | 1.91 | 0.68 | 1.81 | 0.50 | 1.61 |
| Do not know | Reference | Reference | ||||||||||||||
| Contact via contaminated objects | ||||||||||||||||
| Agree | −0.32 | −0.90 | −0.19 | −0.62 | −0.46 | −1.09 | −0.35 | −0.93 | −0.06 | −0.54 | −0.08 | −1.17 | −0.05 | −0.47 | −0.10 | −1.24 |
| Disagree | −1.19 | −1.22 | −0.77 | −0.93 | −1.54 | −1.34 | −1.15 | −1.15 | 0.13 | 0.66 | 0.003 | 0.03 | −0.16 | −0.90 | −0.16 | −1.05 |
| Do not know | Reference | Reference | ||||||||||||||
| Airborne | ||||||||||||||||
| Agree | −0.06 | −0.48 | 0.10 | 0.88 | 0.06 | 0.37 | 0.06 | 0.42 | 0.06 | 0.55 | 0.04 | 0.63 | 0.03 | 0.29 | −0.03 | −0.30 |
| Disagree | −0.26 | −1.61 | −0.07 | −0.47 | −0.14 | −0.71 | −0.14 | −0.83 | 0.02 | 0.11 | −0.05 | −0.57 | −0.04 | −0.32 | −0.08 | −0.75 |
| Do not know | Reference | Reference | ||||||||||||||
| Level of confidence in own doctor’s ability to diagnose or recognize COVID-19 | ||||||||||||||||
| Very confident | −0.35 | −1.97 | −0.16 | −1.08 | −0.19 | −0.90 | −0.13 | −0.73 | 0.12 | 0.35 | −0.33 | −1.67 | −0.42 | −1.37 | −0.85 | −3.34 **′ |
| Somewhat confident | <0.001 | −0.001 | 0.03 | 0.26 | 0.18 | 1.02 | 0.15 | 1.02 | 0.42 | 1.24 | −0.25 | −1.27 | −0.34 | −1.08 | −0.72 | −2.82 **′ |
| Not very confident | 0.45 | 2.15 | 1.01 | 5.91 ***′ | 1.41 | 5.88 ***′ | 1.33 | 6.38 ***′ | 0.48 | 1.10 | 0.03 | 0.11 | 0.11 | 0.26 | −0.43 | −1.31 |
| Not at all confident | −0.06 | −0.24 | 0.61 | 2.92 *′ | 0.61 | 2.08 | 0.69 | 2.72 *′ | −0.33 | −0.35 | −0.23 | −0.42 | 0.37 | 0.41 | −0.33 | −0.46 |
| Do not know | Reference | Reference | ||||||||||||||
| Likelihood of contracting COVID-19 during the pandemic | ||||||||||||||||
| Very likely | 0.90 | 3.71 ***′ | 0.62 | 3.00 *′ | 1.04 | 3.69 ***′ | 0.82 | 3.30 **′ | −0.34 | −1.75 | −0.06 | −0.57 | 0.07 | 0.38 | −0.06 | −0.42 |
| Somewhat likely | 0.04 | 0.33 | 0.09 | 0.76 | 0.16 | 1.03 | 0.13 | 0.97 | −0.03 | −0.23 | −0.14 | −1.58 | −0.03 | −0.24 | −0.14 | −1.25 |
| Not very likely | −0.14 | −0.89 | −0.15 | −1.14 | −0.23 | −1.24 | −0.18 | −1.13 | 0.05 | 0.34 | −0.15 | −1.77 | −0.08 | −0.57 | −0.15 | −1.36 |
| Not likely at all | −0.25 | −1.11 | −0.32 | −1.68 | −0.62 | −2.39 | −0.49 | −2.12 | −0.12 | −0.65 | −0.19 | −1.90 | −0.15 | −0.92 | −0.31 | −2.33 |
| Do not know | Reference | Reference | ||||||||||||||
| Likelihood of surviving if infected with COVID-19 | ||||||||||||||||
| Very likely | −0.59 | −4.19 ***′ | −0.19 | −1.63 | −0.43 | −2.60 *′ | −0.31 | −2.13 | −0.32 | −2.27 | −0.14 | −1.71 | −0.18 | −1.37 | −0.23 | −2.14 |
| Somewhat likely | −0.04 | −0.30 | 0.09 | 0.79 | 0.05 | 0.33 | 0.07 | 0.50 | 0.02 | 0.12 | −0.09 | −1.18 | −0.09 | −0.83 | −0.19 | −2.00 |
| Not very likely | 0.20 | 0.67 | 0.70 | 2.79 *′ | 0.62 | 1.75 | 0.73 | 2.38 | −0.01 | −0.06 | 0.06 | 0.52 | 0.39 | 2.20 | 0.21 | 1.45 |
| Not likely at all | 0.25 | 0.73 | 1.25 | 4.38 **′ | 1.33 | 3.33 **′ | 1.31 | 3.77 **′ | −0.24 | −0.69 | 0.08 | 0.39 | 0.52 | 1.62 | 0.18 | 0.67 |
| Do not know | Reference | Reference | ||||||||||||||
| Satisfaction with the amount of COVID-19 information | ||||||||||||||||
| Very satisfied | −0.16 | −0.72 | −0.34 | −1.91 | −0.53 | −2.11 | −0.40 | −1.83 | −0.07 | −0.25 | −0.60 | −3.92 ***′ | −0.69 | −2.87 *′ | −0.72 | −3.63 ***′ |
| Somewhat satisfied | 0.07 | 0.39 | −0.13 | −0.85 | −0.06 | −0.31 | −0.11 | −0.60 | 0.36 | 1.40 | −0.48 | −3.21 **′ | −0.60 | −2.56 *′ | −0.61 | −3.13 **′ |
| Not very satisfied | 0.31 | 1.41 | −0.01 | −0.06 | 0.17 | 0.67 | 0.07 | 0.32 | 0.12 | 0.38 | −0.30 | −1.66 | −0.41 | −1.43 | −0.31 | −1.30 |
| Not satisfied at all | 0.87 | 3.47 *′ | 0.77 | 3.68 ***′ | 0.86 | 2.92*′ | 0.83 | 3.24 *′ | 0.80 | 2.13 | 0.08 | 0.36 | 0.18 | 0.52 | −0.15 | −0.54 |
| Do not know | Reference | Reference | ||||||||||||||
| Precautionary Measures | Iran | China | ||||||||||||||
|---|---|---|---|---|---|---|---|---|---|---|---|---|---|---|---|---|
| Impact of Event | Stress | Anxiety | Depression | Impact of Event | Stress | Anxiety | Depression | |||||||||
| B | t | B | T | B | t | B | t | B | t | B | t | B | t | B | t | |
| Covering mouth when coughing and sneezing | ||||||||||||||||
| Always | 0.07 | 0.19 | 0.20 | 0.67 | 0.37 | 0.90 | 0.27 | 0.75 | −0.37 | −2.52 *′ | −0.35 | −4.11 ***′ | −0.51 | −3.81 ***′ | −0.42 | −3.84 ***′ |
| Most of the time | 0.27 | 0.74 | 0.33 | 1.06 | 0.72 | 1.68 | 0.47 | 1.26 | −0.10 | −0.60 | −0.37 | −3.93 ***′ | −0.47 | −3.14 **′ | −0.31 | −2.48 *′ |
| Sometimes | −0.19 | −0.47 | 0.32 | 0.94 | 0.53 | 1.14 | 0.45 | 1.10 | 0.03 | 0.12 | −0.24 | −1.98 | −0.47 | −2.42 *′ | −0.26 | −1.61 |
| Never | Reference | Reference | ||||||||||||||
| Avoidance of sharing utensils | ||||||||||||||||
| Always | −0.07 | −0.33 | −0.12 | −0.65 | −0.21 | −0.81 | −0.12 | −0.53 | −0.48 | −4.28 ***′ | −0.21 | −3.09 **′ | −0.29 | −2.72 *′ | −0.28 | −3.18 **′ |
| Most of the time | 0.18 | 0.76 | −0.17 | −0.85 | −0.05 | −0.19 | −0.15 | −0.61 | −0.01 | −0.07 | −0.20 | −2.44 *′ | −0.18 | −1.37 | −0.19 | −1.78 |
| Sometimes | 0.10 | 0.40 | 0.13 | 0.64 | 0.35 | 1.21 | 0.27 | 1.06 | 0.05 | 0.36 | −0.17 | −1.99 | −0.17 | −1.29 | −0.24 | −2.20 *′ |
| Never | Reference | Reference | ||||||||||||||
| Hand hygiene practice | ||||||||||||||||
| Always | −1.09 | −2.24 | 0.13 | 0.30 | 0.02 | 0.04 | 0.05 | 0.11 | −0.39 | −2.30 *′ | −0.24 | −2.44 *′ | −0.25 | −1.60 | −0.34 | −2.66 *′ |
| Most of the time | −0.96 | −1.86 | 0.32 | 0.73 | 0.51 | 0.84 | 0.38 | 0.72 | 0.16 | 0.88 | −0.15 | −1.45 | −0.03 | −0.16 | −0.21 | −1.51 |
| Sometimes | −0.55 | −0.84 | 1.07 | 1.91 | 1.13 | 1.45 | 1.16 | 1.71 | −0.10 | −0.49 | −0.27 | −2.24 | −0.06 | −0.29 | −0.34 | −2.13 |
| Never | Reference | Reference | ||||||||||||||
| Washing hands immediately after coughing, rubbing the nose or sneezing | ||||||||||||||||
| Always | 0.11 | 0.46 | −0.09 | −0.44 | −0.07 | −0.24 | −0.02 | −0.06 | −0.55 | −4.44 ***′ | −0.22 | −2.96 **′ | −0.27 | −2.34 | −0.26 | −2.76 *′ |
| Most of the time | 0.07 | 0.26 | −0.13 | −0.60 | −0.02 | −0.08 | −0.02 | −0.06 | 0.01 | 0.09 | −0.11 | −1.34 | −0.08 | −0.63 | −0.15 | −1.40 |
| Sometimes | 0.18 | 0.64 | 0.23 | 0.98 | 0.43 | 1.32 | 0.42 | 1.50 | −0.06 | −0.37 | −0.12 | −1.28 | −0.13 | −0.93 | −0.14 | −1.17 |
| Never | Reference | Reference | ||||||||||||||
| Wearing a face mask regardless of the presence or absence of symptoms | ||||||||||||||||
| Always | 0.14 | 0.86 | −0.15 | −1.12 | −0.17 | −0.90 | −0.18 | −1.10 | −0.70 | −2.70 *′ | −0.34 | −2.20 | −0.54 | −2.23 | −0.46 | −2.32 |
| Most of the time | 0.14 | 0.76 | −0.19 | −1.24 | −0.11 | −0.49 | −0.21 | −1.08 | −0.30 | −1.10 | −0.27 | −1.68 | −0.34 | −1.34 | −0.26 | −1.24 |
| Sometimes | 0.11 | 0.57 | −0.07 | −0.47 | 0.15 | 0.66 | −0.05 | −0.23 | −0.36 | −1.13 | −0.27 | −1.46 | −0.37 | −1.27 | −0.32 | −1.30 |
| Never | Reference | Reference | ||||||||||||||
| Washing hands after touching contaminated objects | ||||||||||||||||
| Always | −0.65 | −1.57 | −0.24 | −0.70 | −0.18 | −0.37 | −0.23 | −0.54 | −0.39 | −1.34 | −0.53 | −3.12 **′ | −0.81 | −3.04 **′ | −0.80 | −3.66 ***′ |
| Most of the time | −0.60 | −1.36 | −0.11 | −0.29 | 0.20 | 0.39 | 0.04 | 0.08 | 0.003 | 0.01 | −0.48 | −2.71 *′ | −0.60 | −2.15 | −0.62 | −2.73 *′ |
| Sometimes | −0.57 | −1.08 | 0.06 | 0.13 | 0.59 | 0.94 | 0.21 | 0.39 | 0.22 | 0.59 | −0.38 | −1.74 | −0.43 | −1.25 | −0.59 | −2.07 |
| Never | Reference | Reference | ||||||||||||||
| Feeling that unnecessary worry has been made about the pandemic | ||||||||||||||||
| Always | −0.41 | −0.99 | −0.62 | −1.78 | −0.92 | −1.91 | −0.76 | −1.79 | −0.46 | −3.60 ***′ | 0.10 | 1.35 | 0.08 | 0.65 | 0.08 | 0.78 |
| Most of the time | −0.69 | −1.99 | −0.26 | −0.89 | −0.34 | −0.82 | −0.36 | −0.99 | 0.004 | 0.03 | 0.19 | 2.13 | 0.36 | 2.57 *′ | 0.28 | 2.39 |
| Sometimes | −0.11 | −0.49 | −0.24 | −1.29 | −0.20 | −0.78 | −0.26 | −1.16 | −0.01 | −0.06 | −0.05 | −0.69 | −0.02 | −0.17 | −0.01 | −0.10 |
| Never | Reference | Reference | ||||||||||||||
| The average number of hours of home stay | ||||||||||||||||
| 0–10 h | 0.13 | 0.61 | 0.06 | 0.33 | −0.03 | −0.12 | 0.04 | 0.18 | −0.41 | −1.41 | 0.16 | 0.96 | 0.26 | 0.96 | 0.35 | 1.58 |
| 10–20 h | 0.11 | 0.81 | −0.09 | −0.74 | −0.13 | −0.78 | −0.09 | −0.62 | 0.22 | 1.45 | 0.10 | 1.13 | 0.17 | 1.18 | 0.01 | 0.12 |
| 20–24 h | Reference | Reference | ||||||||||||||
| Information Needs | Iran | China | ||||||||||||||
|---|---|---|---|---|---|---|---|---|---|---|---|---|---|---|---|---|
| Impact of Event | Stress | Anxiety | Depression | Impact of Event | Stress | Anxiety | Depression | |||||||||
| B | t | B | t | B | t | B | t | B | t | B | t | B | t | B | t | |
| Symptoms | ||||||||||||||||
| Yes | 0.34 | 2.18 | 0.22 | 1.7 | 0.33 | 1.8 | 0.26 | 1.64 | 0.23 | 1.83 | 0.03 | 0.43 | 0.11 | 0.96 | 0.01 | 0.10 |
| No | Reference | Reference | ||||||||||||||
| Prevention methods | ||||||||||||||||
| Yes | 0.29 | 2.07 | 0.22 | 1.82 | 0.25 | 1.48 | 0.21 | 1.40 | 0.28 | 1.91 | −0.10 | −1.17 | −0.15 | −1.12 | −0.15 | −1.37 |
| No | Reference | Reference | ||||||||||||||
| Management methods | ||||||||||||||||
| Yes | 0.52 | 2.80 ** | 0.15 | 0.92 | 0.30 | 1.37 | 0.21 | 1.11 | 0.24 | 2.33 | 0.09 | 1.54 | 0.21 | 2.24 | 0.10 | 1.23 |
| No | Reference | Reference | ||||||||||||||
| Regular information update | ||||||||||||||||
| Yes | 0.37 | 2.31 | 0.13 | 0.94 | 0.25 | 1.33 | 0.16 | 0.97 | 0.47 | 2.29 | −0.14 | −1.18 | −0.12 | −0.63 | −0.21 | −1.32 |
| No | Reference | Reference | ||||||||||||||
| Local transmission data | ||||||||||||||||
| Yes | 0.54 | 3.49 ** | 0.27 | 2.03 | 0.35 | 1.89 | 0.30 | 1.88 | 0.15 | 0.66 | −0.33 | −2.60 | −0.30 | −1.49 | −0.37 | −2.20 |
| No | Reference | Reference | ||||||||||||||
| More personalized information, such as those with preexisting medical conditions | ||||||||||||||||
| Yes | 0.29 | 2.02 | 0.27 | 2.23 | 0.28 | 1.63 | 0.24 | 1.61 | 0.07 | 0.48 | −0.13 | −1.56 | −0.16 | −1.24 | −0.19 | −1.81 |
| No | Reference | Reference | ||||||||||||||
| Effectiveness of drugs and vaccines | ||||||||||||||||
| Yes | 0.58 | 2.62 ** | 0.30 | 1.59 | 0.42 | 1.59 | 0.37 | 1.61 | 0.17 | 1.01 | −0.17 | −1.68 | −0.08 | −0.53 | −0.22 | −1.71 |
| No | Reference | Reference | ||||||||||||||
| Number of infected by geographical location | ||||||||||||||||
| Yes | 0.35 | 2.21 | 0.31 | 2.32 | 0.48 | 2.63 ** | 0.38 | 2.37 | 0.17 | 1.01 | −0.08 | −0.81 | −0.13 | −0.86 | −0.17 | −1.31 |
| No | Reference | Reference | ||||||||||||||
| Travel advice | ||||||||||||||||
| Yes | 0.39 | 3.22 ** | 0.20 | 1.96 | 0.24 | 1.67 | 0.19 | 1.49 | 0.14 | 1.04 | −0.16 | −2.06 | −0.06 | −0.51 | −0.25 | −2.45 |
| No | Reference | Reference | ||||||||||||||
| Transmission method | ||||||||||||||||
| Yes | 0.39 | 2.34 | 0.14 | 0.97 | 0.31 | 1.60 | 0.20 | 1.14 | 0.53 | 2.94 ** | −0.11 | −1.07 | −0.17 | −1.03 | −0.15 | −1.12 |
| No | Reference | Reference | ||||||||||||||
| Other countries’ response | ||||||||||||||||
| Yes | 0.27 | 1.82 | 0.31 | 2.46 | 0.37 | 2.10 | 0.34 | 2.24 | 0.32 | 3.45 ** | −0.02 | −0.33 | −0.13 | −1.54 | −0.16 | −2.33 |
| No | Reference | Reference | ||||||||||||||
Publisher’s Note: MDPI stays neutral with regard to jurisdictional claims in published maps and institutional affiliations. |
© 2021 by the authors. Licensee MDPI, Basel, Switzerland. This article is an open access article distributed under the terms and conditions of the Creative Commons Attribution (CC BY) license (http://creativecommons.org/licenses/by/4.0/).
Share and Cite
Wang, C.; Fardin, M.A.; Shirazi, M.; Pan, R.; Wan, X.; Tan, Y.; Xu, L.; McIntyre, R.S.; Tran, B.; Quek, T.T.C.; et al. Mental Health of the General Population during the 2019 Coronavirus Disease (COVID-19) Pandemic: A Tale of Two Developing Countries. Psychiatry Int. 2021, 2, 71-84. https://0-doi-org.brum.beds.ac.uk/10.3390/psychiatryint2010006
Wang C, Fardin MA, Shirazi M, Pan R, Wan X, Tan Y, Xu L, McIntyre RS, Tran B, Quek TTC, et al. Mental Health of the General Population during the 2019 Coronavirus Disease (COVID-19) Pandemic: A Tale of Two Developing Countries. Psychiatry International. 2021; 2(1):71-84. https://0-doi-org.brum.beds.ac.uk/10.3390/psychiatryint2010006
Chicago/Turabian StyleWang, Cuiyan, Mohammad A. Fardin, Mahmoud Shirazi, Riyu Pan, Xiaoyang Wan, Yilin Tan, Linkang Xu, Roger S. McIntyre, Bach Tran, Travis T. C. Quek, and et al. 2021. "Mental Health of the General Population during the 2019 Coronavirus Disease (COVID-19) Pandemic: A Tale of Two Developing Countries" Psychiatry International 2, no. 1: 71-84. https://0-doi-org.brum.beds.ac.uk/10.3390/psychiatryint2010006