A Visual Investigation of CO2 Convective Mixing in Water and Oil at the Pore Scale Using a Micromodel Apparatus at Reservoir Conditions


 ,
,
Abstract
:
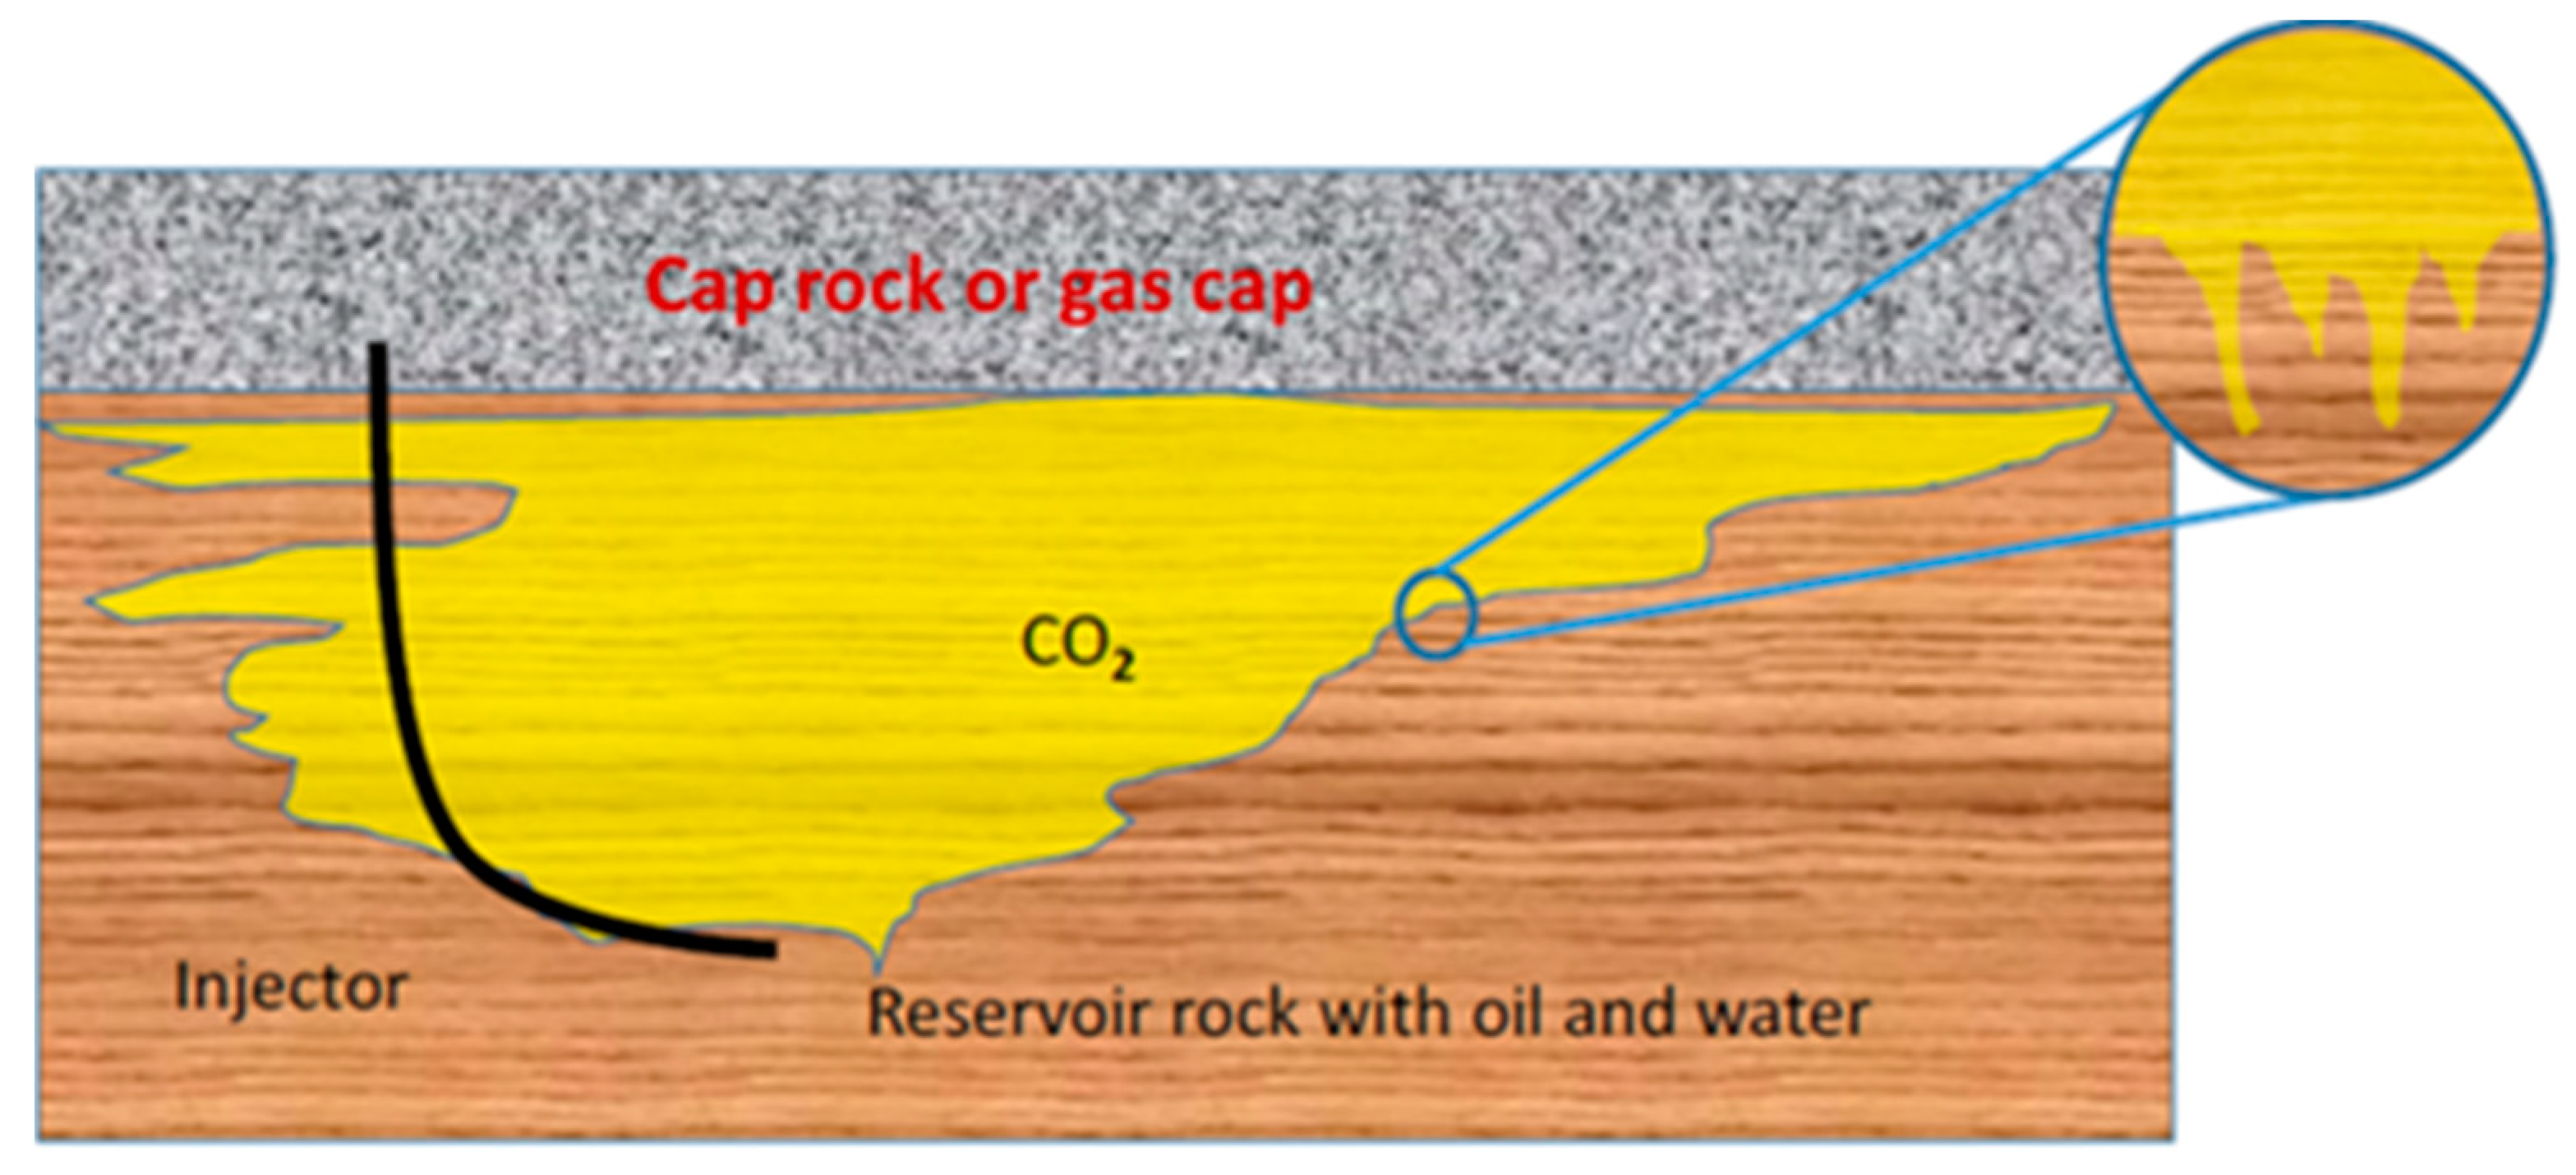
1. Introduction
2. Experimental Method
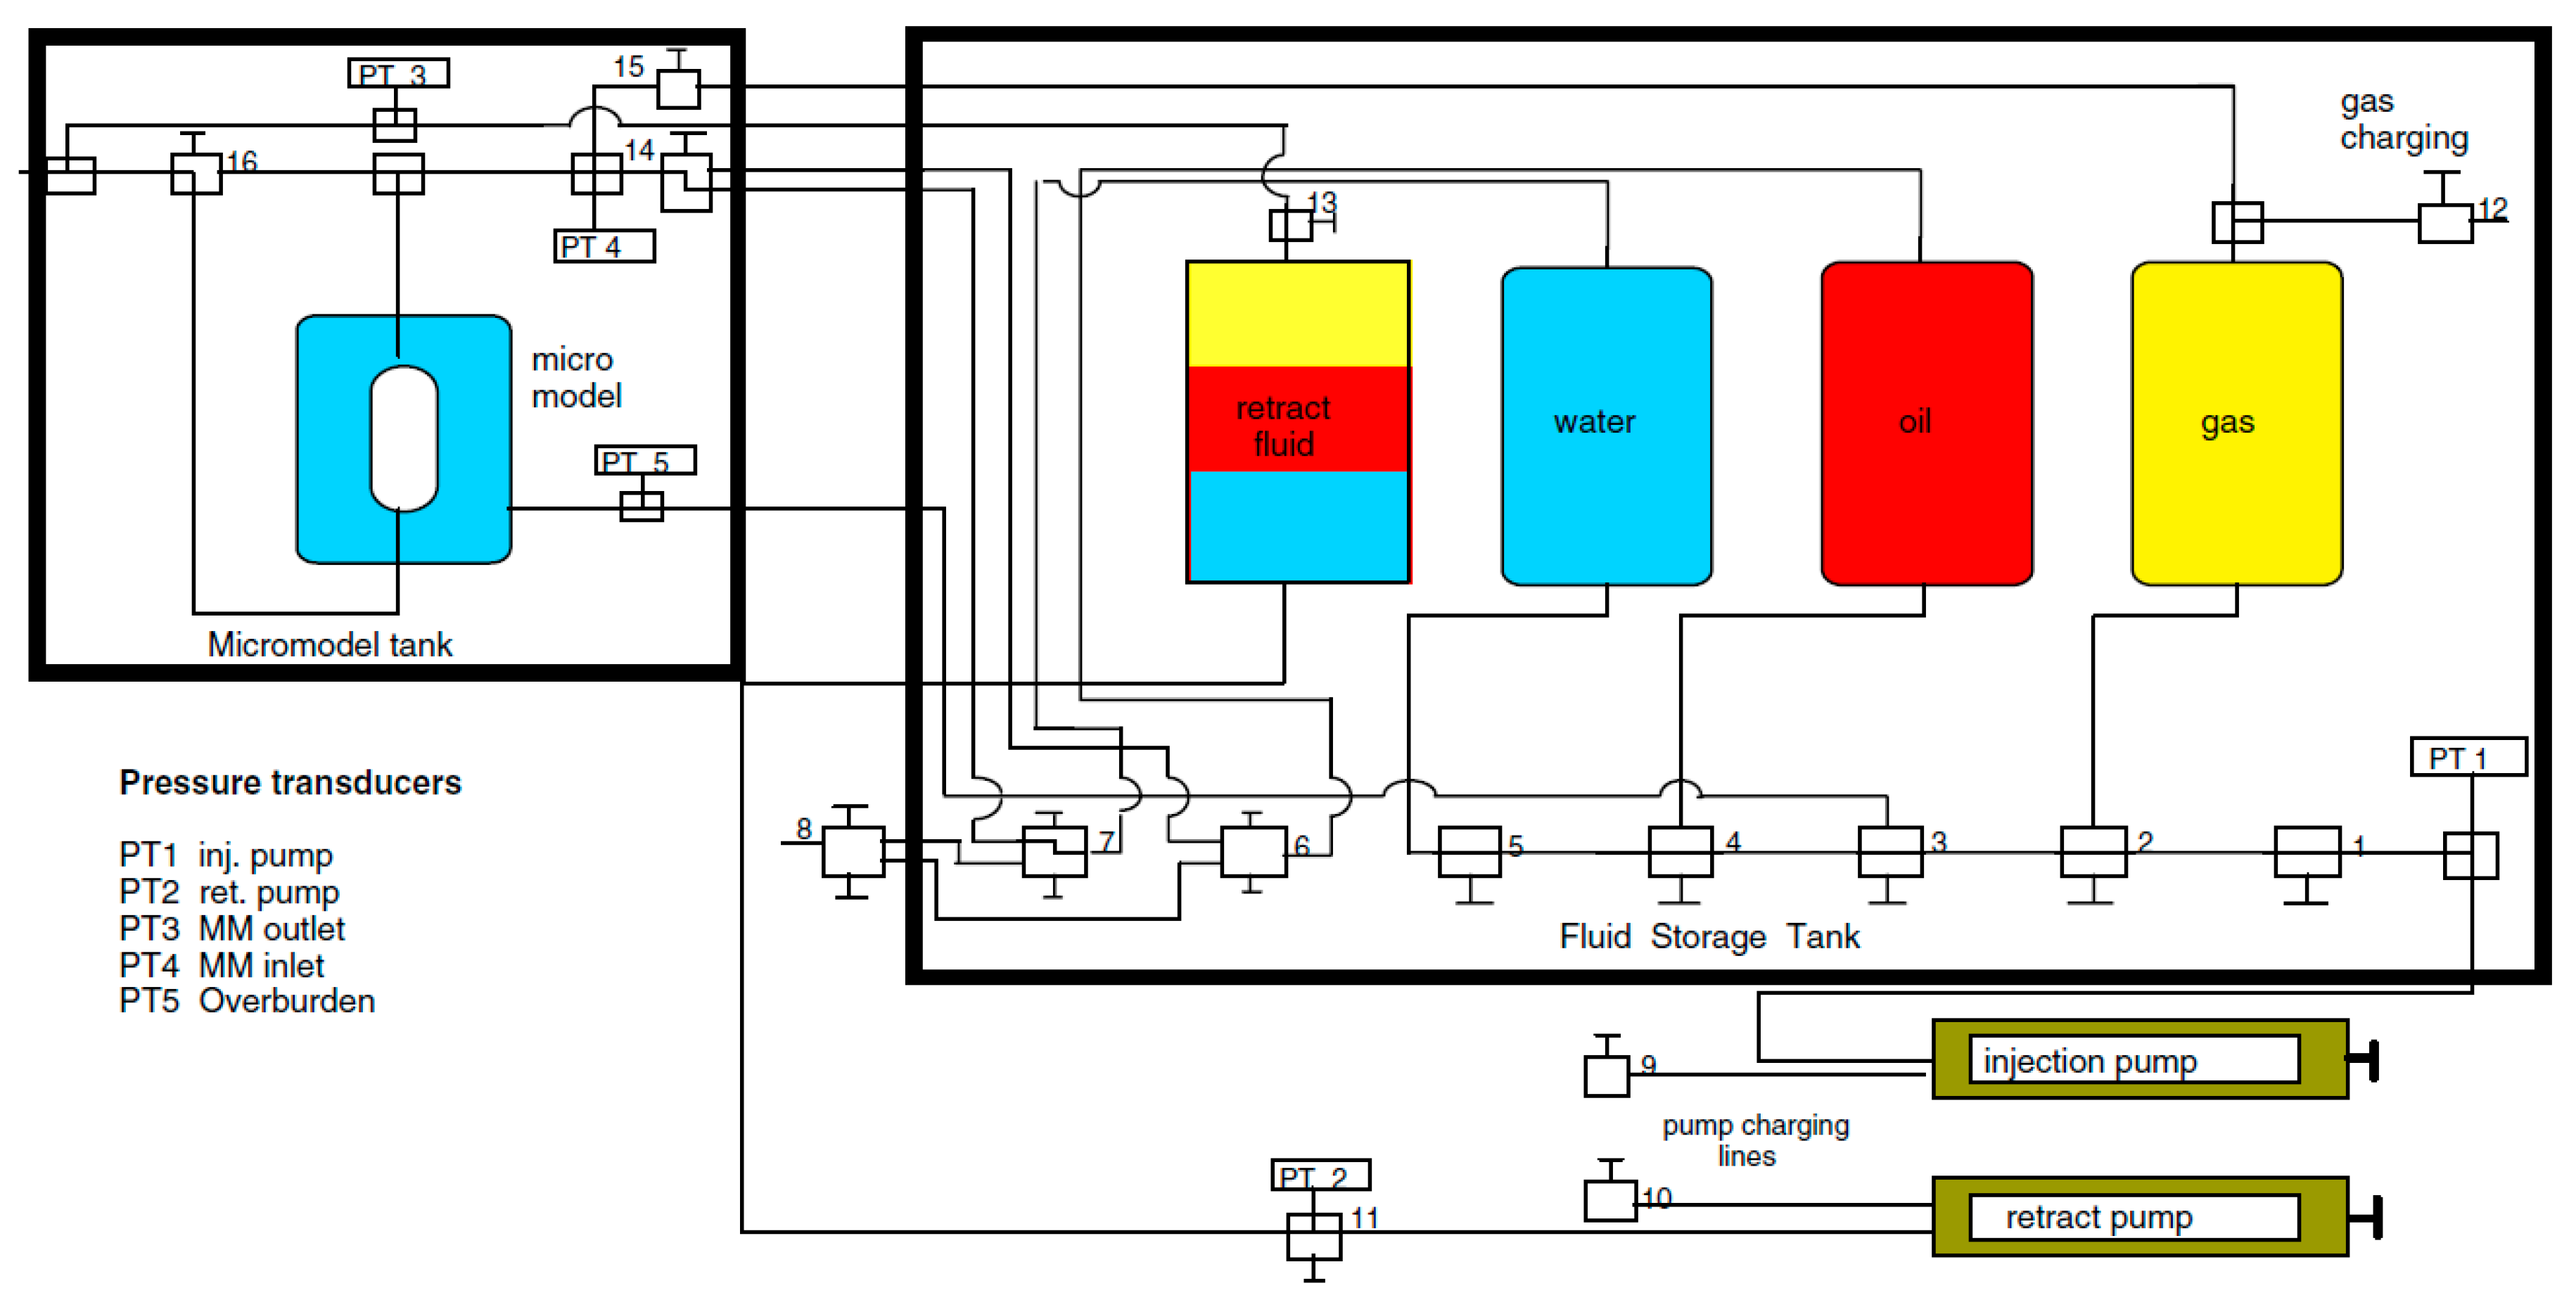
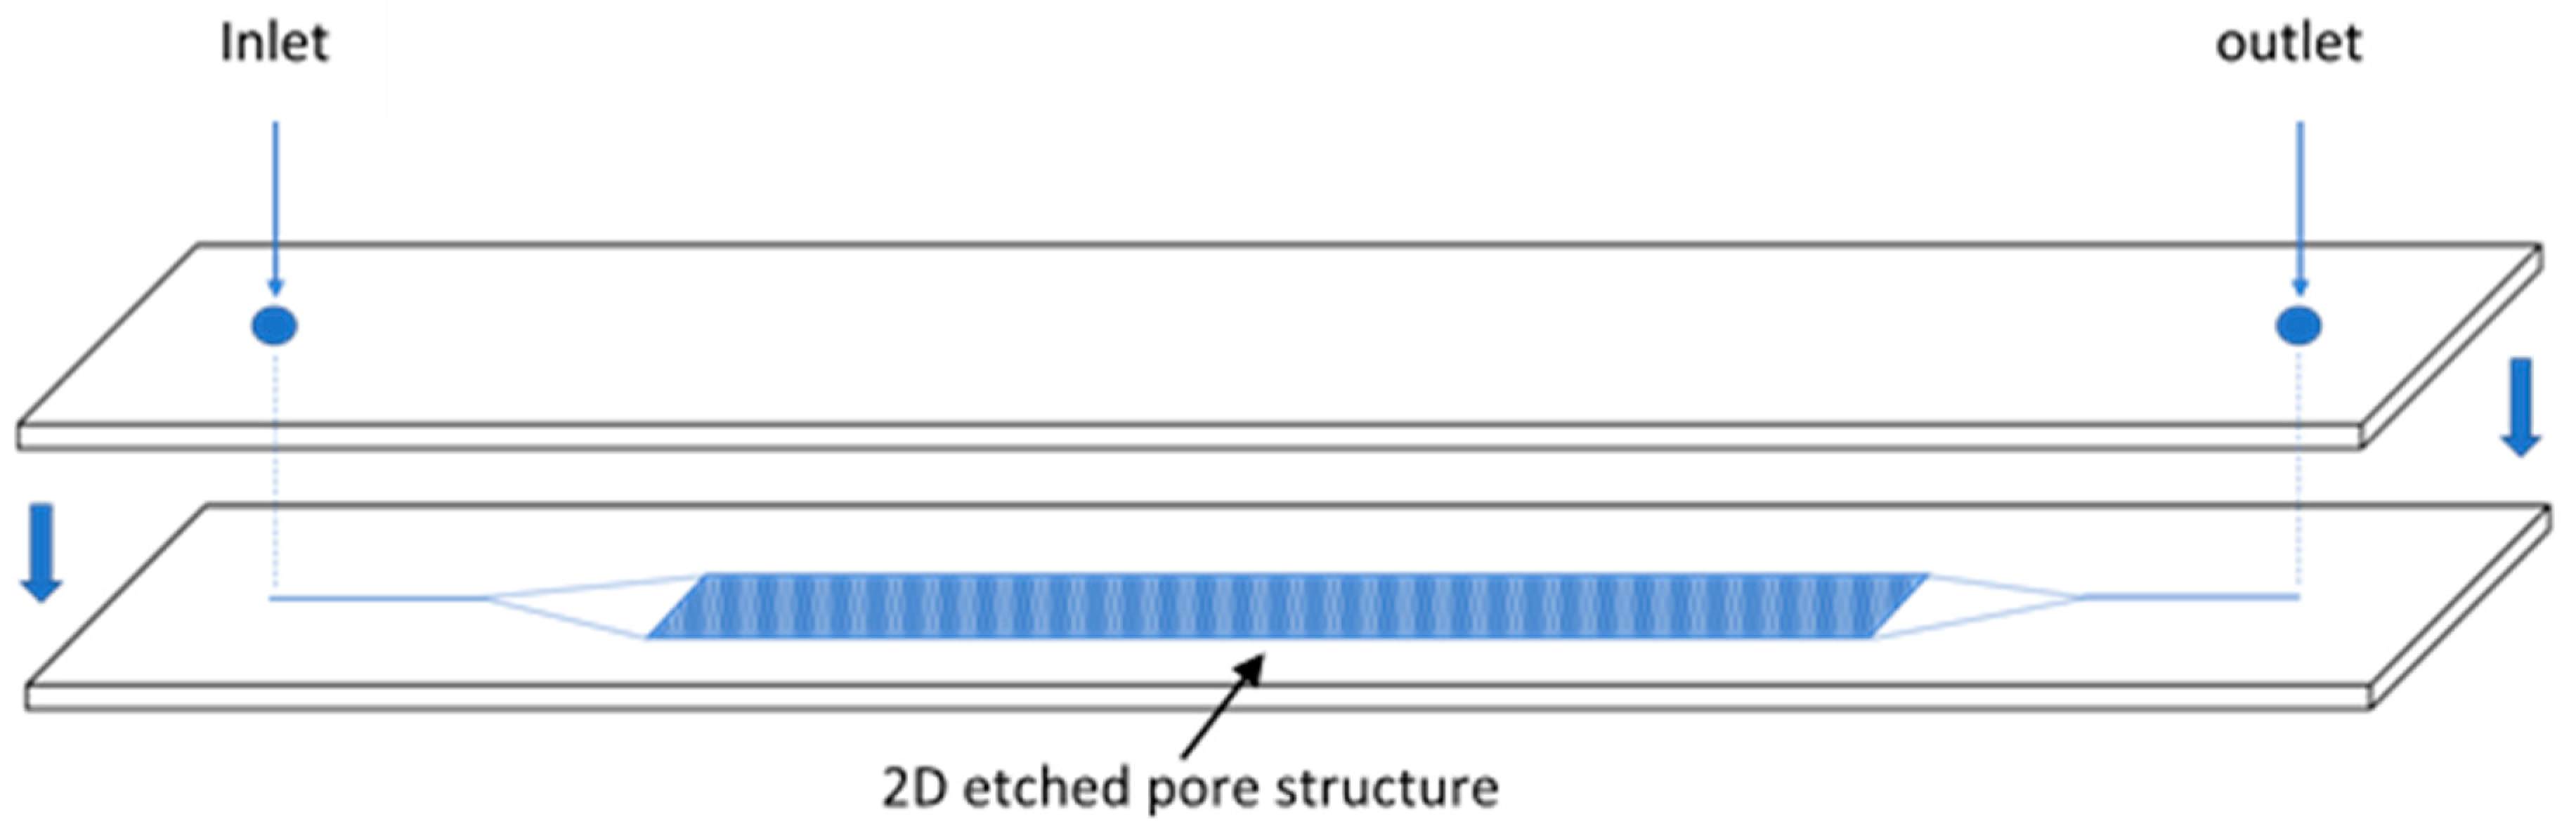
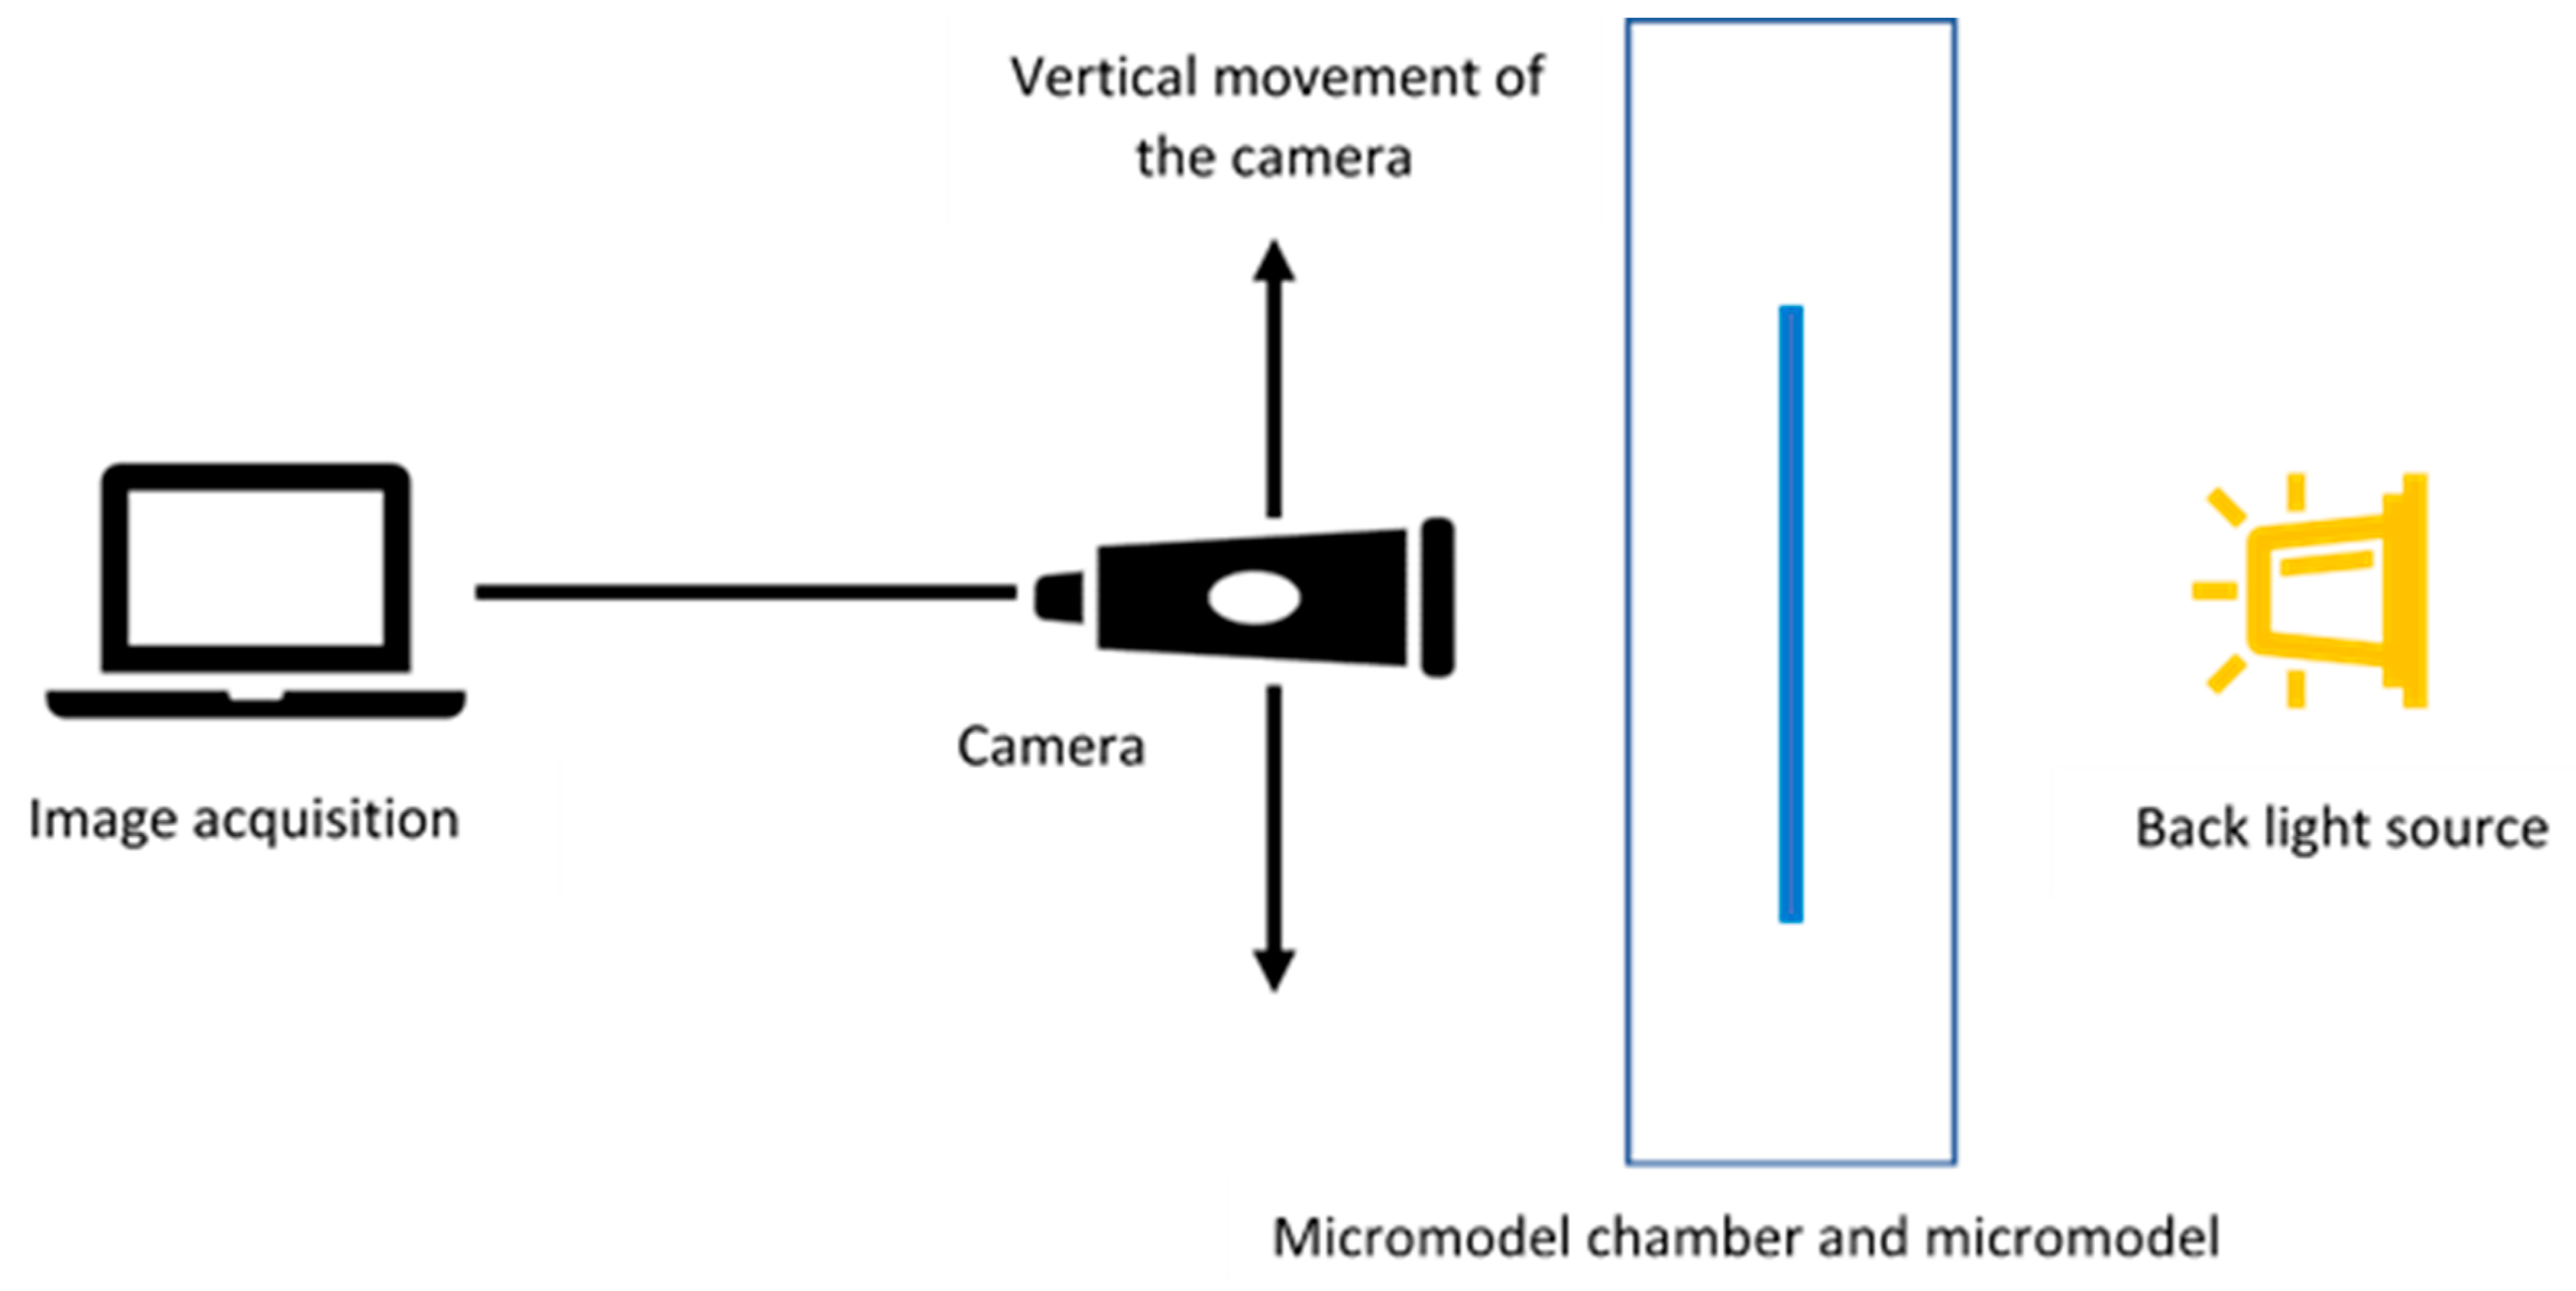
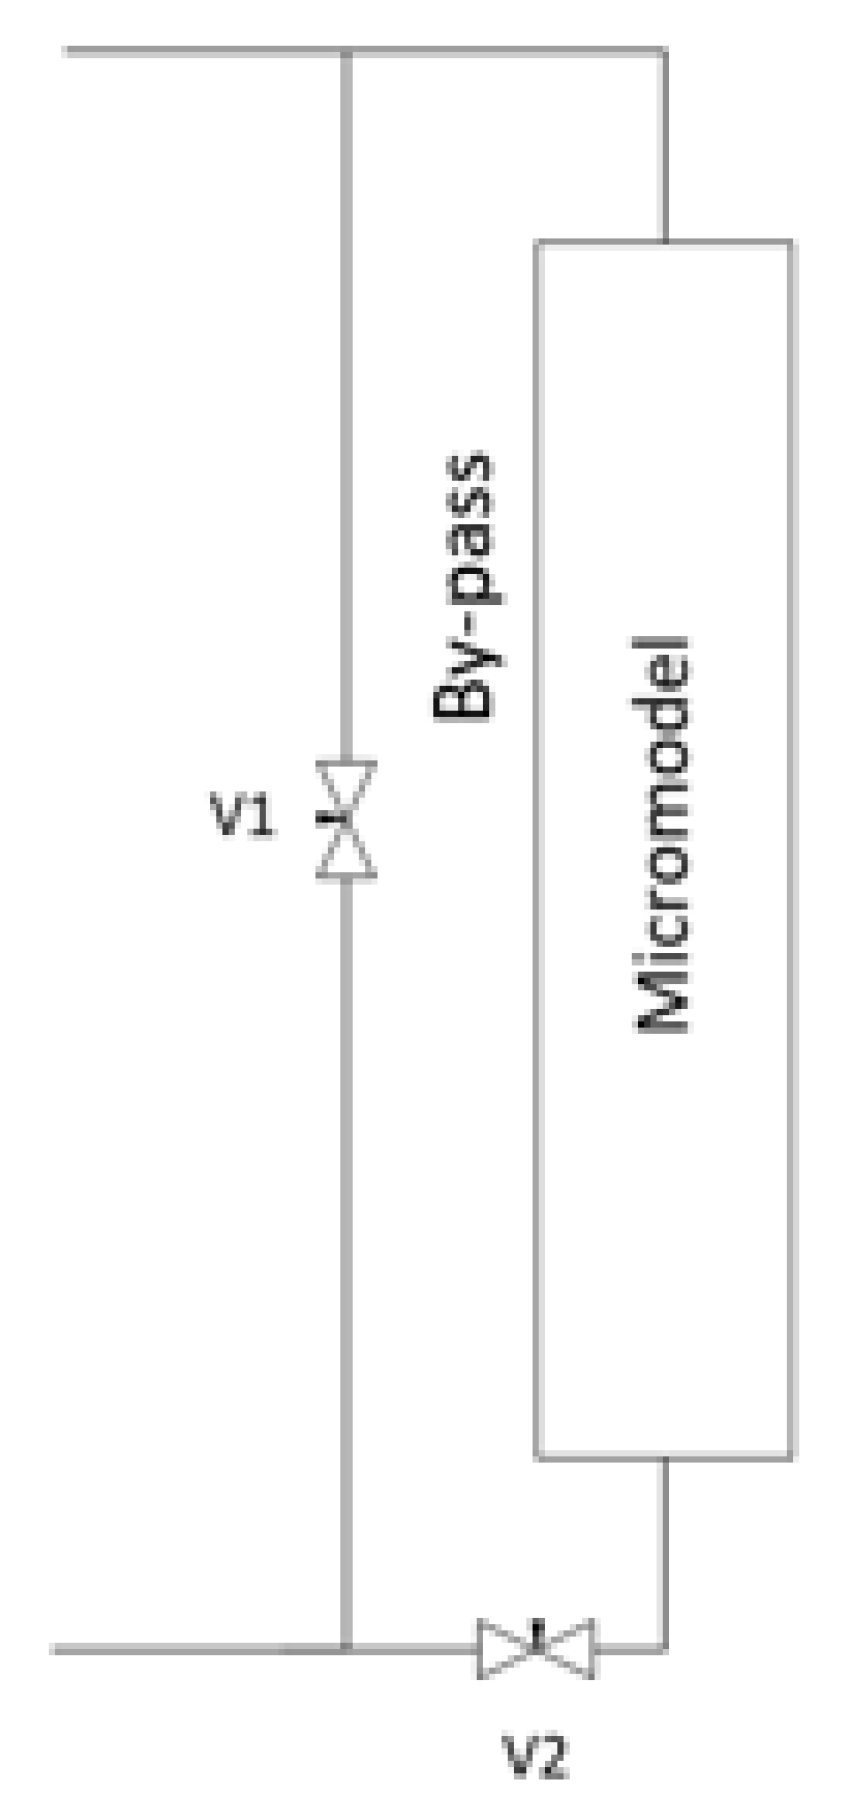
2.1. Experimental Setup
2.2. Experimental Cases
2.3. Experimental Procedure
2.4. Rayleigh (Ra) Number Calculation
3. Results and Discussion
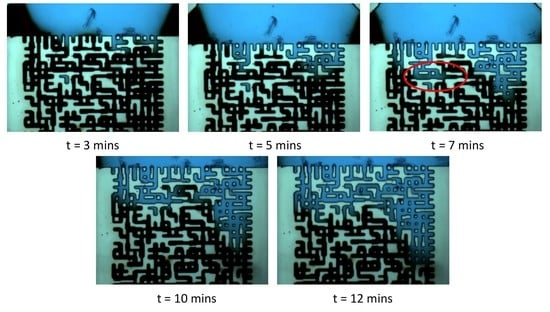
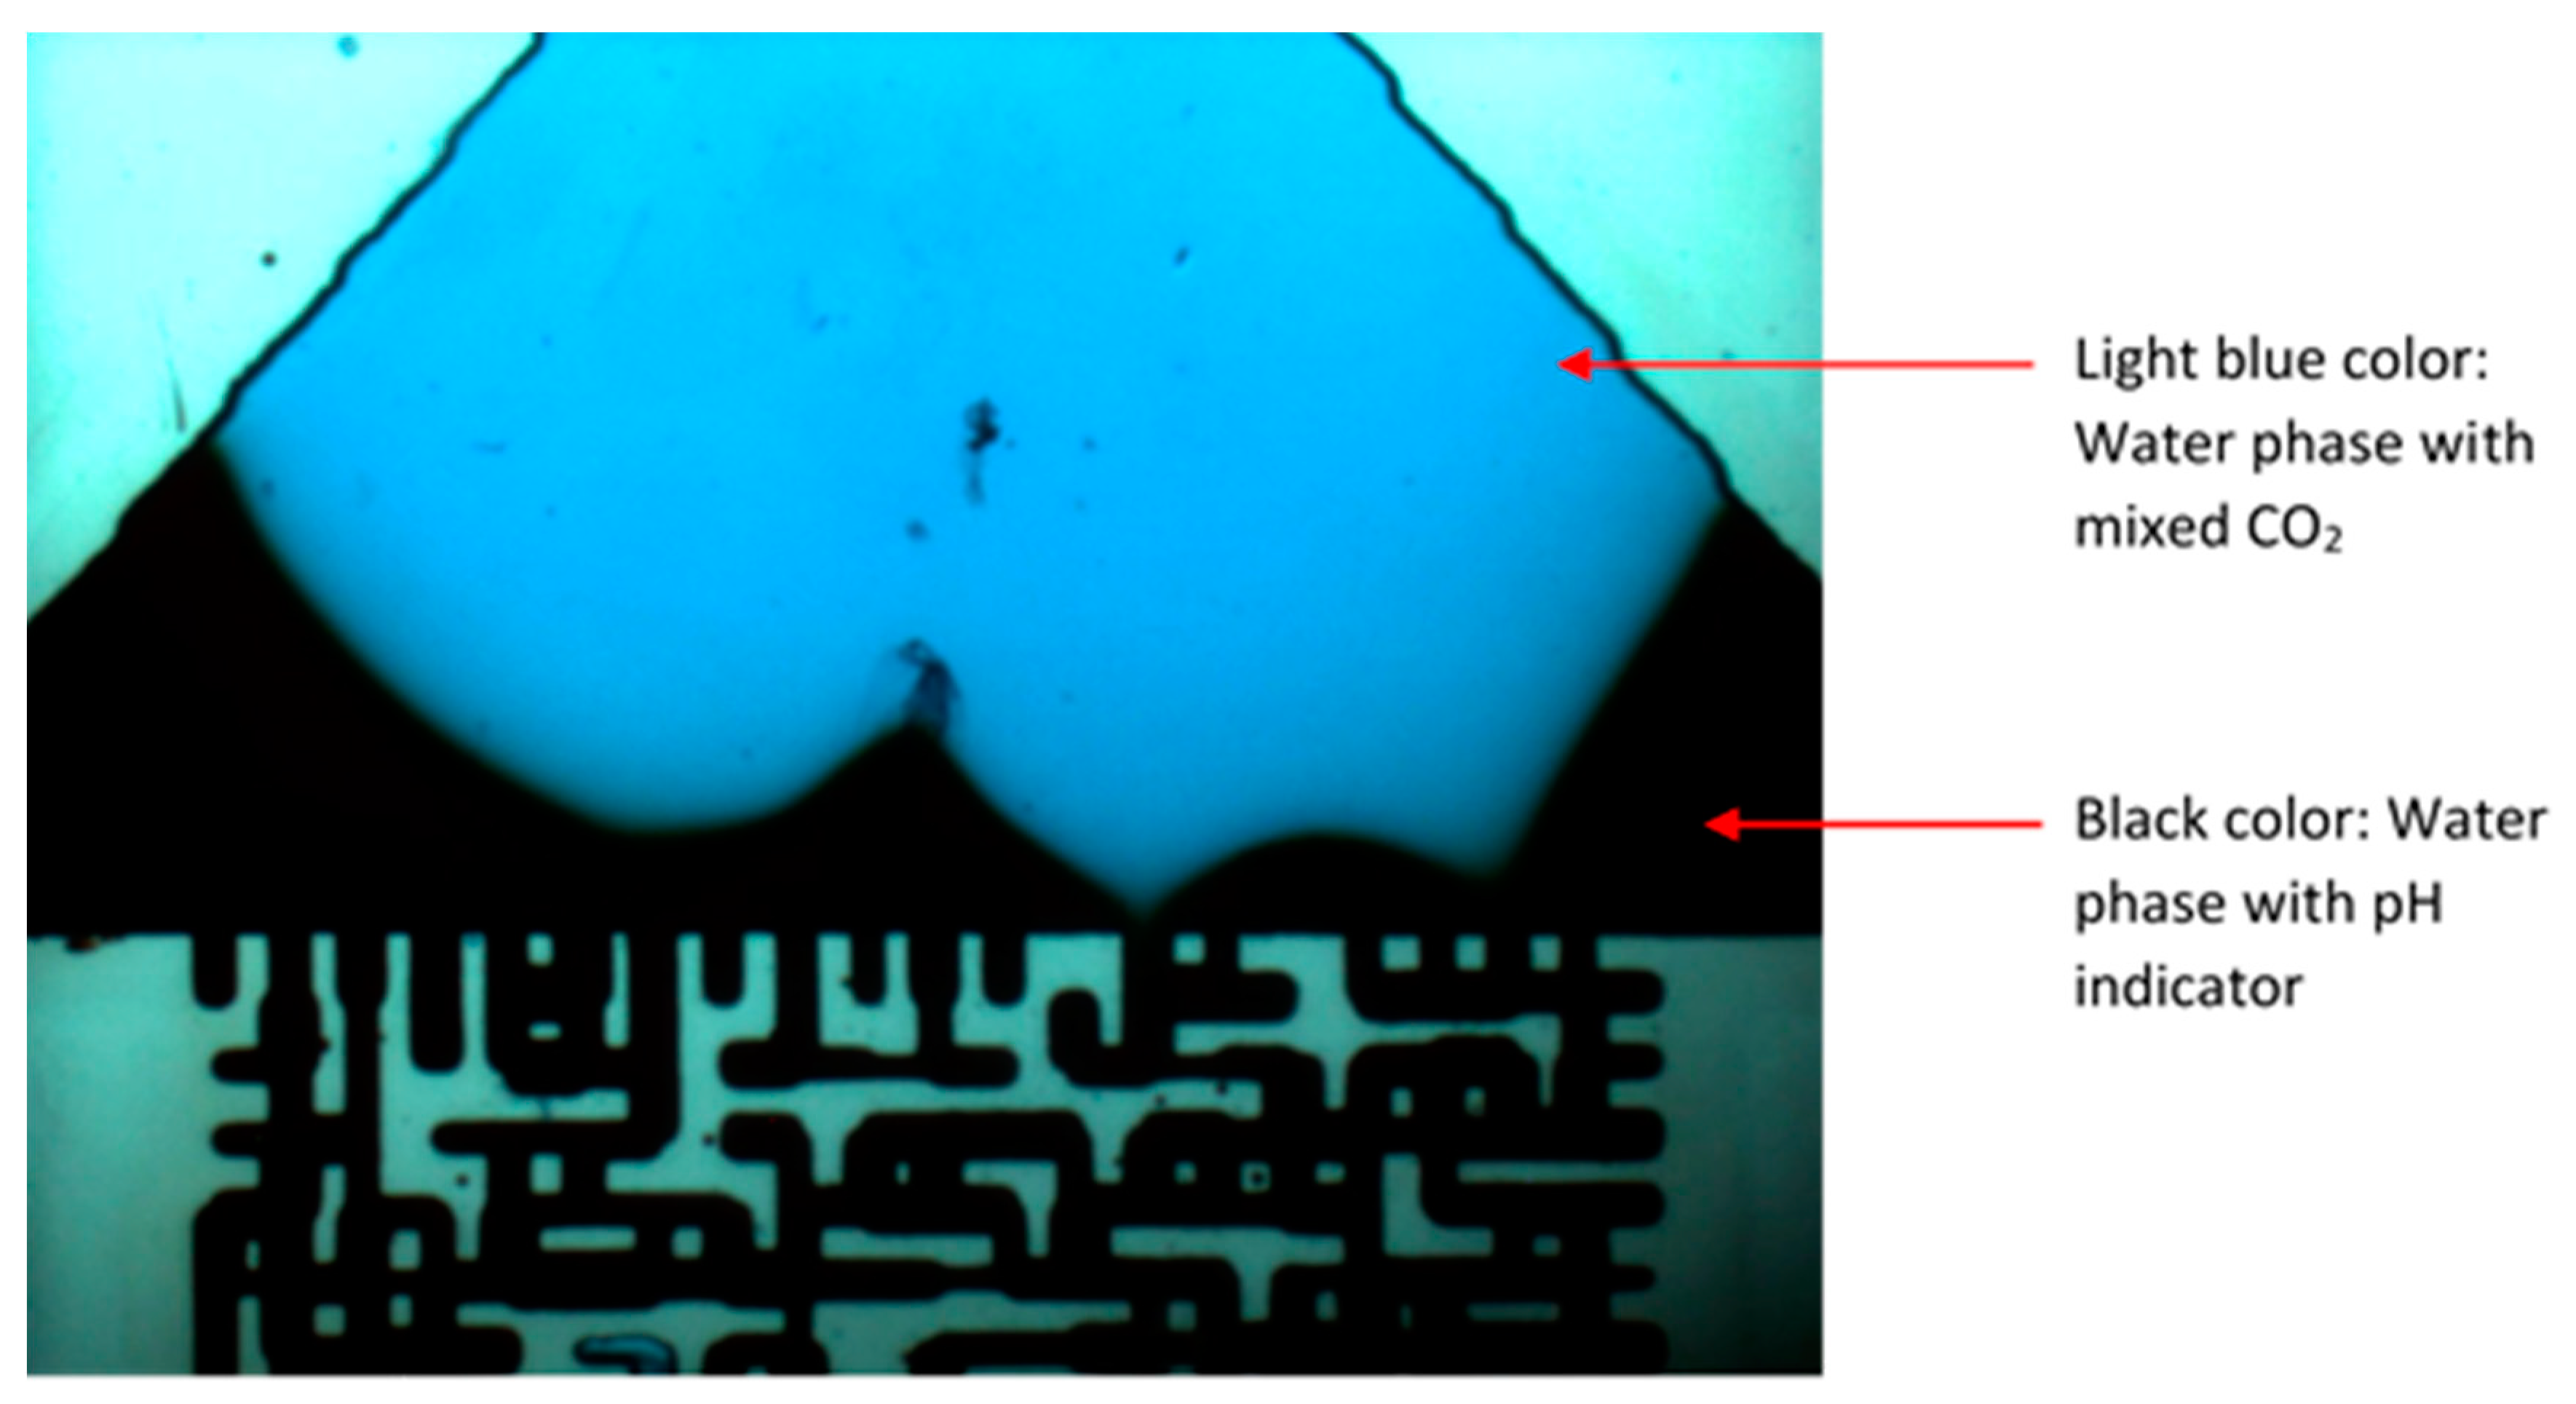
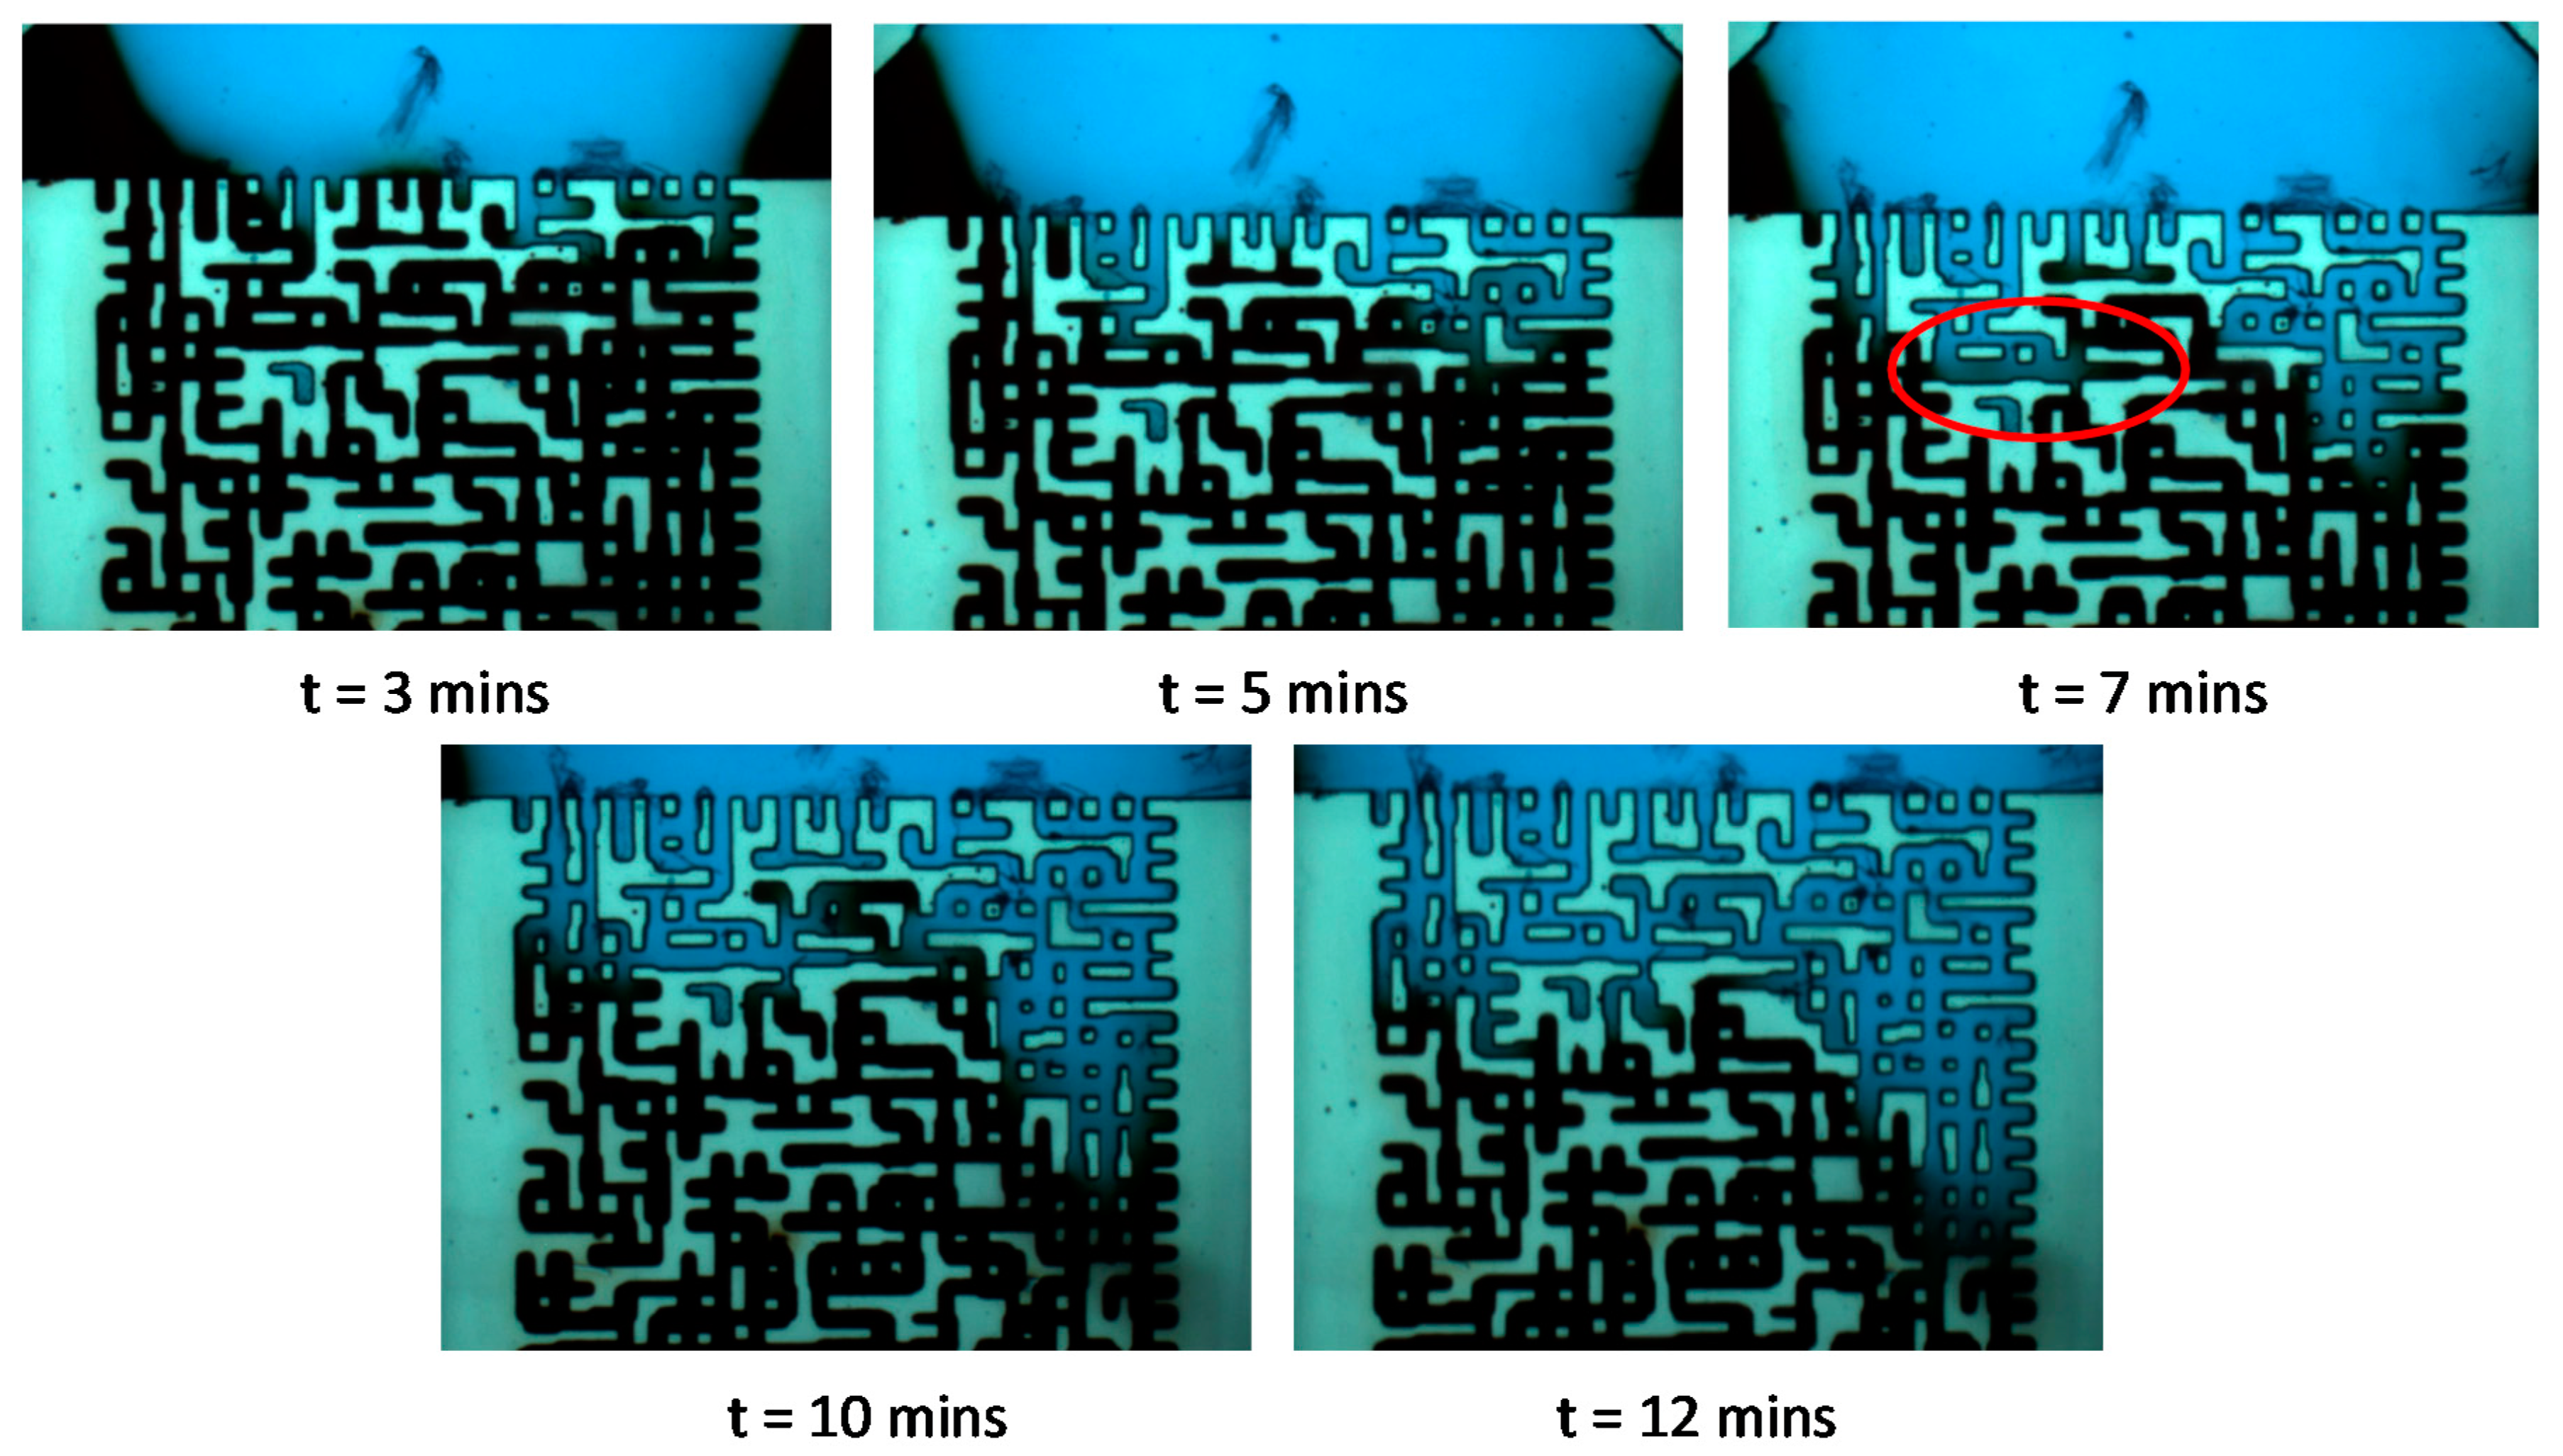
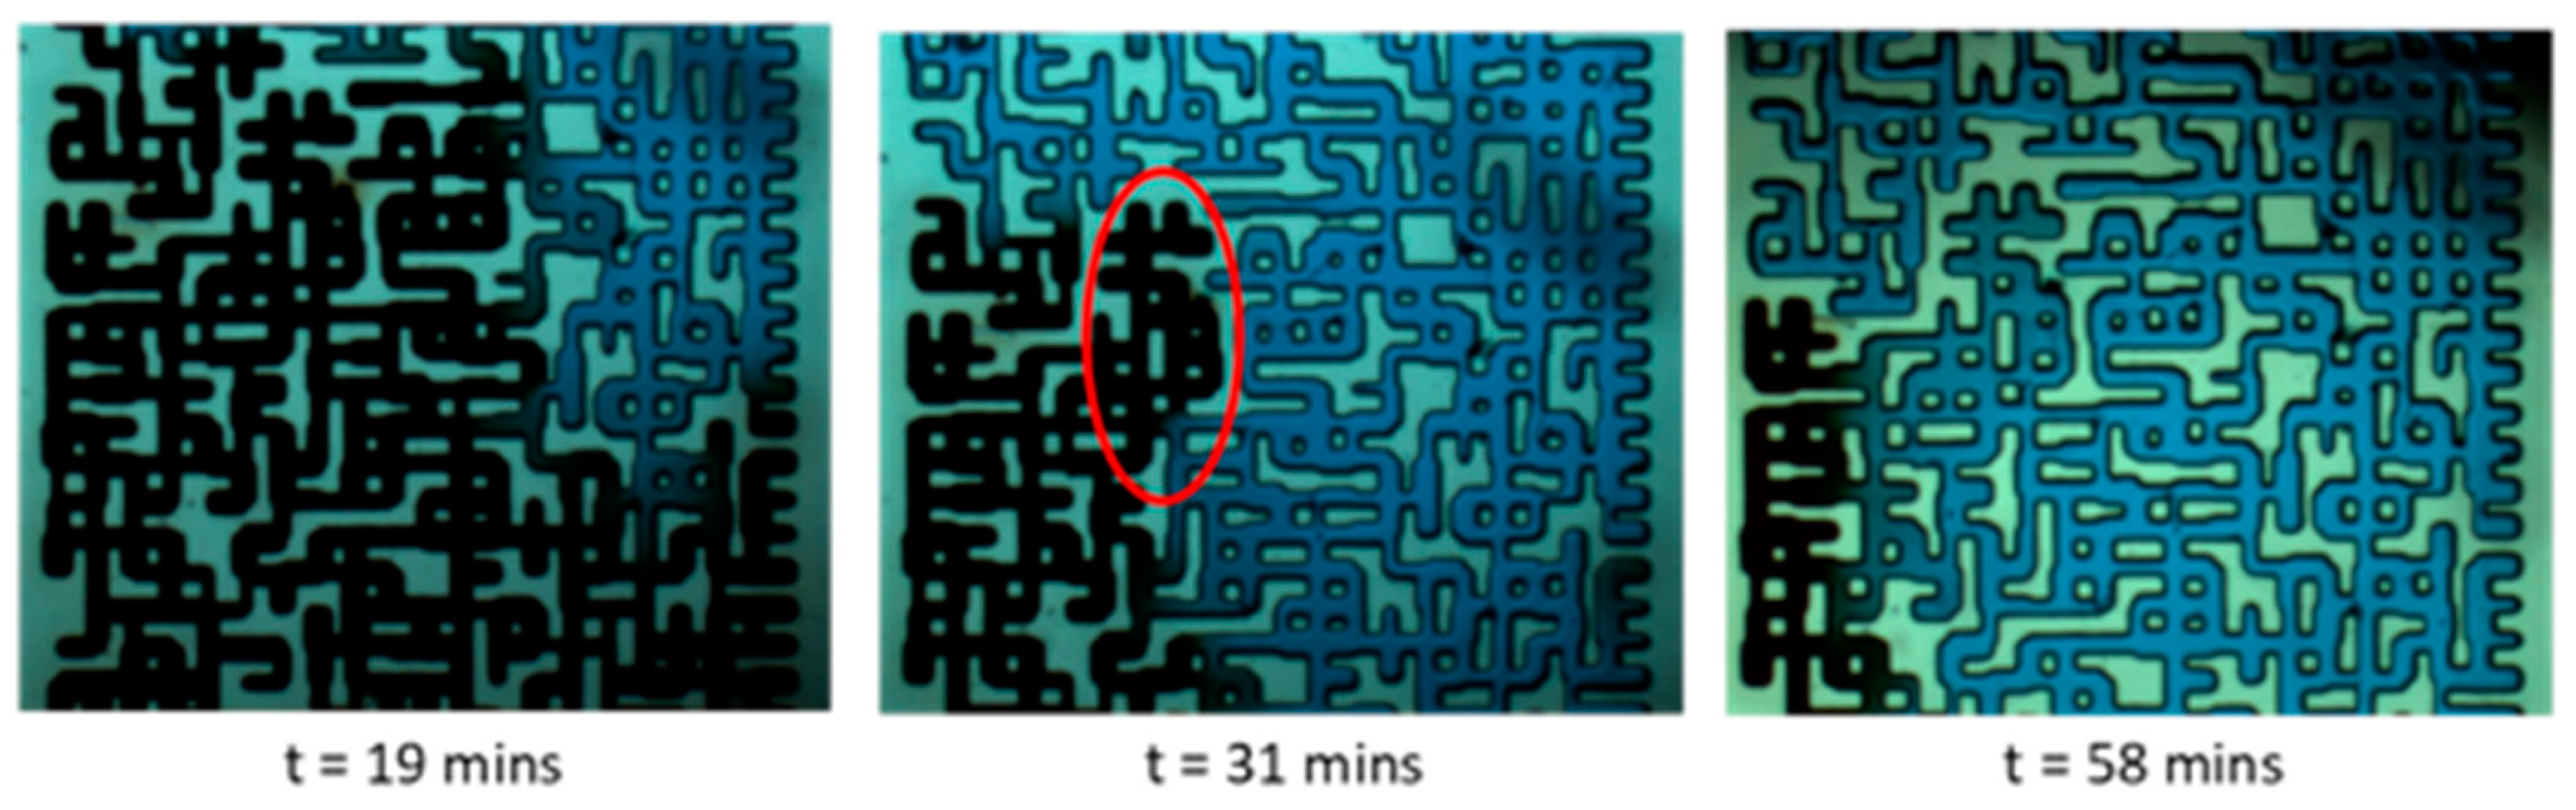
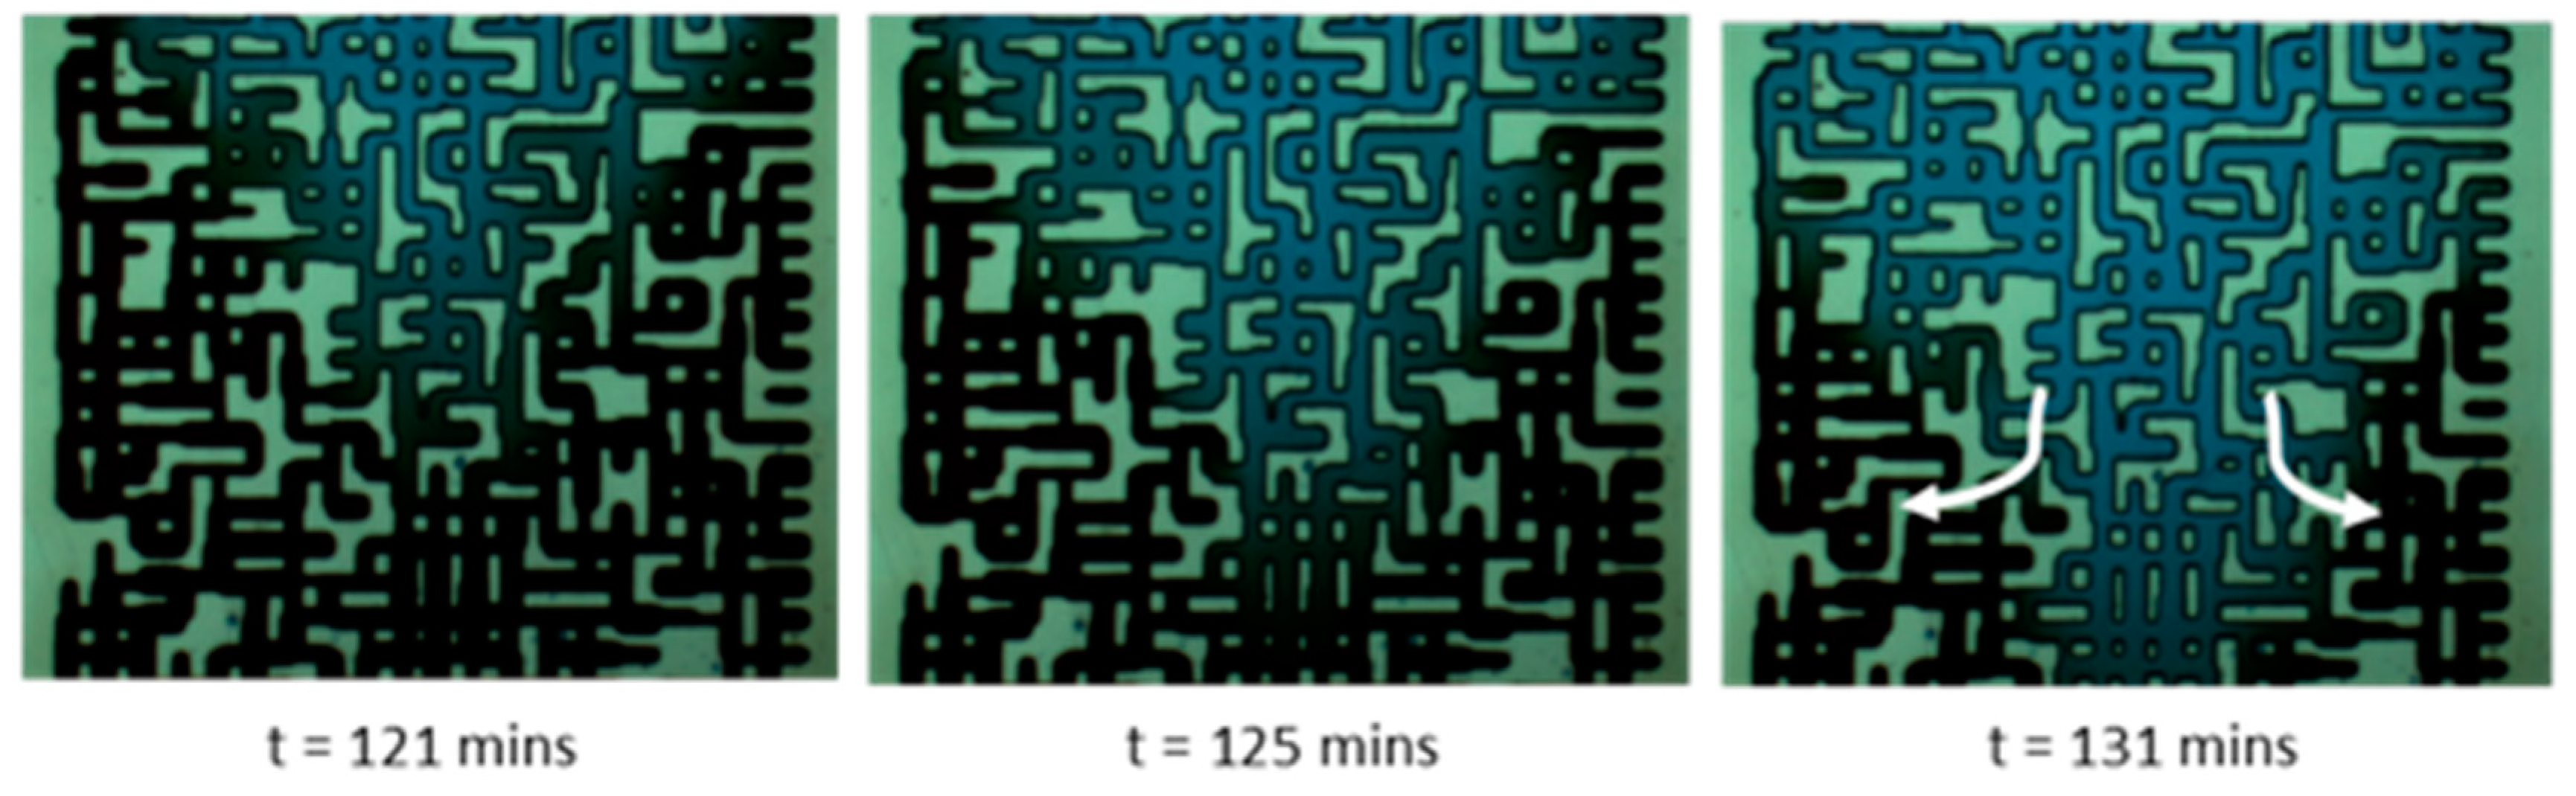
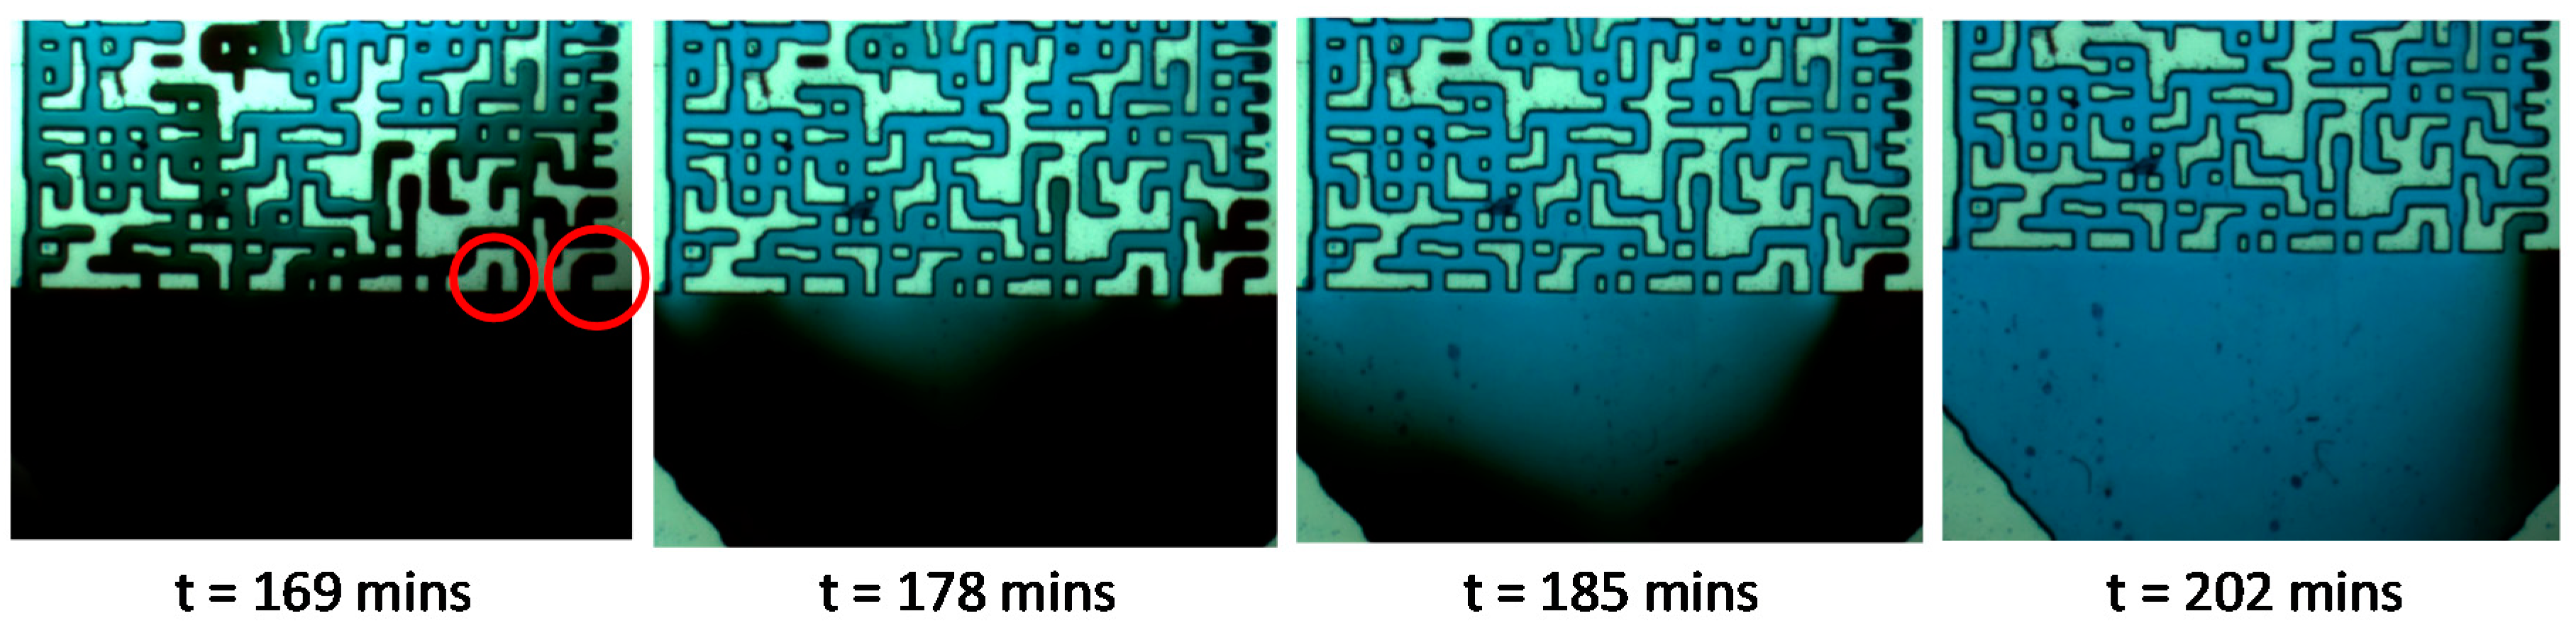
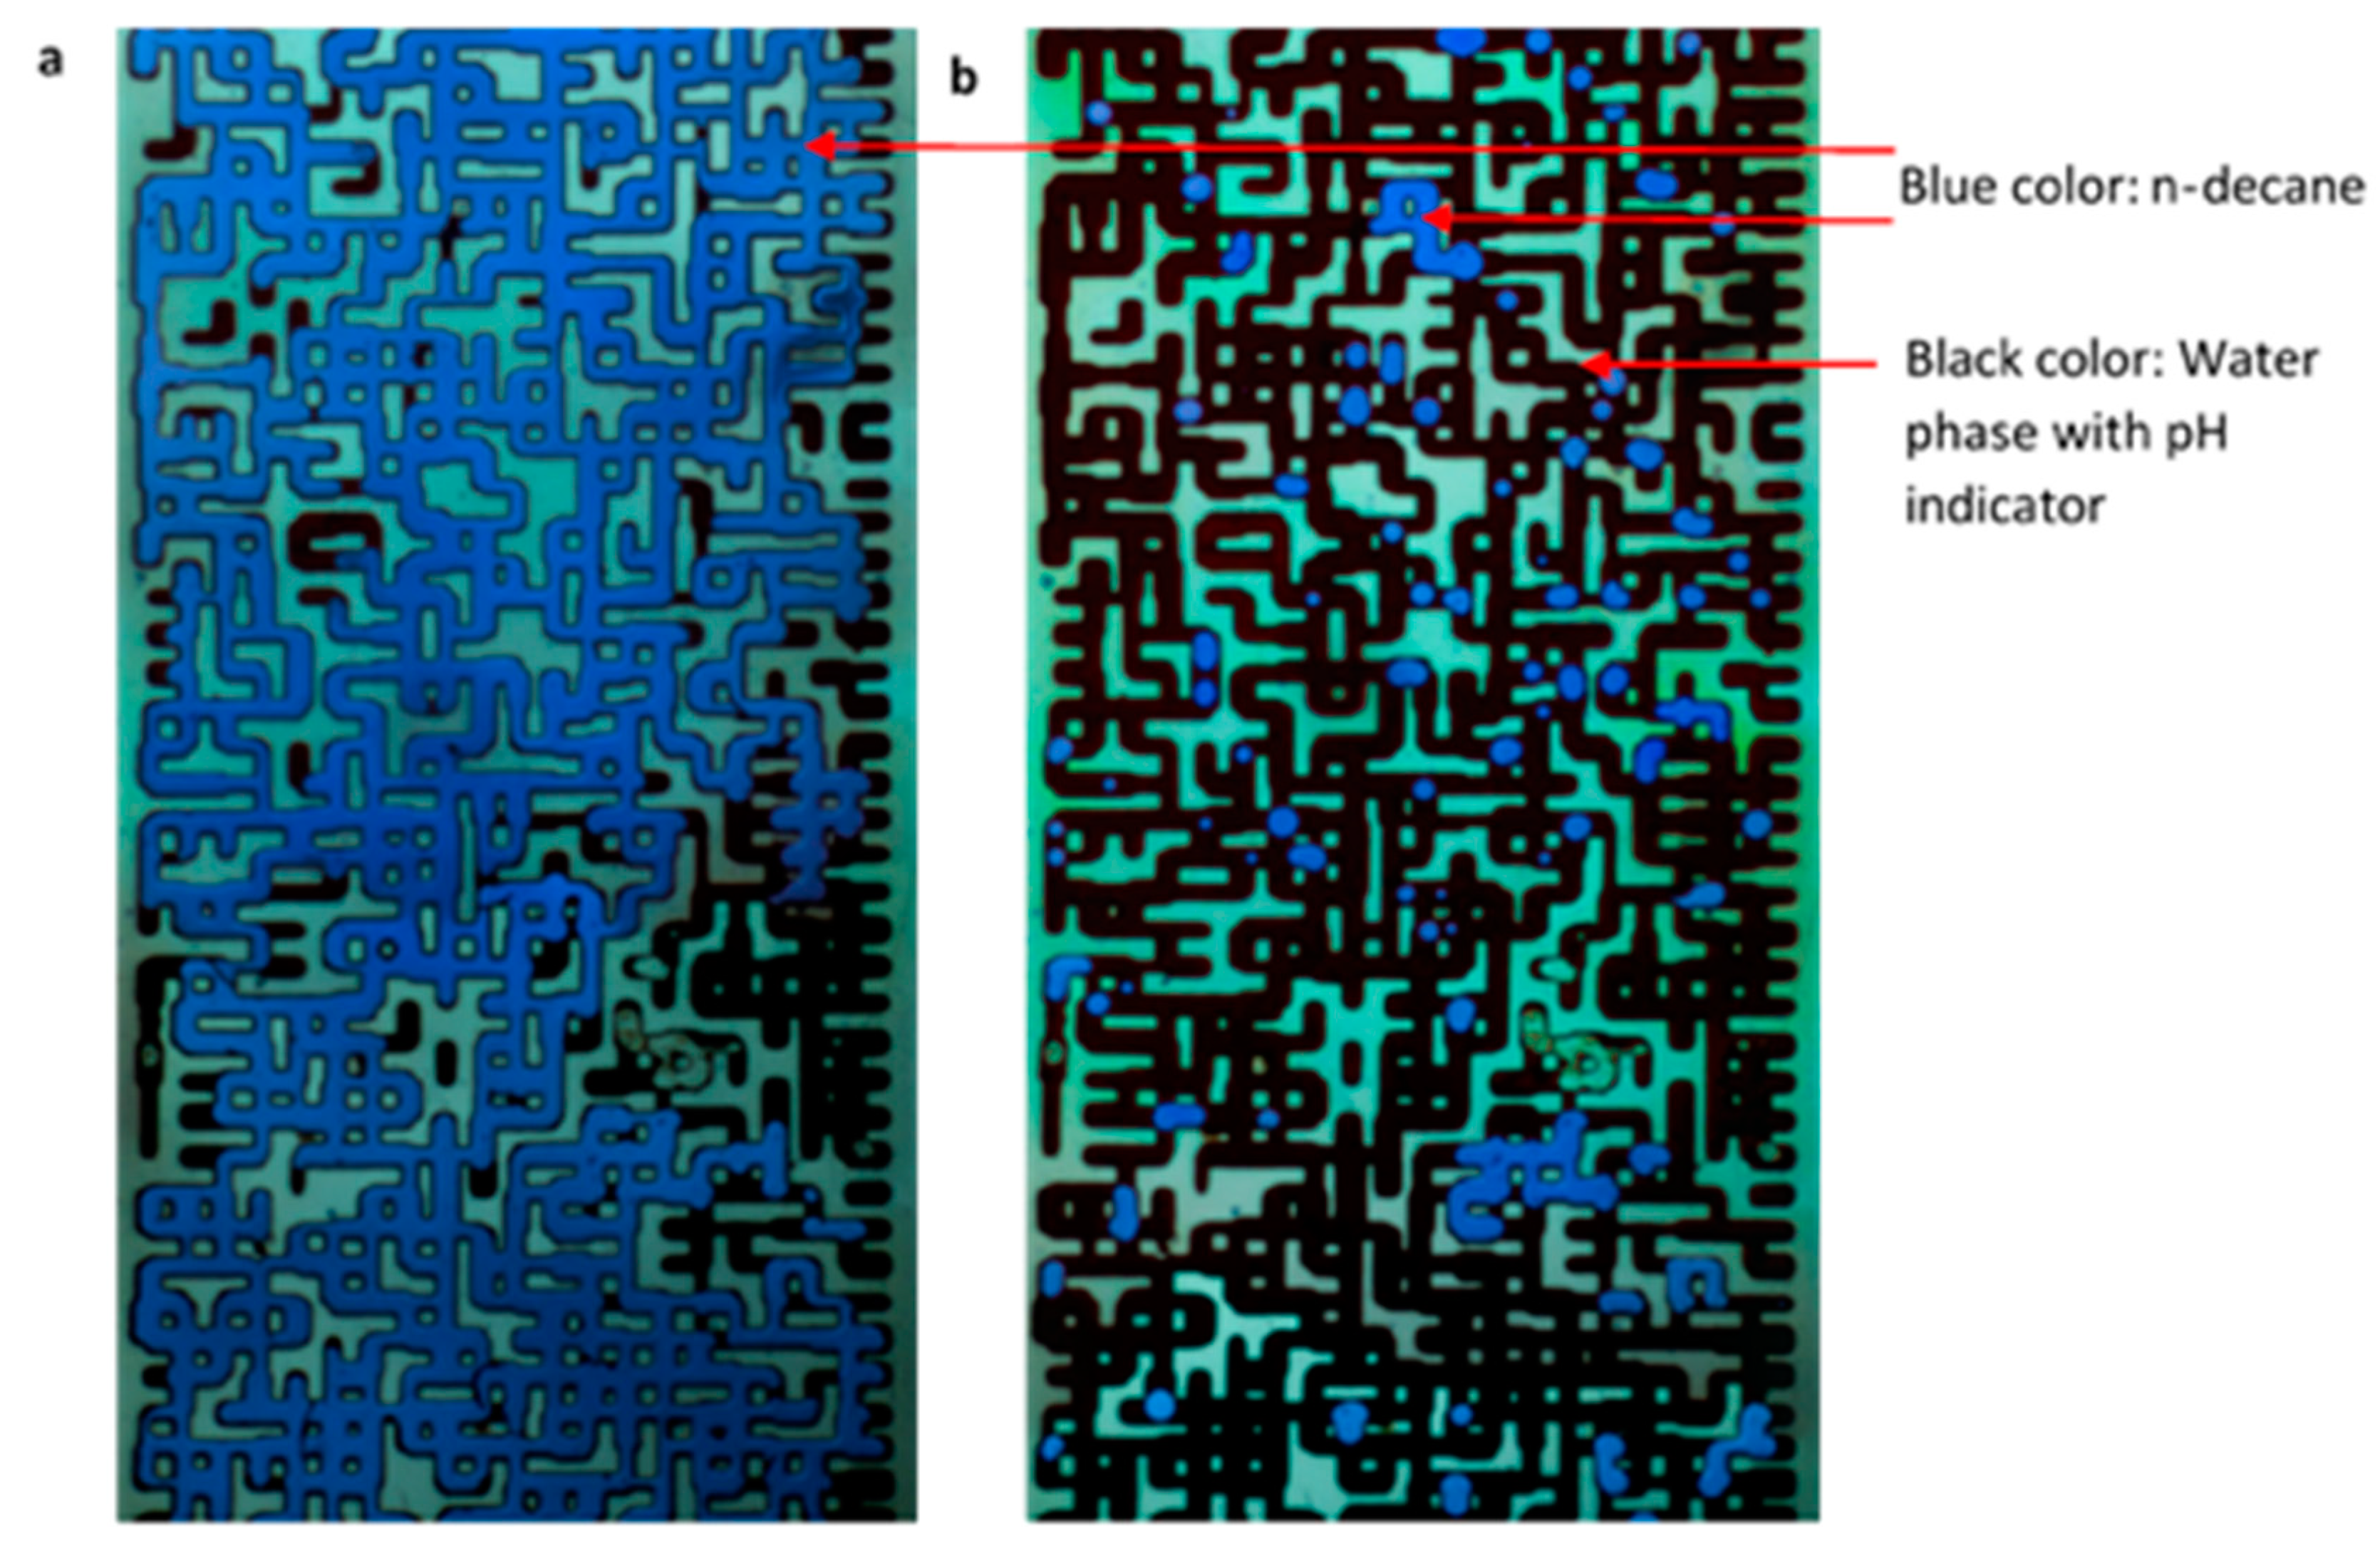
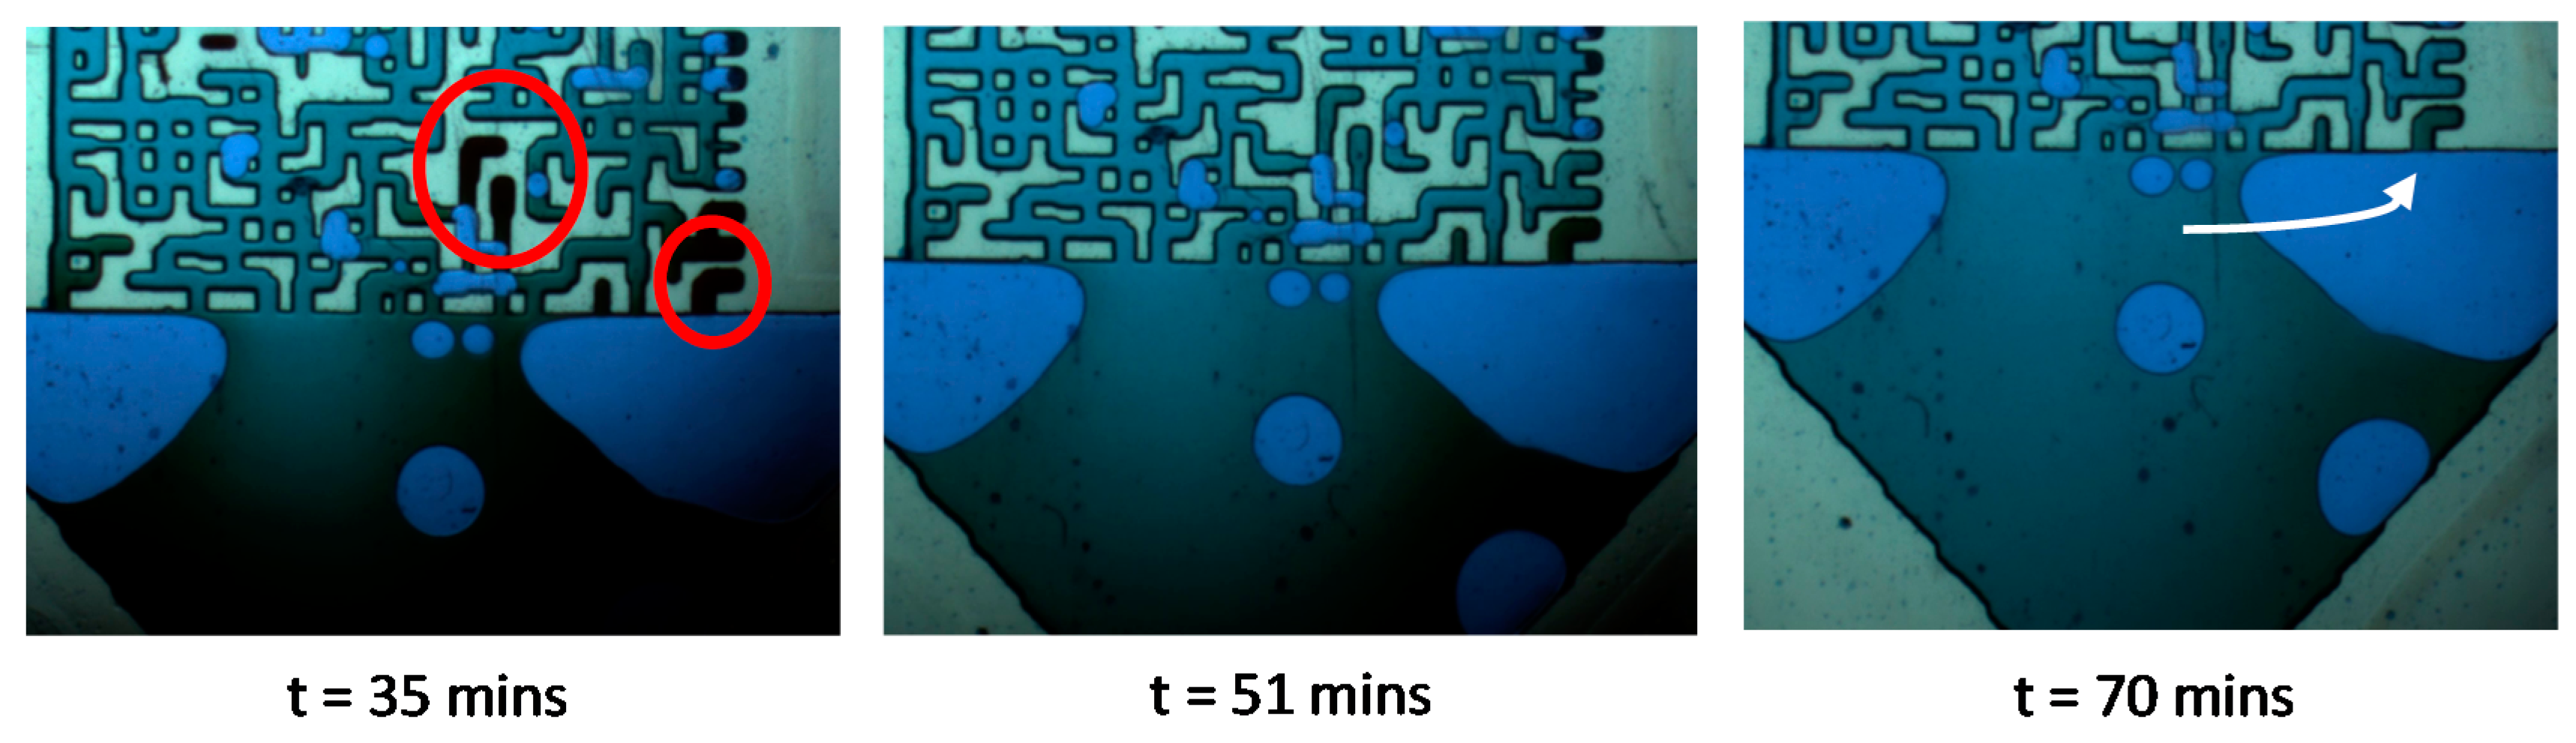
3.1. Case 1: CO2 Mixing in a 100% Water Saturation System
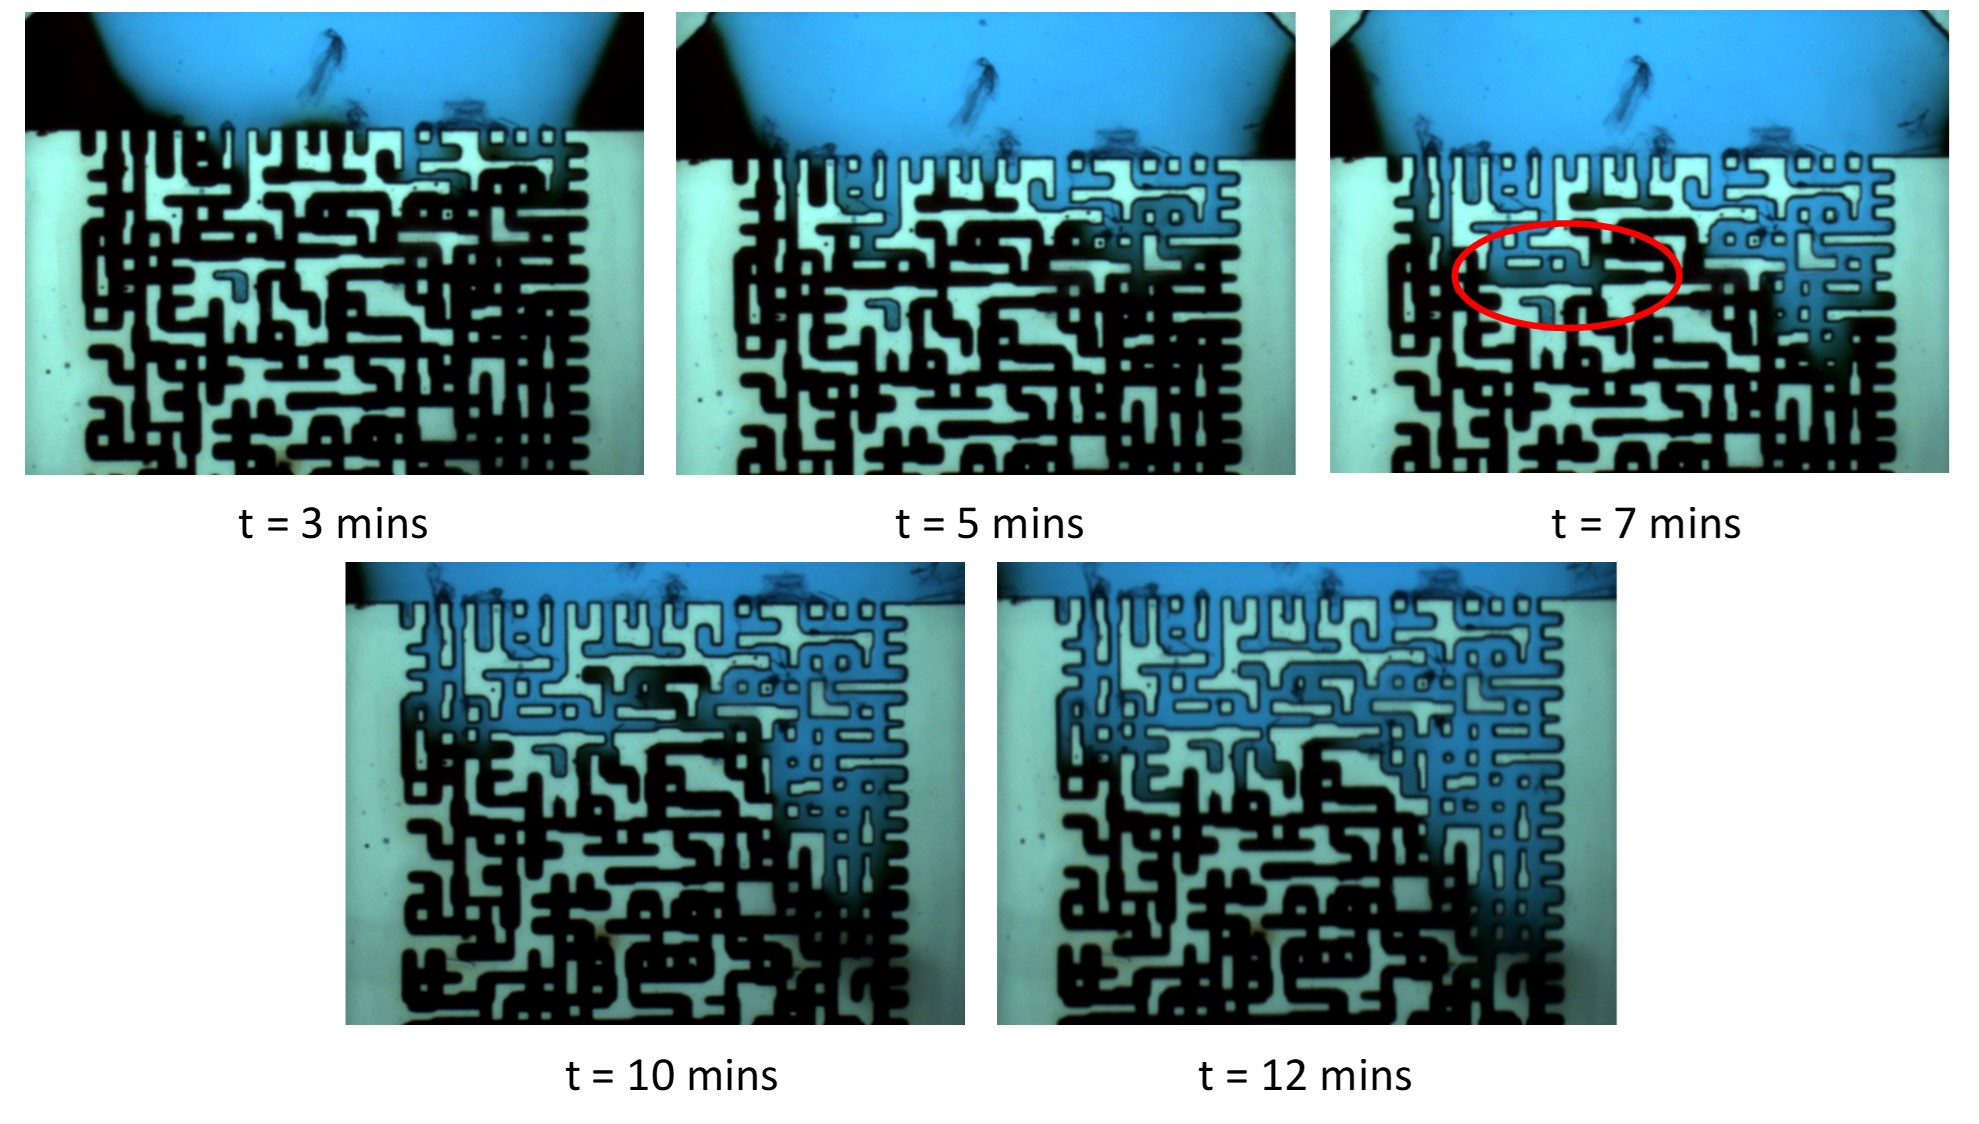
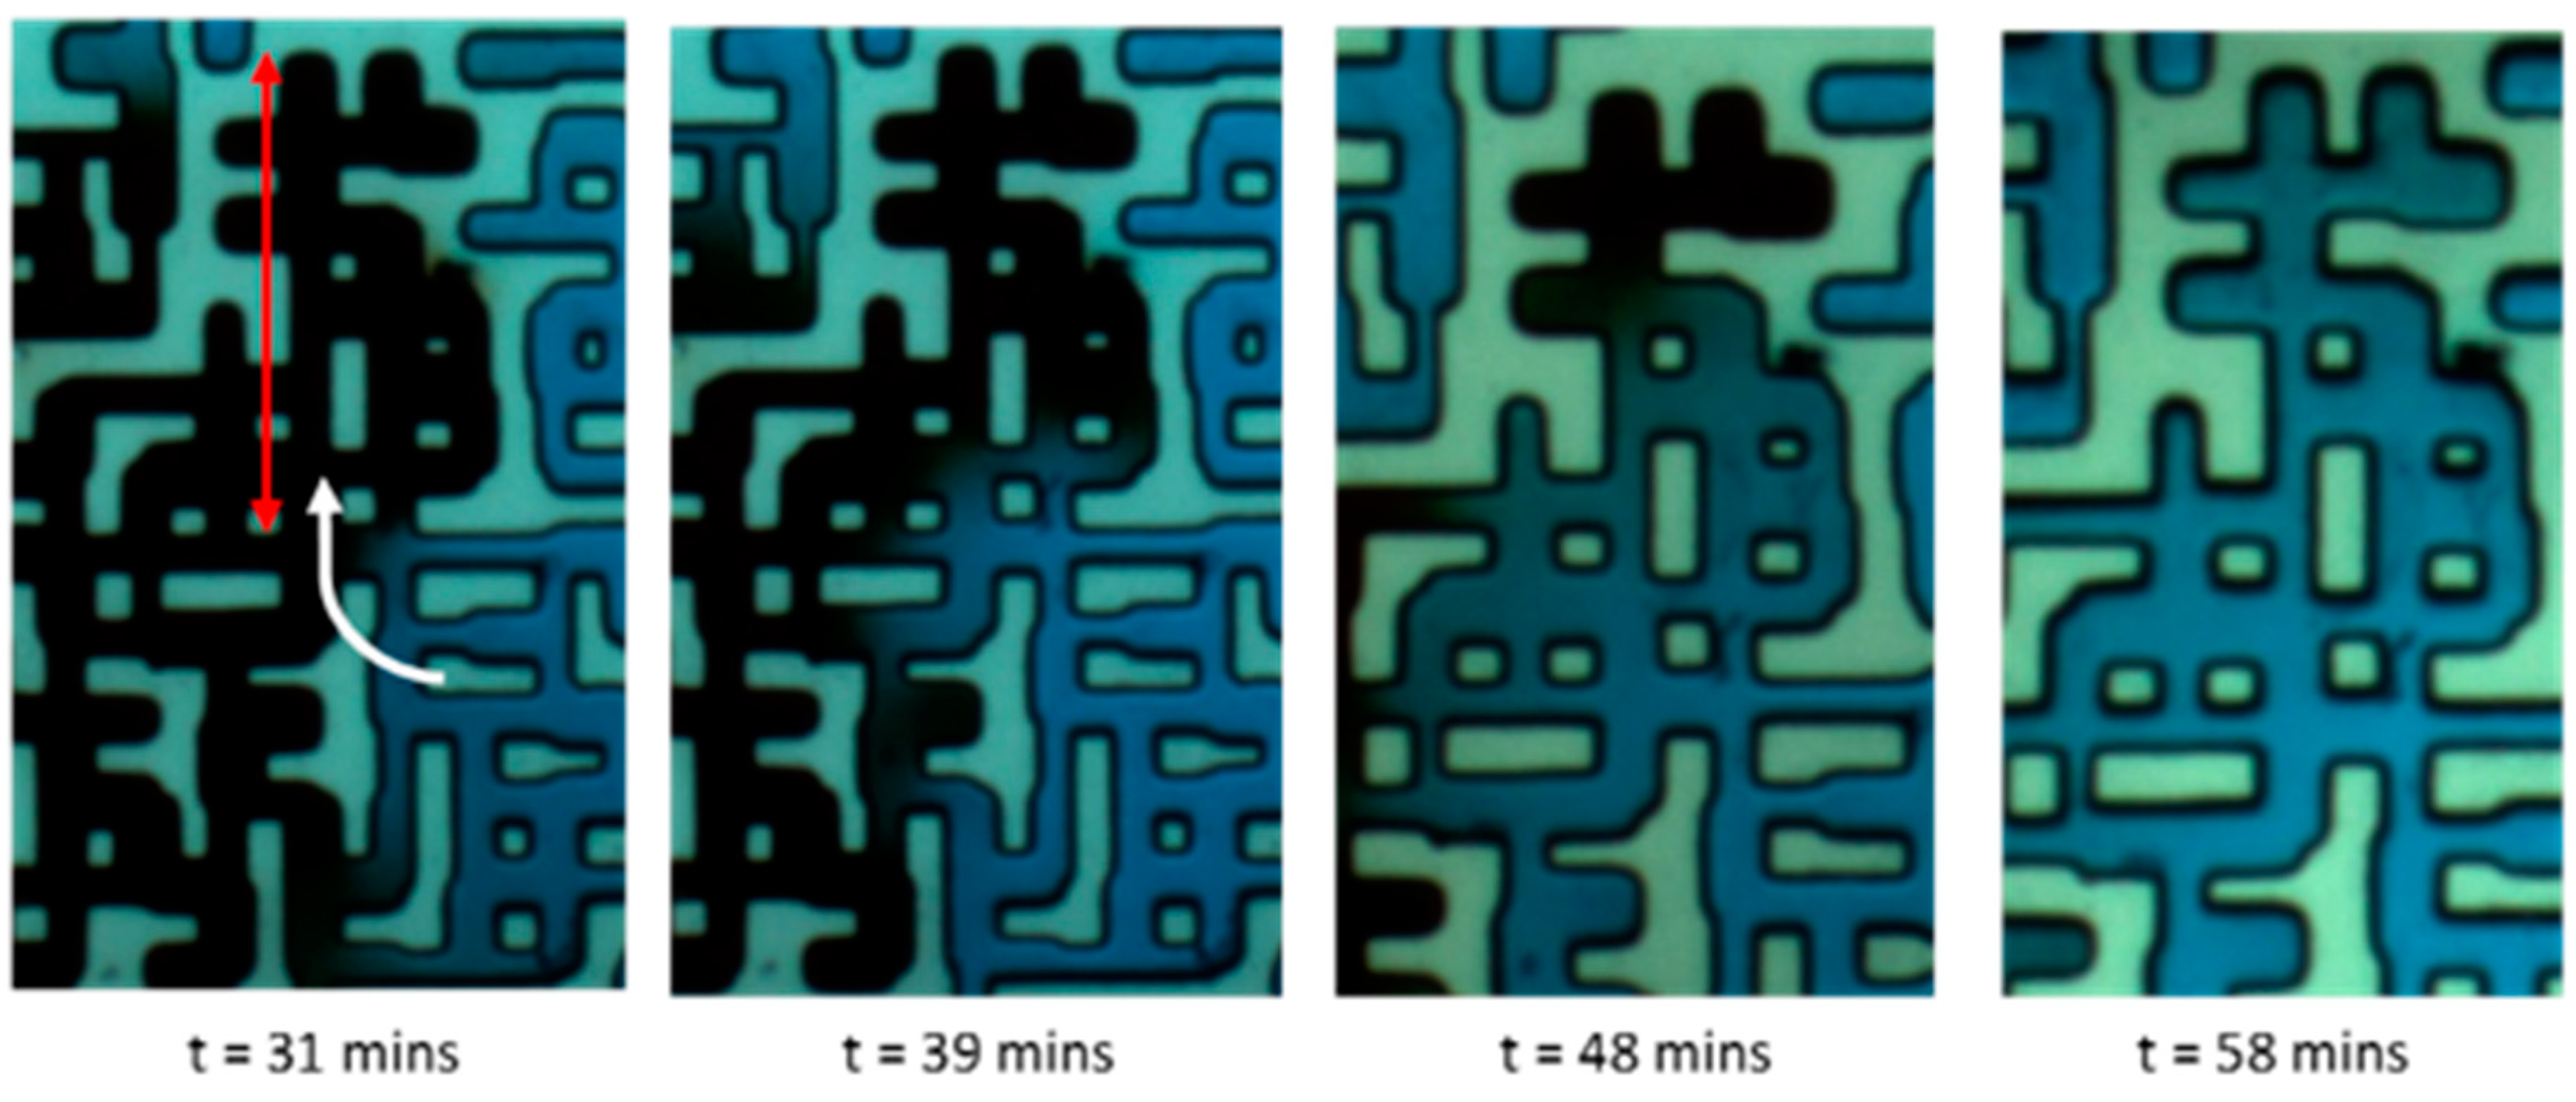
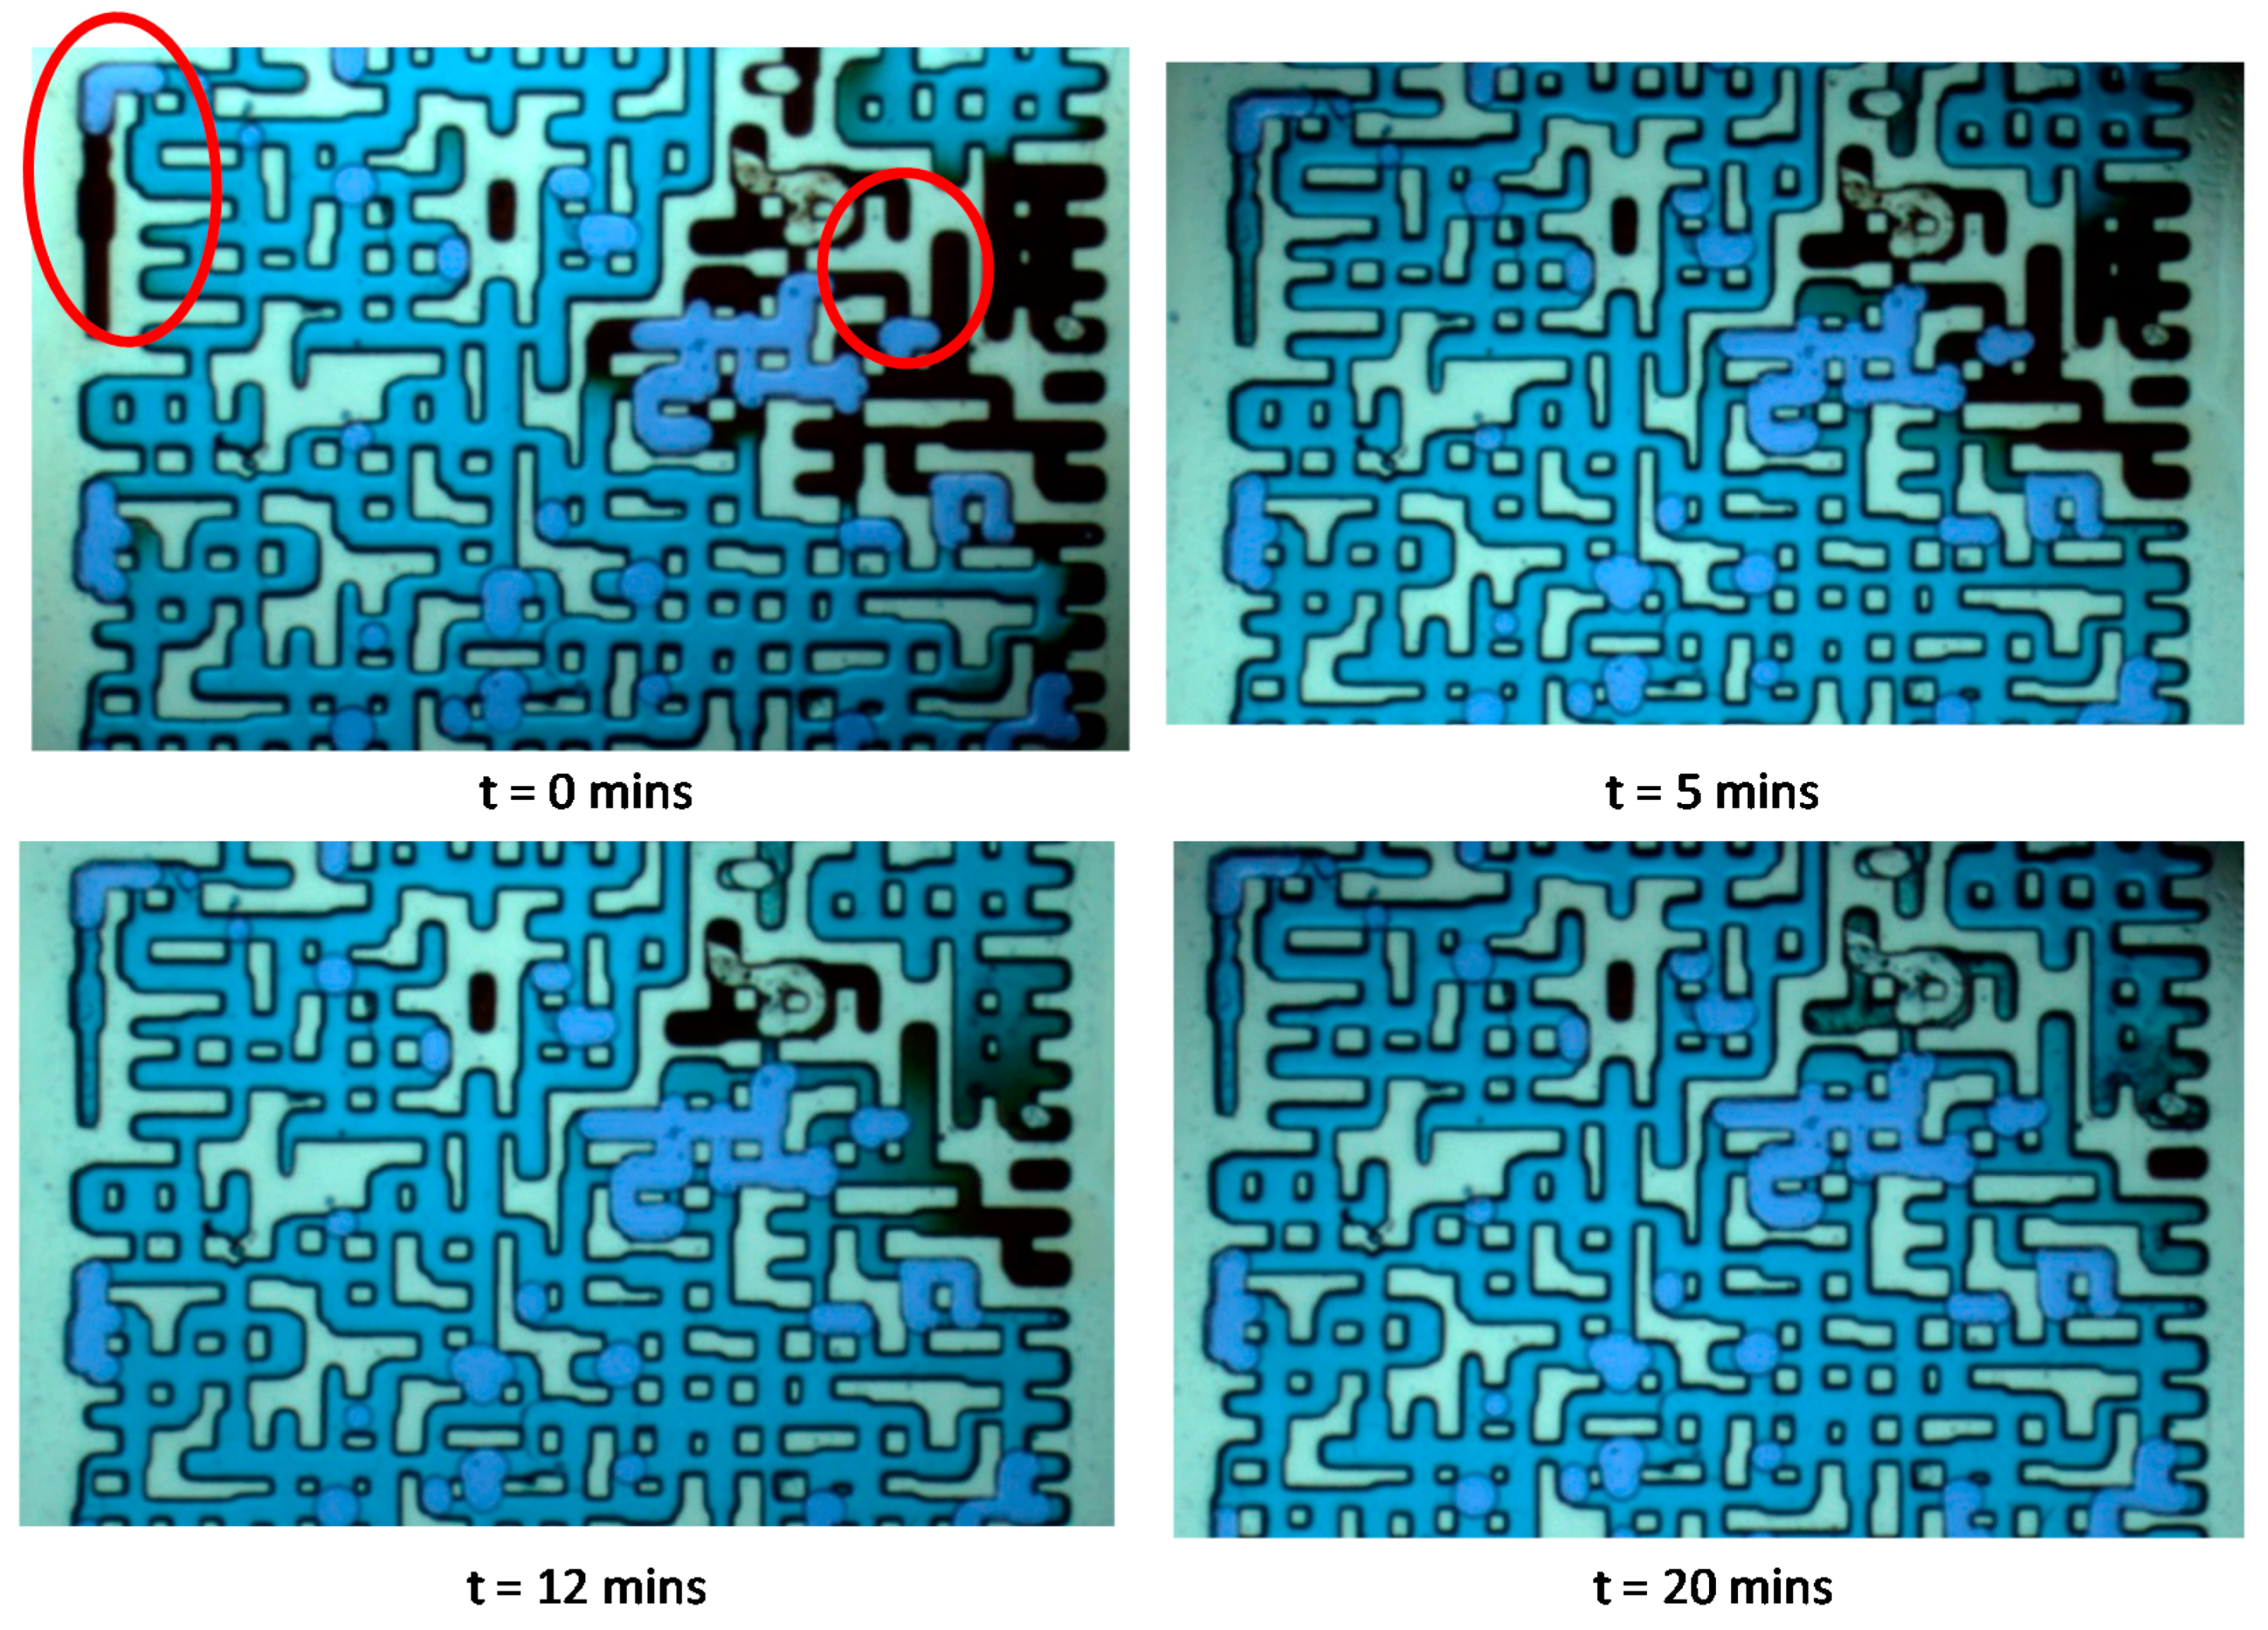
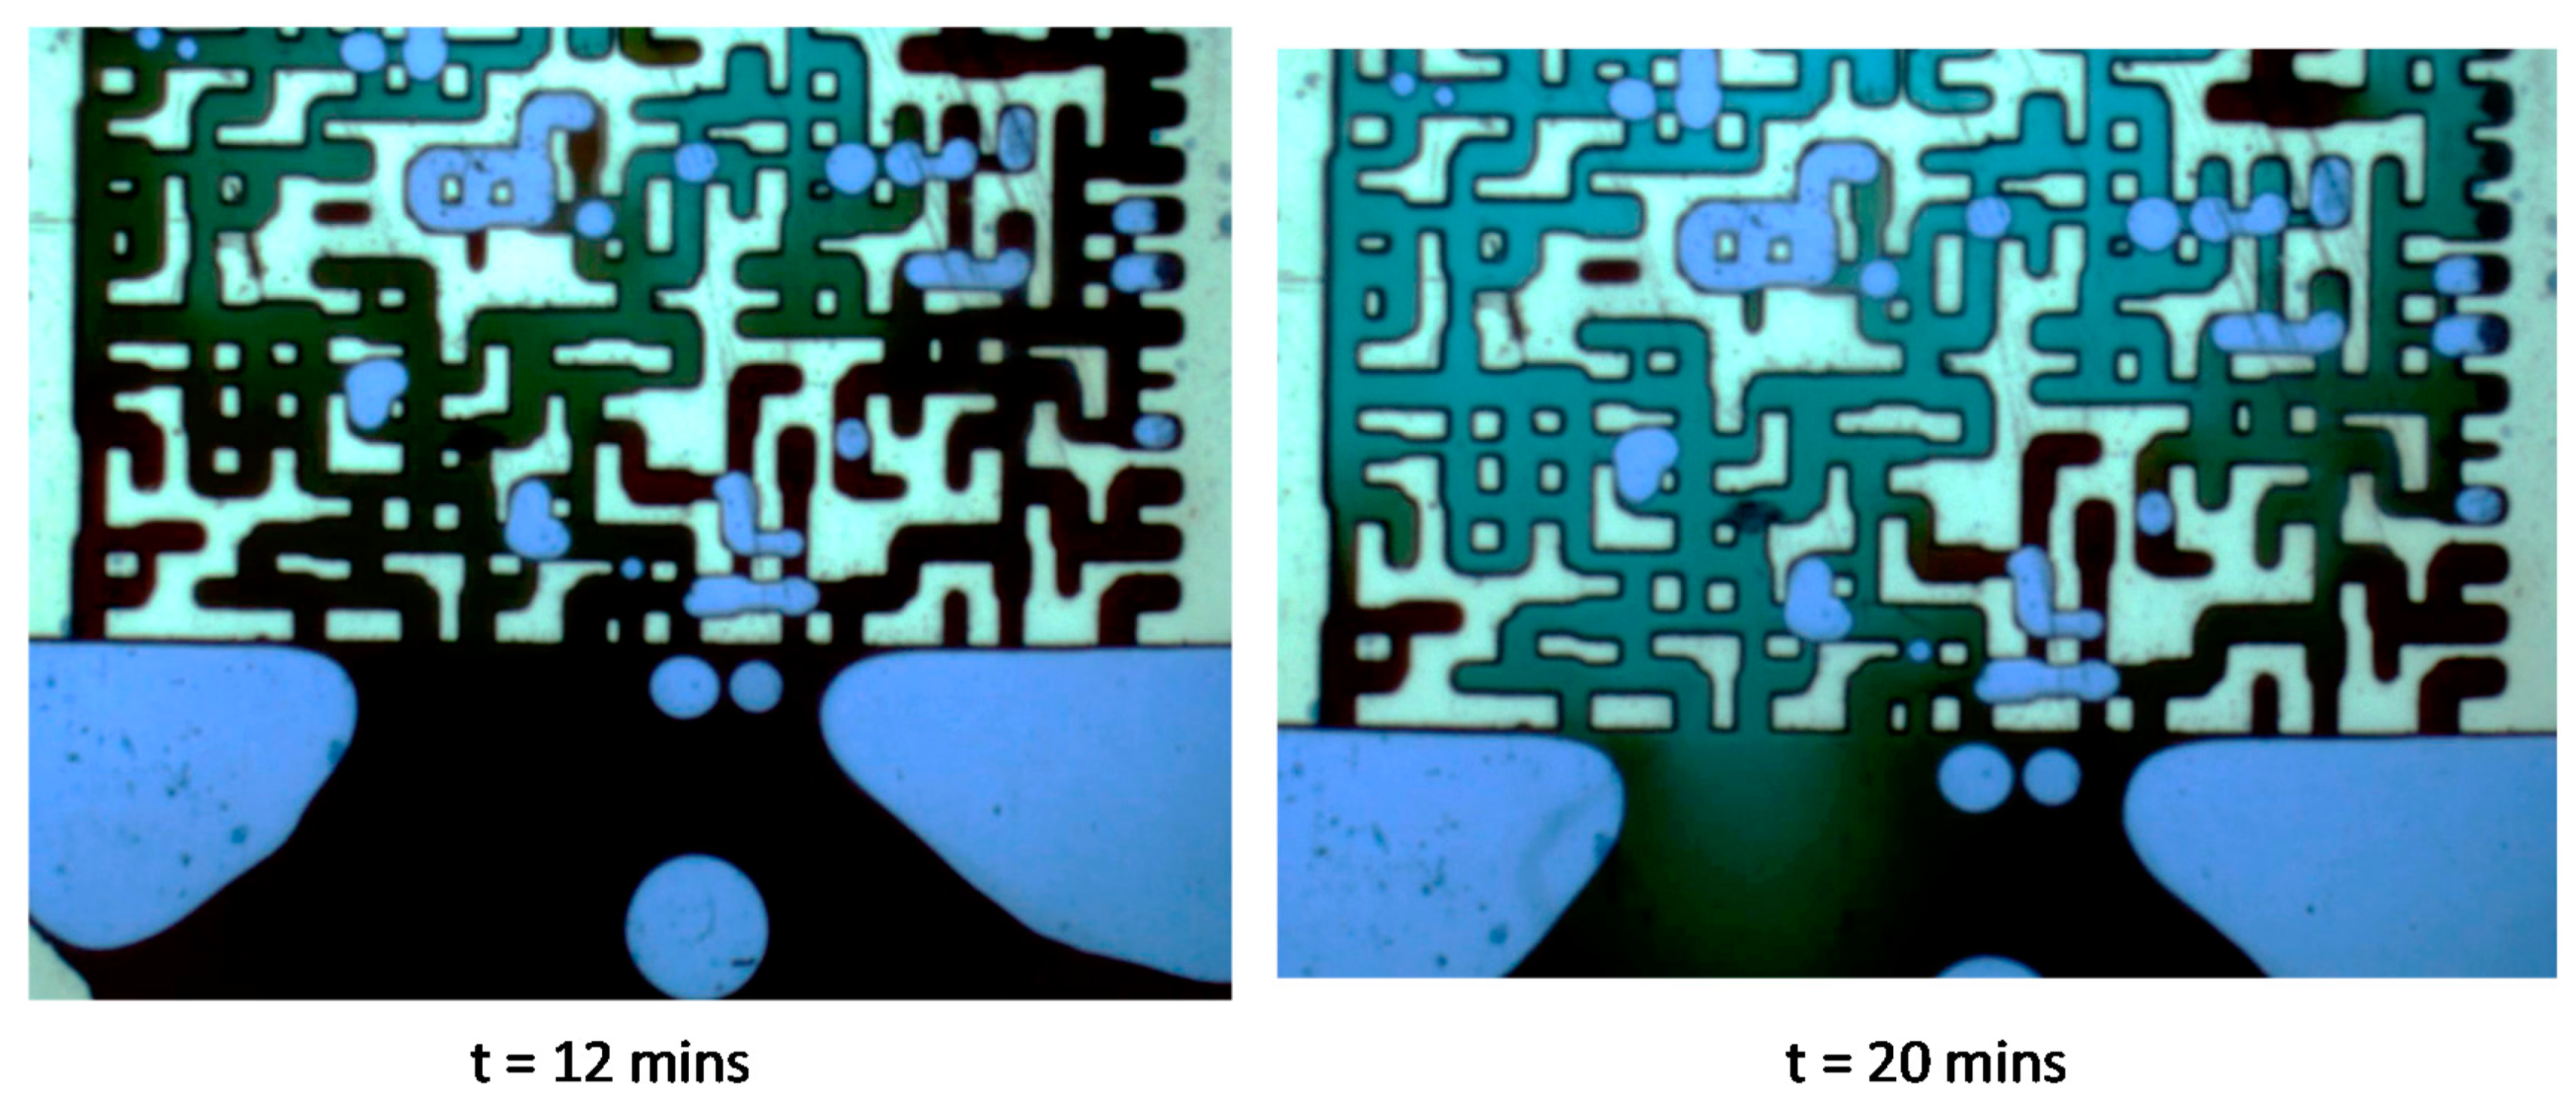
3.2. Case 2: CO2 Mixing in a Residual Oil-Saturated (Sor) System
3.3. General Discussion
4. Future Work
5. Conclusions
- CO2 always found the easiest path through connected pores during mixing, and then CO2 was transported into less connected pores and dead-end pores.
- CO2 transport into dead-end pores was slower than CO2 flow through the preferential path.
- We observed how CO2 was transported through trapped oil ganglia and into the water phase again. It was also observed that oil ganglia dampened the CO2 transport velocity outside the main preferential path.
- CO2 mixing into dead-end pores and less connected pores was diffusion dominant.
Author Contributions
Funding
Institutional Review Board Statement
Informed Consent Statement
Data Availability Statement
Acknowledgments
Conflicts of Interest
References
- Holt, T.; Jensen, J.I.; Lindeberg, E. Underground Storage of CO2 in Aquifers and Oil Reservoirs. Energy Convers. Manag. 1995, 36, 535–538. [Google Scholar] [CrossRef]
- Hendriks, C.A.; Blok, K. Underground Storage of Carbon Dioxide. Energy Convers. Manag. 1993, 34, 949–957. [Google Scholar] [CrossRef]
- Ringrose, P. How to Store CO2 Underground: Insights from Early-Mover CCS Projects; Springer International Publishing: Berlin/Heidelberg, Germany, 2020; p. 129. [Google Scholar]
- Rackley, S.A. Chapter 11—Geological Storage. In Carbon Capture and Storage; Rackley, S.A., Ed.; Butterworth-Heinemann: Boston, MA, USA, 2010; pp. 227–266. [Google Scholar]
- Aminu, M.D.; Nabavi, S.A.; Rochelle, C.A.; Manovic, V. A Review of Developments in Carbon Dioxide Storage. Appl. Energy 2017, 208, 1389–1419. [Google Scholar] [CrossRef] [Green Version]
- Freund, P.; Ormerod, W.G. Progress Toward Storage of Carbon Dioxide. Energy Convers. Manag. 1997, 38, 199–204. [Google Scholar] [CrossRef]
- Kuuskraa, V.A.; Godec, M.L.; Dipietro, P. CO2 Utilization from “Next Generation” CO2 Enhanced Oil Recovery Technology. Energy Procedia 2013, 37, 6854–6866. [Google Scholar] [CrossRef]
- Roefs, P.; Moretti, M.; Welkenhuysen, K.; Piessens, K.; Compernolle, T. CO2-Enhanced Oil Recovery and CO2 Capture and Storage: An Environmental Economic Trade-Off Analysis. J. Environ. Manag. 2019, 239, 167–177. [Google Scholar] [CrossRef]
- Emami-Meybodi, H.; Hassanzadeh, H.; Green, C.P.; Ennis-King, J. Convective Dissolution of CO2 in Saline Aquifers: Progress in Modeling and Experiments. Int. J. Greenh. Gas Control 2015, 40, 238–266. [Google Scholar] [CrossRef]
- Lindeberg, E.; Wessel-Berg, D. Vertical Convection in an Aquifer Column Under a Gas Cap of CO2. Energy Convers. Manag. 1997, 38, S229–S234. [Google Scholar] [CrossRef]
- Gasda, S.E.; Elenius, M.T.; Kaufmann, R. Field-Scale Implications of Density-Driven Convection in CO2-Eor Reservoirs. In Proceedings of the Fifth CO2 Geological Storage Workshop, Utrecht, The Netherlands, 21–23 November 2018; pp. 1–5. [Google Scholar] [CrossRef]
- Both, J.; Gasda, S.; Aavatsmark, I.; Kaufmann, R. Gravity-driven Convective Mixing of CO2 in Oil. In Proceedings of the Third Sustainable Earth Sciences Conference and Exhibition, Celle, Germany, 13–15 October 2015; pp. 1–5. [Google Scholar] [CrossRef]
- Gasda, S.; Elenius, M.T. CO2 Convection in Oil Driven by Non-Monotonic Mixture Density. In Proceedings of the ECMOR XVI—16th European Conference on the Mathematics of Oil Recovery, Barcelona, Spain, 3–6 September 2018; pp. 1–12. [Google Scholar] [CrossRef]
- Elenius, M.T.; Nordbotten, J.M.; Kalisch, H. Convective Mixing Influenced by the Capillary Transition Zone. Comput. Geosci. 2014, 18, 417–431. [Google Scholar] [CrossRef]
- Farajzadeh, R.; Salimi, H.; Zitha, P.L.J.; Bruining, H. Numerical Simulation of Density-Driven Natural Convection in Porous Media with Application for CO2 Injection Projects. Int. J. Heat Mass Transf. 2007, 50, 5054–5064. [Google Scholar] [CrossRef]
- Teng, Y.; Wang, P.; Liu, Y.; Jiang, L.; Wang, D. A Spectrophotometric Method for Measuring Dissolved CO2 in Saline Water. Exp. Fluids 2018, 59, 138. [Google Scholar] [CrossRef]
- Faisal, T.F.; Chevalier, S.; Bernabe, Y.; Juanes, R.; Sassi, M. Quantitative and Qualitative Study of Density Driven CO2 Mass Transfer in a Vertical Hele-Shaw Cell. Int. J. Heat Mass Transf. 2015, 81, 901–914. [Google Scholar] [CrossRef]
- Khosrokhavar, R.; Elsinga, G.; Farajzadeh, R.; Bruining, H. Visualization and Investigation of Natural Convection Flow of CO2 in Aqueous and Oleic Systems. J. Pet. Sci. Eng. 2014, 122, 230–239. [Google Scholar] [CrossRef]
- Kneafsey, T.J.; Pruess, K. Laboratory Flow Experiments for Visualizing Carbon Dioxide-Induced, Density-Driven Brine Convection. Transp. Porous Media 2010, 82, 123–139. [Google Scholar] [CrossRef] [Green Version]
- Lu, G.; Liu, Y.; Jiang, L.; Ying, T.; Song, Y.; Wu, B. Study of Density Driven Convection in a Hele-Shaw Cell with Application to the Carbon Sequestration in Aquifers. Energy Procedia 2017, 114, 4303–4312. [Google Scholar] [CrossRef]
- Thomas, C.; Dehaeck, S.; De Wit, A. Convective Dissolution of CO2 in Water and Salt Solutions. Int. J. Greenh. Gas Control 2018, 72, 105–116. [Google Scholar] [CrossRef]
- Amarasinghe, W.; Fjelde, I.; Rydland, J.-Å.; Guo, Y. Effects of Permeability on CO2 Dissolution and Convection at Reservoir Temperature and Pressure Conditions: A Visualization Study. Int. J. Greenh. Gas Control 2020, 99, 103082. [Google Scholar] [CrossRef]
- Vosper, H.; Kirk, K.; Rochelle, C.; Noy, D.; Chadwick, A. Does Numerical Modelling of the Onset of Dissolution-convection Reliably Reproduce this Key Stabilization Process in CO2 Storage? Energy Procedia 2014, 63, 5341–5348. [Google Scholar] [CrossRef] [Green Version]
- Mahmoodpour, S.; Rostami, B.; Soltanian, M.R.; Amooie, M.A. Effect of Brine Composition on the Onset of Convection During CO2 Dissolution in Brine. Comput. Geosci. 2019, 124, 1–13. [Google Scholar] [CrossRef]
- Amarasinghe, W.S.; Fjelde, I.; Guo, Y. CO2 Dissolution and Convection in Oil at Realistic Reservoir Conditions: A Visualization Study. J. Nat. Gas Sci. Eng. 2021. under review. [Google Scholar]
- Sun, Y.; Kharaghani, A.; Tsotsas, E. Micro-Model Experiments and Pore Network Simulations of Liquid Imbibition in Porous Media. Chem. Eng. Sci. 2016, 150, 41–53. [Google Scholar] [CrossRef]
- Song, Y.; Zhao, C.; Chen, M.; Chi, Y.; Zhang, Y.; Zhao, J. Pore-Scale Visualization Study on CO2 Displacement of Brine in Micromodels with Circular and Square Cross Sections. Int. J. Greenh. Gas Control 2020, 95, 102958. [Google Scholar] [CrossRef]
- Mahzari, P.; Sohrabi, M.; Cooke, A.J.; Carnegie, A. Direct Pore-Scale Visualization of Interactions Between Different Crude Oils and Low Salinity Brine. J. Pet. Sci. Eng. 2018, 166, 73–84. [Google Scholar] [CrossRef]
- Romero-Zeron, L.; Kantzas, A. Pore-Scale Visualization of Foamed Gel Propagation and Trapping in a Pore Network Micromodel. Petsoc-99-07-02 2005, 44, 7. [Google Scholar] [CrossRef]
- Emadi, A.; Sohrabi, M. Visual Investigation of Oil Recovery by Low Salinity Water Injection: Formation of Water Micro-Dispersions and Wettability Alteration. In Proceedings of the SPE Annual Technical Conference and Exhibition, New Orleans, LA, USA, 30 September 2013; p. 15. [Google Scholar] [CrossRef]
- Sohrabi, M.; Henderson, G.D.; Tehrani, D.H.; Danesh, A. Visualisation of Oil Recovery by Water Alternating Gas (WAG) Injection Using High Pressure Micromodels—Water-Wet System. In Proceedings of the SPE Annual Technical Conference and Exhibition, Dallas, TX, USA, 1–4 October 2000; p. 8. [Google Scholar] [CrossRef]
- Campbell, B.T.; Orr, F.M., Jr. Flow Visualization for CO2/Crude-Oil Displacements. SPE-6192-PA 1985, 25, 665–678. [Google Scholar] [CrossRef]
- Hatiboglu, C.U.; Babadagli, T. Pore-Scale Studies of Spontaneous Imbibition into Oil-Saturated Porous Media. Phys. Rev. E 2008, 77, 066311. [Google Scholar] [CrossRef]
- Robin, M.; Behot, J.; Sygouni, V. CO2 Injection in Porous Media: Observations in Glass Micromodels Under Reservoir Conditions. In Proceedings of the SPE Improved Oil Recovery Symposium, Tulsa, OK, USA, 14–18 April 2012; p. 15. [Google Scholar] [CrossRef]
- Farzaneh, S.A.; Sohrabi, M. Visual Investigation of Improvement in Extra-Heavy Oil Recovery by Borate-Assisted CO2-Foam Injection. Transp. Porous Media 2018, 122, 487–513. [Google Scholar] [CrossRef] [Green Version]
- Farzaneh, S.A.; Kharrat, R.; Ghazanfari, M.H. Experimental Study of Solvent Flooding to Heavy Oil in Fractured Five-Spot Micro-Models: The Role of Fracture Geometrical Characteristics. Petsoc-99-07-02 2010, 49, 36–43. [Google Scholar] [CrossRef]
- Zhang, C.; Oostrom, M.; Grate, J.W.; Wietsma, T.W.; Warner, M.G. Liquid CO2 Displacement of Water in a Dual-Permeability Pore Network Micromodel. Environ. Sci. Technol. 2011, 45, 7581–7588. [Google Scholar] [CrossRef]
- Sell, A.; Fadaei, H.; Kim, M.; Sinton, D. Measurement of CO2 Diffusivity for Carbon Sequestration: A Microfluidic Approach for Reservoir-Specific Analysis. Environ. Sci. Technol. 2013, 47, 71–78. [Google Scholar] [CrossRef]
- Liu, N.; Aymonier, C.; Lecoutre, C.; Garrabos, Y.; Marre, S. Microfluidic Approach for Studying CO2 Solubility in Water and Brine Using Confocal Raman Spectroscopy. Chem. Phys. Lett. 2012, 551, 139–143. [Google Scholar] [CrossRef]
- Morais, S.; Cario, A.; Liu, N.; Bernard, D.; Lecoutre, C.; Garrabos, Y.; Ranchou-Peyruse, A.; Dupraz, S.; Azaroual, M.; Hartman, R.L.; et al. Studying Key Processes Related to CO2 Underground Storage at the Pore Scale Using High Pressure Micromodels. React. Chem. Eng. 2020, 5, 1156–1185. [Google Scholar] [CrossRef]
- Sohrabi, M.; Tehrani, D.H.; Danesh, A.; Henderson, G.D. Visualization of Oil Recovery by Water-Alternating-Gas Injection Using High-Pressure Micromodels. SPE-89000-PA 2004, 9, 290–301. [Google Scholar] [CrossRef]
- Rueden, C.T.; Schindelin, J.; Hiner, M.C.; DeZonia, B.E.; Walter, A.E.; Arena, E.T.; Eliceiri, K.W. ImageJ2: ImageJ for the Next Generation of Scientific Image Data. BMC Bioinform. 2017, 18, 529. [Google Scholar] [CrossRef]
- Ennis-King, J.P.; Paterson, L. Role of Convective Mixing in the Long-Term Storage of Carbon Dioxide in Deep Saline Formations. SPE-89000-PA 2005, 10, 349–356. [Google Scholar] [CrossRef]
- Hebach, A.; Oberhof, A.; Dahmen, N. Density of Water + Carbon Dioxide at Elevated Pressures: Measurements and Correlation. J. Chem. Eng. Data 2004, 49, 950–953. [Google Scholar] [CrossRef]
- Efika, E.C.; Hoballah, R.; Li, X.; May, E.F.; Nania, M.; Sanchez-Vicente, Y.; Martin Trusler, J.P. Saturated Phase Densities of (CO2 + H2O) at Temperatures from (293 To 450)K and Pressures up to 64 MPa. J. Chem. Thermodyn. 2016, 93, 347–359. [Google Scholar] [CrossRef] [Green Version]
- Song, Y.; Jian, W.; Zhang, Y.; Shen, Y.; Zhan, Y.; Zhao, J.; Liu, Y.; Wang, D. Densities and Volumetric Characteristics of Binary System of CO2 + Decane from (303.15 to 353.15) K and Pressures up to 19 MPa. J. Chem. Eng. Data 2012, 57, 3399–3407. [Google Scholar] [CrossRef]
- Cadogan, S.P.; Maitland, G.C.; Trusler, J.P.M. Diffusion Coefficients of CO2 and N2 in Water at Temperatures between 298.15 K and 423.15 K at Pressures up to 45 MPa. J. Chem. Eng. Data 2014, 59, 519–525. [Google Scholar] [CrossRef] [Green Version]
- Cadogan, S.P.; Mistry, B.; Wong, Y.; Maitland, G.C.; Trusler, J.P.M. Diffusion Coefficients of Carbon Dioxide in Eight Hydrocarbon Liquids at Temperatures between (298.15 and 423.15) K at Pressures up to 69 MPa. J. Chem. Eng. Data 2016, 61, 3922–3932. [Google Scholar] [CrossRef]
- Lee, A.L.; Ellington, R.T. Viscosity of n-Decane in the Liquid Phase. J. Chem. Eng. Data 1965, 10, 346–348. [Google Scholar] [CrossRef]


| Total Height | Height from Top Pore to Bottom Pore (H) | Width | The Average Depth of Pores | Pore Volume | Wettability | ||
|---|---|---|---|---|---|---|---|
| 70 mm | 51.2 mm | 7 mm | 40 µm | 0.01 cm3 | 0.61 | 10 D | Water-wet |
| Case # | The Initial Condition of the Micromodel |
|---|---|
| 1 | 100% water saturation |
| 2 | Residual oil saturation (Sor) |
| Parameter | Value * | Units | |
|---|---|---|---|
| 384.67 | kg/m3 | ||
| Water | n-decane | ||
| 988.05 | 730 | kg/m3 | |
| 1002.8 [44,45] | 755.2 [46] | kg/m3 | |
| 14.75 | 25.2 | kg/m3 | |
| 3.643 × 10⁻⁹ [47] ** | 6 × 10⁻⁹ [48] ** | m2/s | |
| 5.474 × 10⁻⁴ | 6.9 × 10⁻⁴ [49] | kg/s·m | |
Publisher’s Note: MDPI stays neutral with regard to jurisdictional claims in published maps and institutional affiliations. |
© 2021 by the authors. Licensee MDPI, Basel, Switzerland. This article is an open access article distributed under the terms and conditions of the Creative Commons Attribution (CC BY) license (http://creativecommons.org/licenses/by/4.0/).
Share and Cite
Amarasinghe, W.; Farzaneh, S.; Fjelde, I.; Sohrabi, M.; Guo, Y. A Visual Investigation of CO2 Convective Mixing in Water and Oil at the Pore Scale Using a Micromodel Apparatus at Reservoir Conditions. Gases 2021, 1, 53-67. https://0-doi-org.brum.beds.ac.uk/10.3390/gases1010005
Amarasinghe W, Farzaneh S, Fjelde I, Sohrabi M, Guo Y. A Visual Investigation of CO2 Convective Mixing in Water and Oil at the Pore Scale Using a Micromodel Apparatus at Reservoir Conditions. Gases. 2021; 1(1):53-67. https://0-doi-org.brum.beds.ac.uk/10.3390/gases1010005
Chicago/Turabian StyleAmarasinghe, Widuramina, Seyed Farzaneh, Ingebret Fjelde, Mehran Sohrabi, and Ying Guo. 2021. "A Visual Investigation of CO2 Convective Mixing in Water and Oil at the Pore Scale Using a Micromodel Apparatus at Reservoir Conditions" Gases 1, no. 1: 53-67. https://0-doi-org.brum.beds.ac.uk/10.3390/gases1010005