
Effects of the Henry Hub Price on U.S. LNG Exports and on Gas Flows in Western Europe


1
Stadtwerke München GmbH, Emmy-Noether-Str. 2, 80992 Munich, Germany
2
IT & Technology, IU International University of Applied Sciences, Juri-Gagarin-Ring 152, 99084 Erfurt, Germany
3
Department of Service Information Systems Engineering, TU Ilmenau, Ehrenbergstraße 29, 98693 Ilmenau, Germany
*
Author to whom correspondence should be addressed.
Gases 2021, 1(2), 68-79; https://0-doi-org.brum.beds.ac.uk/10.3390/gases1020006
Submission received: 10 January 2021
/
Revised: 12 March 2021
/
Accepted: 19 March 2021
/
Published: 25 March 2021
(This article belongs to the Special Issue Liquefied Natural Gas: Value Chain Enhancements)
Abstract
:Natural gas plays an important role in energy supply, and its fields of application are diverse. However, the world’s largest growth potential among fossil fuels is attributed to liquefied natural gas (LNG). In the last few years, the U.S. rapidly increased LNG exports, and it is expected that they will further increase the liquefaction capacities. The cost of the LNG value chain is composed of the natural gas price in the country of origin, and the LNG process costs for liquefaction, transportation, storage, and regasification. Thus, the Henry Hub (HH) price in the U.S. is important for U.S. LNG exports to Western Europe. In this paper, gas flows in Western Europe at the beginning of the 2030s are analyzed if the price at HH is higher or lower than expected. Furthermore, the effect of the HH price on monthly U.S. LNG exports are studied. For the calculations, the global gas market model WEGA is used. The results reveal that the price at HH has a significant effect on annual gas flows in Western Europe and also on U.S. LNG exports during the summer. Furthermore, it is shown that pipeline gas in Western Europe will absorb fluctuations of U.S. LNG exports between the presented scenarios.
1. Introduction and Related Work
Natural gas plays an important role in energy supply and its fields of application are diverse: heat generation, hot water preparation, power generation and industrial applications. BP expects annual growth for natural gas of 1.7% worldwide by 2040 [1]. However, the world’s largest growth potential among fossil fuels is attributed to liquefied natural gas (LNG). In 2019, the global LNG market grew by 13% to 510 billion cubic meters (bcm) [2]. An important region for imports of LNG is Western Europe [3]. Even if gas demand in Western Europe is expected to fall by 2040, with some studies also forecasting relatively constant gas demand, a significant decline in domestic production in Western Europe is to be expected, so that the dependency on gas imports is increasing in the long-term. The additional import demand for Western Europe will be met primarily by LNG and pipeline gas from the North Sea and Russia [1,4,5,6].
With a market share of 10% of global LNG exports in 2019, the U.S. will rank third behind Qatar (22%) and Australia (21%) [2]. The U.S. has reached this position in a very short time. The first cargo of LNG was exported in 2016 from Cheniere Energy’s Sabine Pass export terminal in Louisiana [7]. It is expected that the U.S. is further increasing its liquefaction capacities [3]. This will strengthen the role of U.S. LNG as a marginal supplier in Western Europe.
The LNG value chain consists of exploration and production of natural gas, transportation of natural gas to the LNG liquefaction terminal, liquefaction, transportation of LNG to a regasification terminal, storage, and regasification [8]. The cost of LNG is, therefore, composed of the price for natural gas in the country of origin and the remaining LNG process costs of the value chain mentioned above. For U.S., LNG exports the price at the Henry Hub (HH) trading point in the U.S. should be used, because this trading hub is very liquid, and most of the U.S. LNG export terminals are located in this region.
When analyzing gas markets, a distinction must be made between the long run marginal costs (LRMC) and the short run marginal costs (SRMC). If an investor expects in long-term to sell LNG not below the LRMC, he would invest in a new LNG export terminal; an investor would operate an existing LNG export terminal as long as he earns the SRMC.
Assuming in long-term for exports to Western Europe 10 /MWh for natural gas at HH and a further 12 /MWh as LRMC for the complete LNG process [9,10], then the total cost of U.S. LNG in Western Europe is 22 /MWh. If the gas price in Western Europe were to be significantly higher than 22 /MWh in the long run, further export terminals would be built in the U.S. If it were below the 22 /MWh in the long-term, the construction of further export terminals in the U.S. would be abandoned, and the existing export capacities would be used to supply more attractive markets [11]. If no buyer can be found who is willing to pay the LRMC, the LNG costs can fall to the SRMC. The SRMC for U.S. LNG exports consists of the HH price, 15% margin (handling fee) on the HH price and approximately 3 /MWh for transport and regasification. Assuming 10 /MWh for gas at HH, the SRMC for U.S. LNG exports to Western Europe is 14.50 /MWh. The fee for the export terminal was paid in advance and can be considered as sunk costs. It is, therefore, not part of the SRMC. In addition, the transport costs may vary. For example, if the LNG tanker was paid in advance for two years, these are also sunk costs. Only the bunker fuel is still part of the SRMC. As long as an existing U.S. export terminal earns its SRMC, it is operated. However, if the revenue is below the SRMC, the terminal will be shut down. These examples show that the price at HH is important for U.S. LNG exports and for worldwide gas markets.
Due to the role of the HH price in the U.S. for Western Europe, the question arises, how gas flows are changing at the beginning of the 2030s in Western Europe if the price at HH is higher or lower than expected. Furthermore, the effect of the HH price on monthly U.S. LNG exports should be analyzed. In this paper, the price at HH is modified by ±20%. These calculations are based on more extensive analyses with further modifications of the HH price. Results with changes of less than ±20% on the HH price are relatively linear to the presented results in this work. However, changes of ±30% or more could not be seen in isolation. Such relatively extreme modifications would result in completely different worldwide energy scenarios which are not part of this work. In this work, the HH price is modified in a base case scenario. All other parameters of this scenario are fixed. A further modification of the HH price while fixing other parameters would lead to inconsistent scenarios. Variations of the HH price may happen if a cold winter in North America occurs or due to fluctuations of the oil price and its effect on fracking activities in the U.S. The period of 2032 till 2034, with a focus on 2033, is chosen for this research, because of the actual LNG glut and the reduced demand for natural gas due to the Coronavirus pandemic. In the actual situation of low gas prices and low gas demand, investment decisions in LNG liquefaction and regasification terminals are postponed and the recovery of the market takes time [12]. However, there is some uncertainty about the exact timing of the recovery and the possibility of a new glut on LNG at the end of this decade. Nevertheless, for the period of 2032 to 2034, it can be expected that the market is again in balance, and all postponed investments will be realized. In this paper, situations are analyzed were the modifications on the HH price by ±20% were not expected, and all investment decisions were already made. Thus, only the HH price is modified in the calculated scenarios compared to the base case, and all other parameters are identical between the scenarios.
Studies by other authors mostly focused on sales opportunities for U.S. LNG or on Russia’s strategy regarding the HH price and U.S. LNG export volumes. Henderson [13] analyzed, in 2012, price differentials between U.S. LNG to the European and Asian markets. Henderson and Mitrova [14], in 2015, and Corbeau and Yermakov [15], in 2016, developed different options for Russia. In addition, in 2016, Cornot-Gandolphe [11] argued on the basis of the SRMC and LRMC of U.S. LNG and presented strategies for Gazprom. Mitrova and Boersma [16] used four scenarios in 2018 regarding oil price levels and gas demand in Asia and derived strategies for Gazprom. One year later, Richman and Ayyılmaz [17] analyzed strategic decisions with a game theoretic approach. A review of gas flows in Western Europe in the 2030s and an analysis of monthly U.S. LNG export volumes at changing HH price levels have not yet been carried out by the aforementioned studies. Furthermore, no gas market model has been used in these studies to calculate detailed gas flows.
Nevertheless, gas market models have also been applied to analyze the effects of U.S. LNG and shale gas on global gas markets and on the U.S. gas market. The Rice World Gas Trade Model (RWGTM) was applied in 2011 by Medlock, Jaffe, and Hartley [18], and one year later by Medlock [19]. RWGTM is a dynamic spatial general equilibrium model and was developed using Marketbuilder from Deloitte Marketpoint. Scenarios with different volumes of shale gas production were analyzed with this model. However, the assumptions for U.S. production volumes were too low and it was calculated that the U.S. will import LNG in long-term, even in the 2030s. In 2014, Morydee, Gabriel, and Avetisyan [20] applied the World Gas Model (WGM) to analyze effects of U.S. LNG exports on global natural gas markets. WGM is a large-scale game theoretic model and was developed with cooperation from Deutsches Institut für Wirtschaftsforschung (DIW) in Berlin. Results for annual production volumes, prices, and LNG imports and exports in different regions were presented, but the assumed wholesale prices in North America were significantly higher than the actual price level and the actual price forecasts for this region. Lower wholesale gas prices in North America will probably lead to different results. In the same year, Bordoff and Houser [21] used their own versions of three models from the U.S. Energy Information Administration: the World Energy Projection System Plus (WEPS+), the National Energy Modeling System (NEMS), and the International Natural Gas Model (INGM). They calculated three scenarios for U.S. LNG export volumes in the 2020–2025 time frame and presented the effects on revenues and expenditures for different regions in the world, as well as results for the market share of European gas suppliers. Baron et al. [22] applied the Global Natural Gas Model (GNGM) for long-term analyses in 2015. They calculated U.S. LNG export prices and export volumes in 63 scenarios. However, gas flows in Western Europe and monthly export volumes of U.S. LNG were not studied. In 2020, Holz and Kemfert [23] from DIW used the Global Gas Model (GGM) to calculate annual U.S. LNG export volumes in six scenarios. GGM is an equilibrium model with more than 90 countries. It covers a time horizon until 2060 in five-year steps using only summer and winter seasons [24]. Thus, this model is not able to calculate daily or monthly gas flows. Actual values for U.S. gas demand, U.S. gas production, export volumes of U.S. LNG and gas prices at HH are presented in the 2021 Annual Energy Outlook of the U.S. Energy Information Administration (EIA) [25]. The model NEMS [26] was used for these calculations. It can be concluded that detailed European gas flows and monthly export volumes of U.S. LNG were not provided by the aforementioned gas market models. The analyses in this paper are performed with the global gas market model WEGA (abbreviation of Weltweites Gasmarktmodell) of Stadtwerke München GmbH (SWM). With this model, worldwide gas flows and gas prices can be calculated in daily resolution for different scenarios. However, it should be noted that gas prices cannot be published due to internal regulations of SWM.
This paper is structured as follows: In the following section, the gas market model WEGA is explained, followed by a description of the base case scenario in Section 3. Section 4 then discusses the results of the base case compared to scenarios with a 20% higher and a 20% lower price of HH. A summary of the main results concludes this paper.
2. Gas Market Model WEGA
Gas market models can be divided into two classes: On the one hand, there are models in which market power is exercised by the players and, on the other hand, models which operate with full competition. For an overview of gas market models, see the work of Chyong and Hobbs [27], Holz, von Hirschhausen, and Kemfert [28], and the work of the Energy Modeling Forum [29], as well as the work of Busch [30]. The WEGA gas market model works with perfect foresight and full competition. Market power of individual players and investment decisions are fixed in scenarios.
WEGA is a global gas market model. The mapping of global gas flows is important, as the increasing trade in LNG means that markets can no longer be viewed in isolation. According to BP, LNG will account for a larger share of global gas trade than pipeline gas in the long-term [1]. Gas market models with a regional focus, which, for example, only consider North America or Europe and consider LNG flows as external parameters, therefore, do not reflect reality with sufficient accuracy.
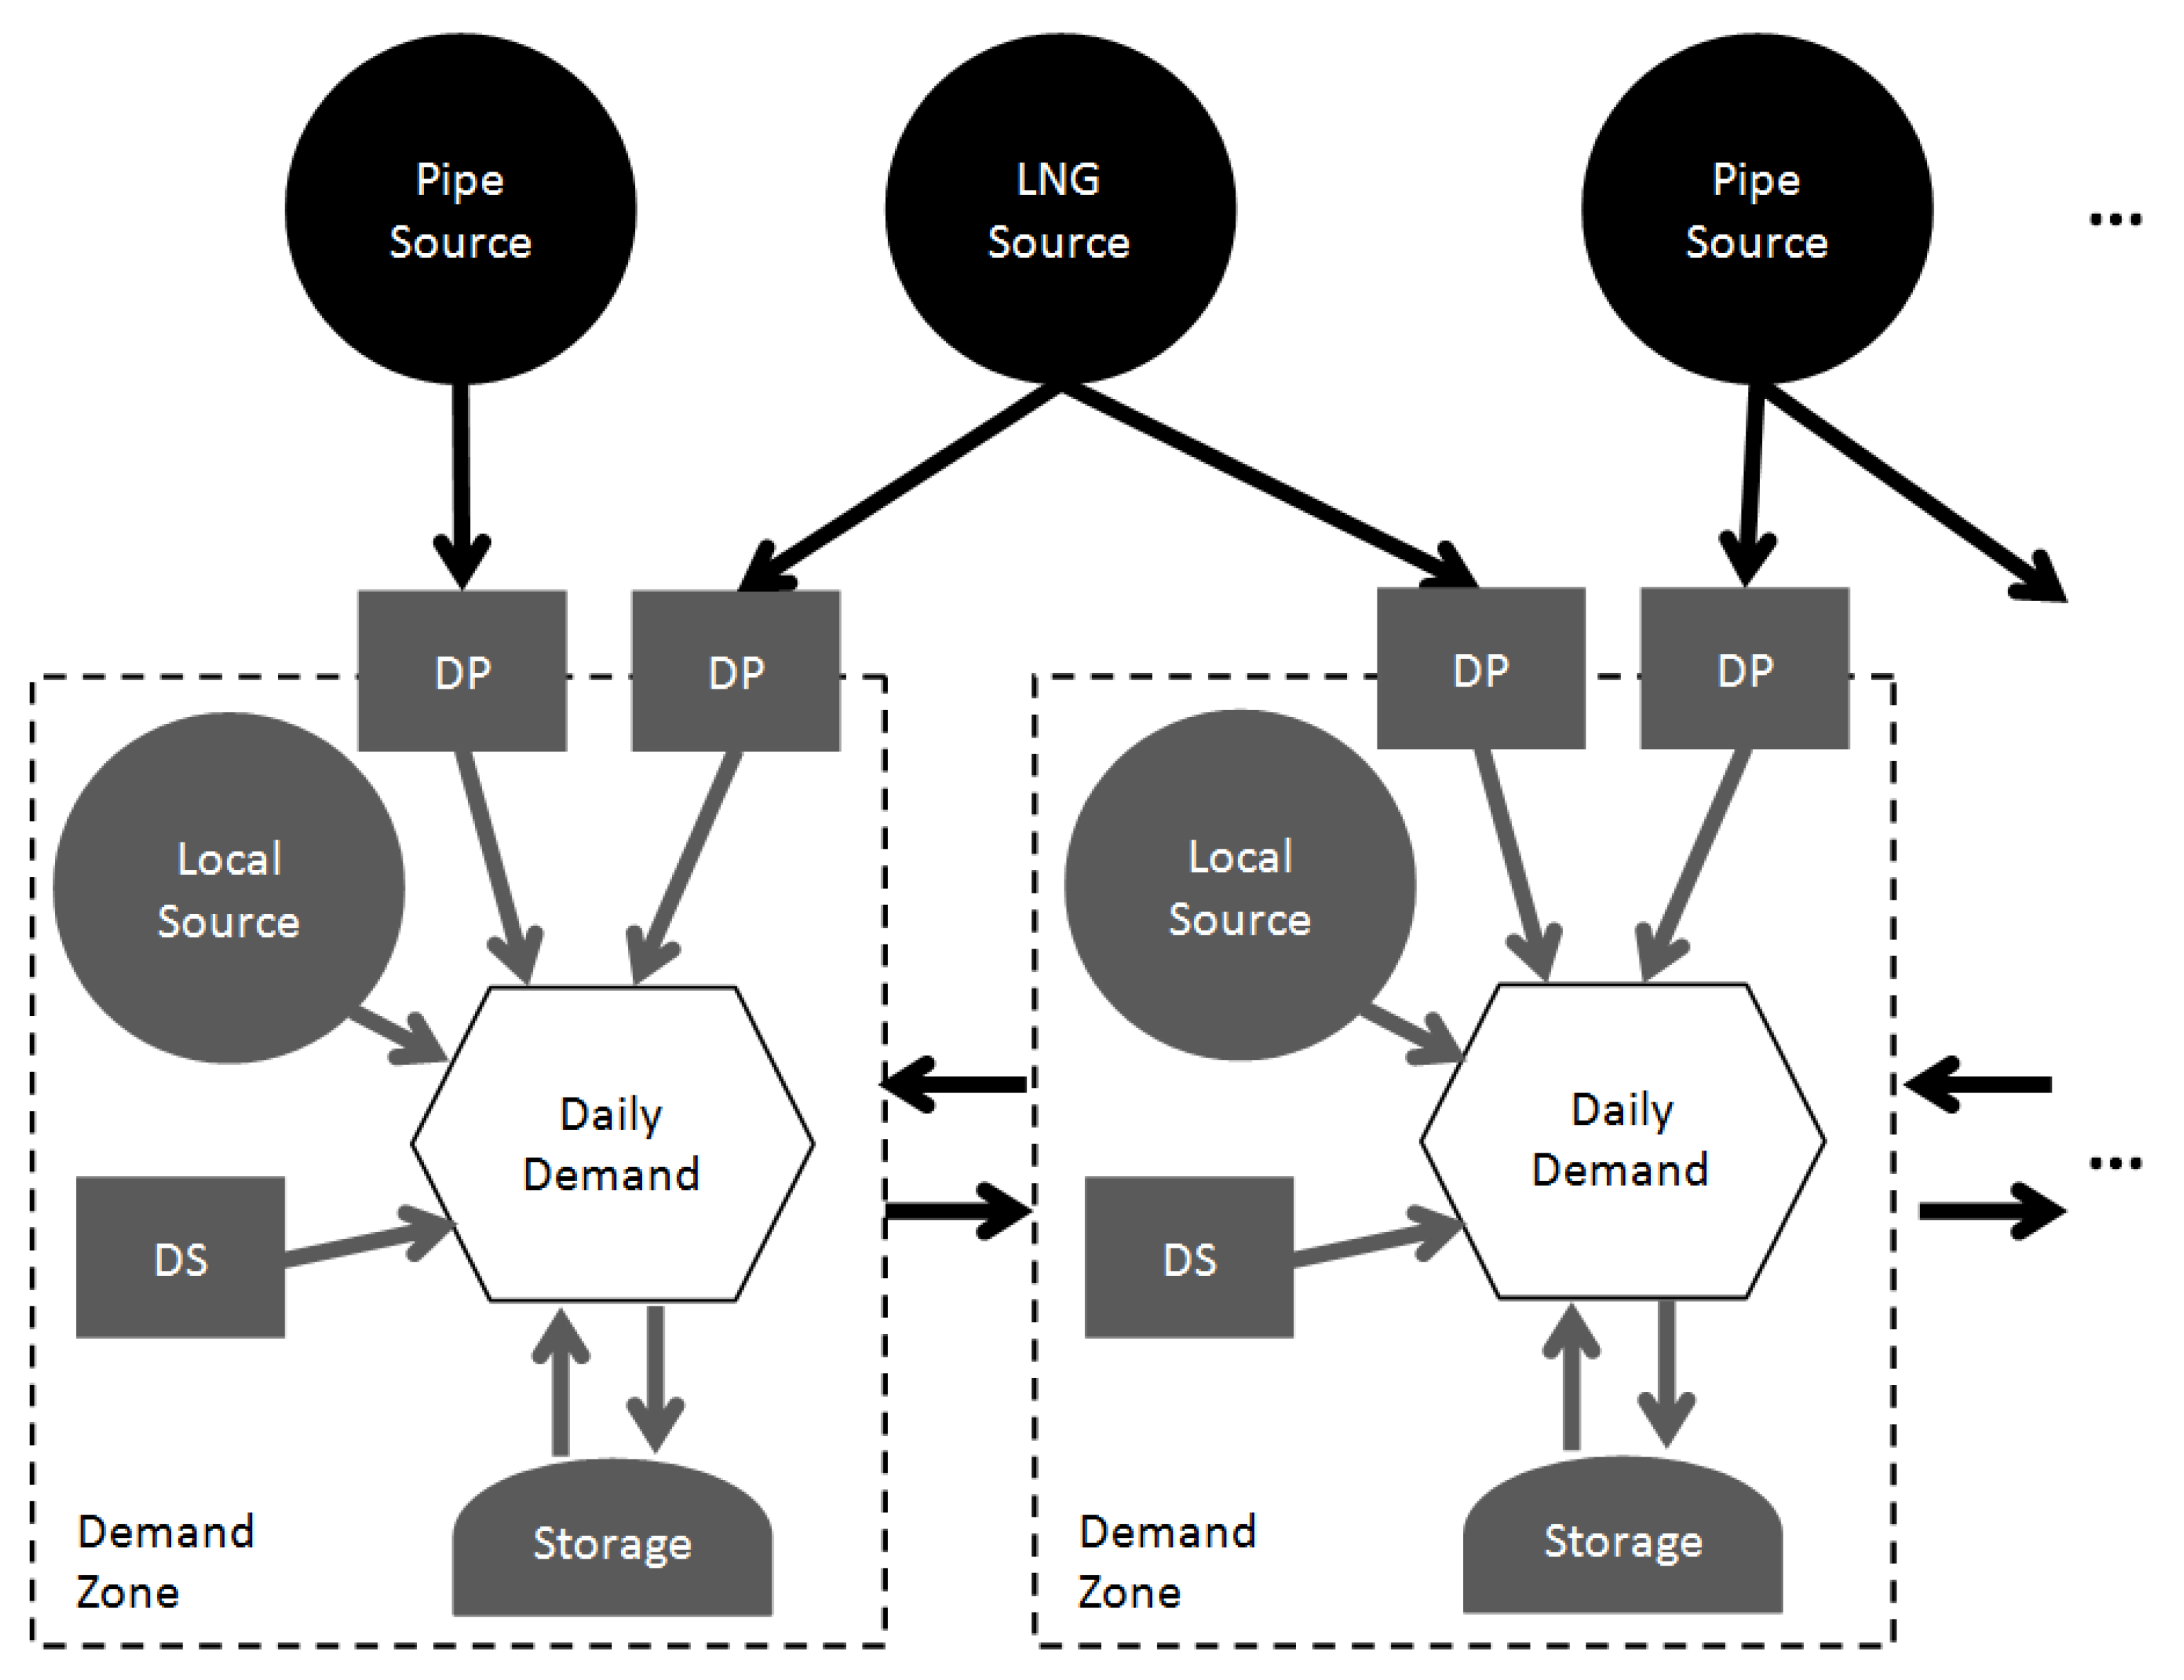
With the help of different types at nodes and edges, the worldwide gas market is mapped in WEGA. An example is depicted in Figure 1. A distinction is made between the nodes. There are nodes for demand zones which can be countries, regions, or trading points. For example, NCG in Germany or HH in the U.S. are mapped as trading points in the model. Another example is the region Southeast Europe where some small countries with low gas demand are merged to a group. Each demand zone is assigned a daily gas demand until 2040. To model gas fields nodes for local sources in demand zones, pipe sources or LNG sources are used. Gas fields have a production capacity, production costs and production profiles during the year (e.g., seasonal production profiles at the Groningen gas field). Other nodes are, e.g., gas storages, pipeline or LNG delivery points (DP), and flexibility options (DS) with coal gas switching and demand shedding. There are also many different edges for the connection between the nodes. In addition, LNG sources (LNG liquefaction terminals) can be connected with edges to several regasification terminals. Similarly, a source can have several pipelines to transport gas, e.g., from Norway to Germany and the UK.
The model also contains a database of long-term sale and purchase agreements (SPAs). SPAs have a start date and an end date. They also include flexibility options, take-or-pay clauses and individual pricing formulas. These price formulas take into account an oil price indexation, a hub indexation, or a mixture of both. Any renegotiations of contracts can also be deposited. WEGA assumes a slow shift from oil price indexed contracts to hub indexed contracts or hybrid contracts [31].
Linear Programming (LP) is widely used to model energy systems and there are several applications of LP in modeling natural gas markets [28,29,30]. Therefore, the dispatching model WEGA was created with LP in the Xpress Optimization Suite. A scenario until 2040 is calculated by WEGA on an RX600 with 1 TB RAM and 32 × 2 GHz in about 25 min. Each gas year is optimized separately by the model, whereby the gas year is broken down into individual days . The goal of the optimization is to minimize the total cost C to cover the daily gas demand of a gas year (see Equation (1)). The total costs consist of the daily production costs , transport costs , storage costs , and flexibility costs .
There are numerous hard constraints to be met in minimizing overall costs. A constraint is the coverage of the gas demand of each demand zone z on each day d. The daily gas demand of a demand zone is covered by inflows and outflows of the pipelines belonging to the demand zone, LNG regasification terminals, or LNG export terminals, interconnectors, storage facilities, and flexibility options. There are also inflows from own production within the demand zone. Other hard constraints refer to the previously mentioned properties of nodes, edges, and contracts. For example, the maximum capacity of a pipeline or LNG regasification terminal may not be exceeded. Contractual agreements arising from SPAs must also be observed.
SWM has been using the WEGA gas market model since 2013 to analyze global gas flows and gas prices until 2040. The consulting firm ÅFRY developed the model under the name Pegasus [32,33] and uses it for its own analyses and for the preparation of its own fee-based reports. In 2013, the source code of the purchased gas market model was analyzed by SWM and test cases were calculated to ensure that the model worked accurately. Parameters, e.g., about pipelines, interconnectors, storages, LNG terminals, etc., were also checked with data from primary sources and with commercial datasets from other commercial providers. To ensure that WEGA is up to date, SWM obtained annual data updates from ÅFRY and modified them with its own assumptions. For example, SWM has its own assumptions on the development of the oil price, exchange rates, marginal costs of storage facilities, gas demand, and production volumes from individual sources. These modifications are based on SWM analyses, e.g., from their own European electricity model for the gas demand of the power sector. Other input parameters are based on publicly accessible sources or come from other commercial providers, some of which maintain their own gas market models. For this reason, the results of this work are not the view of ÅFRY.
For plausibility checks of the results, NetConnect Germany (NCG), National Balancing Point (NBP), and Title Transfer Facility (TTF) future prices are frequently calculated to make sure that WEGA is generating accurate market prices for the next years. Furthermore, long-term price forecasts from other commercial gas market models are recalculated by WEGA with the corresponding parameters of the other commercial models. In addition, results of WEGA are frequently discussed with experts of SWM and consulting companies, e.g., regarding the long-term strategy of Russia, the value of flexibility or the effects of hydrogen on gas flows and gas prices. However, the results of WEGA are based on assumptions about parameters in the future, which are subject to uncertainties. These uncertainties include, e.g., political, regulatory, and technological aspects, as well as possible changes in interest rates, exchange rates, the construction of assets, and gas demand. Thus, changes to the presented scenarios would lead to different results.
3. Description of the Base Case
For the experiments of this work, a base case scenario in WEGA is generated. With regard to gas demand, the base case is grounded on the New Policies Scenario of the World Energy Outlook [5]. This results in a drop in demand for Europe of about 15% between 2018 and 2040. In the same period, indigenous production in Europe falls to about 40% of the 2018 level and production in Norway falls to 55% of the 2018 level. Furthermore, it is assumed that the projects from the Ten-Year Network Development Plan (TYNDP) of ENTSOG [42] and Nord Stream 2 are built. Further, according to the ’No Change/Manipulation’ strategy of Mitrova and Boersma [16] Gazprom is not adjusting its pricing policy. Based on own sensitivity analyses, this strategy seems to be optimal for Russia.
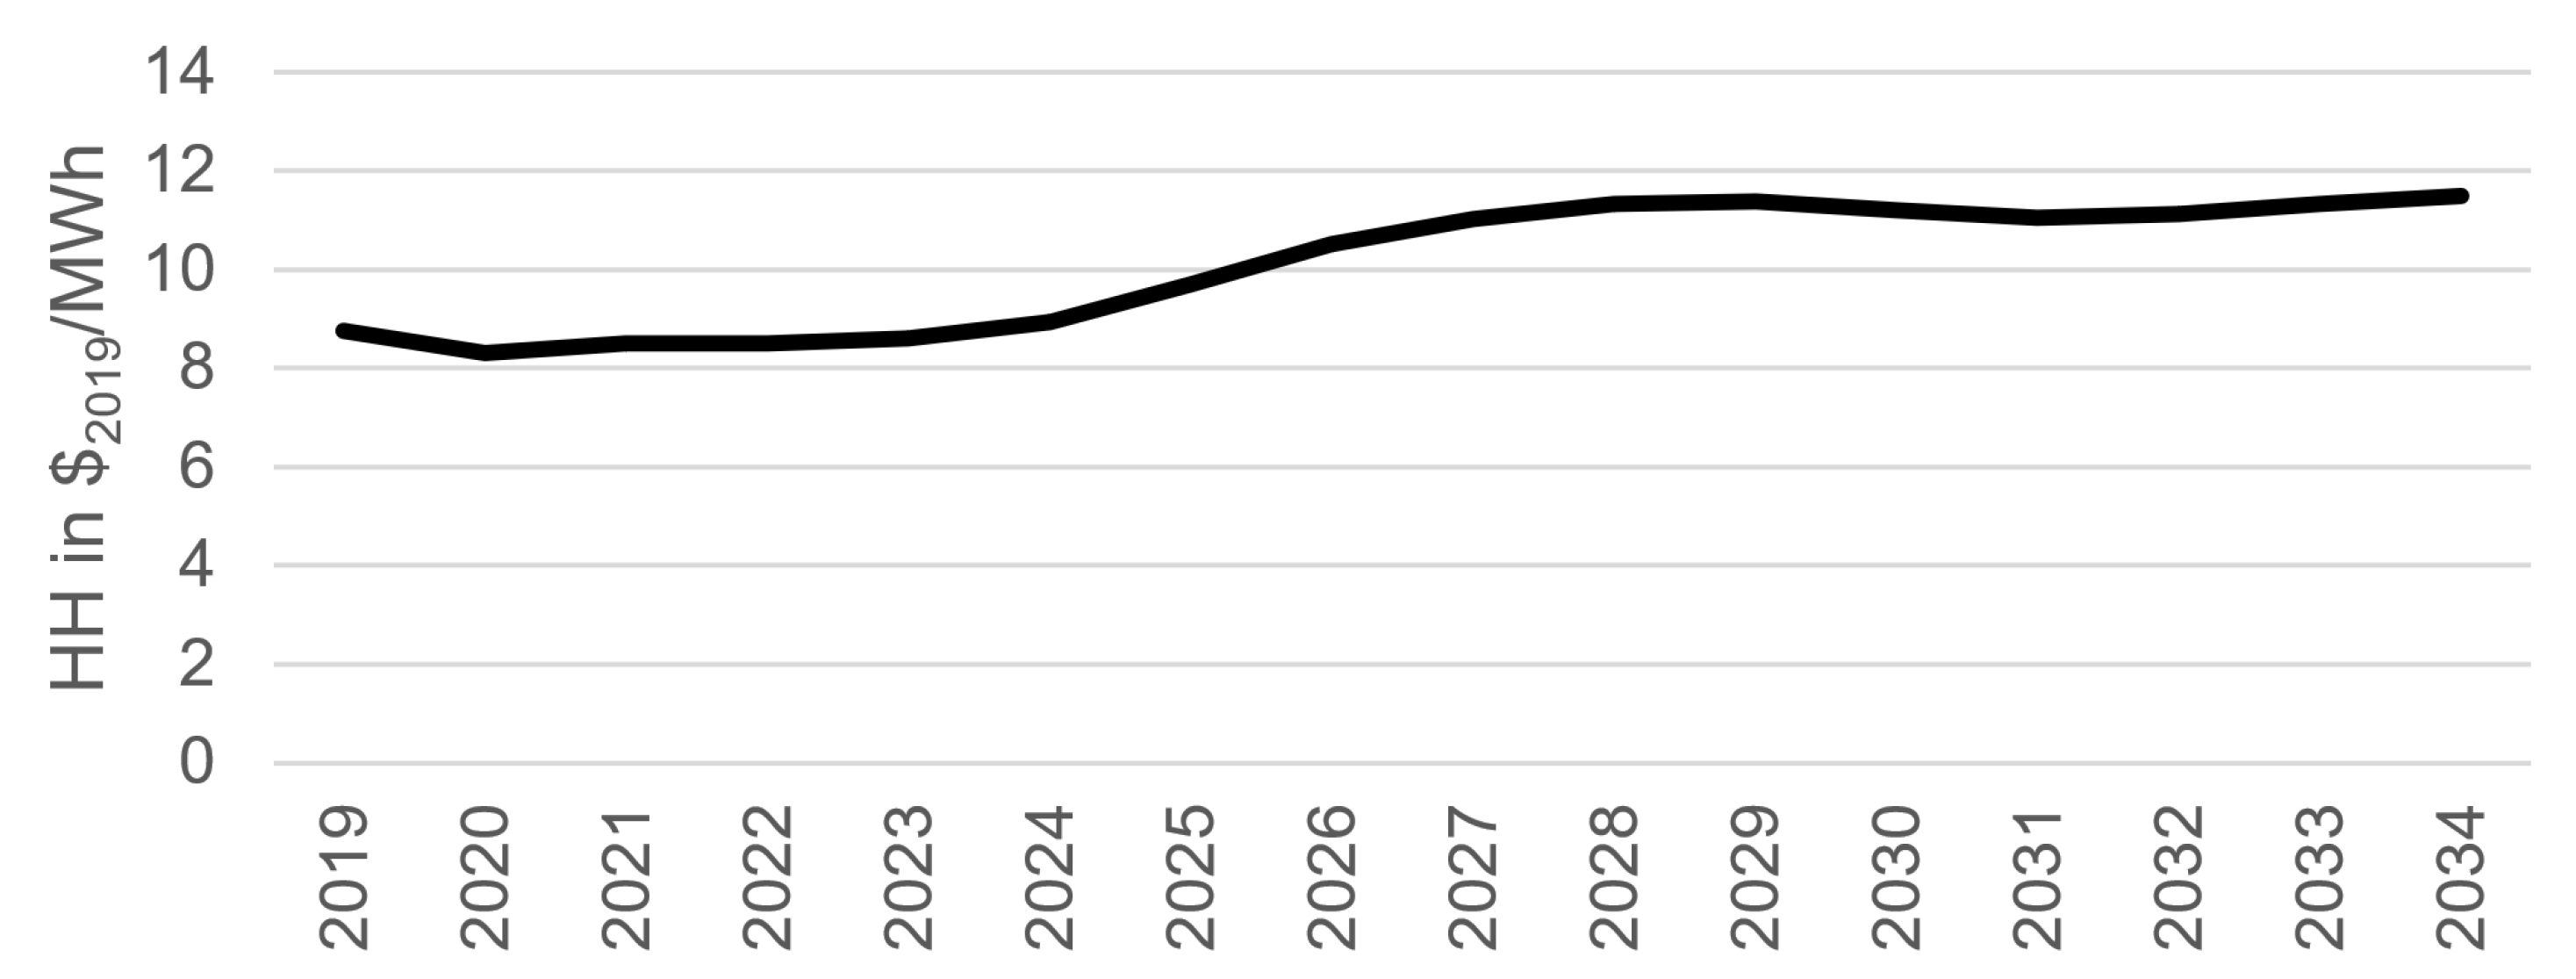
The price at HH in the base case is depicted in Figure 2 [43]. It can be seen that HH is not significantly increasing in 2019 real terms after the mid-20s. It has to be noted that an increasing gas demand in the U.S. due to more LNG exports would not necessarily lead to a significant increasing price of HH in long-term [44,45]. This is due to additional technological advances in the future, the huge resource base of natural gas in the U.S. with a relatively flat merit order, a strong oil production with low cost associated gas, and a further de-bottlenecking by constructing additional pipelines [43,44,46]. However, the HH price is sensitive if the supply side should be limited, e.g., by a ban of fracking in some U.S. states, restrictions for land use, or by less technological advances than expected in the upstream sector [43].
According to BP [47], global gas demand in 2019 was 3929 bcm, with total Europe having 554 bcm, a share of 14.1%. The three largest consumers in Western Europe are Germany with 88.7 bcm, the UK with 78.8, and France with 43.4 bcm in 2019. LNG imports in 2019 mainly from Qatar, Russia, North Africa, and the U.S. to total Europe amounted to 119.8 bcm, with the UK importing 18.0 bcm and France importing 22.9 bcm of LNG. Germany, has no LNG import terminal. However, Germany and the other countries in Western Europe are well connected with pipelines, and there is sufficient LNG import capacity available. The trading hubs are liquid, and gas demand is covered, besides LNG imports by a relatively strong, but declining indigenous production and by pipeline imports.
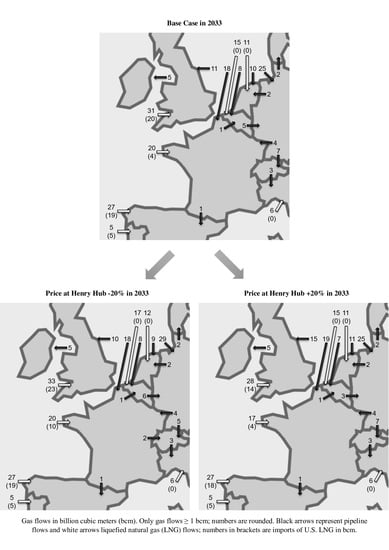
Figure 3 shows gas flows of the base case in Western Europe for 2033. These gas flows in bcm are calculated with WEGA. Black arrows indicate pipeline flows and white arrows LNG imports; the numbers in brackets show U.S. LNG imports. Furthermore, gas flows are rounded and also aggregated to reduce the number of arrows, e.g., France has more than one LNG import terminal, but one white arrow in Figure 3. With 48 bcm, U.S. LNG plays an important role for Western Europe in 2033. It is mainly delivered to UK, France, Spain, and Portugal. Other LNG sources for Western Europe are, besides Algeria, especially Qatar and Russia. An essential source to cover the daily gas demand in Western Europe is also pipeline gas from the North Sea which is delivered to UK, France, Belgium, the Netherlands, and Germany.
4. Results and Discussion
To answer our research questions, two further scenarios were created in addition to the base case: one scenario HH +20% and one scenario HH −20%. In both scenarios, only the price at HH was changed compared to the base case. All other parameters, such as investment decisions, demand for natural gas, or exchange rates, are identical between the three scenarios.
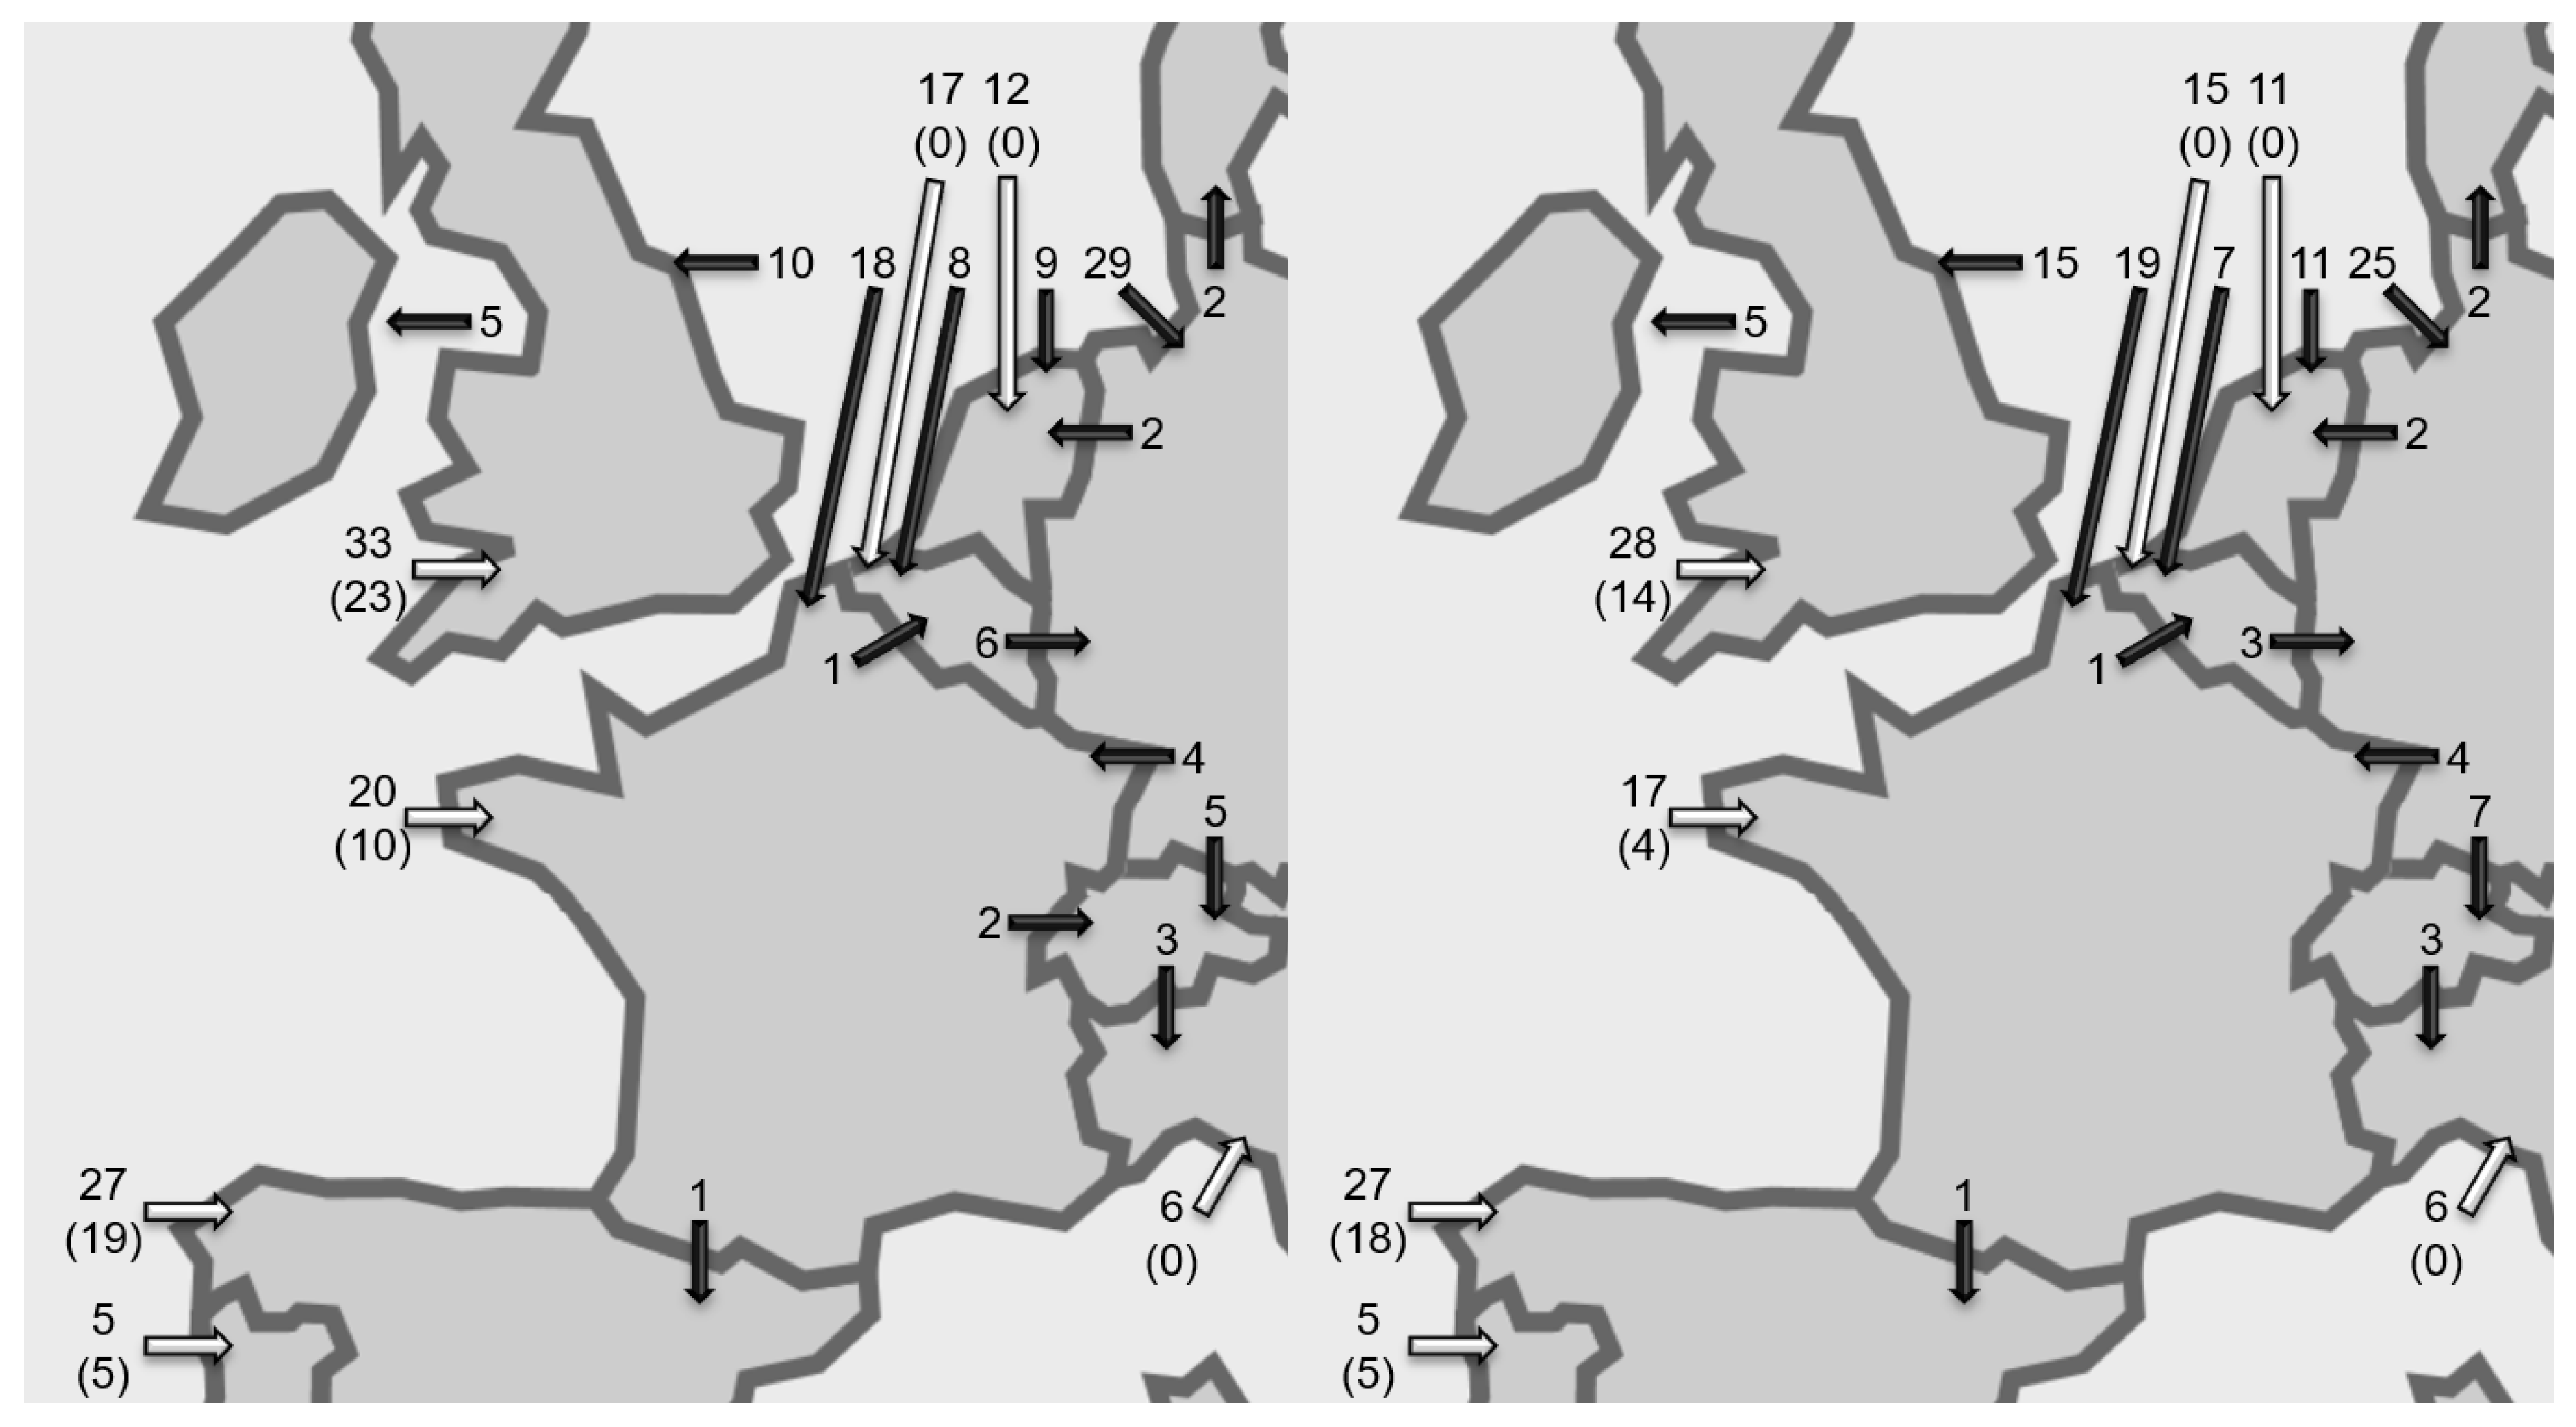
Results of the calculations with WEGA for 2033 are presented in Figure 4. The left side shows the gas flows in Western Europe with a 20% reduced gas price for HH compared to the base case. On the right side, however, the price at HH was increased by 20% compared to the base case. A comparison of both maps shows changed volumes for U.S. LNG imports, especially in the UK and France. For example, in 2033, at HH −20%, 57 bcm of U.S. LNG will be imported into Western Europe, compared to only 41 bcm at HH +20%. This represents a decrease of 28%. LNG imports in 2033 from Algeria, Qatar and Russia are only decreasing by 5 bcm in the HH +20% scenario compared to the HH −20% scenario. This is a relatively small reduction as LNG from these countries, especially from Qatar and Russia, is very competitive. Baron et al. [22] came to the same conclusion. LNG from Qatar and Russia is located further to the left in the merit order for Western Europe than US LNG. When discussing about the construction of LNG regasification terminals in Germany to reduce imports of Russian pipeline gas [48,49], it should be noted that Russian LNG is very competitive in comparison to U.S. LNG. Nevertheless, U.S. LNG displaces other LNG suppliers in Western Europe if its competitiveness is increased by a lower HH price. It can also be seen in Figure 4 that the fluctuations in U.S. LNG imports in Western Europe between the two scenarios are mainly absorbed by pipeline gas, as the demand for gas in the scenarios has not changed and must be met. Specifically, pipeline gas from the North Sea will be directed more to the UK than to Germany if LNG imports in Western Europe decrease. Germany in turn will then receive more gas imports from the East. Thanks to Germany’s very good connections to its neighboring countries and via Nord Stream 1 & 2 directly to Russia, there is sufficient free capacity for these additional deliveries. In principle, gas from the North Sea acts like a pendulum, swinging more strongly towards the UK when LNG imports to Western Europe are lower and more strongly towards Germany when LNG imports are higher.
U.S. LNG is not only exported to Western Europe, but also to Poland, Chile, Japan, South Korea, India, and Taiwan, among others. In Table 1, the U.S. LNG quantities delivered to Western Europe, Asia, and South America are shown in bcm. While the export quantities hardly differ between the scenarios for South America, the greater differences in absolute and percentage terms occur in Western Europe, followed by Asia. The fluctuations in Asia are exports to Japan and South Korea. It can, therefore, be concluded that changes in the HH price have an effect on global LNG flows, with Western Europe being the most flexible in terms of U.S. LNG supply volumes in response to changes in the HH price. This is due to the fact that especially in Western Europe other competitive sources of gas are available to meet gas demand. These include pipeline gas from the North Sea, North Africa, and Russia but also LNG from other suppliers, such as Algeria, Qatar, and Russia. Western Europe, in particular, has a large number of LNG import terminals that are not fully utilized even in the early 2030s, so that there would be enough capacity for additional LNG imports. The same applies to the pipeline system in Western Europe, which is also very well developed. Additional flexibility is provided in Western Europe by the large number of coal and gas-fired power plants, so that a coal-gas switch takes place when gas prices are very low. Depending on the price of LNG, Western Europe acts like a sponge and can absorb LNG relatively flexible compared to Asia and South America. The presented U.S. LNG export volumes to Europe in Table 1 are higher than the results of Holz and Kemfert [23]. The reason is that Holz and Kemfert assumes a much stronger declining rate for the European gas demand in comparison to the base case scenario in this work.
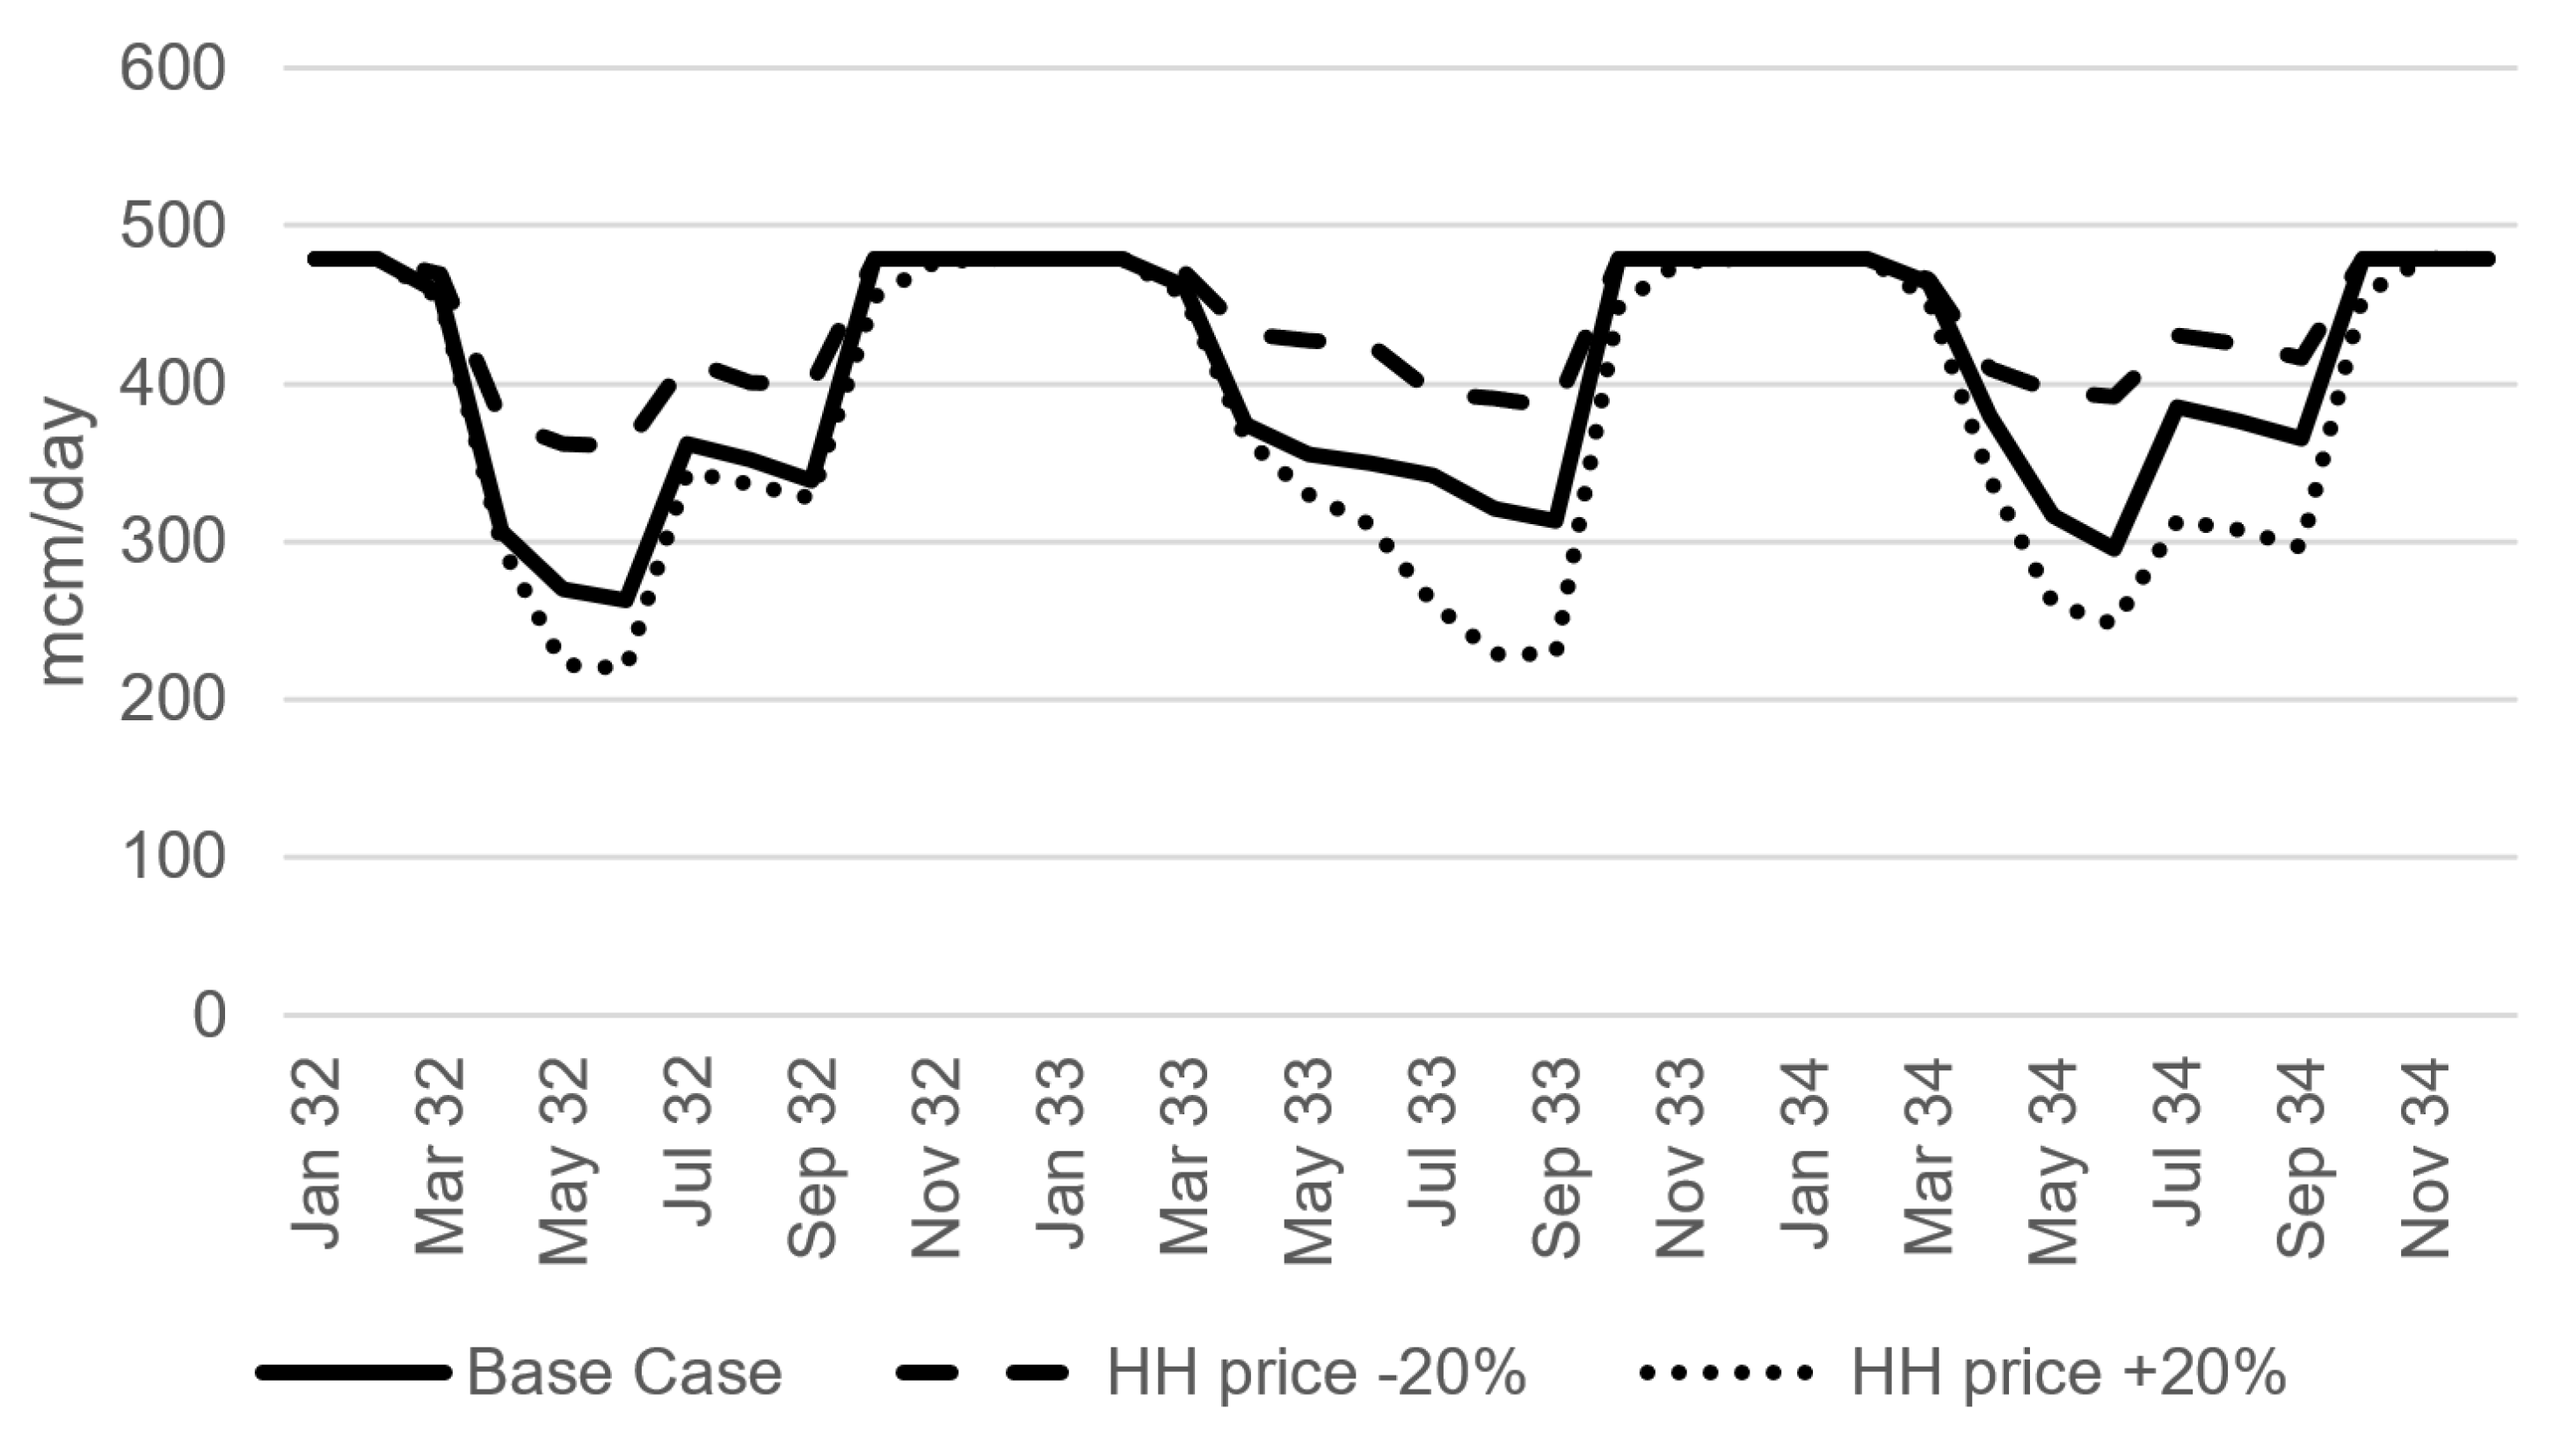
When comparing the monthly U.S. LNG exports in million cubic meters (mcm) per day in Figure 5, it is noticeable that the export volumes hardly differ between the three scenarios during the winter months. This is because the global demand for natural gas from September to March is so high that U.S. LNG is competitive in all three scenarios and always finds a buyer, even at HH +20%. The U.S. LNG export terminals are, therefore, fully utilized in winter. In the scenario with HH −20%, U.S. LNG is cheaper compared to the other two scenarios and finds a buyer more often in the other months due to the lower price level. Sales volumes are, therefore, highest in this scenario. The phase with lower utilization of the U.S. export terminals can be used for maintenance work. At HH +20%, however, the effect mentioned in the introduction temporarily occurs that U.S. export terminals also operate below the LRMC as long as they earn their SRMC. This situation occurs, for example, in August 2033. The overall costs of U.S. LNG are less competitive in Western Europe, and U.S. exporters have to reduce prices below LRMC. However, since Western Europe also has other competitive suppliers with a certain degree of price flexibility, such as Norway and Russia, the utilization of the U.S. LNG export terminals is lower than in the base case, despite a reduction in U.S. LNG prices below LRMC at HH +20%.
WEGA supplies the gas prices and gas flows for all relevant countries in the world in daily resolution. Multiplying the U.S. LNG volumes delivered to the respective target countries worldwide by the corresponding hub prices of these countries for 2033, it is possible to estimate which of the three presented scenarios will generate the largest revenue for the U.S. In terms of turnover, the base case scenario comes off best. For HH −20% sales are 2% lower and for HH +20% sales are 4% lower. The example of HH −20% shows that higher export volumes do not overcompensate the now lower prices worldwide in terms of sales. If the costs for the natural gas at the HH in the respective scenario are deducted from the turnover, the profit is obtained plus the LNG process costs, such as margin, liquefaction, transport, and regasification. In order to exclude the influence of changed total process costs due to more or less LNG exports, this value is then divided by the total export quantity of U.S. LNG per scenario. Again, the base case scenario comes out best in this analysis. For HH −20%, the value is 3% worse, and, for HH +20%, it is 5% worse. It can be concluded that the base case scenario is the best for the U.S. in terms of maximizing sales and profits. The HH −20% scenario would only be optimal if it were possible not to pass on the decrease in the HH price to the buyer of U.S. LNG, so that the prices in the target countries of U.S. LNG do not decrease. Since operators of U.S. LNG export terminals are in competition with each other in the worldwide LNG market, this is practically impossible to implement. However, pricing of LNG can be influenced by taxes, tax reliefs, and subsidies, as the example of Russia shows [50,51,52]. Furthermore, the federal government can influence export volumes of U.S. LNG by diplomatic, economic, and environmental activities [53].
5. Conclusions
In this paper, the LNG value chain with production of natural gas, liquefaction, transportation, storage, and regasification was introduced, and the importance of the price at HH for U.S. LNG exports to Western Europe was derived. Furthermore, a base case scenario was presented, and the calculated gas flows in Western Europe with the global gas market model WEGA were analyzed. The gas market model WEGA supplies gas flows and gas prices in daily resolution. WEGA covers all steps in the LNG value chain. This allows detailed analyses of the effects of U.S. LNG and the HH price on gas flows in Northwest Europe and on monthly U.S. LNG export volumes. The effects of the HH price on gas flows in Western Europe have not yet been published by other gas market models on this level of detail.
It was shown in the base case that, with 48 bcm in 2033, U.S. LNG plays an important role in Western Europe. To answer the research questions about the effect of the HH price two further scenarios were created: one with a price of HH +20% and another one with a price of HH −20%. It was shown that changes in the price at HH would have a significant effect on the volumes for U.S. LNG exports, especially in the UK and France. Furthermore, the fluctuations in U.S. LNG imports in Western Europe between the two scenarios will be absorbed by pipeline gas. Specifically, pipeline gas from the North Sea will be directed more to Germany than to the UK if LNG imports in Western Europe increase. This is good news for producers in the North Sea: Their gas is still needed, even if U.S. LNG should become cheaper. Gas production from the North Sea acts like a pendulum, swinging more strongly towards the UK when LNG imports to Western Europe are lower and more strongly towards Germany when LNG imports are higher.
However, especially, LNG exports from Qatar and Russia are relatively competitive in Western Europe. Thus, in the scenario HH −20% with low price of natural gas at the trading point HH, U.S. LNG only displaces small volumes from other LNG suppliers in Western Europe. Nevertheless, U.S. LNG is not only exported to Western Europe and changes in the HH price have an effect on global LNG flows, but with Europe being the most flexible market.
Regarding monthly U.S. LNG exports an effect of the HH price could be observed especially in the summer months. The scenario HH −20% had the highest utilization during the summer and at HH +20% the utilization of the U.S. LNG export terminals was lower than in the base case despite a reduction in U.S. LNG prices below LRMC. Such a situation with prices below LRMC and reduced utilization should be carefully analyzed by an investor in LNG export capacities.
Instead of changes in the price at HH, a weaker or stronger USD would result in similar effects. This is because natural gas is traded at HH in USD and in Northwest Europe in EUR or GBP. Therefore, when analyzing European gas prices and gas flows, the price at HH and the exchange rates to the USD must be considered. In this paper, also, the effects of the HH price on revenue and profit for the U.S. was analyzed. It could be concluded that the presented base case is the best scenario for the U.S. in terms of maximizing sales and profits. Thus, if there are options for pricing U.S. LNG, the base case can be used for guidance.
The gas market model WEGA and the parameters were carefully analyzed. However, the calculated results are based on assumptions about parameters in the future, which are subject to uncertainties. Changes to the presented scenarios would lead to different results. Nevertheless, one important parameter for gas flows in Western Europe is the price of U.S. LNG. This parameter has been analyzed in this paper, while fixing other parameters of the presented base case scenario.
Author Contributions
Conceptualization, M.G. and V.N.; methodology, M.G. and V.N.; software, M.G.; validation, M.G. and V.N.; formal analysis, M.G. and V.N.; investigation, M.G. and V.N.; resources, M.G. and V.N.; data curation, M.G.; writing—original draft preparation, M.G. and V.N.; writing—review and editing, M.G. and V.N.; visualization, M.G. All authors have read and agreed to the published version of the manuscript.
Funding
This research received no external funding.
Conflicts of Interest
M.G. is employed at Stadtwerke München GmbH. This had no role in the design of the study; in the collection, analyses, or interpretation of data; in the writing of the manuscript, or in the decision to publish the results. V.N. declares no conflict of interest.
References
- BP. BP Energy Outlook, 2019 ed.; BP: London, UK, 2019. [Google Scholar]
- GIIGNL. The LNG Industry. GIIGNL Annual Report; GIIGNL: Neuilly-sur-Seine, France, 2020. [Google Scholar]
- IGU. 2020 World LNG Report; IGU: Barcelona, Spain, 2020. [Google Scholar]
- Prognos. Current Status and Perspectives of the European Gas Balances. Analysis of EU 28 and Switzerland; Prognos: Berlin, Germany, 2017. [Google Scholar]
- International Energy Agency. World Energy Outlook 2018; International Energy Agency: Paris, France, 2018. [Google Scholar]
- Exxon Mobil. 2019 Outlook for Energy: A Perspective to 2040; Exxon Mobil: Irving, TX, USA, 2019. [Google Scholar]
- Gronholt-Pedersen, J.U.S. Exports First Shale Gas as LNG Tanker Sails from Sabine Pass Terminal; Reuters: Toronto, ON, Canada, 2016; Available online: https://www.reuters.com/article/us-shale-export-idUSKCN0VY08B (accessed on 23 March 2021).
- Egging-Bratseth, R. A Techno-Economic Perspective on Natural Gas and Its Value Chain. Gases 2021, 1, 1. [Google Scholar] [CrossRef]
- Shattuck, T.; England, J.; Slaughter, A. Building an industry: Can the United States Sustainably Export LNG at Competitive Prices? Deloitte Center for Energy Solutions: Washington, DC, USA, 2016. [Google Scholar]
- Rogers, H. The LNG Shipping Forecast: Costs Rebounding, Outlook Uncertain; OIES Energy Insight 27; Oxford Institute for Energy Studies: Oxford, UK, 2018. [Google Scholar]
- Cornot-Gandolphe, S. The US Natural Gas Exports: New Rules on the European Gas Landscape; Ifri: Paris, France, 2016. [Google Scholar]
- Flowers, S. How Gas Bounces Back from the Coronavirus Lows. Asian Demand Growth Is Key to LNG’s Recovery. Wood Mackenzie. 2020. Available online: https://www.woodmac.com/news/the-edge/how-gas-bounces-back-from-the-coronavirus-lows (accessed on 23 March 2021).
- Henderson, J. The Potential Impact of North American LNG Exports; NG 68; Oxford Institute for Energy Studies: Oxford, UK, 2012. [Google Scholar]
- Henderson, J.; Mitrova, T. The Political and Commercial Dynamics of Russia’s Gas Export Strategy; OIES Paper NG 102; Oxford Institute for Energy Studies: Oxford, UK, 2015. [Google Scholar]
- Corbeau, A.-S.; Yermakov, V. Will There Be a Price War Between Russian Pipeline Gas and US LNG in Europe? KS-1643-DP037A; KAPSARC: Riyadh, Saudi Arabia, 2016. [Google Scholar]
- Mitrova, T.; Boersma, T. The Impact of US LNG on Russian Natural Gas Export Policy; Center on Global Energy Policy at Columbia University SIPA: New York, NY, USA, 2018. [Google Scholar]
- Richman, J.; Ayyılmaz, N. Can the US and Europe contain Russian power in the European energy market? A game theoretic approach. Energy Strategy Rev. 2019, 26, 100393. [Google Scholar] [CrossRef]
- Medlock, K.B., III; Jaffe, A.M.; Hartley, P.R. Shale Gas and U.S. National Security; Energy Forum, Rice University: Houston, TX, USA, 2011. [Google Scholar]
- Medlock, K.B., III. Modeling the implications of expanded US shale gas production. Energy Strategy Rev. 2012, 1, 33–41. [Google Scholar] [CrossRef]
- Morydee, S.; Gabriel, S.A.; Avetisyan, H.G. Investigating the potential effects of U.S. LNG exports on global natural gas markets. Energy Strategy Rev. 2014, 2, 273–288. [Google Scholar] [CrossRef]
- Bordoff, J.; Houser, T. American Gas to the Rescue? The Impact of US LNG Exports on European Security and Russian Foreign Policy; Center on Global Energy Policy at Columbia University SIPA: New York, NY, USA, 2014. [Google Scholar]
- Baron, R.; Bernstein, P.; Montgomery, W.D.; Tuladhara, S. Macroeconomic Impacts of LNG Exports from the United States. Econ. Energy Environ. Policy 2015, 4, 37–51. [Google Scholar] [CrossRef] [Green Version]
- Holz, F.; Kemfert, C. No Need for New Natural Gas Pipelines and LNG Terminals in Europe; DIW focus No. 5; Deutsches Institut für Wirtschaftsforschung (DIW): Berlin, Germany, 2020. [Google Scholar]
- Holz, F.; Richter, P.M.; Egging, R. The Role of Natural Gas in a Low-Carbon Europe: Infrastructure and Supply Security. Energy J. 2016, 37, 33–59. [Google Scholar] [CrossRef]
- EIA. Annual Energy Outlook 2021 (AEO2021); U.S. Department of Energy: Washington, DC, USA, 2021.
- EIA. The National Energy Modeling System: An Overview 2018; U.S. Department of Energy: Washington, DC, USA, 2019.
- Chyong, C.K.; Hobbs, B.F. Strategic Eurasian Natural Gas Market Model for Energy Security and Policy Analysis. Energy Econ. 2014, 44, 198–211. [Google Scholar] [CrossRef]
- Holz, F.; von Hirschhausen, C.; Kemfert, C. A Strategic Model of European Gas Supply (GASMOD). Energy Econ. 2008, 30, 766–788. [Google Scholar] [CrossRef] [Green Version]
- EMF. Prices and Trade in a Globalizing Natural Gas Market; EMF Report 23; Energy Modeling Forum, Stanford University: Stanford, CA, USA, 2007.
- Busch, L.K. Review of Natural Gas Models; Leidos: Preston County, WV, USA, 2014. [Google Scholar]
- IGU. Wholesale Gas Price Survey 2020 Edition. A Global Review of Price Formation Mechanisms 2005 to 2019; IGU: Barcelona, Spain, 2020. [Google Scholar]
- Davies, G.; Sarsfield-Hall, R. Gas SCR—Cost Benefit Analysis for a Demand-Side Response Mechanism. A Report to Ofgem; Pöyry: Oxford, UK, 2004. [Google Scholar]
- Pöyry. How Will Intermittency Change Europe’s Gas Markets? Pöyry: Oxford, UK, 2012. [Google Scholar]
- Günther, M. Practical Application of a Worldwide Gasmarket Model at Stadtwerke München. In Operations Research Proceedings 2015, Proceedings of the International Conference of the German, Austrian and Swiss Operations Research Societies (GOR, ÖGOR, SVOR/ASRO), Vienna, Austria, 1–4 September 2015; Doerner, K.F., Ljubic, I., Pflug, G., Tragler, G., Eds.; Springer: Cham, Switzerland, 2017; pp. 715–721. [Google Scholar]
- Fallahnejad, M.; Günther, M.; Eberl, B. Creating Standard Load Profiles in Residential and Commercial Sectors in Germany for 2016, 2025 and 2040. 2016. Available online: http://www.optimization-online.org/DB_FILE/2016/07/5554.pdf (accessed on 23 March 2021).
- Fallahnejad, M.; Eberl, B.; Günther, M. Long-Term Forecast of Residential & Commercial Gas Demand in Germany. In Book of Abstracts VSS 2017; Artner, G., Bogadi, A., Grames, J., Hahn, I., Hans, P., Krebs, H., Rouhi, T., Eds.; Book-of-Abstracts.com: Gumpoldskirchen, Austria, 2017; pp. 108–109. [Google Scholar]
- Günther, M.; Nissen, V. Gas Flows and Gas Prices in Europe: What is the Impact of Nord Stream 2. In Proceedings of the ENERDAY 2019—13th Conference on Energy Economics and Technology, Dresden, Germany, 12 April 2019. [Google Scholar]
- Günther, M.; Nissen, V. Impact of Nord Stream 2 on Gas Flows in Europe. In Proceedings of the 16th International Conference on the European Energy Market (EEM 2019), Ljubljana, Slovenia, 18–20 September 2019; IEEE Xplore: Piscataway, NJ, USA, 2019. No. 388. [Google Scholar]
- Günther, M.; Fallahnejad, M. Analysis of NCG prices under different shapes of oil price recovery with a worldwide gas market model. In Handbook of Energy Finance. Theories, Practices and Simulations; World Scientific Publishing: Singapore, 2020; pp. 301–316. [Google Scholar]
- Günther, M. Implementation and Operation of a Gas Market Model at Stadtwerke München. In Proceedings of the the 3rd Conference of the EURO Working Group on the Practice of Operations Research, Berlin, Germany, 19–20 March 2020; Challenges in the Deployment of or Projects. p. 12. [Google Scholar]
- Ganz, K.; Günther, M.; Kern, T. WEGA and MINGA—Considering regional transmission capacities for worldwide gas market models. In Proceedings of the 17th International Conference on the European Energy Market (EEM 2020), Stockholm, Sweden, 16–18 September 2020; IEEE Xplore: Piscataway, NJ, USA, 2020; pp. 1–5. [Google Scholar]
- ENTSOG. Ten-Year Network Development Plan; ENTSOG: Brussels, Belgium, 2020. [Google Scholar]
- EIA. Annual Energy Outlook 2020 with Projections to 2050; EIA: Washington, DC, USA, 2020.
- Deloitte. Made in America. The Economic Impact of LNG Exports from the United States; Deloitte Center for Energy Solutions; Deloitte MarketPoint LLC: Washington, TX, USA, 2011. [Google Scholar]
- CFTC. Liquefied Natural Gas. Developments and Market Impacts; CFTC: Washington, DC, USA, 2018.
- Flowers, S. Could US Gas Producers Capture More Margin? Wood Mackenzie. 2018. Available online: https://www.woodmac.com/news/the-edge/could-us-gas-producers-capture-more-margin (accessed on 23 March 2021).
- BP. Statistical Review of World Energy, 69th ed.; BP: London, UK, 2020. [Google Scholar]
- Fitzgerald, L.M.; Braunger, I.; Brauers, H. Destabilisation of Sustainable Energy Transformations: Analysing Natural Gas Lock-in in the case of Germany; STEPS Working Paper 106; STEPS Centre: Brighton, UK, 2019. [Google Scholar]
- Walker, T. German LNG Terminal Plans Fuel Anger among Environmentalists; Deutsche Welle: Bonn, Germany, 2020; Available online: https://p.dw.com/p/3XlnH (accessed on 23 March 2021).
- Simola, H.; Solanko, L. Overview of Russia’s oil and gas sector. BOFIT Policy Brief 2017, 5, 3–32. [Google Scholar]
- Mitrova, T.; Sobko, A.; Sergeeva, Z. Global LNG Market: Ways Not to Miss the Window of Opportunities for Russia; Energy Center Skolkovo: Moscow, Russia, 2018. [Google Scholar]
- Merkulov, V.I. Analysis of Russian Arctic LNG projects and their development prospects. IOP Conf. Ser. Mater. Sci. Eng. 2020, 940, 012114. [Google Scholar] [CrossRef]
- Smith, K. The Future of LNG Exports: How the Federal Government Can Promote U.S. LNG Exports. S. Cal. Interdisc. Law J. 2014, 27, 405–429. [Google Scholar]
Figure 1.
Example of two demand zones.

Figure 2.
U.S. gas price at the trading hub Henry Hub (HH) in 2019 real terms [43].
Figure 2.
U.S. gas price at the trading hub Henry Hub (HH) in 2019 real terms [43].

Figure 3.
Gas flows in 2033 for the base case in billion cubic meters (bcm). Only gas flows ≥ 1 bcm; numbers are rounded. Black arrows represent pipeline flows and white arrows liquefied natural gas (LNG) flows; numbers in brackets are imports of U.S. LNG in bcm.
Figure 3.
Gas flows in 2033 for the base case in billion cubic meters (bcm). Only gas flows ≥ 1 bcm; numbers are rounded. Black arrows represent pipeline flows and white arrows liquefied natural gas (LNG) flows; numbers in brackets are imports of U.S. LNG in bcm.

Figure 4.
Gas flows in 2033 in bcm for HH −20% (left) and HH +20% (right). Only gas flows ≥ 1 bcm; numbers are rounded. Black arrows represent pipeline flows and white arrows LNG flows; numbers in brackets are imports of U.S. LNG in bcm.
Figure 4.
Gas flows in 2033 in bcm for HH −20% (left) and HH +20% (right). Only gas flows ≥ 1 bcm; numbers are rounded. Black arrows represent pipeline flows and white arrows LNG flows; numbers in brackets are imports of U.S. LNG in bcm.

Figure 5.
Monthly U.S. LNG exports in million cubic meters (mcm)/day.


Table 1.
Worldwide U.S. LNG export volumes in 2033 in bcm.
| Szenario | Western Europe | Asia | South America |
|---|---|---|---|
| HH +20% | 41 | 87 | 5 |
| base case | 48 | 92 | 5 |
| HH −20% | 57 | 96 | 4 |
Publisher’s Note: MDPI stays neutral with regard to jurisdictional claims in published maps and institutional affiliations. |
© 2021 by the authors. Licensee MDPI, Basel, Switzerland. This article is an open access article distributed under the terms and conditions of the Creative Commons Attribution (CC BY) license (http://creativecommons.org/licenses/by/4.0/).
Share and Cite
MDPI and ACS Style
Günther, M.; Nissen, V. Effects of the Henry Hub Price on U.S. LNG Exports and on Gas Flows in Western Europe. Gases 2021, 1, 68-79. https://0-doi-org.brum.beds.ac.uk/10.3390/gases1020006
AMA Style
Günther M, Nissen V. Effects of the Henry Hub Price on U.S. LNG Exports and on Gas Flows in Western Europe. Gases. 2021; 1(2):68-79. https://0-doi-org.brum.beds.ac.uk/10.3390/gases1020006
Chicago/Turabian StyleGünther, Maik, and Volker Nissen. 2021. "Effects of the Henry Hub Price on U.S. LNG Exports and on Gas Flows in Western Europe" Gases 1, no. 2: 68-79. https://0-doi-org.brum.beds.ac.uk/10.3390/gases1020006