
Liquefied Synthetic Natural Gas Produced through Renewable Energy Surplus: Impact Analysis on Vehicular Transportation by 2040 in Italy


Abstract
:
1. Introduction
2. Methodology
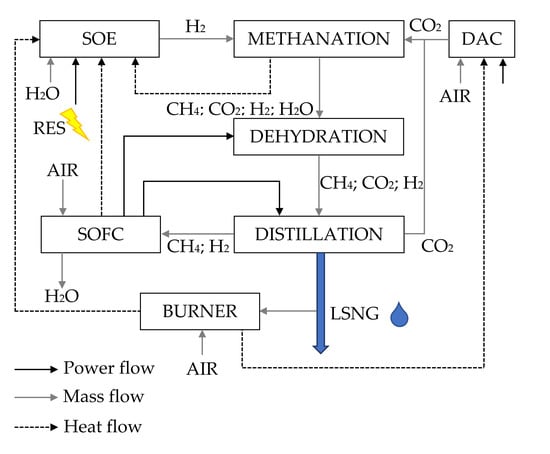
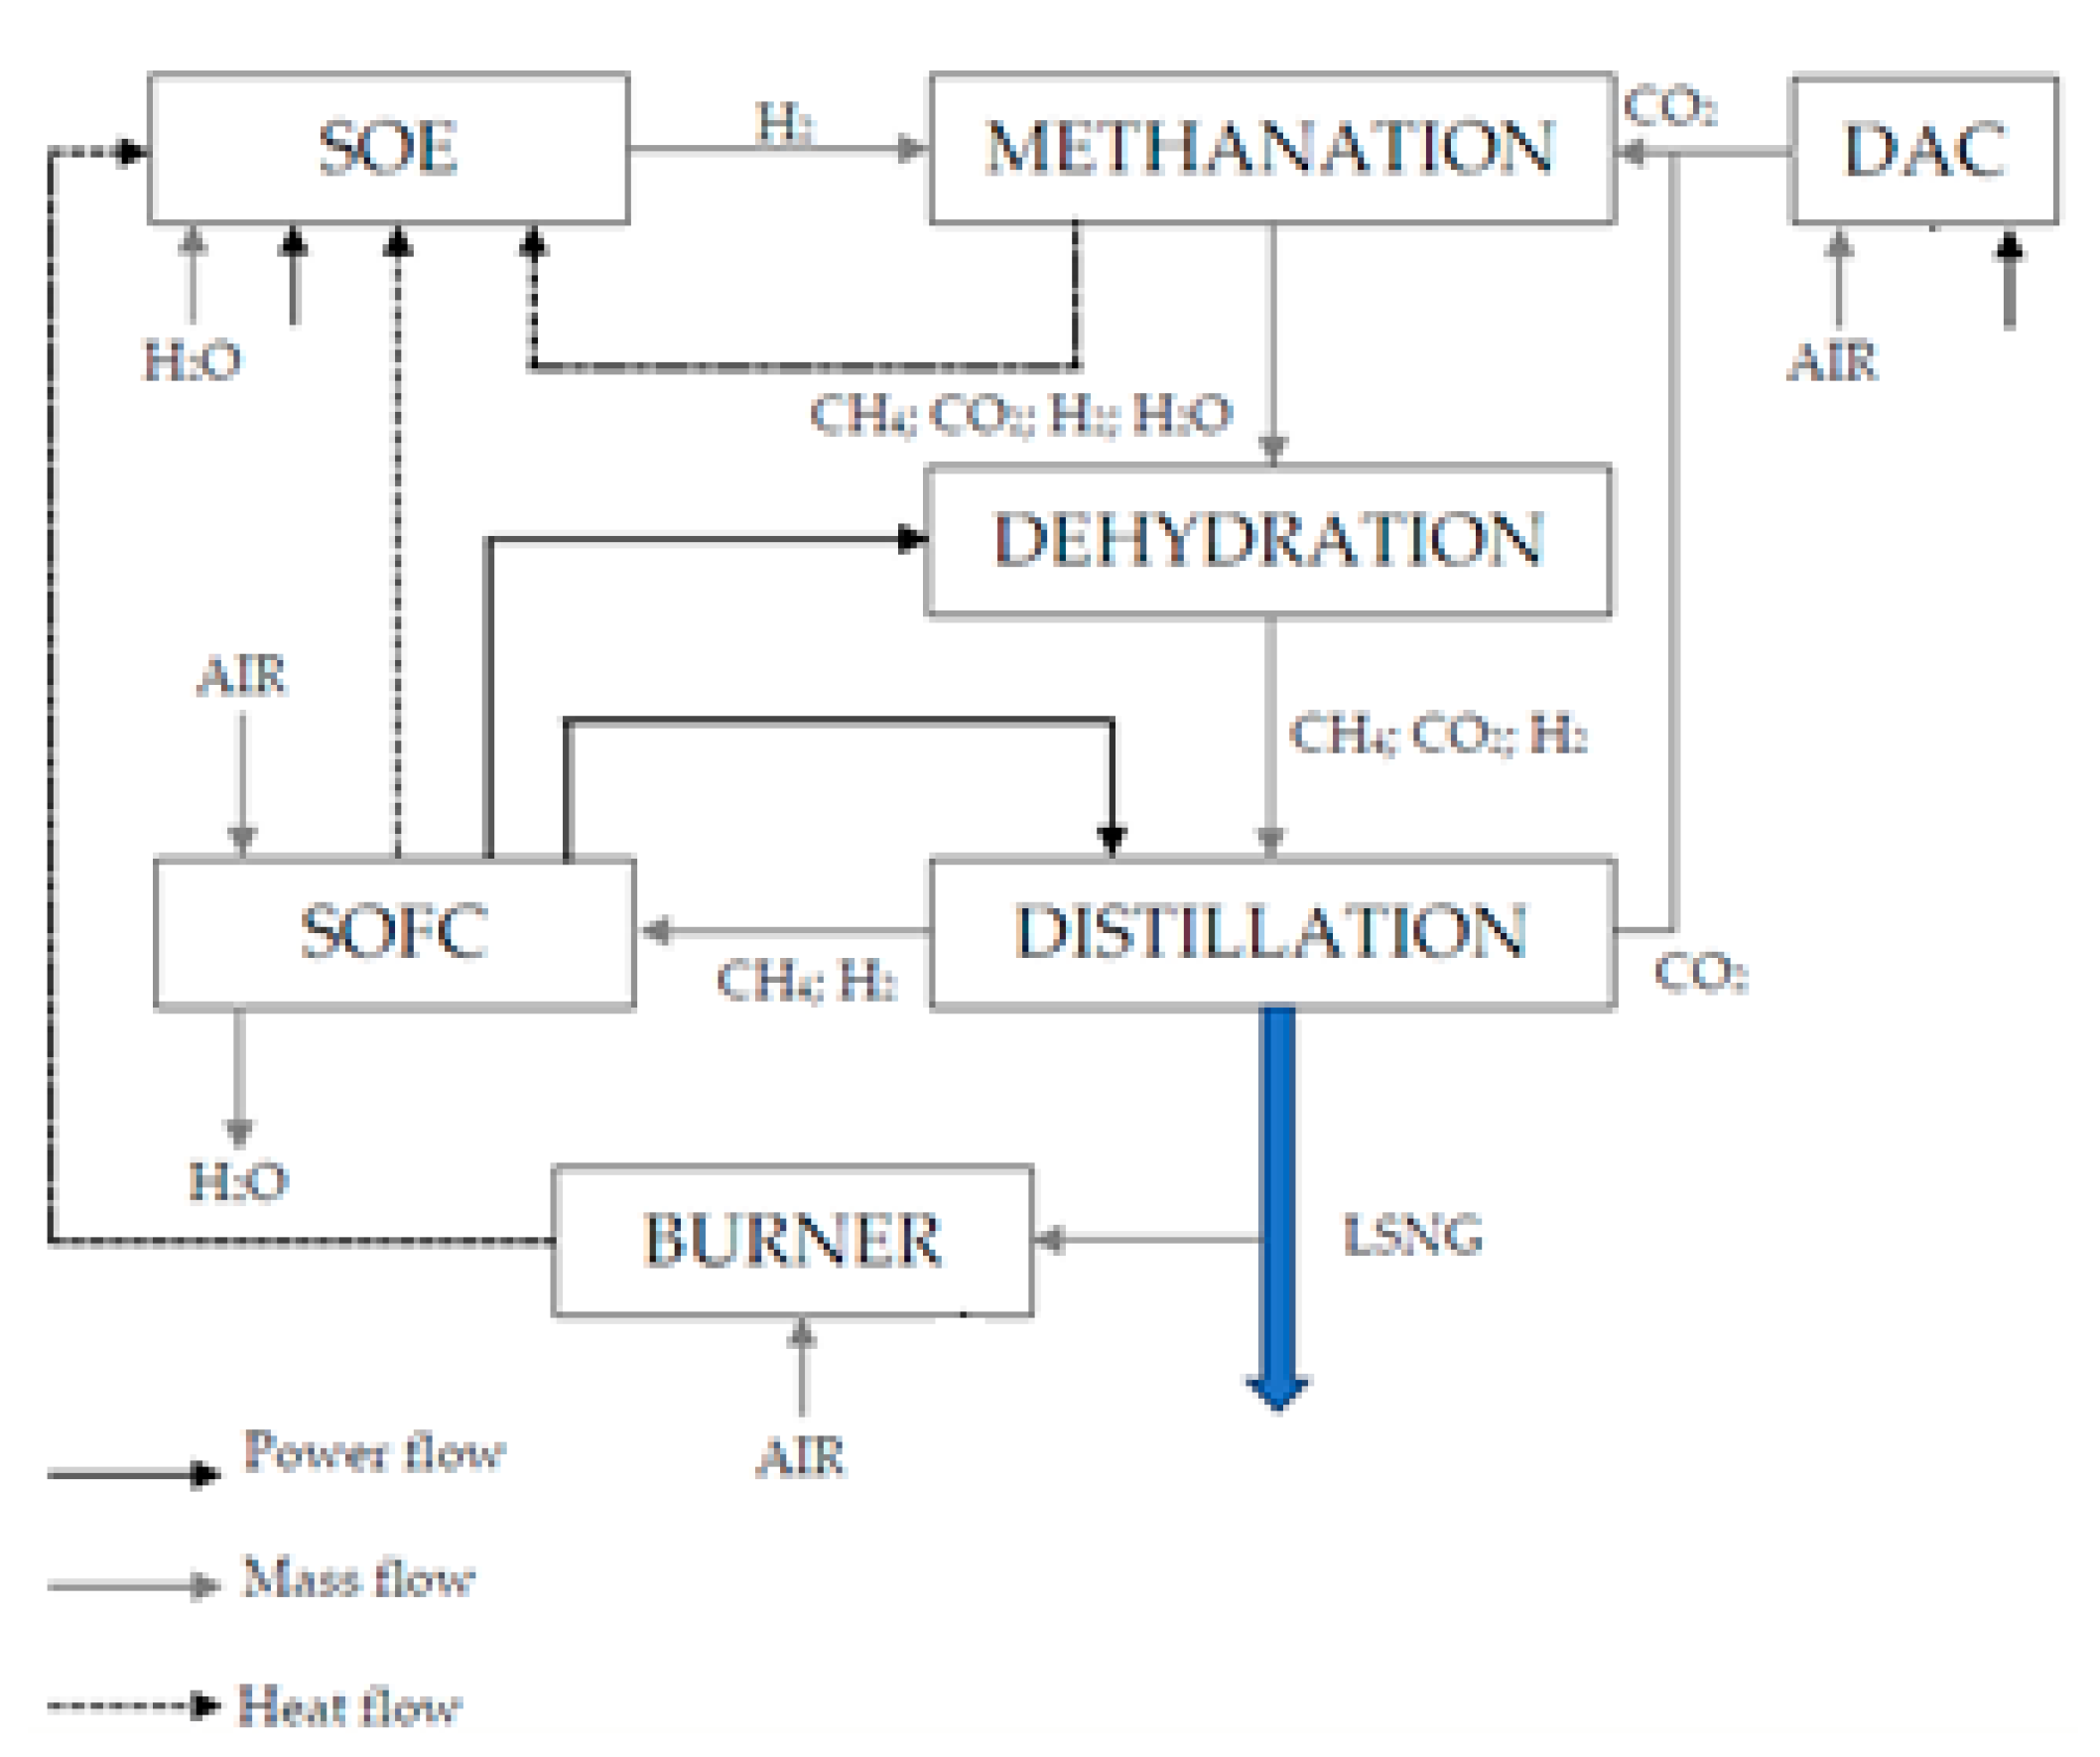
3. LSNG Process
3.1. Direct Air Capture System (DAC)
3.2. Electrolysis and Methanation
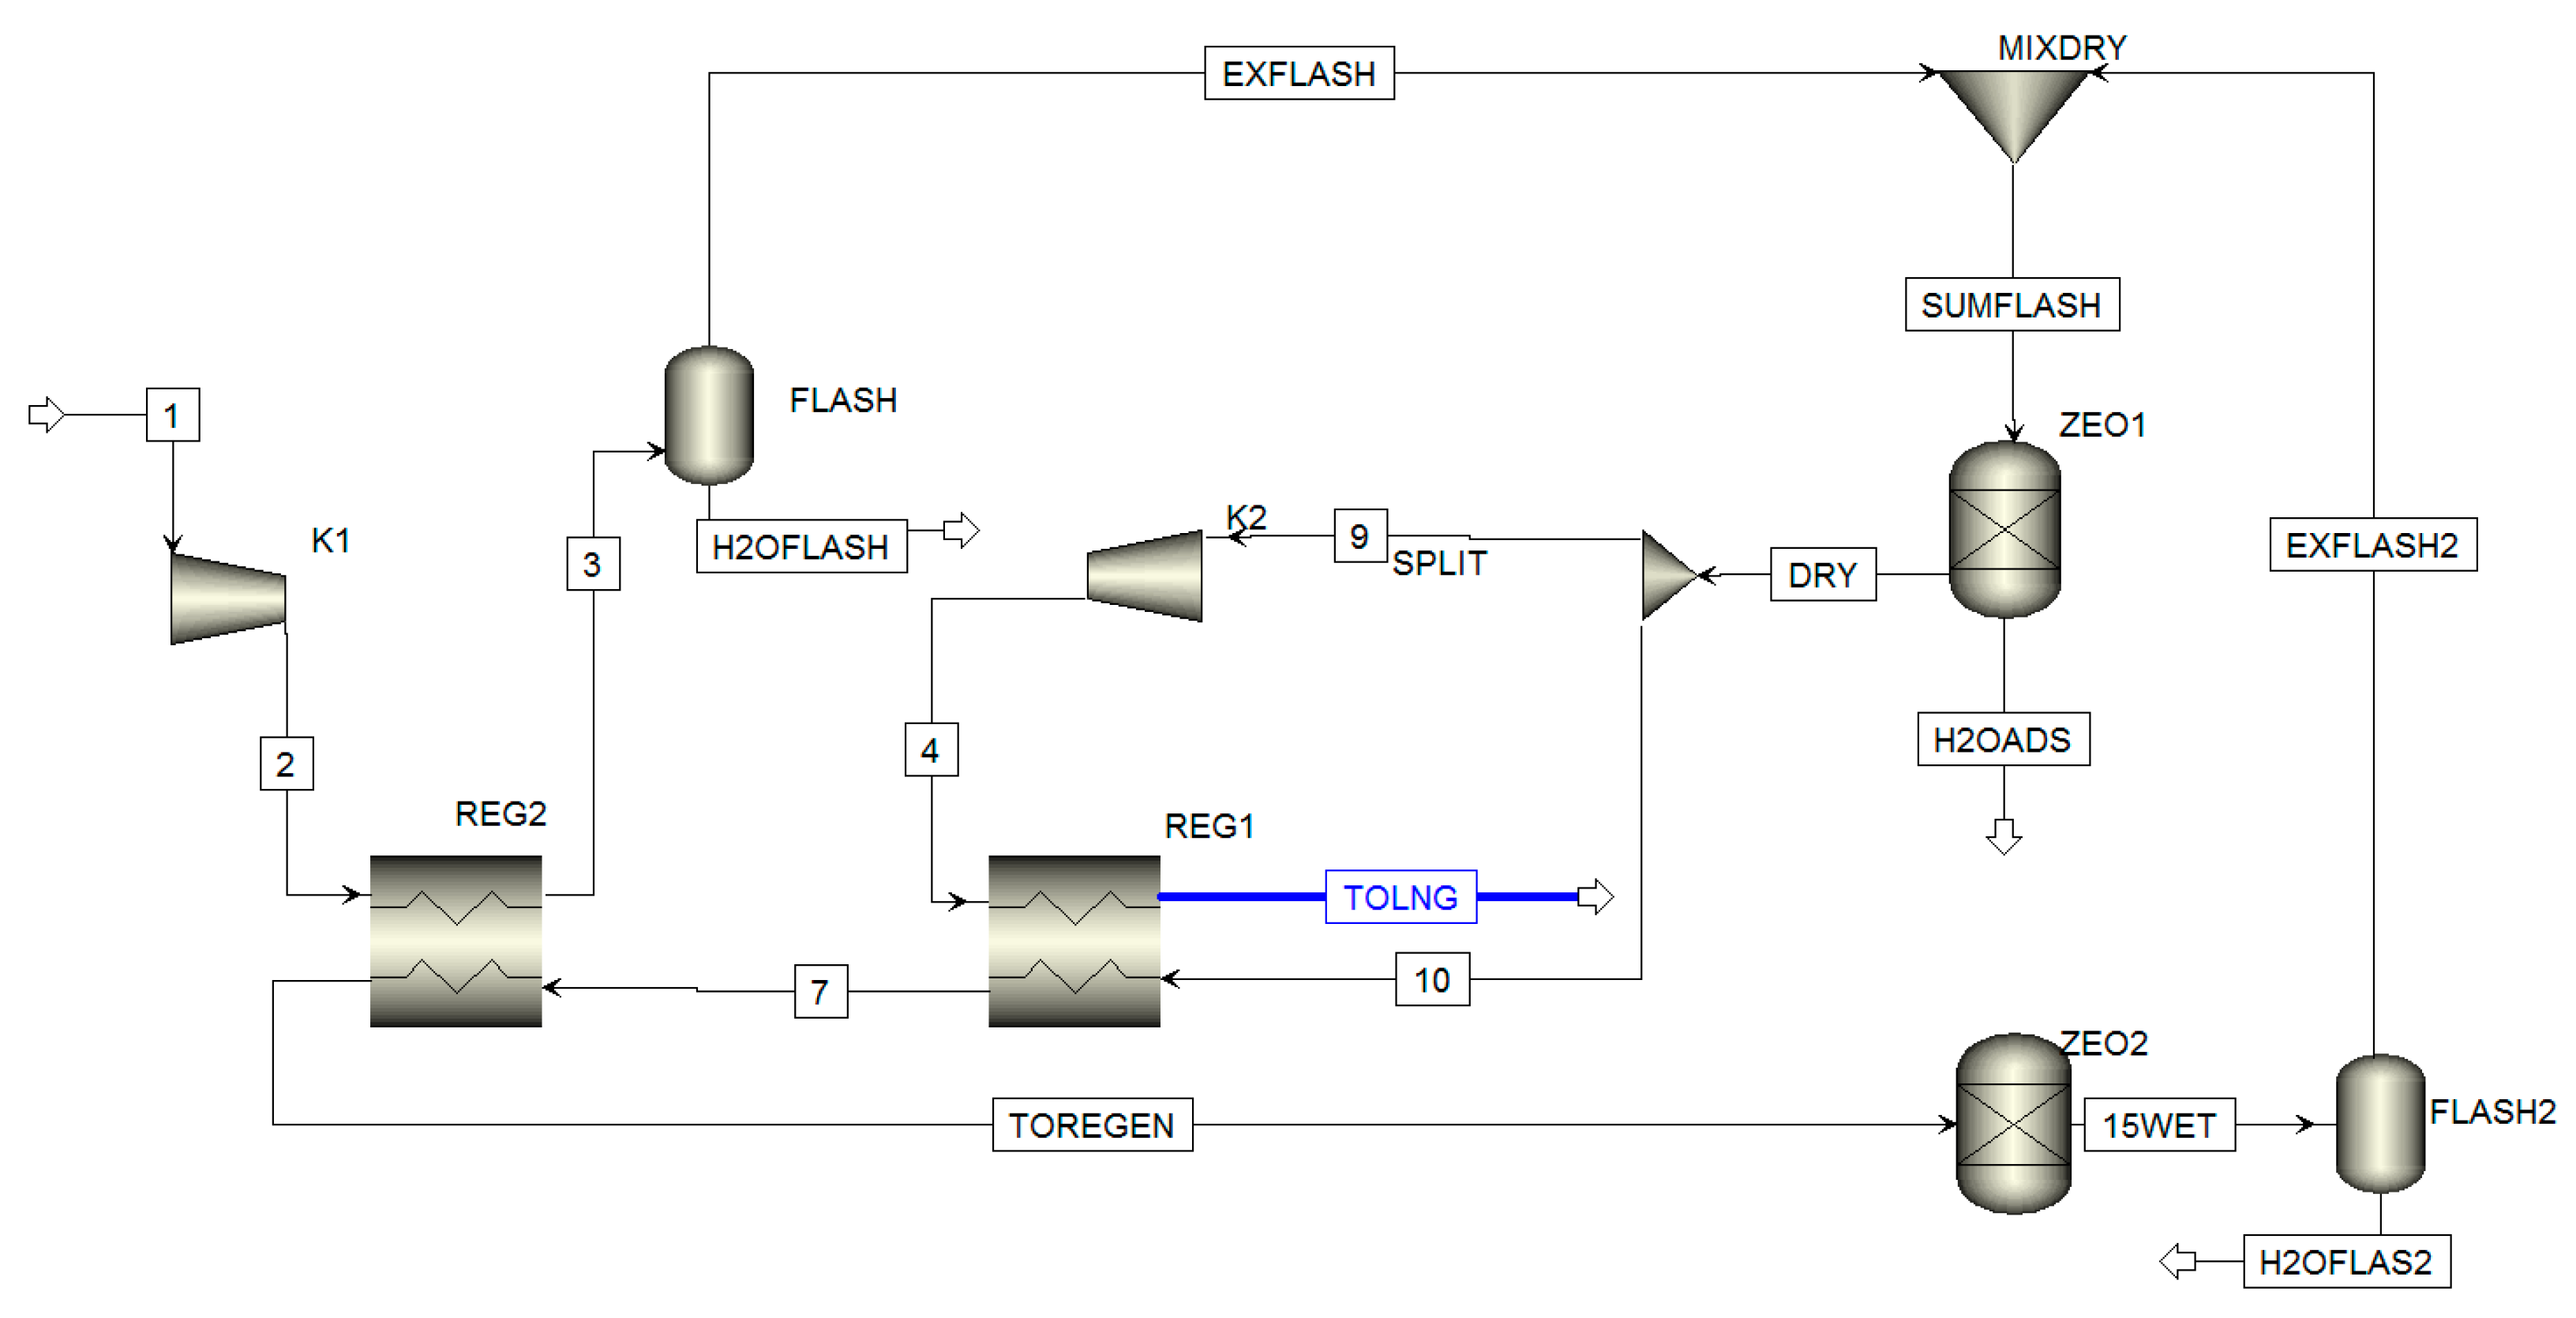
3.3. Dehydration and Distillation
3.4. SOFC Section for Energy Recovery
4. Impact Analysis
5. Cost Evaluation
6. Conclusions
Author Contributions
Funding
Institutional Review Board Statement
Informed Consent Statement
Data Availability Statement
Acknowledgments
Conflicts of Interest
References
- Cañete:, M.A. Renewable Energy: Catalyst for a Clean Energy Transition. OECD n.d. Available online: http://www.oecd.org/greengrowth/renewable-energy-catalyst-clean-energy-transition.htm (accessed on 9 December 2020).
- Bird, L.; Lew, D.; Milligan, M.; Carlini, E.M.; Estanqueiro, A.; Flynn, D.; Gomez-Lazaro, E.; Holttinen, H.; Menemenlis, N.; Orths, A.; et al. Wind and solar energy curtailment: A review of international experience. Renew. Sustain. Energy Rev. 2016, 65, 577–586. [Google Scholar] [CrossRef] [Green Version]
- Terna, S. Documento di Descrizione degli Scenari 2019. 2019. Available online: https://download.terna.it/terna/DDS%20libro%2009%2030%2017h15_8d745ced8696c60.pdf (accessed on 20 April 2021).
- Italian Ministry of Economic Development. Piano Nazionale Integrato per l’Energia e il Clima 2019. Available online: https://www.mise.gov.it/images/stories/documenti/PNIEC_finale_17012020.pdf (accessed on 20 April 2021).
- Thema, M.; Bauer, F.; Sterner, M. Power-to-Gas: Electrolysis and methanation status review. Renew. Sustain. Energy Rev. 2019, 112, 775–787. [Google Scholar] [CrossRef]
- Schiebahn, S.; Grube, T.; Robinius, M.; Tietze, V.; Kumar, B.; Stolten, D. Power to gas: Technological overview, systems analysis and economic assessment for a case study in Germany. Int. J. Hydrogen Energy 2015, 40, 4285–4294. [Google Scholar] [CrossRef]
- Guandalini, G.; Robinius, M.; Grube, T.; Campanari, S.; Stolten, D. Long-term power-to-gas potential from wind and solar power: A country analysis for Italy. Int. J. Hydrogen Energy 2017, 42, 13389–13406. [Google Scholar] [CrossRef]
- Barelli, L.; Baumann, M.; Bidini, G.; Ottaviano, P.A.; Schneider, R.V.; Passerini, S.; Trombetti, L. Reactive Metals as Energy Storage and Carrier Media: Use of Aluminum for Power Generation in Fuel Cell-Based Power Plants. Energy Technol. 2020, 8. [Google Scholar] [CrossRef]
- Federmetano. Distributori di Metano Liquido LNG n.d. Available online: https://www.federmetano.it/distributori-metano/distributori-metano-liquido-lng/ (accessed on 11 November 2020).
- Repubblica Italiana. Supplemento ordinario n. 3/L alla GAZZETTA UFFICIALE—17/01/2017—PREVISIONI DI MERCATO PER SMALL SCALE LNG AL 2020, 2025 E 2030 2017. Available online: https://www.gazzettaufficiale.it/do/atto/serie_generale/caricaPdf?cdimg=17G0000500300010110029&dgu=2017-01-13&art.dataPubblicazioneGazzetta=2017-01-13&art.codiceRedazionale=17G00005&art.num=1&art.tiposerie=SG (accessed on 20 April 2021).
- Osorio-Tejada, J.; Llera, E.; Scarpellini, S. LNG: An alternative fuel for road freight transport in Europe. WIT Trans. Built Environ. 2015, 168, 235–246. [Google Scholar] [CrossRef] [Green Version]
- GSE, S.p.A. Monitoraggio Nazionale n.d. Available online: https://www.gse.it/dati-e-scenari/monitoraggio-fer/monitoraggio-nazionale/obiettivo-complessivo (accessed on 10 June 2019).
- Barelli, L.; Bidini, G.; Ottaviano, P.A.; Perla, M. A novel technology for Liquefied Natural Gas production powered by renewable electricity: Process development and impact analysis on vehicular transportation. J. Nat. Gas Sci. Eng. 2020, 81, 103482. [Google Scholar] [CrossRef]
- European Commission. EU Reference Scenario 2016; EU Ref Scenar 2016; European Commission: Brussels, Belgium, 2016; Volume 27, Available online: https://ec.europa.eu/energy/sites/ener/files/documents/ref2016_report_final-web.pdf (accessed on 25 August 2017).
- Barelli, L.; Bidini, G.; Ottaviano, A. Hydromethane generation through SOE (solid oxide electrolyser): Advantages of H2O-CO2 co-electrolysis. Energy 2015, 90, 1180–1191. [Google Scholar] [CrossRef]
- Mokhatab, S.; Poe, W.A.; Mak, J.Y. Handbook of Natural Gas Transmission and Processing—Principles and Practices, 3rd ed.; Gulf Professional Publishing: Houston, TX, USA, 2015. [Google Scholar]
- CEN/TC 234. EN 16726 Gas Infrastructure—Quality of Gas—Group H Infrastructure 2015; Volume 49, Available online: https://infostore.saiglobal.com/preview/98703699482.pdf?sku=879417_saig_nsai_nsai_2089598 (accessed on 10 April 2021).
- Altfeld, K.; Pinchbeck, D. Admissible Hydrogen Concentrations in Natural Gas Systems; Gas Energy 2013; DIV Deutscher Industrieverlag GmbH: München, Germany, March 2013; pp. 1–16. ISSN 2192-158X. [Google Scholar]
- Fasihi, M.; Efimova, O.; Breyer, C. Techno-economic assessment of CO2 direct air capture plants. J. Clean. Prod. 2019, 224, 957–980. [Google Scholar] [CrossRef]
- Keith, D.W.; Holmes, G.; St. Angelo, D.; Heidel, K. A Process for Capturing CO2 from the Atmosphere. Joule 2018, 2, 1573–1594. [Google Scholar] [CrossRef] [Green Version]
- Italian Ministry of Economic Development. D.M. 18/03/2018—Regola Tecnica Sulle Caratteristiche Chimico Fisiche e Sulla Presenza di Altri Componenti nel Gas Combustibile. 2018. Available online: https://www.mise.gov.it/images/stories/normativa/decreto_ministeriale_18_maggio_2018_gas_aggiornamento_%20regola_tecnica.pdf (accessed on 20 April 2021).
- Barelli, L.; Bidini, G.; Ottaviano, P.A.; Perla, M. Dehydration and low temperature separation technologies for liquified natural gas production via electrolysis: A systematic review. J. Energy Storage 2020, 30. [Google Scholar] [CrossRef]
- Berg, B. Efficient liquid biomethane production with cryogenic upgrading. Gas Energy 2017, 26–29. Available online: https://www.gas-for-energy.com/fileadmin/G4E/pdf_Datein/gfe_1_17/02_fb_Berg.pdf (accessed on 20 April 2021).
- Clodic, D.; De Paris, M.; El Hitti, R.; Younes, M.; Bill, A.; Environment, A.P. CO2 capture by anti-sublimation Thermo-economic process evaluation. In Proceedings of the 4th Annual Conference on Carbon Capture and Sequestration, Alexandria, VA, USA, 2–5 May 2005; pp. 1–11. [Google Scholar]
- GRACE Davison. Sylobead—Adsorbents for Process Applications 2010, 11. Available online: https://grace.com/general-industrial/en-us/Documents/sylobead_br_E_2010_f100222_web.pdf (accessed on 20 April 2021).
- Pellegrini, L.A. Process for the Removal of CO2 from Acid Gas. WO 2014/054945 A2, 10 April 2014. [Google Scholar]
- Baccanelli, M.; Langé, S.; Rocco, M.V.; Pellegrini, L.A.; Colombo, E. Low temperature techniques for natural gas purification and LNG production: An energy and exergy analysis. Appl. Energy 2016, 180, 546–559. [Google Scholar] [CrossRef]
- Langè, S.; Pellegrini, L.A.; Vergani, P.; Lo Savio, M. Energy and Economic Analysis of a New Low-Temperature Distillation Process for the Upgrading of High-CO2 Content Natural Gas Streams. Ind. Eng. Chem. Res. 2015, 54, 9770–9782. [Google Scholar] [CrossRef] [Green Version]
- Barelli, L.; Ottaviano, A. Solid oxide fuel cell technology coupled with methane dry reforming: A viable option for high efficiency plant with reduced CO2 emissions. Energy 2014, 71. [Google Scholar] [CrossRef]
- ARERA. Stato di Utilizzo e di Integrazione Degli Impianti di Produzione Alimentati Dalle Fonti Rinnovabili anno 2017; ARERA, 2018; Volume 76, Available online: https://www.arera.it/allegati/docs/18/428-18.pdf (accessed on 20 April 2021).
- Kofod, M.; Stephenson, T. Well-to Wheel Greenhouse Gas Emissions of LNG Used as a Fuel for Long Haul Trucks in a European Scenario. SAE Tech. Pap. Ser. 2013, 1. [Google Scholar] [CrossRef]
- Alamia, A.; Magnusson, I.; Johnsson, F.; Thunman, H. Well-to-wheel analysis of bio-methane via gasification, in heavy duty engines within the transport sector of the European Union. Appl. Energy 2016, 170, 445–454. [Google Scholar] [CrossRef]
- Smajla, I.; Sedlar, D.K.; Drljača, B.; Jukić, L. Fuel switch to LNG in heavy truck traffic. Energies 2019, 12, 515. [Google Scholar] [CrossRef] [Green Version]
- AISCAT. Aiscat Informazioni; AISCAT: Roma, Italy, 2017; Volume 48, Available online: http://www.aiscat.it/pubblicazioni/downloads/trim_3-4_2017.pdf (accessed on 20 April 2021).
- Snam. La microliquefazione di Snam: Dal Biometano al bioLNG n.d. Available online: https://assogasliquidi.federchimica.it/docs/default-source/default-document-library/snam-francesco-di-fratta.pdf?sfvrsn=0 (accessed on 20 April 2021).
- Kreutz, T.; Williams, R.; Consonni, S.; Chiesa, P. Co-production of hydrogen, electricity and CO2 from coal with commercially ready technology. Part B: Economic analysis. Int. J. Hydrogen Energy 2005, 30, 769–784. [Google Scholar] [CrossRef]
- Anghilante, R.; Colomar, D.; Brisse, A.; Marrony, M. Bottom-up cost evaluation of SOEC systems in the range of 10–100 MW. Int. J. Hydrogen Energy 2018, 43, 20309–20322. [Google Scholar] [CrossRef]
- Zapf, M. Stromspeicher und Power-to-Gas im Deutschen Energiesystem; Springer: Berlin/Heidelberg, Germany, 2017. [Google Scholar] [CrossRef]
- Zhu, P.; Yao, J.; Qian, C.; Yang, F.; Porpatham, E.; Zhang, Z.; Wu, Z. High-efficiency conversion of natural gas fuel to power by an integrated system of SOFC, HCCI engine, and waste heat recovery: Thermodynamic and thermo-economic analyses. Fuel 2020, 275, 117883. [Google Scholar] [CrossRef]
- van Wijk, A.; Chatzimarkakis, J. Green Hydrogen for a European Green Deal; Hydrogen Europe: Brussels, Belgium, 2020; Volume 39, Available online: https://static1.squarespace.com/static/5d3f0387728026000121b2a2/t/5e85aa53179bb450f86a4efb/1585818266517/2020-04-01_Dii_Hydrogen_Studie2020_v13_SP.pdf (accessed on 10 April 2021).
- Yousef, A.M.; El-Maghlany, W.M.; Eldrainy, Y.A.; Attia, A. New approach for biogas purification using cryogenic separation and distillation process for CO2 capture. Energy 2018, 156, 328–351. [Google Scholar] [CrossRef]
- Yousef, A.M.; El-Maghlany, W.M.; Eldrainy, Y.A.; Attia, A. Upgrading biogas to biomethane and liquid CO2: A novel cryogenic process. Fuel 2019, 251, 611–628. [Google Scholar] [CrossRef]
- Yousef, A.M.; Eldrainy, Y.A.; El-Maghlany, W.M.; Attia, A. Biogas upgrading process via low-temperature CO2 liquefaction and separation. J. Nat. Gas. Sci. Eng. 2017, 45, 812–824. [Google Scholar] [CrossRef]
- Kushi, T. Performance and durability evaluation of dry reforming in solid oxide fuel cells. IJHE 2016, 41, 17567–17576. [Google Scholar] [CrossRef]
- GSE, S.P.A. Rapporto Annuale—aste di Quote Europee di Emissione; 2019; Volume 514, Available online: https://www.gse.it/documenti_site/Documenti%20GSE/Rapporti%20ASTE%20CO2/200131_Rapporto_GSE_Aste_ANNUALE_2019-PUBB.pdf (accessed on 20 April 2021).


| Case | Value |
|---|---|
| XCH4 | 0.52 |
| XCO2 | 0.38 |
| XH2 | 0.084 |
| XH2O | 0.016 |
| GHG Emissions (gCO2e/MJout) | ||
|---|---|---|
| LSNG | DIESEL | |
| Gas Production | - | - |
| Liquefaction | - | - |
| Shipping and terminal | - | - |
| Distribution and refueling | 0.5 | - |
| WtT total | 0.5 | 47 |
| TtW | 26.1 | 215 |
| WtW | 26.6 | 262 |
| LSNG | DIESEL | |
|---|---|---|
| Consumption | 25 (kg/100 km) | 30 (L/100 km) |
| LHV | 50.16 (MJ/kg) * | 36 (MJ/L) |
| Section | C (M€) | S | C0 (M€) | S0 | F |
|---|---|---|---|---|---|
| DAC | 21.32 | 22,897 tonnes/y | 549 [19] | 106 tonnes/y [19] | 0.86 [20] |
| SOE | 12.4 | 21.5 MW | 23.17 [37] | 75 MW [37] | 0.5 [37] |
| Methanation | 1.69 | 21.5 MW | 1.08 [38] | 6 MW [38] | 0.35 [38] |
| TSA | 0.22 | 0.003469 kmol/s | 5.96 [36] | 0.294 kmol/s (purge gas) [36] | 0.74 [36] |
| Distillation (CO2) | 5.34 | 45.6 tonnes/day | 33.94 [36] | 1839 tonnes/day [36] | 0.5 [36] |
| Distillation (CH4) | 3.52 | 19.8 tonnes/day | 33.94 [36] | 1839 tonnes/day [36] | 0.5 [36] |
| SOFC | 0.39 [39] | 1.5 MW | - | - | - |
| Total | 44.88 | ||||
| CO2 Absorption 1 | 1.29 | 2.613 tonnes/h | 32.8 [36] | 327 tonnes/h [36] | 0.67 [36] |
Publisher’s Note: MDPI stays neutral with regard to jurisdictional claims in published maps and institutional affiliations. |
© 2021 by the authors. Licensee MDPI, Basel, Switzerland. This article is an open access article distributed under the terms and conditions of the Creative Commons Attribution (CC BY) license (https://creativecommons.org/licenses/by/4.0/).
Share and Cite
Barelli, L.; Bidini, G.; Ottaviano, P.A.; Perla, M. Liquefied Synthetic Natural Gas Produced through Renewable Energy Surplus: Impact Analysis on Vehicular Transportation by 2040 in Italy. Gases 2021, 1, 80-91. https://0-doi-org.brum.beds.ac.uk/10.3390/gases1020007
Barelli L, Bidini G, Ottaviano PA, Perla M. Liquefied Synthetic Natural Gas Produced through Renewable Energy Surplus: Impact Analysis on Vehicular Transportation by 2040 in Italy. Gases. 2021; 1(2):80-91. https://0-doi-org.brum.beds.ac.uk/10.3390/gases1020007
Chicago/Turabian StyleBarelli, Linda, Gianni Bidini, Panfilo Andrea Ottaviano, and Michele Perla. 2021. "Liquefied Synthetic Natural Gas Produced through Renewable Energy Surplus: Impact Analysis on Vehicular Transportation by 2040 in Italy" Gases 1, no. 2: 80-91. https://0-doi-org.brum.beds.ac.uk/10.3390/gases1020007