Seasonal and Daily Activity of Two Zoo-Housed Grizzly Bears (Ursus arctos horribilis)


1
School of Animal and Veterinary Sciences, University of Adelaide, Adelaide 5005, Australia
2
Ahimsa Dog Training, Seattle, WA 98107, USA
3
Happy Hollow Park & Zoo, San Jose, CA 95112, USA
*
Author to whom correspondence should be addressed.
J. Zool. Bot. Gard. 2020, 1(1), 1-12; https://0-doi-org.brum.beds.ac.uk/10.3390/jzbg1010001
Submission received: 23 July 2020
/
Revised: 20 August 2020
/
Accepted: 21 August 2020
/
Published: 25 August 2020
(This article belongs to the Special Issue Recent Advances in the Science of Zoo and Aquarium Animal Welfare)
Abstract
:Captive grizzly bears, like their wild counterparts, engage in considerable variability in their seasonal and daily activity. We documented the year-long activity of two grizzly bears located at the Woodland Park Zoo in Seattle, Washington. We found that behaviors emerged in relation to month-to-month, seasonal, and time of day (hour-to-hour) observations, and events that occurred on exhibit, such as daily feedings. Seventeen behaviors split into seven classes of behavior were observed during their on-exhibit time over a 13-month period. Inactivity was the most frequent class of responses recorded, with most inactive behaviors occurring during the winter months. Both stereotypic and non-stereotypic activity emerged during the spring and summer months, with stereotypic activity occurring most frequently in the morning and transitioning to non-stereotypic activity in the latter part of the day. Results are discussed with respect to how captive grizzly bear behaviors relate to their natural seasonal and daily activity, as well as how events, such as feeding times and enrichment deliveries, can be used to optimize overall captive bear welfare.
1. Introduction
1.1. Brown Bears in the Wild
Wild brown bears (Ursus arctos) currently reside in 44 countries, inhabiting a variety of habitats, including dry Asian steppes, arctic shrublands, and temperate rain forests [1]. Researchers have found behavioral variation in subspecies and subpopulations based on geographic location, resource availability, and human influence [2,3,4,5]. The past data also suggest that most brown bear subspecies, including grizzly bears (Ursus acrtos horribilis), spend more time active around the spring and summer, less in the fall, and the least time active during the torpor months of winter [3,6,7,8,9,10]. Seasonal behavioral changes are thought to be influenced by food availability [3,9,10,11,12], breeding [8,9], age [2,13], and sex [14]. Most of the evidence on this behavioral variability is through secondary sources or non-field measures, due to the difficulty of direct observation of an elusive, long-ranging carnivore. These methods have included scat interpretation [15], radio collar tracking [3,16], observations in non-natural environments (e.g., zoos), or a combination of two or more methods [17].
With respect to their daily activity, brown bears have primarily been found to be diurnal [6,18], with peaks of activity in the early morning and evening. Some subpopulations have also been reported to be crepuscular or nocturnal [11,19,20]. A large proportion of their daily waking activity is thought to be foraging and eating, with bouts of rest and travel [8,9,12,13]. Brown bears have shown flexibility in their daily activity based on weather [6], light levels [19], age [2,13,14], and anthropogenic influences [7,18,21,22]. Seasonal and local changes in diet are thought to influence both circannual and circadian rhythms [11,23].
1.2. Brown Bears in Zoos
Brown bears, including grizzlies, are common within zoological institutions. Like their wild counterparts, a variety of factors influence their behavioral patterns—including, but not limited to, enclosure settings, daily and seasonal weather variation, type and amount of food delivered, feeding and environmental enrichment schedules, visitor and keeper interactions, and individuals housed within an enclosure [24,25,26,27,28]. Likewise, brown bear enclosures show considerable variability, from small, artificial enclosures to large, naturalistic exhibits [29,30,31]. Some facilities have on-exhibit and off-exhibit enclosures that allow for the bear(s) to be secured overnight and may provide the bear(s) with a winter den. Outdoor enclosures may have pools and/or streams, either natural or replica fall trees and logs, and vegetation.
Welfare Assessment and Stereotypies
Zoos use a variety of methods to promote the proper care and welfare of their bears. One standard measure of behavioral welfare is the comparison of wild and captive activity budgets [32,33,34]. Captive bears may display stereotypies not typical of their wild counterparts. Stereotypies have been defined as repetitive, largely invariant behavior patterns that serve no obvious goal or function [34]. Stereotypies are attributed to numerous factors, including sub-optimal environments, lack of environmental control, and species-typical appetitive behavior [35,36,37,38,39,40]. Stereotypies have been discussed as a possible indicator of poor welfare, with the display of stereotypies in bears and other animals used as evidence of an enclosure failing to meet the biological and/or behavioral needs of that animal [41,42,43,44]. Other studies have found that visitors perceived stereotypies to indicate a lower level of care and/or are negatively correlated with interest in financially supporting zoological institutions [45,46,47]. Thus, zoos place considerable effort in minimizing the display of stereotypies and increasing naturalistic behaviors in bears, typically through the use of environmental enrichment—including, but not limited, to changes in how and when food is presented and the use of foraging devices [48,49,50,51,52].
1.3. Study Purpose
The following study examined the seasonal and daily activity of two zoo-housed grizzly bears. Seventeen behaviors were split into seven classes of behavior and examined in terms of (1) month-to-month, (2) seasonal, and (3) hour-to-hour changes. The focus of the study was to (a) examine observed behavior change patterns as they correlated with changes in the bear’s environmental and husbandry practices, and (b) compare and contrast these patterns with those observed in their wild counterparts. Additionally, we hoped to better understand the function of the observed behaviors in terms of their species-typical and event-based occurrences, and thus, be better suited to provide evidence-based suggestions for optimizing the welfare of these and other captive bears.
2. Materials and Methods
2.1. Subjects and Setting
Two captive-born grizzly bears were the subjects of the study: Keema, and Denali, ~395 kg male bear and ~405 kg male bear, respectively. Both bears were 15-years-old at the study’s onset and were reproductively intact. They were a brother pair that came from Washington State University’s Bear Center in Pullman, Washington, and resided at the Woodland Park Zoo (Seattle, WA, USA) since November of 1994.
The bears resided in an exhibit in the Northern Trail zone of the zoo, and that contained three areas: An on-view outdoor area, ~1120 m2, an off-view outdoor exercise yard, ~410 m2, and a indoor space, ~250 m2. Both outdoor areas consisted of natural trees, deadfall, grass, and rocks. The on-view area also contained an artificial river that led to a viewing window pool that held ~95 kL of water (see Figure 1 and Figure 2).
Feeding enrichment was routinely provided in the form of scatter feeds and through devices, such as boomer balls in both outdoor areas. The indoor space consisted of individual dens for each of the bears. The indoor dens provided the bears with the opportunity to hibernate in the winter, although their regular feeding schedule made this unnecessary (see below). The bears were typically moved from the off-view area to the on-view area by 09:00 h, and then limited to the on-view area of the exhibit between 09:00 and 16:00 h (Fall/Winter; October–March) or 09:00 and 18:00 h (Spring/Summer; April–September), with some variability depending on weather conditions.
Diets for the bears varied based both on the individual and time of year, with 4.5–7 kg consumed per bear per day. The bear diet consisted of Mazuri® omnivore diet, whole chickens, trout, rabbits, yams, carrots, apples, honeydew melon, papaya, pears, cantaloupe, blueberries, romaine lettuce, celery, kale, and grass hay. Salmon, ground turkey, oranges, and alfalfa were also occasionally added to their diet, depending on availability. Treat items used for enrichment and/or training sessions included MarionTM leaf eater biscuits, Purina Omolene®, IamsTM dog food, and peanut butter. Diets were provided to the bears either twice a day (07:30 and 15:00 h) or three times a day (07:30, 11:00, and 15:00 h), dependent on their seasonal activity. The majority of their diet (at least half their daily diet) was provided at the 15:00 h feeding.
2.2. Materials
Materials included Palm® handhelds used to record behavioral data and an Event-PC program that was run on the Palm® handhelds and designed specifically for this experiment by James C. Ha at the University of Washington. Other materials included a notebook used to record potential errors and additional observations/field notes that occurred during a session.
2.3. Data Collection and Procedure
Prior to its implementation, the study was approved through Woodland Park Zoo’s Research Committee, as well as the University of Washington’s Institutional Animal Care and Use Committee (IACUC #2858-06). An ethogram modified from a prior zoo bear study [37] and consisting of 17 behaviors split into seven classes of behaviors was also developed prior to the implementation of the study (see Table 1).
The behaviors observed were mutually exclusive, and the inclusion of the “Other” observation category made the ethogram exhaustive. A modified scan sampling procedure [53] was used to record behaviors for both bears during all observation sessions. The number of bears on exhibit was recorded for behavior every 30 s for 30 min of observation for each session. These observations were then averaged for each session based on the total number of bears engaging in each behavior, and by a class of behavior. All observations were conducted in the on-view outdoor portion of the exhibit between 09:30–18:00 h, seven days a week, between 12th January 2010 and 26th January 2011 (902 total observations (1–8 observations per day) for 451 total hours of observations). Observers were typically registered for independent research credit through the Psychology Department at the University of Washington (PSY 499) and received observation training by live training sessions at the beginning of each semester and weekly lab meetings throughout the study. Observations were examined weekly by the first author for consistency across all observers, and drift was accounted for during these weekly checks, as well as through weekly lab meetings. All observations were scheduled on a semester basis, with observers filling times available during the week to account for as many observational times as possible. A total of 38 observers collected behavioral data for the entire study.
2.4. Statistical Analyses
SigmaStat, version 11.0 (Systat Software Inc., San Jose, CA, USA) was used to run all the statistical analyses. Only the classes of behavior that occurred more than 5% (Active, Forage, Inactive, and Stereotypy) were examined for month-to-month, seasonal, and hour-to-hour activity, as well as statistically analyzed. Because Shapiro-Wilk tests for normality failed, the differences for the four classes of behavior were tested for seasonal differences (Winter: December–February, n = 232 sessions; Spring: March–May, n = 325; Summer: June–August, n = 136; Fall: September–November, n = 209) using Kruskal–Wallis analysis of variance (ANOVA) on ranks tests. When significant differences (p < 0.05) for the ANOVAs were found, post-hoc pairwise comparisons (using Dunn’s Method) were implemented. Differences between the two combined January months (2010 (n = 38 sessions) and 2011 (n = 47 sessions); n = 85 total January sessions) and July (2010; n = 55 sessions) were tested using Mann-Whitney U tests. The two January months were combined after finding no significant differences between each class of behaviors (also Mann-Whitney U tests). January and July were directly compared because they were representative months for further examinations of the seasonal differences between the traditional winter (January) hibernation and summer (July) activity periods.
3. Results
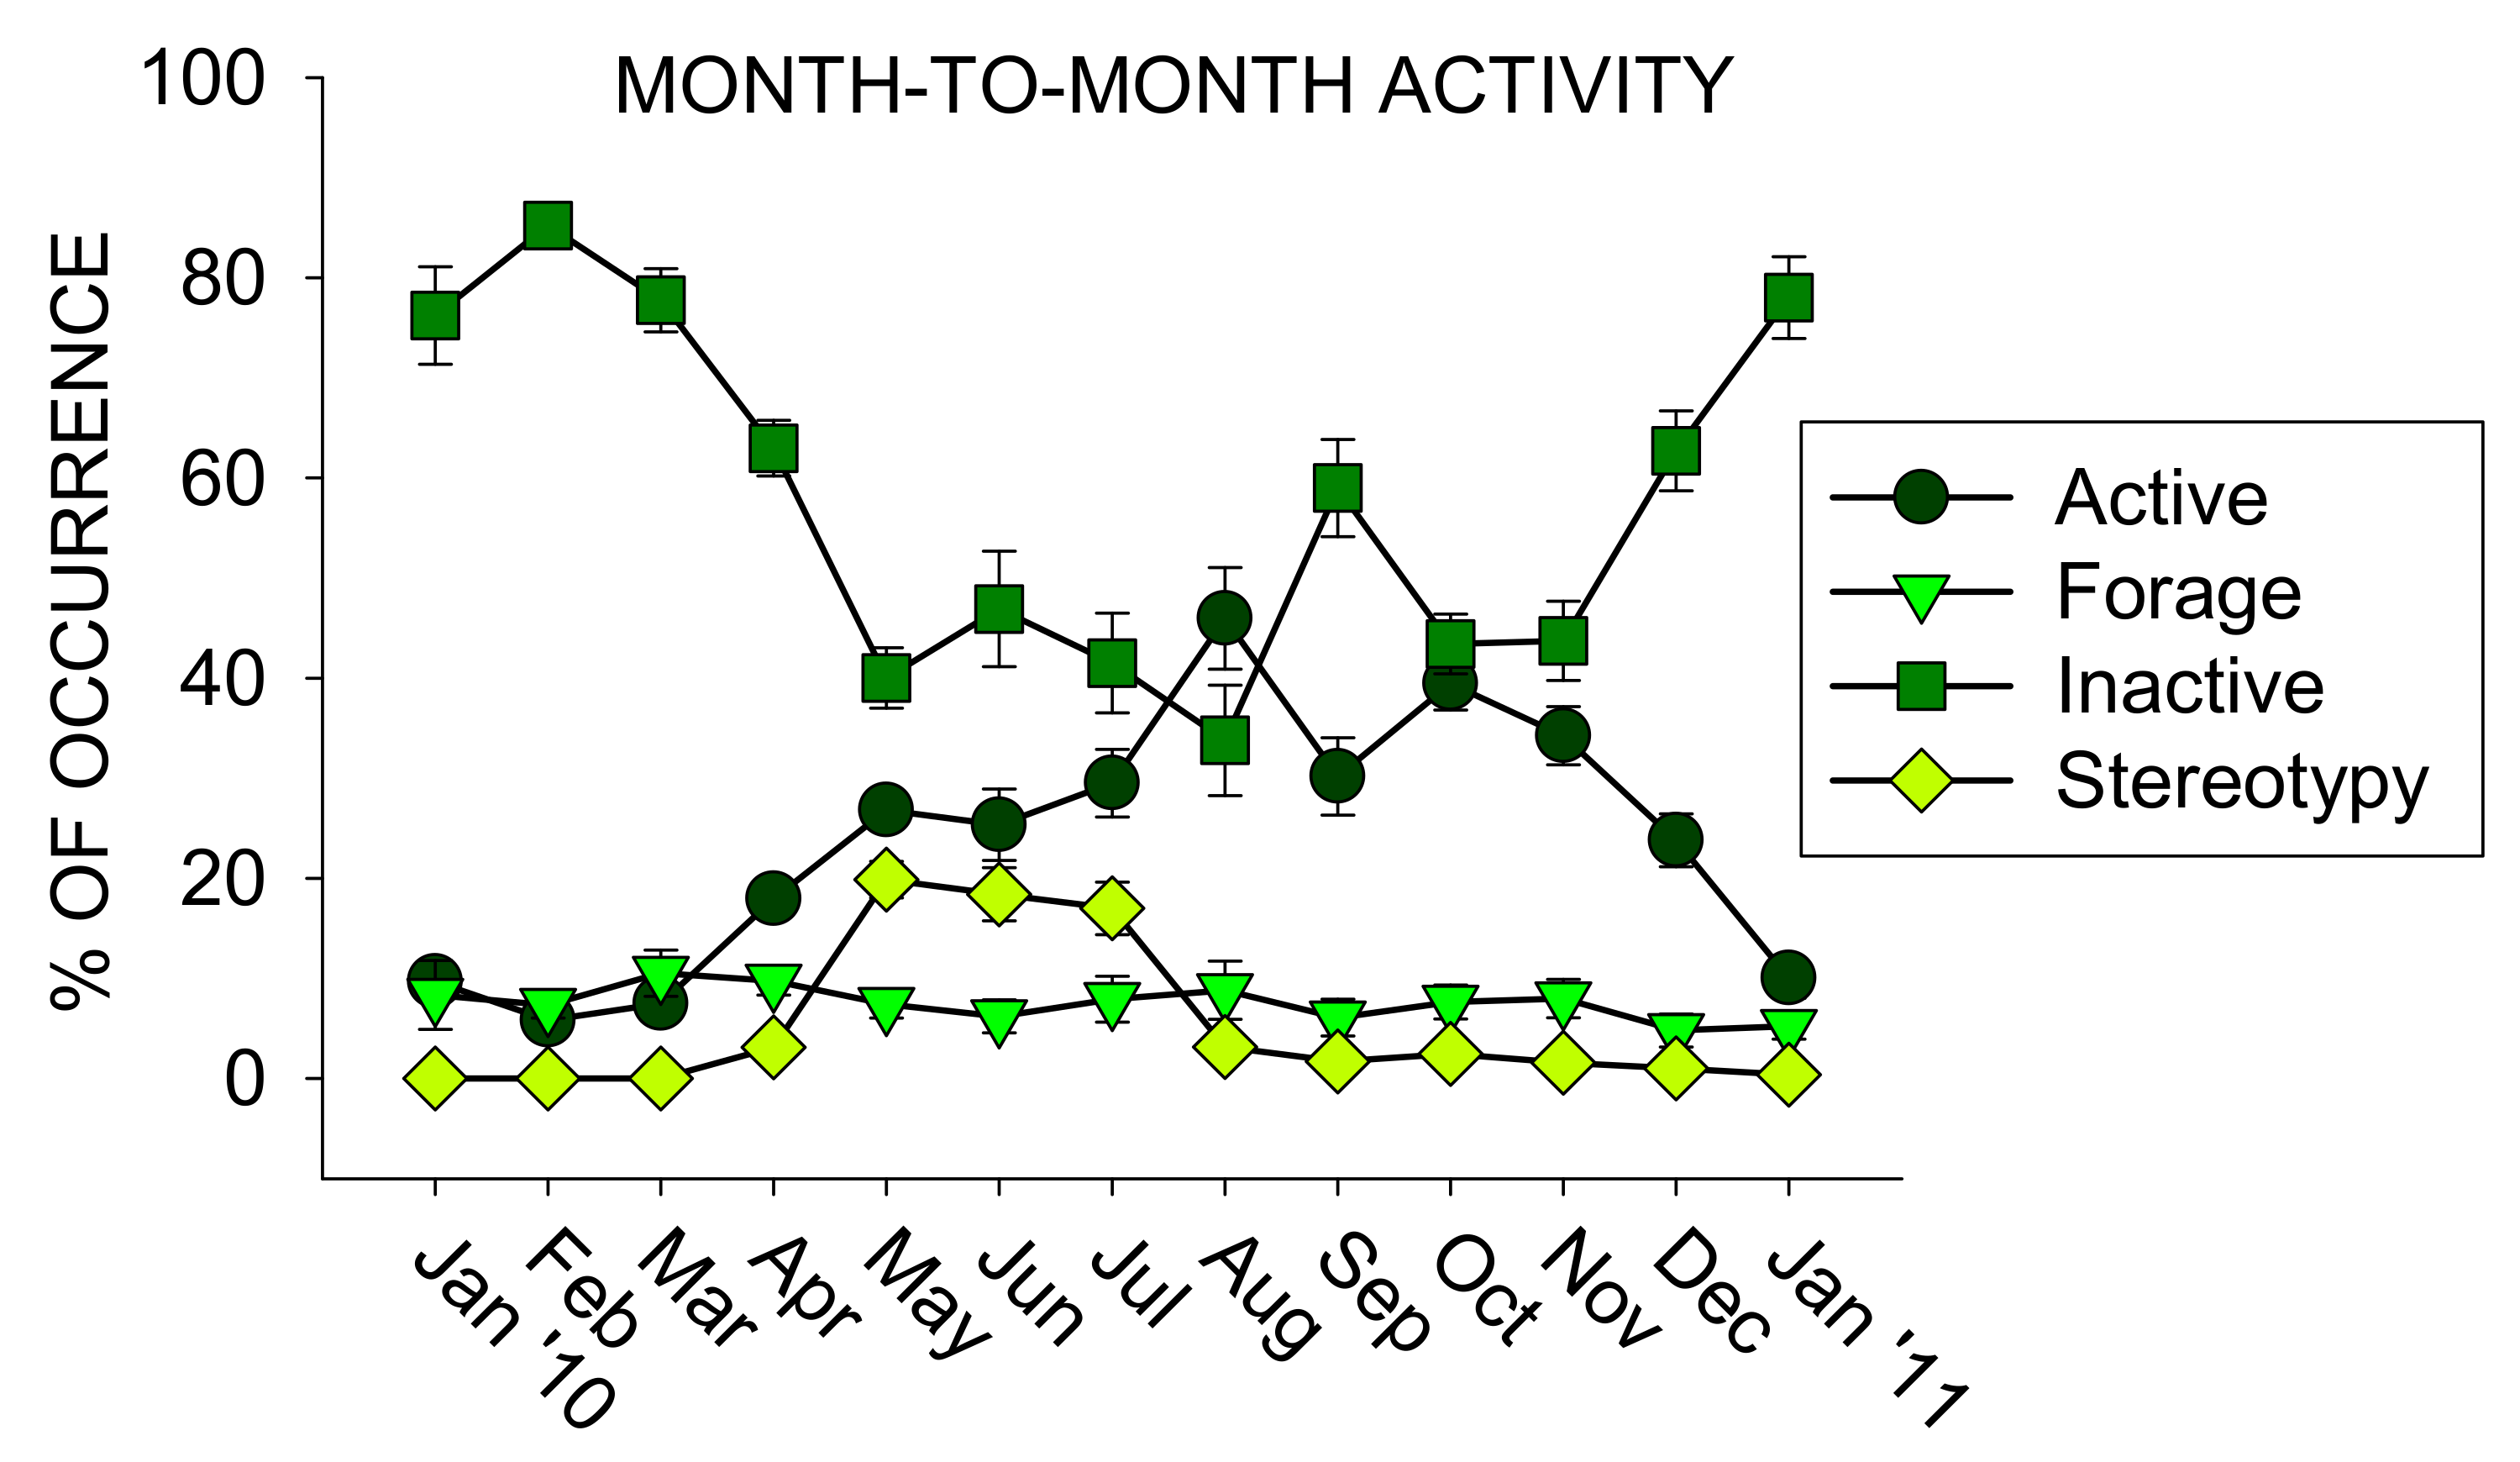
Overall, Inactive was the most frequently occurring class of behavior (M = 57.8%, SE = 1.2%), followed by Active (M = 22.9%, SE = 0.8%), Forage (M = 7.8%, SE = 0.5%), Stereotypy (M = 5.9%, SE = 0.4%), Other (M = 4.1%, SE = 0.4%), Social (M = 1.2%, SE = 0.2%), and Groom (M = 0.4%, SE = 0.1%). Figure 3 shows the month-to-month activity for the 13 months of observation.
During January through March, Inactivity was the most frequent class of behavior, occurring on average above 75% of all behaviors recorded. All other classes of behaviors during these months occurred ~10% or less. Starting in April, Active rose to 18% (SE = 1.5) of all behaviors recorded, until Active peaked in August at almost half of all behaviors observed (M = 46%, SE = 5.1). The Stereotypy class of behaviors occurred ~3% or less of behaviors recorded during all observations, except for May through July: 19.9% (May; SE = 1.8), 18.4% (June; SE = 2.7), and 17% (July; SE = 2.6). The Forage class of behaviors remained relatively stable, ranging from 5–10% of all behaviors recorded.
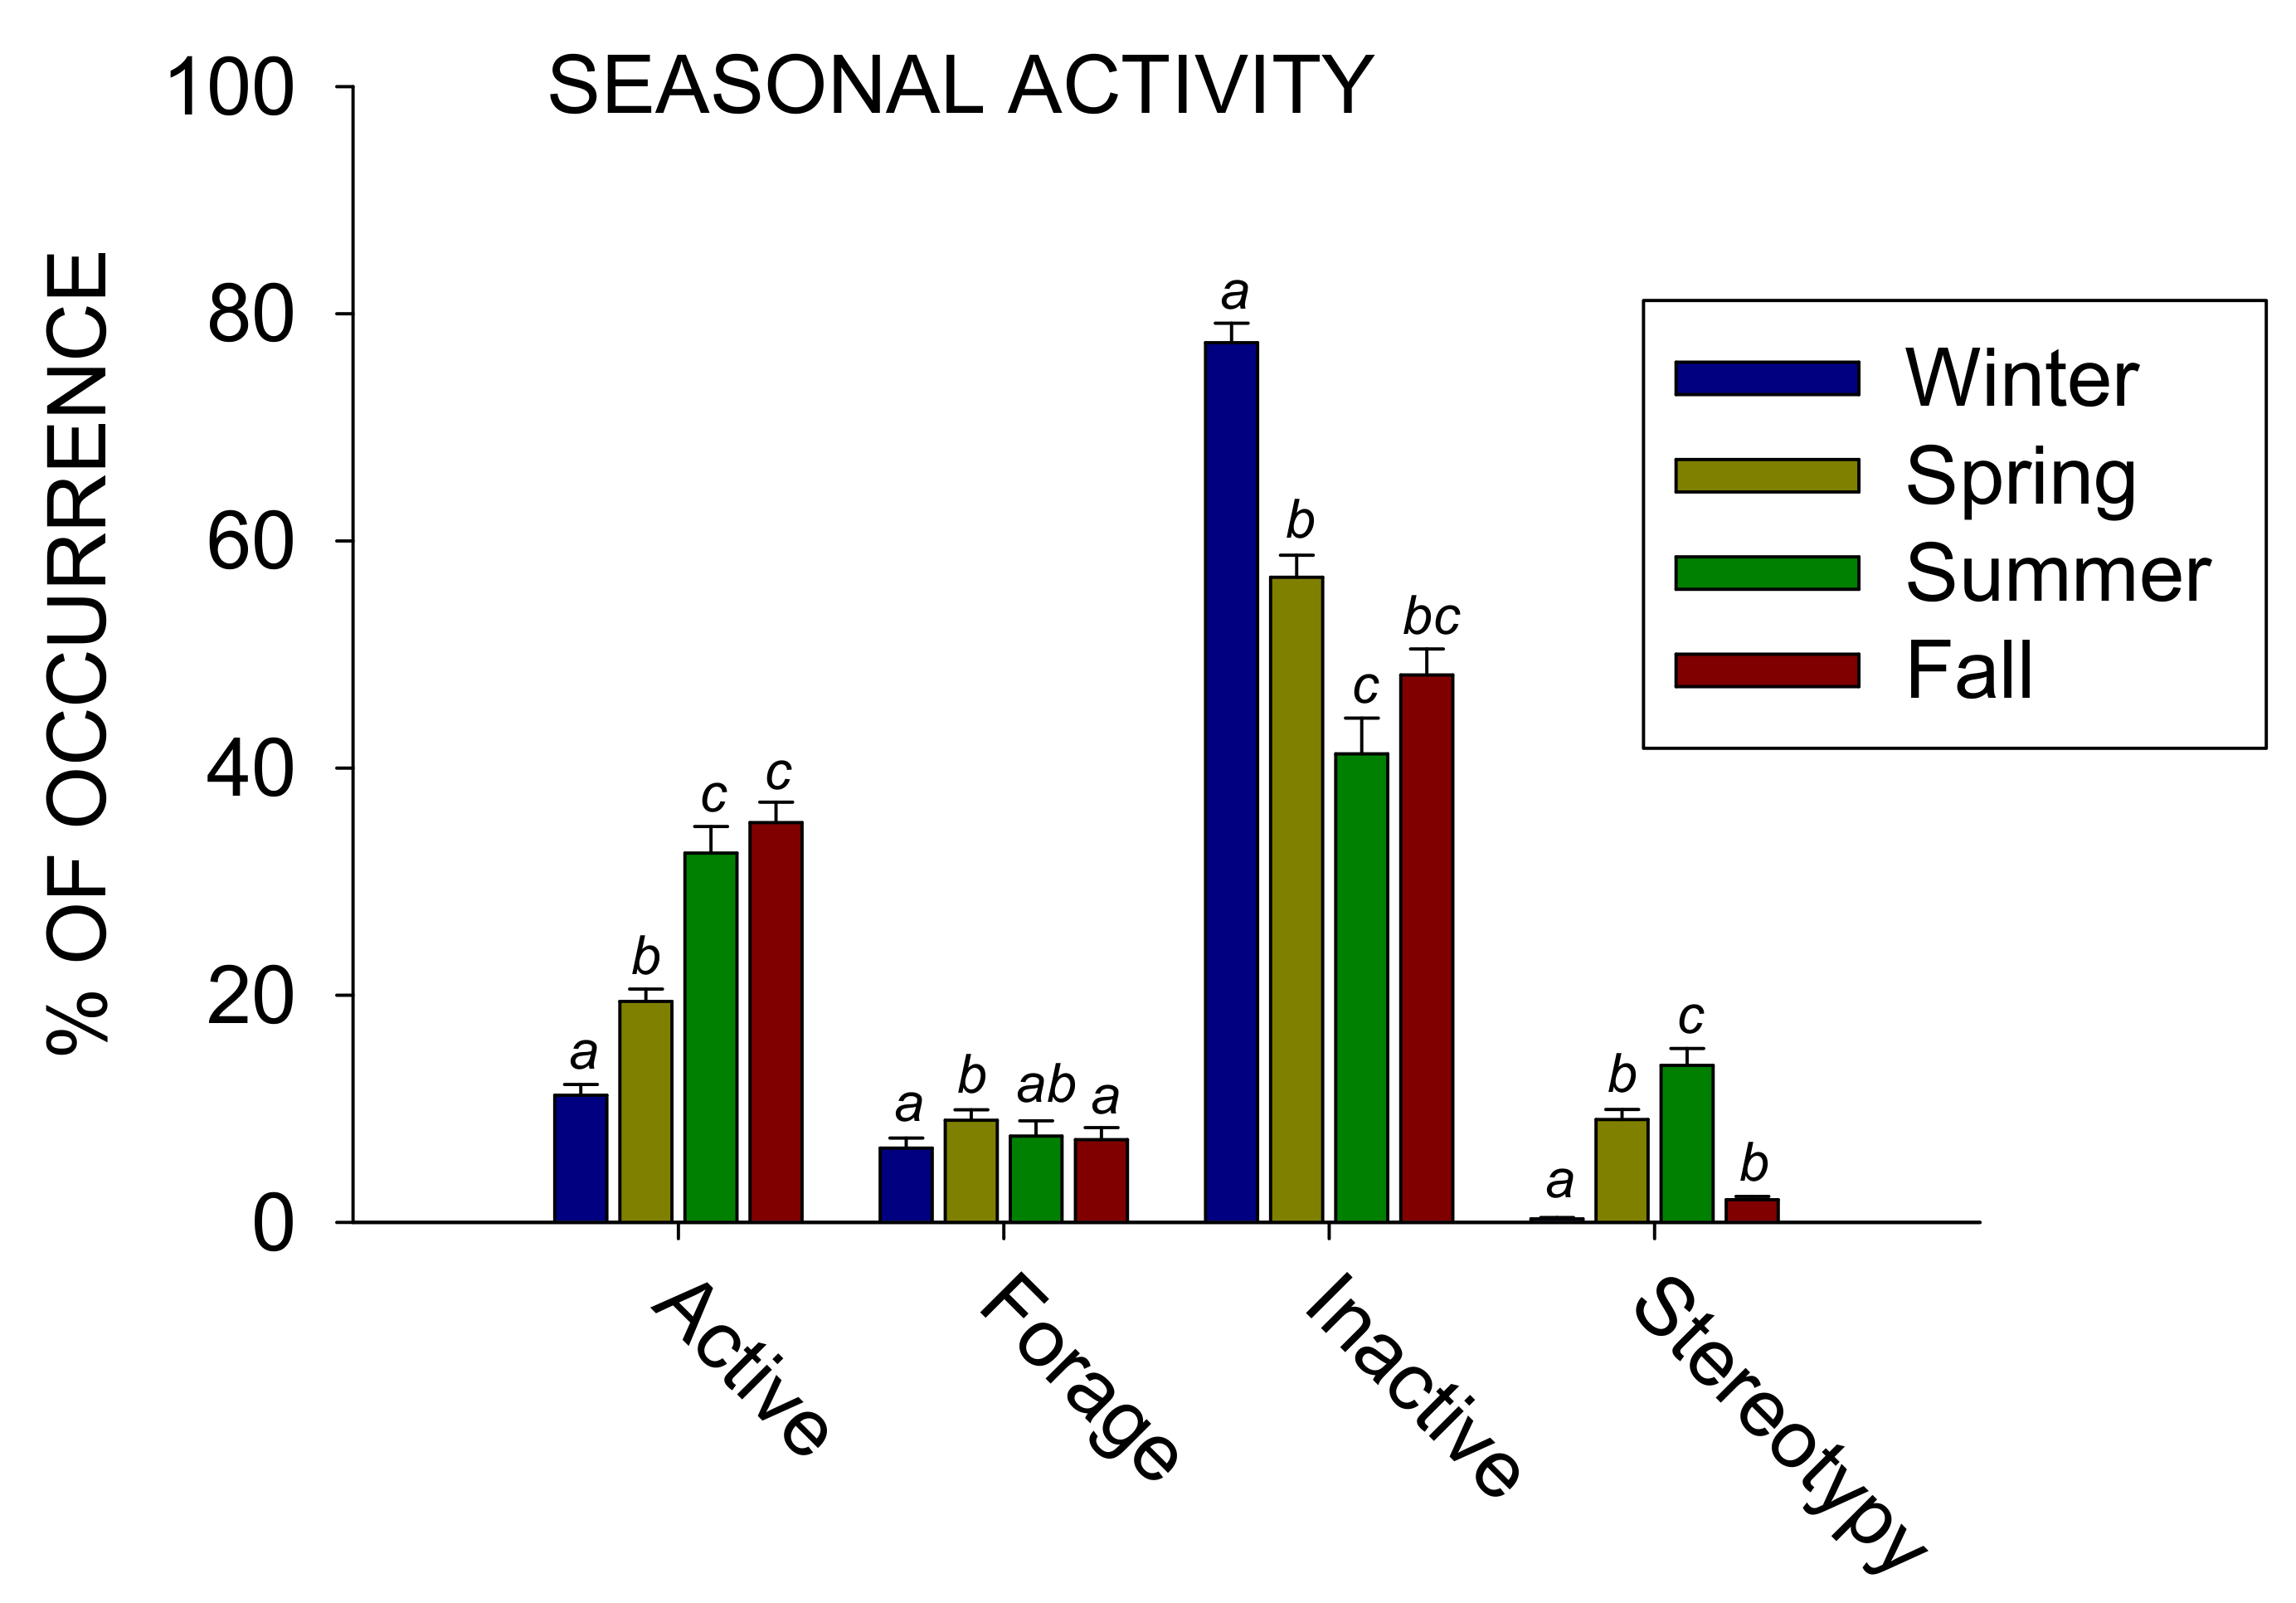
Figure 4 shows the comparison between the four seasons:
All four classes of behaviors tested for differences across the four seasons showed a statistically significant effect: Active (x23 = 123.230, p < 0.001), Forage (x23 = 14.949, p = 0.002), Inactive (x23 = 115.395, p < 0.001), and Stereotypy (x23 = 133.534, p < 0.001). For Active, post-hoc tests showed a significant difference when comparing the winter to all other seasons and also the spring to both the summer and fall (p < 0.05 for all). Active increased from 11.2% (SE = 0.9) in the winter to 19.5% (SE = 1.1) in the spring, increased to 32.5% (SE = 2.3) in the summer, and increased to 35.2% (SE = 1.8) in the spring. For Forage, post-hoc tests showed a significant difference when comparing the spring to both the winter and fall (p < 0.05 for both). Forage increased from 6.5% (SE = 0.9) in the winter to 9.0% (SE = 0.9) in the spring, decreased to 7.6% (SE = 1.3) in the summer, and decreased to 7.3% (SE = 1.0) in the spring. For Inactive, post-hoc tests showed a significant difference when comparing the winter to all other seasons and the spring to the summer (p < 0.05 for all). Inactive decreased from 77.4% (SE = 1.7) in the winter to 56.8% (SE = 1.9) in the spring, decreased to 41.2% (SE = 3.1) in the summer, and increased to 48.2% (SE = 2.3) in the spring. For Stereotypy, post-hoc tests showed a significant difference when comparing the winter to all other seasons and also the summer to both the spring and fall (p < 0.05 for all). Stereotypy increased from 0.3% (SE = 0.1) in the winter to 9.0% (SE = 0.9) in the spring, increased to 13.8% (SE = 1.5) in the summer, and decreased to 2.0% (SE = 0.3) in the spring.
To further examine the behavioral differences that occurred seasonally, we compared two months (January and July), which in the wild would be representative of winter hibernation and summer activity periods, respectively. Figure 5 shows the comparison between the two combined January months and July:
Three of the four classes of behaviors tested for differences between January and July showed a statistically significant effect: Active (U138 = 1265, p < 0.001), Inactive (U138 = 1145, p < 0.001), and Stereotypy (U138 = 783.5, p < 0.001). Between January and July, Active increased from 9.9% (SE = 1.5) to 29.5% (SE = 3.4), Inactive decreased from 77.2% (SE = 3.1) to 41.5% (SE = 5.0), and Stereotypy increased from 0.2% (SE = 0.2) to 17% (SE = 2.6).
Figure 6 shows the hour-to-hour activity for the two combined January months and July.
In the January months (both 2010 and 2011), when the bears were observed in the on-view area of the exhibit from 09:00–16:00 h, Inactive occurred from the morning until 13:00 for > 90% of all observations. As Inactive decreased to ~30% by the 15:00–16:00 h period of observation, both Active and Forage increased from 11.6% (Active) and 5.4% (Forage) to 22.3% and 22.4%, respectively. During July, Inactive remained below 20% except for during the 10:00–11:00 h (35.3%) and 11:00–12:00 h (28.3%) periods, and then later increased, beginning at 15:00–16:00 h from 49.5% to 91.1% and 100% during the 16:00–17:00 and 17:00–18:00 h periods, respectively. Active, Forage, and Stereotypy showed two peaks in activity, with Active beginning high (39.2%) from 09:00–10:00 h, decreasing, and then peaking to their highest occurrence from 14:00–15:00 h at 67.5%. Forage occurred in its highest frequency during the 11:00–12:00 h (22.3%) and the 15:00–16:00 h periods (9.8%). Stereotypy occurred in highest frequency from 10:00–11:00 h (48.4%), decreased, and then peaked again to 28.6% during the 13:00–14:00 h period of observation.
4. Discussion
4.1. Seasonal Activity
The zoo-housed bears in this study showed considerable variability in their behaviors throughout the year, with the majority of their winter spent being inactive (hibernation period), and active behaviors increasing toward the summer/fall starting in April. As mentioned earlier, this is similar to their wild counterparts, depending on a variety of factors, including food availability, weather, and amount of daylight. Both circannual and circadian rhythms are known to be entrainable to a variety of stimuli, including food [54]. Although Ware et al. [20] have documented that the circannual rhythm of brown bears appears to be entrained by photoperiod zeitgebers, they and others have also noted that both the daily and seasonal activity of brown bears is likely most sensitive to food availability, as opposed to daylength or temperature [18]. In one study, a wild population of grizzly bears in Slovenia were supplemented with large quantities of corn during denning months and found that they denned for significantly shorter periods and abandoned dens more frequently than bears living at the same latitude without the corn subsidies [55].
Stereotypies only emerged for the bears in this study for three months: May–July. During these months, stereotypic activity, primarily in the form of pacing, occurred for ~17–20% of their monthly activity, as opposed to ~3% or less of their monthly activity outside of these months. Stereotypies in captive bears, and more generally, in carnivores have been argued to have an appetitive function, related to their natural foraging behavior [36,37]. Captive bears are known to exhibit some of the highest levels of stereotypies, which have been directly correlated with home-range size, and with zoo-housed polar bears having some of the highest frequency of stereotypies and largest home-range sizes for any zoo-housed carnivore [56]. It is likely that the low level of stereotypic activity for the bears in this study was related to being fed multiple times a day (2 or 3 times) and an environmental enrichment program directed at reducing this suite of behaviors, which have both been associated with lower levels of stereotypies in bears [24,26].
The emergence of stereotypies from May–July for zoo-housed bears may be less clear, however; it coincides with the breeding season for grizzly bears when, typically, wild grizzlies would be foraging less [57]. Other researchers have shown a similar occurrence in a solitary zoo-housed American black bear (Ursus americanus) [58]. In their study, stereotypies increased in prevalence during the months of May through July, the pacing/circling response observed changed in form and location to areas closer to a female brown bear exhibit, and feeding enrichment was less effective at deterring the stereotypic activity. Carlstead and Seidensticker [58] were able to effectively intervene on the black bear’s stereotypies by introducing bear odors as a form of environmental enrichment.
4.2. Daily Activity
As observed by comparing the months of January and July, the daily activity of the bears in this study showed considerable variability that corresponded with the season. In January, the bears were primarily inactive, increasing in activity and eventual foraging behaviors toward the largest 15:00 h daily feed. In July, when stereotypies accounted for 17% of their monthly activity, stereotypic activity showed two spikes: One leading to the 11:00 h feeding time, and the other increasing to the 15:00 h feeding time. Although, as noted above, mate-seeking behavior may be causally related to the May through July occurrence of stereotypies, the times at which these stereotypies occurred still appeared entrained to the feeding schedules. Past research has shown similar patterns for stereotypic pacing in zoo bears, with pacing occurring in anticipation of food events and reduced as a result of providing multiple feeding opportunities [26,37,59,60,61].
While the relationship between stereotypies, general activity, and feeding schedules for zoo-housed animals is less clear, it appears that many aspects of feeding schedules and feeding enrichment directly entrain the circadian rhythms of those captive animals. Aside from the use of multiple feedings and environmental enrichment previously discussed, simply changing the predictability/variability of feeding events is effective at increasing general activity and reducing abnormal behaviors, such as stereotypies [60,61]. In addition, grizzlies will choose to engage in foraging-related activity over freely distributed feeding opportunities (i.e., contrafreeloading) [62]. By attending to when events occur both seasonally and daily, we are better suited to understand the relationship between environmental events, species-typical behaviors, and the behavior of zoo-housed brown bears.
4.3. Captive Grizzly Bear Activity Concluded
The behavioral patterns of zoo-housed bears are related to both the ways in which those bears are exhibited and the natural behaviors of their wild counterparts. Studying both the seasonal and daily activity of captive bears allows us to better understand how to manage zoo-housed bears, which includes how circannual and circadian rhythms are entrained by environmental events. Equally so, academicians, conservationists, and researchers should look to the behavior of captive bears and other zoo-housed animals as a means to better understand the causal factors responsible for the behaviors they observe in the wild. Zoos provide a unique environment for the study of bears, since direct observation or experimentation of variables related to bear behavior is otherwise difficult in the wild. While most zoological facilities are limited by the number of individuals for any one species housed, and care should be taken in generalizing results beyond the settings or subjects studied, such research can be critical for fostering any animal research endeavors. Done successfully, behavioral research conducted in zoos can produce information that directly benefits our understanding of bear behavior, as well as how to manage those zoo-housed bears [63]. Mutual collaborations between scientists and practitioners should foster new research ideas, new management techniques, and new ways to benefit the welfare and conservation of all bears.
Author Contributions
Conceptualization, E.J.F.; methodology, E.J.F.; software, E.J.F.; formal analysis, E.J.F.; investigation, E.J.F.; resources, E.J.F., E.Y., and N.A.; data curation, E.J.F.; writing—original draft preparation, E.J.F., E.Y., and N.A.; writing—review and editing, E.J.F., E.Y., and N.A.; project administration, E.J.F. All authors have read and agreed to the published version of the manuscript.
Funding
This study was completed while the first author was funded by a National Science Foundation Postdoctoral Fellowship in the Psychology Department at the University of Washington.
Acknowledgments
The authors would like to thank all the Behavioral Enrichment Animal Research (BEAR) group’s Research Assistants for help in collecting the data. The authors would also like to thank the Woodland Park Zoo staff for making this research possible and assisting in its implementation.
Conflicts of Interest
The authors declare no conflict of interest. The funders had no role in the design of the study; in the collection, analyses, or interpretation of data; in the writing of the manuscript, or in the decision to the results.
References
- McLellan, B.N.; Proctor, M.F.; Huber, D.; Michel, S. Ursus Arctos; IUCN: Gland, Switzerland, 2017. [Google Scholar]
- Roth, H.U.; Huber, D. Diel activity of brown bears in Plitvice Lakes national Park, Yugoslavia. Bears Their Biol. Manag. 1986, 6, 177–181. [Google Scholar] [CrossRef]
- Clevenger, A.P.; Purroy, F.J.; Pelton, M.R. Movement and activity patterns of a European brown bear in the Cantabrian Mountains, Spain. Bears Their Biol. Manag. 1990, 8, 205–211. [Google Scholar] [CrossRef]
- Swenson, J.E. Does hunting affect the behavior of brown bears in Eurasia? Ursus 1999, 11, 157–162. [Google Scholar]
- Ordiz, A.; Kindberg, J.; Sæbø, S.; Swenson, J.E.; Støen, O.G. Brown bear circadian behavior reveals human environmental encroachment. Biol. Conserv. 2014, 173, 1–9. [Google Scholar] [CrossRef]
- Seryodkin, I.V.; Kostyria, A.V.; Goodrich, J.M.; Miquelle, D.G. Daily activity patterns of brown bear (Ursus arctos) of the Sikhote-Alin mountain range (Primorskiy Krai, Russia). Rus. J. Ecol. 2013, 44, 50–55. [Google Scholar] [CrossRef]
- Roth, H.U. Diel activity of a remnant population of European brown bears. Bears Their Biol. Manag. 1983, 5, 223–229. [Google Scholar] [CrossRef]
- Gebhard, J.G. Annual Activities and Behavior of a Grizzly Bear (Ursus Arctos) Family in Northern Alaska. Ph.D. Thesis, University of Alaska, Farbanks, AL, USA, 1982. [Google Scholar]
- MacHutchon, A.G. Grizzly bear activity budget and pattern in the Firth River Valley, Yukon. Ursus 2001, 12, 189–198. [Google Scholar]
- Evans, A.L.; Singh, N.J.; Friebe, A.; Arnemo, J.M.; Laske, T.G.; Fröbert, O.; Swenson, J.E.; Blanc, S. Drivers of hibernation in the brown bear. Front. Zool. 2016, 13, 7–21. [Google Scholar] [CrossRef]
- MacHutchon, A.G.; Himmer, S.; Davis, H.; Gallagher, M. Temporal and spatial activity patterns among coastal bear populations. Ursus 1998, 10, 539–546. [Google Scholar]
- Phillips, M.K. Behavior and habitat use of grizzly bears in northeastern Alaska. Bears Their Biol. Manag. 1987, 7, 159–167. [Google Scholar] [CrossRef]
- Kaczensky, P.; Huber, D.; Knauer, F.; Roth, H.; Wagner, A.; Kusak, J. Activity patterns of brown bears (Ursus arctos) in Slovenia and Croatia. J. Zool. 2006, 269, 474–485. [Google Scholar] [CrossRef]
- McCann, R.K. Activity Measures of Free-Ranging Grizzly Bears (Ursus arctos) in the Flathead Drainage. Ph.D. Thesis, University of British Columbia, Vancouver, BC, Canada, 1991. [Google Scholar]
- Mattson, D.J.; Blanchard, B.M.; Knight, R.R. Food habits of Yellowstone grizzly bears, 1977–1987. Can. J. Zool. 1991, 69, 1619–1629. [Google Scholar] [CrossRef]
- Kaczensky, P.; Knauer, F.; Jonozovic, M.; Walzer, C.; Huber, T. Experiences with trapping, chemical immobilization, and radiotagging of brown bears in Slovenia. Ursus 2002, 13, 347–356. [Google Scholar]
- Grandia, P.A.; van Dijk, J.J.; Koene, P. Stimulating natural behavior in captive bears. Ursus 2001, 12, 199–202. [Google Scholar]
- McLellan, M.L.; McLellan, B.N. Effect of season and high ambient temperature on activity levels and patterns of grizzly bears (Ursus arctos). PLoS ONE 2015, 10, e0117734. [Google Scholar] [CrossRef] [PubMed] [Green Version]
- Klinka, D.R.; Reimchen, T.E. Nocturnal and diurnal foraging behaviour of brown bears (Ursus arctos) on a salmon stream in coastal British Columbia. Can. J. Zool. 2002, 80, 1317–1322. [Google Scholar] [CrossRef] [Green Version]
- Ware, J.V.; Nelson, O.L.; Robbins, C.T.; Jansen, H.T. Temporal organization of activity in the brown bear (Ursus arctos): Roles of circadian rhythms, light, and food entrainment. Am. J. Physiol. Regul. Integr. Comp. Physiol. 2012, 303, R890–R902. [Google Scholar] [CrossRef] [Green Version]
- Olson, T.L.; Squibb, R.C.; Gilbert, B.K. Brown bear diurnal activity and human use: A comparison of two salmon streams. Ursus 1998, 10, 547–555. [Google Scholar]
- Sarah, E.; Shultis, J. Impacts of boat-based wildlife viewing in the K’tzim-a-Deen Inlet on grizzly bear (Ursus arctos) behavior. Nat. Areas J. 2015, 35, 404–415. [Google Scholar] [CrossRef]
- Peirce, K.N.; Van Daele, L.J. Use of a garbage dump by brown bears in Dillingham, Alaska. Ursus 2006, 17, 165–177. [Google Scholar] [CrossRef]
- Carlstead, K.; Seidensticker, J.; Baldwin, R. Environmental enrichment for zoo bears. Zoo Biol. 1991, 10, 3–16. [Google Scholar] [CrossRef]
- Fernandez, E.J.; Tamborski, M.A.; Pickens, S.R.; Timberlake, W. Animal–visitor interactions in the modern zoo: Conflicts and interventions. Appl. Anim. Behav. Sci. 2009, 120, 1–8. [Google Scholar] [CrossRef]
- Forthman, D.L.; Elder, S.D.; Bakeman, R.; Kurkowski, T.W.; Noble, C.C.; Winslow, S.W. Effects of feeding enrichment on behavior of three species of captive bears. Zoo Biol. 1992, 11, 187–195. [Google Scholar] [CrossRef]
- Law, G.; Boyle, H.; Johnston, J.; MacDonald, A. Food presentation. Part 1: Bears. Ratel 1990, 17, 44–46. [Google Scholar]
- Law, G.; Reid, A. Enriching the lives of bears in zoos. Int. Zoo Yearb. 2010, 44, 65–74. [Google Scholar] [CrossRef]
- Keulen-Kromhout, G.V. Zoo enclosures for bears. Int. Zoo Yearb. 1978, 18, 177–186. [Google Scholar] [CrossRef]
- Montaudouin, S.; Le Pape, G. Comparison of the behaviour of European brown bears (Ursus arctos arctos) in six different parks, with particular attention to stereotypies. Behav. Process. 2004, 67, 235–244. [Google Scholar] [CrossRef]
- Montaudouin, S.; Le Pape, G. Comparison between 28 zoological parks: Stereotypic and social behaviours of captive brown bears (Ursus arctos). Appl. Anim. Behav. Sci. 2005, 92, 129–141. [Google Scholar] [CrossRef]
- Hediger, H. Man and Animal in the Zoo; Delacorte Press: New York, NY, USA, 1969. [Google Scholar]
- Lindburg, D.G. Improving the feeding of captive felines through application of field data. Zoo Biol. 1988, 7, 211–218. [Google Scholar] [CrossRef]
- Veasey, J.S.; Waran, N.K.; Young, R.J. On comparing the behaviour of zoo housed animals with wild conspecifics as a welfare indicator. Anim. Welf. 1996, 5, 13–24. [Google Scholar]
- Mason, G.J. Stereotypies: A critical review. Anim. Behav. 1991, 41, 1015–1037. [Google Scholar] [CrossRef] [Green Version]
- Carlstead, K. Determining the causes of stereotypic behaviors in zoo carnivores: Toward appropriate enrichment strategies. In Second Nature: Environmental Enrichment for Captive Animals; Sherpherdson, D.J., Mellen, J.D., Hutchins, M., Eds.; Smithsonian Institutional Press: Washington, DC, USA, 1998; pp. 172–183. [Google Scholar]
- Fernandez, E.J. Stereotypies and Foraging: Appetitive Search Behaviors and Stereotypies in Captive Animals; VDM Publishing: Saarbrücken, Germany, 2010. [Google Scholar]
- Fernandez, E.J.; Timberlake, W. Foraging devices as enrichment in captive walruses (Odobenus rosmarus). Behav. Process. 2019, 168, 103943. [Google Scholar] [CrossRef] [PubMed]
- Mason, G.J.; Latham, N. Can’t stop, won’t stop: Is stereotypy a reliable animal welfare indicator? Anim. Welf. 2004, 13, 57–69. [Google Scholar]
- Ross, S.R. Issues of choice and control in the behaviour of a pair of captive polar bears (Ursus maritimus). Behav. Process. 2006, 73, 117–120. [Google Scholar] [CrossRef] [PubMed]
- Lawrence, A.B.; Terlouw, E.C. A review of behavioral factors involved in the development and continued performance of stereotypic behaviors in pigs. J. Anim. Sci. 1993, 71, 2815–2825. [Google Scholar] [CrossRef] [PubMed]
- Mason, G.J. Stereotypies and suffering. Behav. Process. 1991, 25, 103–115. [Google Scholar] [CrossRef] [Green Version]
- Mason, G.; Clubb, R.; Latham, N.; Vickery, S. Why and how should we use environmental enrichment to tackle stereotypic behaviour? Appl. Anim. Behav. Sci. 2007, 102, 163–188. [Google Scholar] [CrossRef] [Green Version]
- Swaisgood, R.R.; Shepherdson, D.J. Scientific approaches to enrichment and stereotypies in zoo animals: What’s been done and where should we go next? Zoo Biol. 2005, 24, 499–518. [Google Scholar] [CrossRef]
- Godinez, A.M.; Fernandez, E.J. What is the Zoo Experience? How Zoos Impact a Visitor’s Behaviors, Perceptions, and Conservation Efforts. Front. Psychol. 2019, 10, 1746. [Google Scholar] [CrossRef] [Green Version]
- Godinez, A.M.; Fernandez, E.J.; Morrissey, K. Visitor behaviors and perceptions of jaguar activities. Anthrozoös 2013, 26, 613–619. [Google Scholar] [CrossRef]
- Miller, L.J. Visitor reaction to pacing behavior: Influence on the perception of animal care and interest in supporting zoological institutions. Zoo Biol. 2012, 31, 242–248. [Google Scholar] [CrossRef] [PubMed]
- Maple, T.L.; Perdue, B.M. Zoo Animal Welfare; Springer: Berlin, Germany, 2013. [Google Scholar]
- Markowitz, H. Behavioral Enrichment in the Zoo; Van Nostrand Reinhold: New York, NY, USA, 1982. [Google Scholar]
- Markowitz, H. Enriching Animal Lives; Mauka Press: Pacifica, CA, USA, 2011. [Google Scholar]
- Sherpherdson, D.J.; Mellen, J.D.; Hutchins, M. (Eds.) Second Nature: Environmental Enrichment for Captive Animals; Smithsonian Institutional Press: Washington, DC, USA, 1998. [Google Scholar]
- Young, R.J. Environmental Enrichment for Captive Animals; Wiley-Blackwell: Hoboken, NJ, USA, 2003. [Google Scholar]
- Altmann, J. Observational study of behavior: Sampling methods. Behaviour 1974, 49, 227–265. [Google Scholar] [CrossRef] [PubMed] [Green Version]
- Gillman, A.G.; Rebec, G.V.; Pecoraro, N.; Kosobud, A.E. Circadian entrainment by food and drugs of abuse. Behav. Process. 2019, 165, 23–28. [Google Scholar] [CrossRef] [PubMed]
- Krofel, M.; Špacapan, M.; Jerina, K. Winter sleep with room service: Denning behaviour of brown bears with access to anthropogenic food. J. Zool. 2017, 302, 8–14. [Google Scholar] [CrossRef]
- Clubb, R.E.; Mason, G.J. Captivity effects on wide-ranging carnivores. Nature 2003, 425, 473–474. [Google Scholar] [CrossRef]
- Schwartz, C.C.; Miller, S.D.; Haroldson, M.A. Grizzly bear. In Wild Mammals of North America: Biology, Management, and Conservation; JHU Press: Baltimore, MD, USA, 2003; pp. 556–586. [Google Scholar]
- Carlstead, K.; Seidensticker, J. Seasonal variation in stereotypic pacing in an American black bear (Ursus americanus). Behav. Process. 1991, 25, 155–161. [Google Scholar] [CrossRef]
- Andrews, N.L.; Ha, J.C. The effects of automated scatter feeders on captive grizzly bear activity budgets. J. Appl. Anim. Welf. Sci. 2014, 17, 148–156. [Google Scholar] [CrossRef]
- Bloomsmith, M.A.; Lambeth, S.P. Effects of predictable versus unpredictable feeding schedules on chimpanzee behavior. Appl. Anim. Behav. Sci. 1995, 44, 65–74. [Google Scholar] [CrossRef]
- Wagman, J.D.; Lukas, K.E.; Dennis, P.M.; Willis, M.A.; Carroscia, J.; Gindlesperger, C.; Schook, M.W. A work-for-food enrichment program increases exploration and decreases stereotypies in four species of bears. Zoo Biol. 2018, 37, 3–15. [Google Scholar] [CrossRef]
- McGowan, R.T.; Robbins, C.T.; Alldredge, J.R.; Newberry, R.C. Contrafreeloading in grizzly bears: Implications for captive foraging enrichment. Zoo Biol. 2010, 29, 484–502. [Google Scholar] [CrossRef]
- Fernandez, E.J.; Timberlake, W. Mutual benefits of research collaborations between zoos and academic institutions. Zoo Biol. 2008, 27, 470–487. [Google Scholar] [CrossRef] [PubMed]
Figure 1.
On-view outdoor area of the exhibit, with Denali (left) and Keema (right) engaged in Lying Down (Inactive). Photo credit: Scott Richardson.
Figure 1.
On-view outdoor area of the exhibit, with Denali (left) and Keema (right) engaged in Lying Down (Inactive). Photo credit: Scott Richardson.

Figure 2.
On-view outdoor area of the exhibit with artificial river and pool visible. Denali is engaged in Standing (Active). Photo credit: Scott Richardson.
Figure 2.
On-view outdoor area of the exhibit with artificial river and pool visible. Denali is engaged in Standing (Active). Photo credit: Scott Richardson.

Figure 3.
The average percentage of occurrence (with the standard error of the mean) for the four most occurring classes of behavior for each month of observation during the study (x-axis).
Figure 3.
The average percentage of occurrence (with the standard error of the mean) for the four most occurring classes of behavior for each month of observation during the study (x-axis).

Figure 4.
The average percentage of occurrence (with the standard error of the mean) for the four most occurring classes of behavior (x-axis) across the four seasons. Different letters represent significant differences (p < 0.05) between the seasons, while the same letters represent no significant difference.

Figure 5.
The average percentage of occurrence (with the standard error of the mean) for the four most occurring classes of behavior (x-axis) for January (2010 + 2011) compared to July (2010). Solid bars with * represent significant differences (p < 0.001).
Figure 5.
The average percentage of occurrence (with the standard error of the mean) for the four most occurring classes of behavior (x-axis) for January (2010 + 2011) compared to July (2010). Solid bars with * represent significant differences (p < 0.001).

Figure 6.
The average percentage of occurrence for the four most occurring classes of behavior for each hour of observation (x-axis) during January (top graph) and July (bottom graph). The month of January included observations from 09:00–16:00 h, while the month of July included observations from 09:00–18:00 h, due to the extended facility hours.


Table 1.
Behaviors, classes of behavior, and definitions for each response in the ethogram.
| Behavioral Class and Behaviors (Abbreviations) | Definition |
|---|---|
| Active | |
| Standing (St) | Standing with no movement, 3 or 4 paws on the ground. |
| Rearing (Re) | Standing up on back legs with stomach exposed. |
| Locomotion (Lo) | Directed non-repetitive movement. |
| Manipulating object (Ma) | Contact with a non-edible object, with any part of the body manipulating its position. |
| Forage | |
| Eating (Ea) | Mouth contact with anything edible, including water. |
| Enriched Feeding (EF) | Manipulating an enrichment device with food in it. |
| Social | |
| Interacting w/another bear (IOB) | Any gesture to another bear without vocalization. |
| Vocalization (Vo) | Vocalization; must occur while oriented to another bear. |
| Groom | |
| Licking body/Paws (LB) | Tongue contact with any part of the body, including paws. |
| Scratching Body (SB) | Using paws, mouth or non-mobile object to rub/scratch. |
| Inactive | |
| Sitting (Si) | Posterior and back legs on the ground in an upright position. |
| Lying down (LD) | Most of the bear on the ground. |
| Stereotypy | |
| Pacing (Pa) | Moving in a repetitive pattern, with completion from point A to B and back to point A, (must include at least one full A-B-A movement) or circling. |
| Rocking (Ro) | Moving back and forth without locomotion. Must include at least one full back-and-forth motion. |
| Other | |
| Urinating or Defecating (UD) | Urination or defecation. |
| Out of sight (OS) | Not visible to the observer. |
| Other (Ot) | Engaged in a behavior not listed above. |
© 2020 by the authors. Licensee MDPI, Basel, Switzerland. This article is an open access article distributed under the terms and conditions of the Creative Commons Attribution (CC BY) license (http://creativecommons.org/licenses/by/4.0/).
Share and Cite
MDPI and ACS Style
Fernandez, E.J.; Yoakum, E.; Andrews, N. Seasonal and Daily Activity of Two Zoo-Housed Grizzly Bears (Ursus arctos horribilis). J. Zool. Bot. Gard. 2020, 1, 1-12. https://0-doi-org.brum.beds.ac.uk/10.3390/jzbg1010001
AMA Style
Fernandez EJ, Yoakum E, Andrews N. Seasonal and Daily Activity of Two Zoo-Housed Grizzly Bears (Ursus arctos horribilis). Journal of Zoological and Botanical Gardens. 2020; 1(1):1-12. https://0-doi-org.brum.beds.ac.uk/10.3390/jzbg1010001
Chicago/Turabian StyleFernandez, Eduardo J., Ellen Yoakum, and Nathan Andrews. 2020. "Seasonal and Daily Activity of Two Zoo-Housed Grizzly Bears (Ursus arctos horribilis)" Journal of Zoological and Botanical Gardens 1, no. 1: 1-12. https://0-doi-org.brum.beds.ac.uk/10.3390/jzbg1010001