Article

Gaps in Live Inter-Observer Reliability Testing of Animal Behavior: A Retrospective Analysis and Path Forward

Animal Welfare Science Program, Lincoln Park Zoo, Chicago, IL 60614, USA
*
Author to whom correspondence should be addressed.
J. Zool. Bot. Gard. 2021, 2(2), 207-221; https://0-doi-org.brum.beds.ac.uk/10.3390/jzbg2020014
Submission received: 24 February 2021 / Accepted: 7 April 2021 / Published: 15 April 2021
(This article belongs to the Special Issue Recent Advances in the Science of Zoo and Aquarium Animal Welfare)

Abstract

:
Observational behavior research is an important activity for zoos and aquariums, often being conducted to provide insights into welfare and guide management decisions. This research relies on standardized protocols to ensure consistent data collection. Inter-observer reliability, where untrained observers are tested against the behavior identifications of an expert observer, represent a critical internal validation process. Recent software advances have made reliability testing easier and more accessible, but there is limited guidance on what constitutes a strong reliability test. In this study, we reviewed historic reliability test data from Lincoln Park Zoo’s on-going behavior monitoring program. Six representative species were chosen that included 645 live pairwise reliability tests conducted across 163 total project observers. We identified that observers were being tested on only approximately 25% of the behaviors listed and defined in the species ethograms. Observers did encounter a greater percent of the ethogram with successive reliability tests, but this gap remained large. While inactive behaviors were well-represented during reliability tests, social and other non-maintenance solitary behaviors (e.g., exploratory, scent marking, play, etc.) did not frequently occur during tests. While the ultimate implications of these gaps in testing are unclear, these results highlight the risks of live reliability testing as an inherently non-standardized process. We suggest several approaches to help address these limitations, including refining ethograms, reconsidering criteria, and supplementing live training with video. We hope this self-critique encourages others to critically examine their methods, enhance the quality of their behavioral data, and ultimately, strengthen conclusions drawn about animal behavior and welfare.

1. Introduction

Zoos have a long history of relying on animal behavior research to inform the management of the animals they care for [1]. With roots in ethology, behavior research in zoos has relied heavily on low-cost, non-invasive observation behavior sampling [1,2,3]. Although behavior research in zoos has traditionally focused on hypothesis-driven questions, more recently there has been interest in developing behavioral monitoring programs—institution-wide initiatives to evaluate a broad range of species, often through short, frequent observations by multiple observers [4]. Recent advances in digital behavior data collection tools like the ZooMonitor app have made behavior monitoring, as well as traditional hypothesis-driven research, more accessible to zoos and aquariums [5,6]. Since the release of ZooMonitor in 2016, over 200 zoos and aquariums around the world are using the app, and the app has been utilized in a number of published studies [7,8,9,10,11,12,13,14,15,16,17].
The emphasis on behavior research by zoos is largely related to its connection as a potential indicator of welfare [18]. The importance of behavior for evaluating welfare is well established [19,20]. Indeed, a recent review of zoo and aquarium welfare research identified behavior as the most common indicator of welfare [21]. The focus on animal welfare in zoos and aquariums has grown in recent years, particularly with the introduction of new accreditation standards. In the Association of Zoos and Aquariums (AZA), member organizations are now required to assess the welfare of all individual animals in their care [22]. Similar standards have also been enacted by other accreditation groups and organizations around the world [21,23,24,25]. Although considering animal welfare is not a new activity for zoos and aquariums, these standards broaden the scope of the challenge and highlight the importance of assessing measures that directly reflect the animal’s experience (i.e., animal-based or output measures), such as behavior, alongside more traditional evaluations of the environment (i.e., resource-based or input measures) [26]. Unfortunately, observational behavior studies do not come without methodological challenges. Given the use of behavior data in welfare assessments throughout zoos and aquariums, a closer examination of potential pitfalls and our quality controls is warranted.
One of the most widespread concerns in observational research is the potential for observer bias—scoring behaviors that conform to the observer’s expectations [27,28]. This is most obviously a concern in hypothesis-driven research, where there have been calls for researchers to blind themselves to prevent unconsciously skewing their results [28,29,30,31]. Although this risk may be viewed as minimal in behavioral monitoring programs as compared to hypothesis-driven behavior research, the personal views of the observer toward the animal (e.g., “that animal is happy”, “those animals like each other”) may still color objective behavior judgments and are a potential source of concern. Other potential sources of error exist as well [32]. Munch et al. [33] examined a framework from human psychology proposed by Funder [34] that organized potential disagreements into four categories. In their view, disagreements may arise from variation in the: (1) judge (i.e., observers); (2) target (i.e., subject animal); (3) trait (i.e., behavior); and (4) information (i.e., behavior definitions). To minimize these risks, behavior researchers have long relied on formalized reliability testing procedures [32,35].
Several excellent discussions of the reliability testing process are available [32,35]. As our focus is on behavior research that often employ multiple observers, such as those in zoos and aquariums, we concentrate our study to inter-observer reliability testing (hereafter, “reliability testing”). Briefly, reliability testing typically involves checking the consistency of behavior identifications between an expert, “gold” standard observer with observers-in-training. Reliability scores are then computed for each test session and compared against the researcher’s criterion for “passing” to determine if the observer-in-training is prepared to conduct unsupervised behavior observations. Digital tools like the ZooMonitor app [5] and Observer platform [36] provide built-in options for calculating these metrics.
However, these digital tools or foundational behavior methods texts, e.g., [32,35], do not provide a clear guidance for practitioners on what qualifies as a “good” reliability test. This is concerning as we place a heavy emphasis on their value, being the gatekeepers for data that can be used and data that must be discarded. An implicit assumption in an observer “passing” reliability tests is that they are prepared to reliably identify any behaviors within the relevant ethogram (list of species-specific behaviors with definitions). For zoos with behavior monitoring programs that seek to provide a holistic profile of an animal’s behavior, this typically involves a “full” ethogram that includes any behavior the animal may perform. Unfortunately, as reliability tests in zoos are often performed live, the underlying tests being performed are inherently non-standardized and based solely on the behaviors that happen to occur during the test session. This raises several concerns, including an inconsistency in testing across observers and incomplete testing of the ethogram. The goal of the present study was to identify whether these concerns were apparent in our behavioral monitoring program, a program that was designed following best practices [4] and has served as a model for other zoos and aquariums.
In this study, we conducted a retrospective analysis of reliability tests performed in Lincoln Park Zoo’s behavior monitoring program. This program relies on trained volunteer observers to systematically conduct on-going observations on multiple species around the zoo to provide animal management with insights that can inform data-driven decision making. We evaluated a subset of species under monitoring to provide taxonomic and behavioral variety. We asked four questions to clarify if and how reliability testing may be falling short: (1) what percent of the species’ ethograms were being considered during reliability tests; (2) whether greater proportions of ethograms were captured as the number of reliability tests increased; (3) what behavioral categories were typically not considered during reliability tests; and (4) were disagreements on behavior identifications related to how frequently the behavior occurred? We hope this self-critique encourages others to critically examine their methods and enhance the quality of their data.

2. Materials and Methods

2.1. Animal Subjects

Reliability test data from six species housed at Lincoln Park Zoo (Chicago, IL, USA) were assessed: African penguin (Spheniscus demersus, n = 15); klipspringer (Oreotragus oreotragus, n = 4); pygmy hippopotamus (Choeropsis liberiensis, n = 2); red river hog (Potamochoerus porcus, n = 3); Sichuan takin (Budorcas taxicolor tibetana, n = 6); and snow leopard (Panthera uncia, n = 1). These species included those housed in indoor habitats (klipspringer, pygmy hippo) and outdoor habitats (African penguin, red river hog, Sichuan takin, snow leopard). Most species were housed in a single habitat, with the exception of the Sichuan takin, which were housed in two adjacent habitats. Minor changes in group composition occurred during the study as a result of social and housing changes. All species studied included at least one adult male and female, with the exception of the snow leopard project that included only one adult male.

2.2. Data Collection

Observers included animal behavior monitoring volunteers at Lincoln Park Zoo between the years 2016 and 2019. This specialized volunteer role was open to the general public and did not require previous experience in behavior research. Observers received training in data collection as described in Section 2.4. Detailed demographic information on the volunteers is not available but primarily included retired individuals and college students. All observers that passed reliability testing procedures for the study species (see below) were included in this study.
Behavioral data were recorded using the ZooMonitor app [5]. Behaviors were sampled at 1-min intervals during 10-min focal observations [35]. The number of focal subjects of each species recorded at one time during reliability tests varied based on social and housing changes during the study: African penguin = 1; klipspringer = 1–2; pygmy hippo = 1–2; red river hog = 1–2; Sichuan takin = 1–3; snow leopard = 1.
Behaviors recorded for each species were chosen from a standardized master ethogram in use at Lincoln Park Zoo. Behaviors on the master ethogram were organized into eight behavior categories: inactive, feeding/foraging/drinking, locomotion, undesirable, other solitary, social, other, and not visible. This master ethogram was developed to aid in consistent terminology across projects for both observers and animal managers. Species’ ethograms were created to represent the full repertoire of each species and included all behavior categories of the master ethogram (for detailed species’ ethograms, see Supplementary Materials, Table S1). Each species’ ethogram had a comparable level of complexity, with the number of behaviors per ethogram ranging from 24 (snow leopard) to 31 (red river hog). In addition to the primary behavior, additional behavior modifiers were recorded for select behaviors on some species’ ethograms (e.g., sitting/lying—alert vs. sitting/lying—rest). Minor changes were made to the name of some synonymous behaviors to aid presentation (Supplementary Materials, Table S1). In addition to these behaviors, additional data were recorded during each interval for projects but not considered in this study (e.g., height, substrate, and/or space use). Similarly, all occurrences of select behaviors were recorded for projects but not considered in this study.

2.3. Training and Reliability Testing Protocols

All new observers to the behavior monitoring program were first trained in general behavior sampling methods and then trained in data collection using the ZooMonitor app. After this general training, observers were presented text definitions of behaviors for each species (i.e., project ethograms). In some cases, videos were used to illustrate specific behaviors although this was rare given the limited video exemplars of behavior. Before reliability tests, observers conducted at least one practice session with the trained staff member during which they were encouraged to discuss any questions or disagreements.
Inter-observer reliability tests were conducted by a limited number of trained staff (n = 5) or interns (n = 3) (hereafter, “trainers”). Most reliability tests (91%) were conducted by one of three staff members that consecutively oversaw training for the behavior monitoring program. Reliability test sessions typically involved one to two observers-in-training with a max of five observers per session to minimize errors arising from different vantage points (i.e., “errors of apprehending”) [32]. An average session score of 85% agreement or greater between the trainer and observer across at least 3 sessions conducted over multiple days was required to “pass” reliability testing. This criterion was established to maximize the chance of observing diverse behaviors and ensure observers could reliably identify individuals across days. As the Sichuan takin were housed in two separate habitats, this criterion was modified slightly to include at least 2 sessions from each habitat. If an observer did not pass this criterion during their first 3 reliability test sessions, additional reliability test sessions were conducted until the observer passed or was deemed unreliable.

2.4. Reliability Analysis Using the ZooMonitor App

ZooMonitor data were analyzed using the built-in Reliability Analysis module [5]. Although not all data available through the module were used in this study, we share a brief overview of the capabilities of this module to aid the reader in their research. In the Reliability Analysis module, users can conduct both inter-observer and intra-observer reliability tests. Interval behavior data can be compared between two sessions using two common reliability metrics: percent agreement [37] and Cohen’s kappa [38]. In addition, differences between space use locations of the trainer and observer can also be compared with user-configured distance thresholds (using coordinate locations recorded on the habitat map images). Data from this module can be exported as summary metrics that include session scores or as a detailed dataset indicating agreements and disagreements on a per interval’s basis.

2.5. Data Analysis

To determine the percent of ethograms encountered during reliability tests (questions 1 and 2), the number of unique behaviors each observer encountered (based on data recorded by the trainer) was first calculated. This number was then divided by the number of behaviors on the species’ ethogram being considered and multiplied by 100. An overall percent of ethograms evaluated was calculated and included all reliability test sessions for an observer. In addition, the percent of ethograms evaluated was calculated on a per session basis for each observer (e.g., session 1, session 2, etc.). As exploratory analysis indicated that the percent of ethograms evaluated was non-normal, the median, min, max, and median absolute deviation (MAD) statistics are presented.
To identify the behaviors that were not captured during reliability tests (question 3), the total number of occurrences of each behavior across all reliability tests was determined. The percent of occurrences of each behavior was then calculated by dividing by the total number of intervals scored across all reliability tests. Given the large number of behaviors across the six species’ ethograms, we also present the percent of occurrences per behavior category for visual simplicity.
Lastly, to examine if the frequency of a behavior may impact its likelihood to be scored incorrectly (question 4), we calculated the percent of disagreements for each behavior. Disagreements were output from the ZooMonitor Reliability Analysis module and determined for each interval based on matching between the behavior identifications of the trainer and observers. For the select behaviors that included behavior modifiers, matching was determined to the level of the modifiers. The percent of total disagreements were calculated for each behavior on a species’ ethogram by dividing the number of disagreements per behavior by the total number of disagreements across all behaviors. As the percent of total disagreements would be proportionally lower for rare behaviors, the percent of disagreements was also calculated on a per behavior basis by dividing the number of disagreements for each behavior by the total number of occurrences of that behavior. The relationship between both the percent of total disagreements and percent of disagreements with the percent of occurrences was determined using a Spearman’s rank correlation. A Spearman’s rank correlation was chosen to minimize the potential bias that few, frequent behaviors could have on results. This analysis was intended to determine how likely disagreements were to occur based on chance (percent of total disagreements) and if disagreements were proportionally more likely for rare behaviors, once standardized for their lower frequency (percent of standardized disagreements per behavior).
Data were analyzed using Microsoft Excel and the R statistical software (version 4.0.3) [39]. Data visualizations were created using the ggplot2 package of R [40].

2.6. Ethical Statement

All methods were reviewed by the Lincoln Park Zoo Institutional Review Board and determined to be exempt from the requirements of human subjects research (IRB-21-001-E).

3. Results

A total of 645 pairwise reliability tests were conducted for the study species over a period of 3.8 years (Table 1). This included reliability tests for 79 volunteers that represented 163 project observers (one volunteer could be trained for multiple projects). As multiple individual animals were observed during reliability tests for some species, the 645 pairwise reliability tests represented 860 focal animal observations that were performed across species.

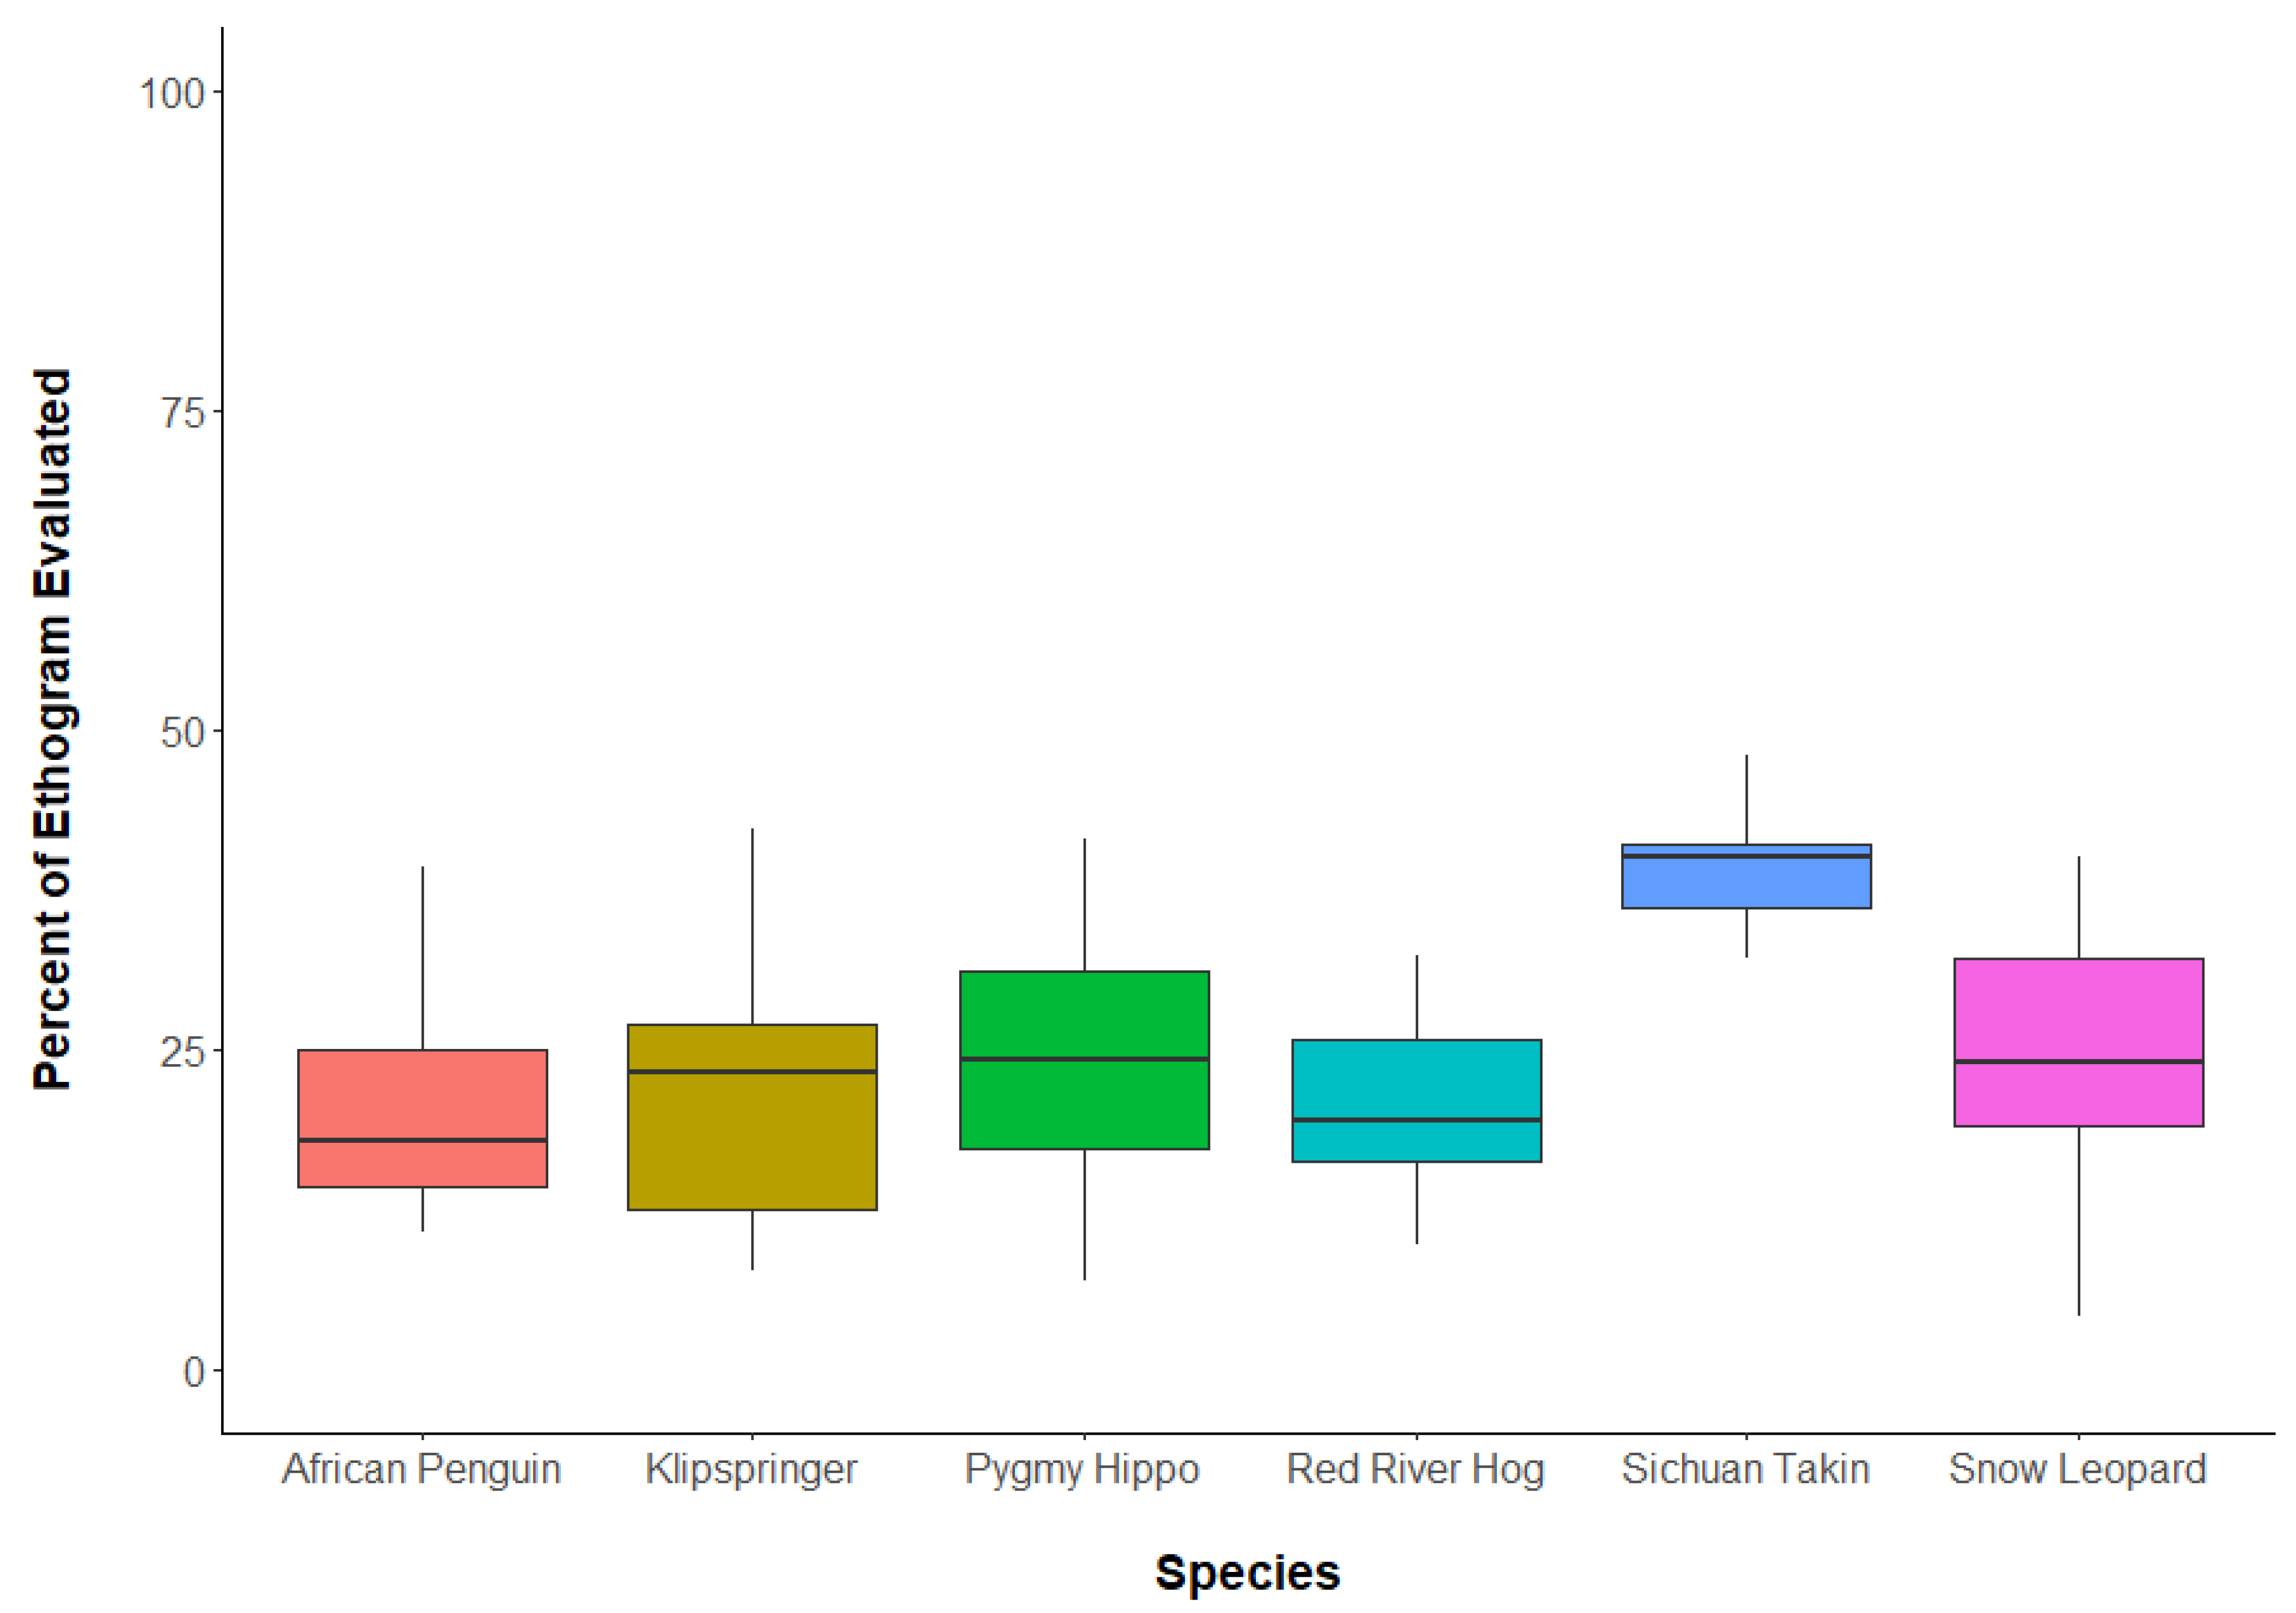
3.1. Question 1: What Percent of Ethograms Occurred during Reliability Tests?

Observers encountered a median of 23.1% of species’ ethograms during reliability tests (max: 48%; min: 4.2%; MAD: 10.3). The median percent of the ethogram evaluated ranged from 40% for Sichuan takin to 17.9% for African penguin (Figure 1).

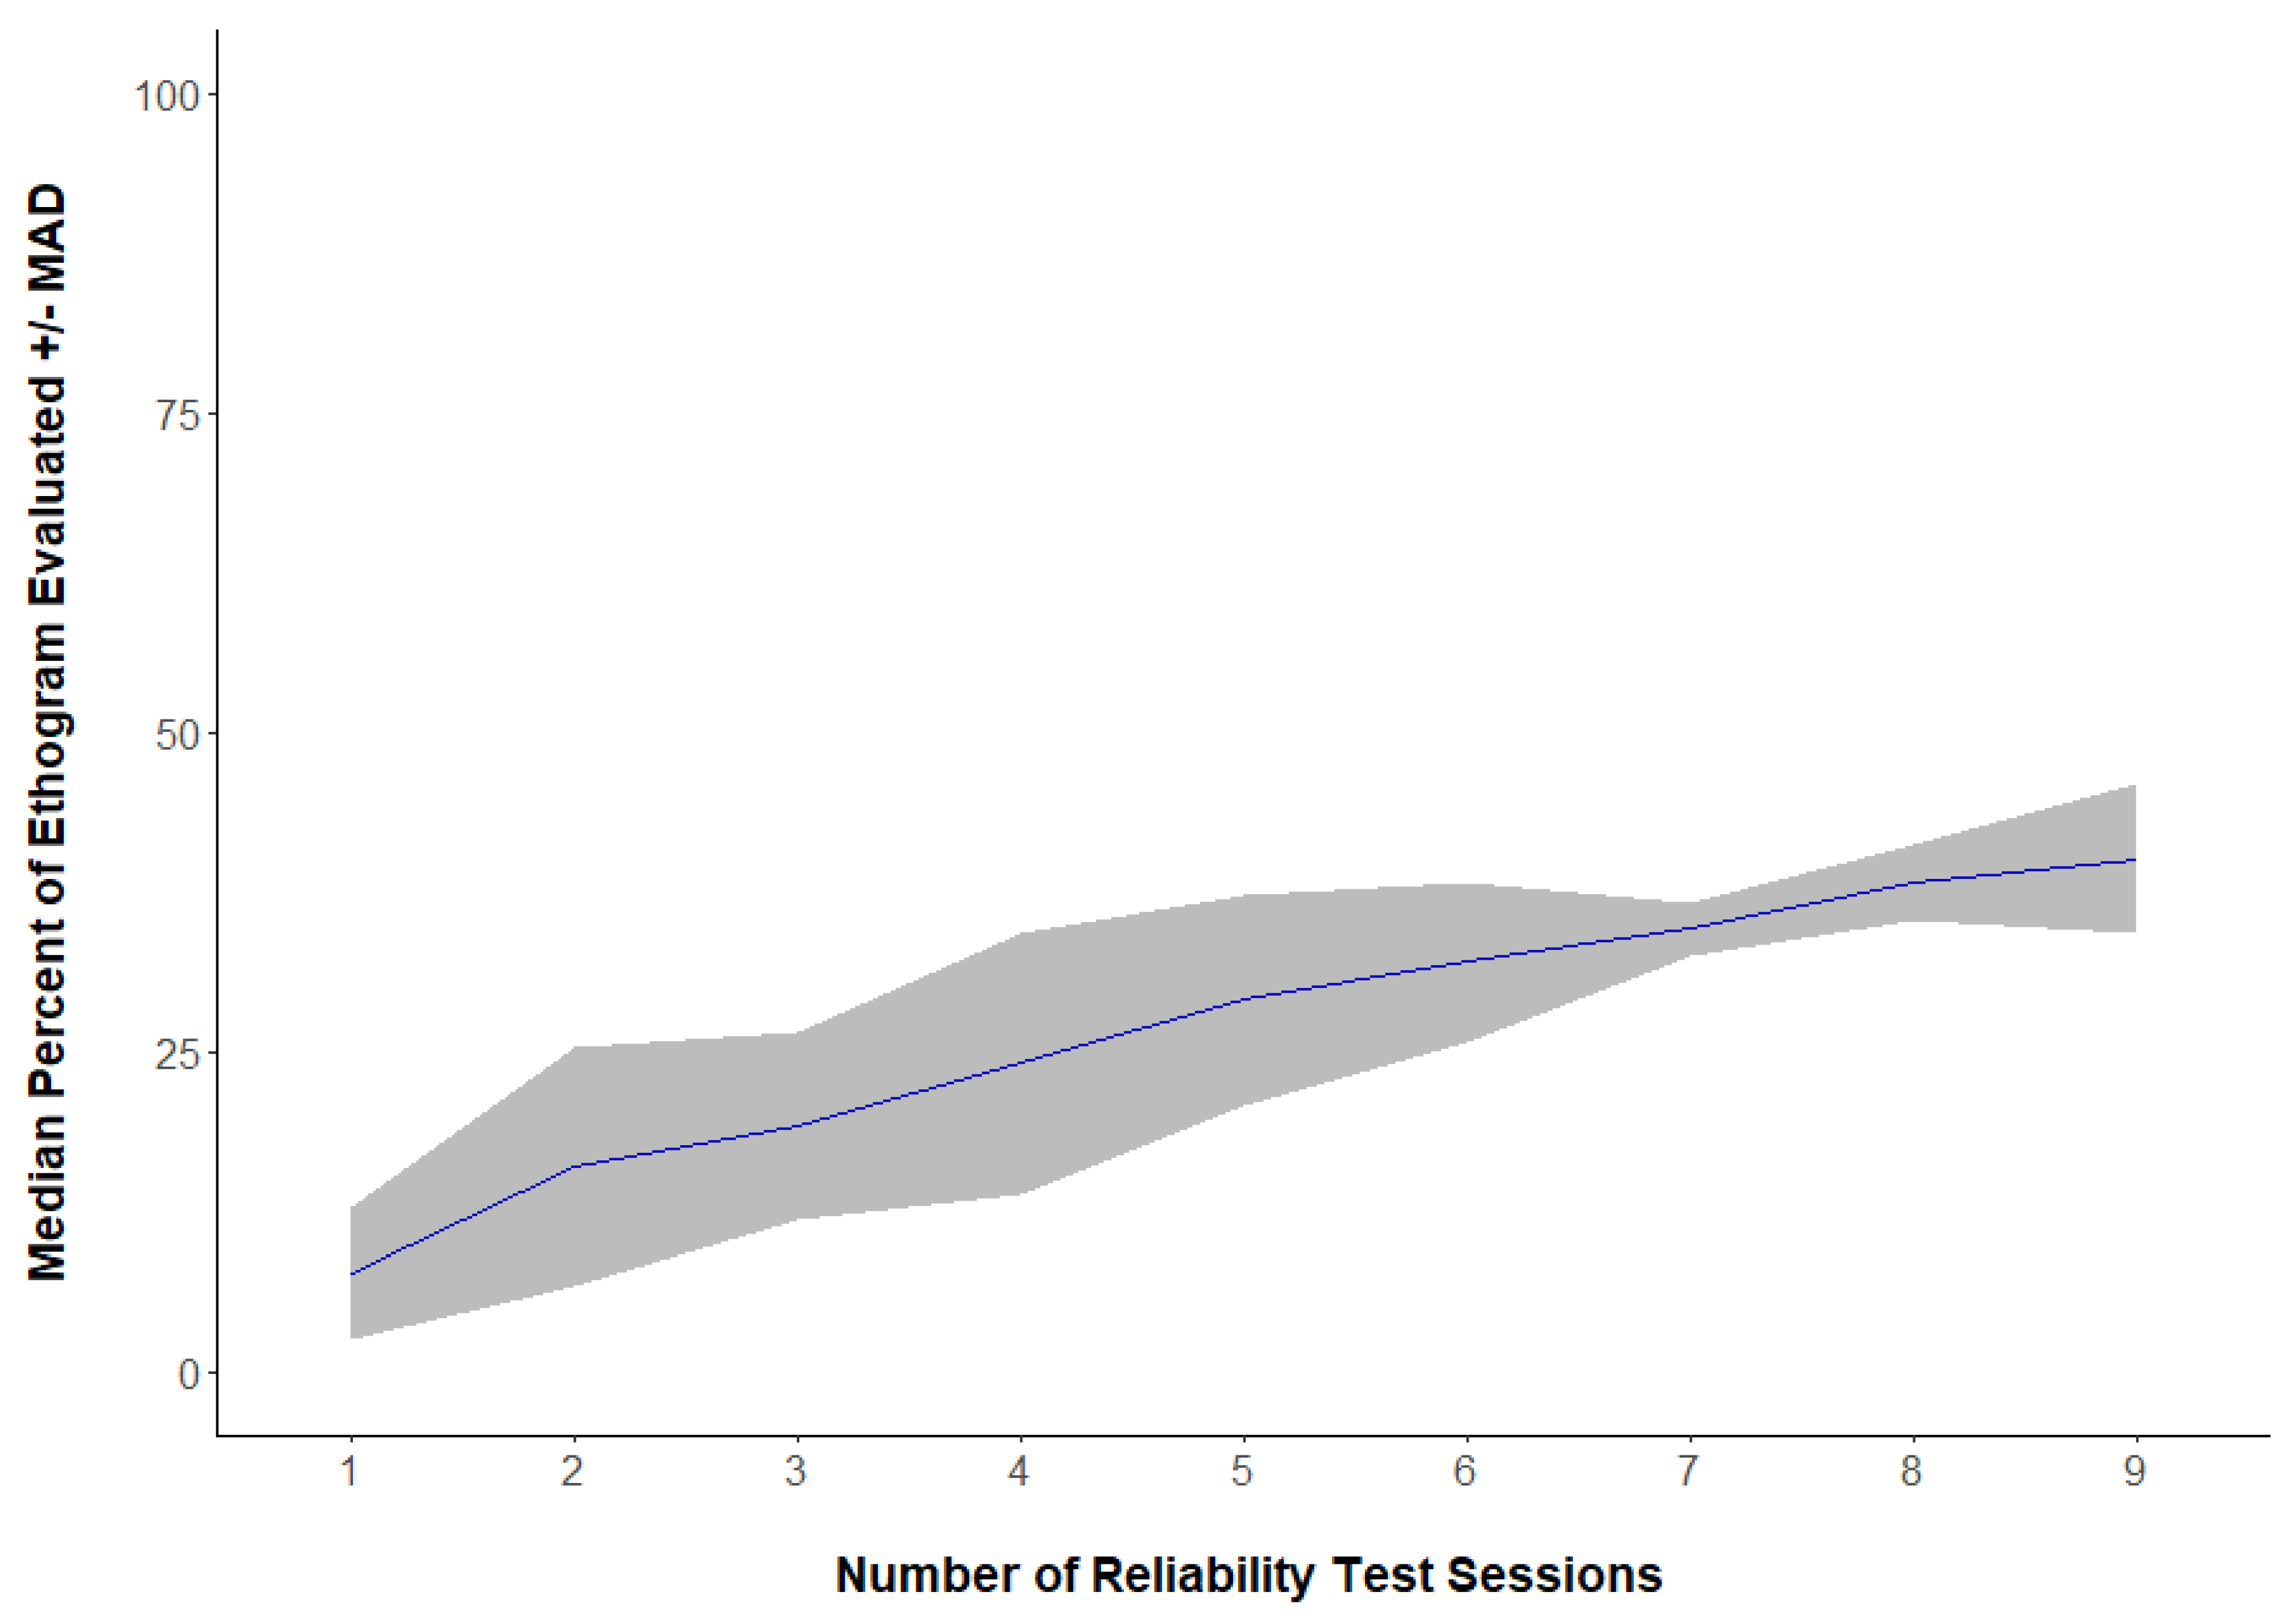
3.2. Question 2: Were a Greater Portion of Ethograms Captured with More Reliability Tests?

The percent of each species’ ethograms evaluated by observers did increase with more reliability tests they conducted (Figure 2). After an observer’s first reliability test session, a median of 7.7% of the species’ ethograms were encountered (max: 28%, min: 3.2%, MAD: 5.2). By the third reliability test, the median percent of ethograms evaluated increased to 19.2% (max: 41.7%; min: 4.2%, MAD: 7.3). After six reliability test sessions, 90.2% of observers had completed reliability test sessions but had only encountered a median of 32% of the species’ ethograms (max: 44%; min: 4.2%; MAD: 6.2%) (Figure 3). The median number of sessions required for observers to pass reliability testing was 4.0 (max: 11; min: 3; Table 2).

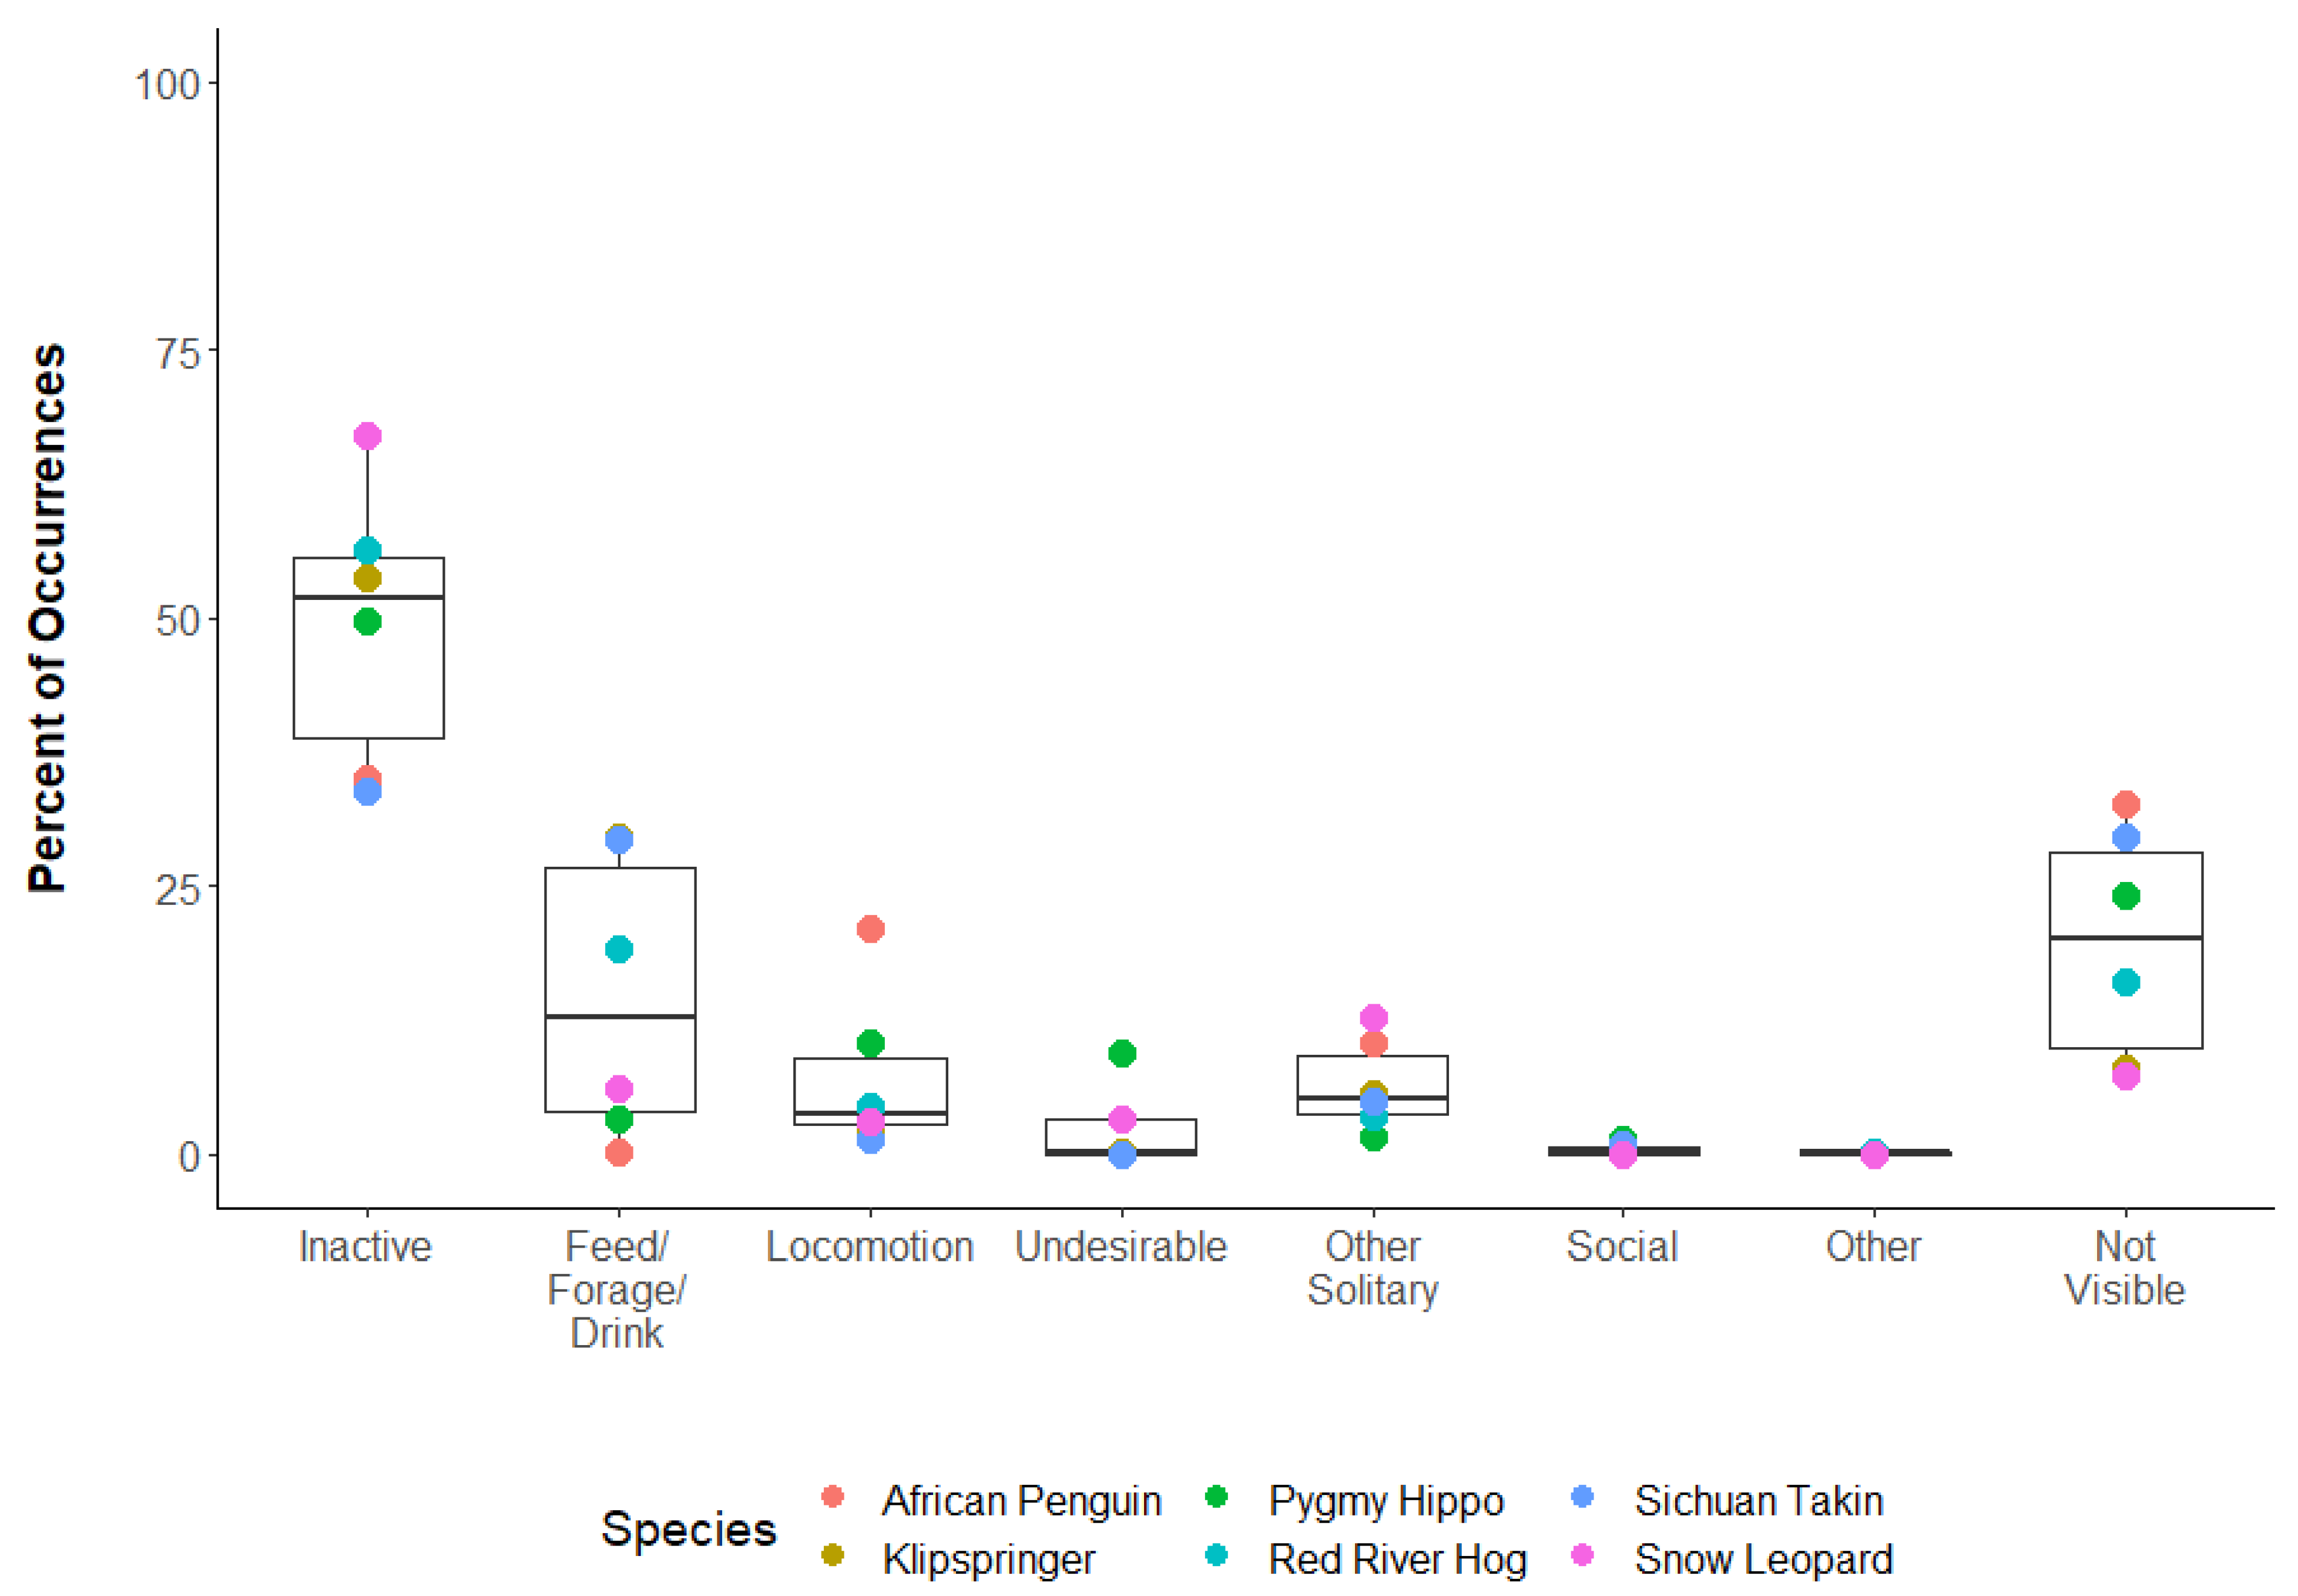
3.3. Question 3: What Behavioral Categories Typically Occurred during Reliability Tests?

The most common behavior category that occurred during reliability tests across all species was Inactive with a median of 52% (max: 67.1%; min: 33.9%; MAD: 14.7; Figure 4). This was followed by Not Visible (median: 20.1%; max: 32.6%; min: 7.3%; MAD: 16.0), Feed/Forage/Drink (median: 12.8; max: 29.7%; min: 0.3%; MAD: 16.3), Other Solitary (median: 5.3%; max: 12.9%; min: 1.6%; MAD: 4.1%), Locomotion (median: 3.8%, max: 21.0%; min: 1.3%; MAD: 2.7); Undesirable (median: 0.2%; max: 9.4%; min: 0%; MAD: 0.3), Social (median: 0.1%; max: 1.3%; min: 0%; MAD: 0.2), and Other (median: 0.1%; max: 0.2%; min: 0%; MAD: 0.1) behavior categories. The percent occurrences of behavior categories for each species are shown in Table 3. For a detailed list of the percent occurrences for each behavior recorded on each species’ ethogram, see Supplementary Table S2.

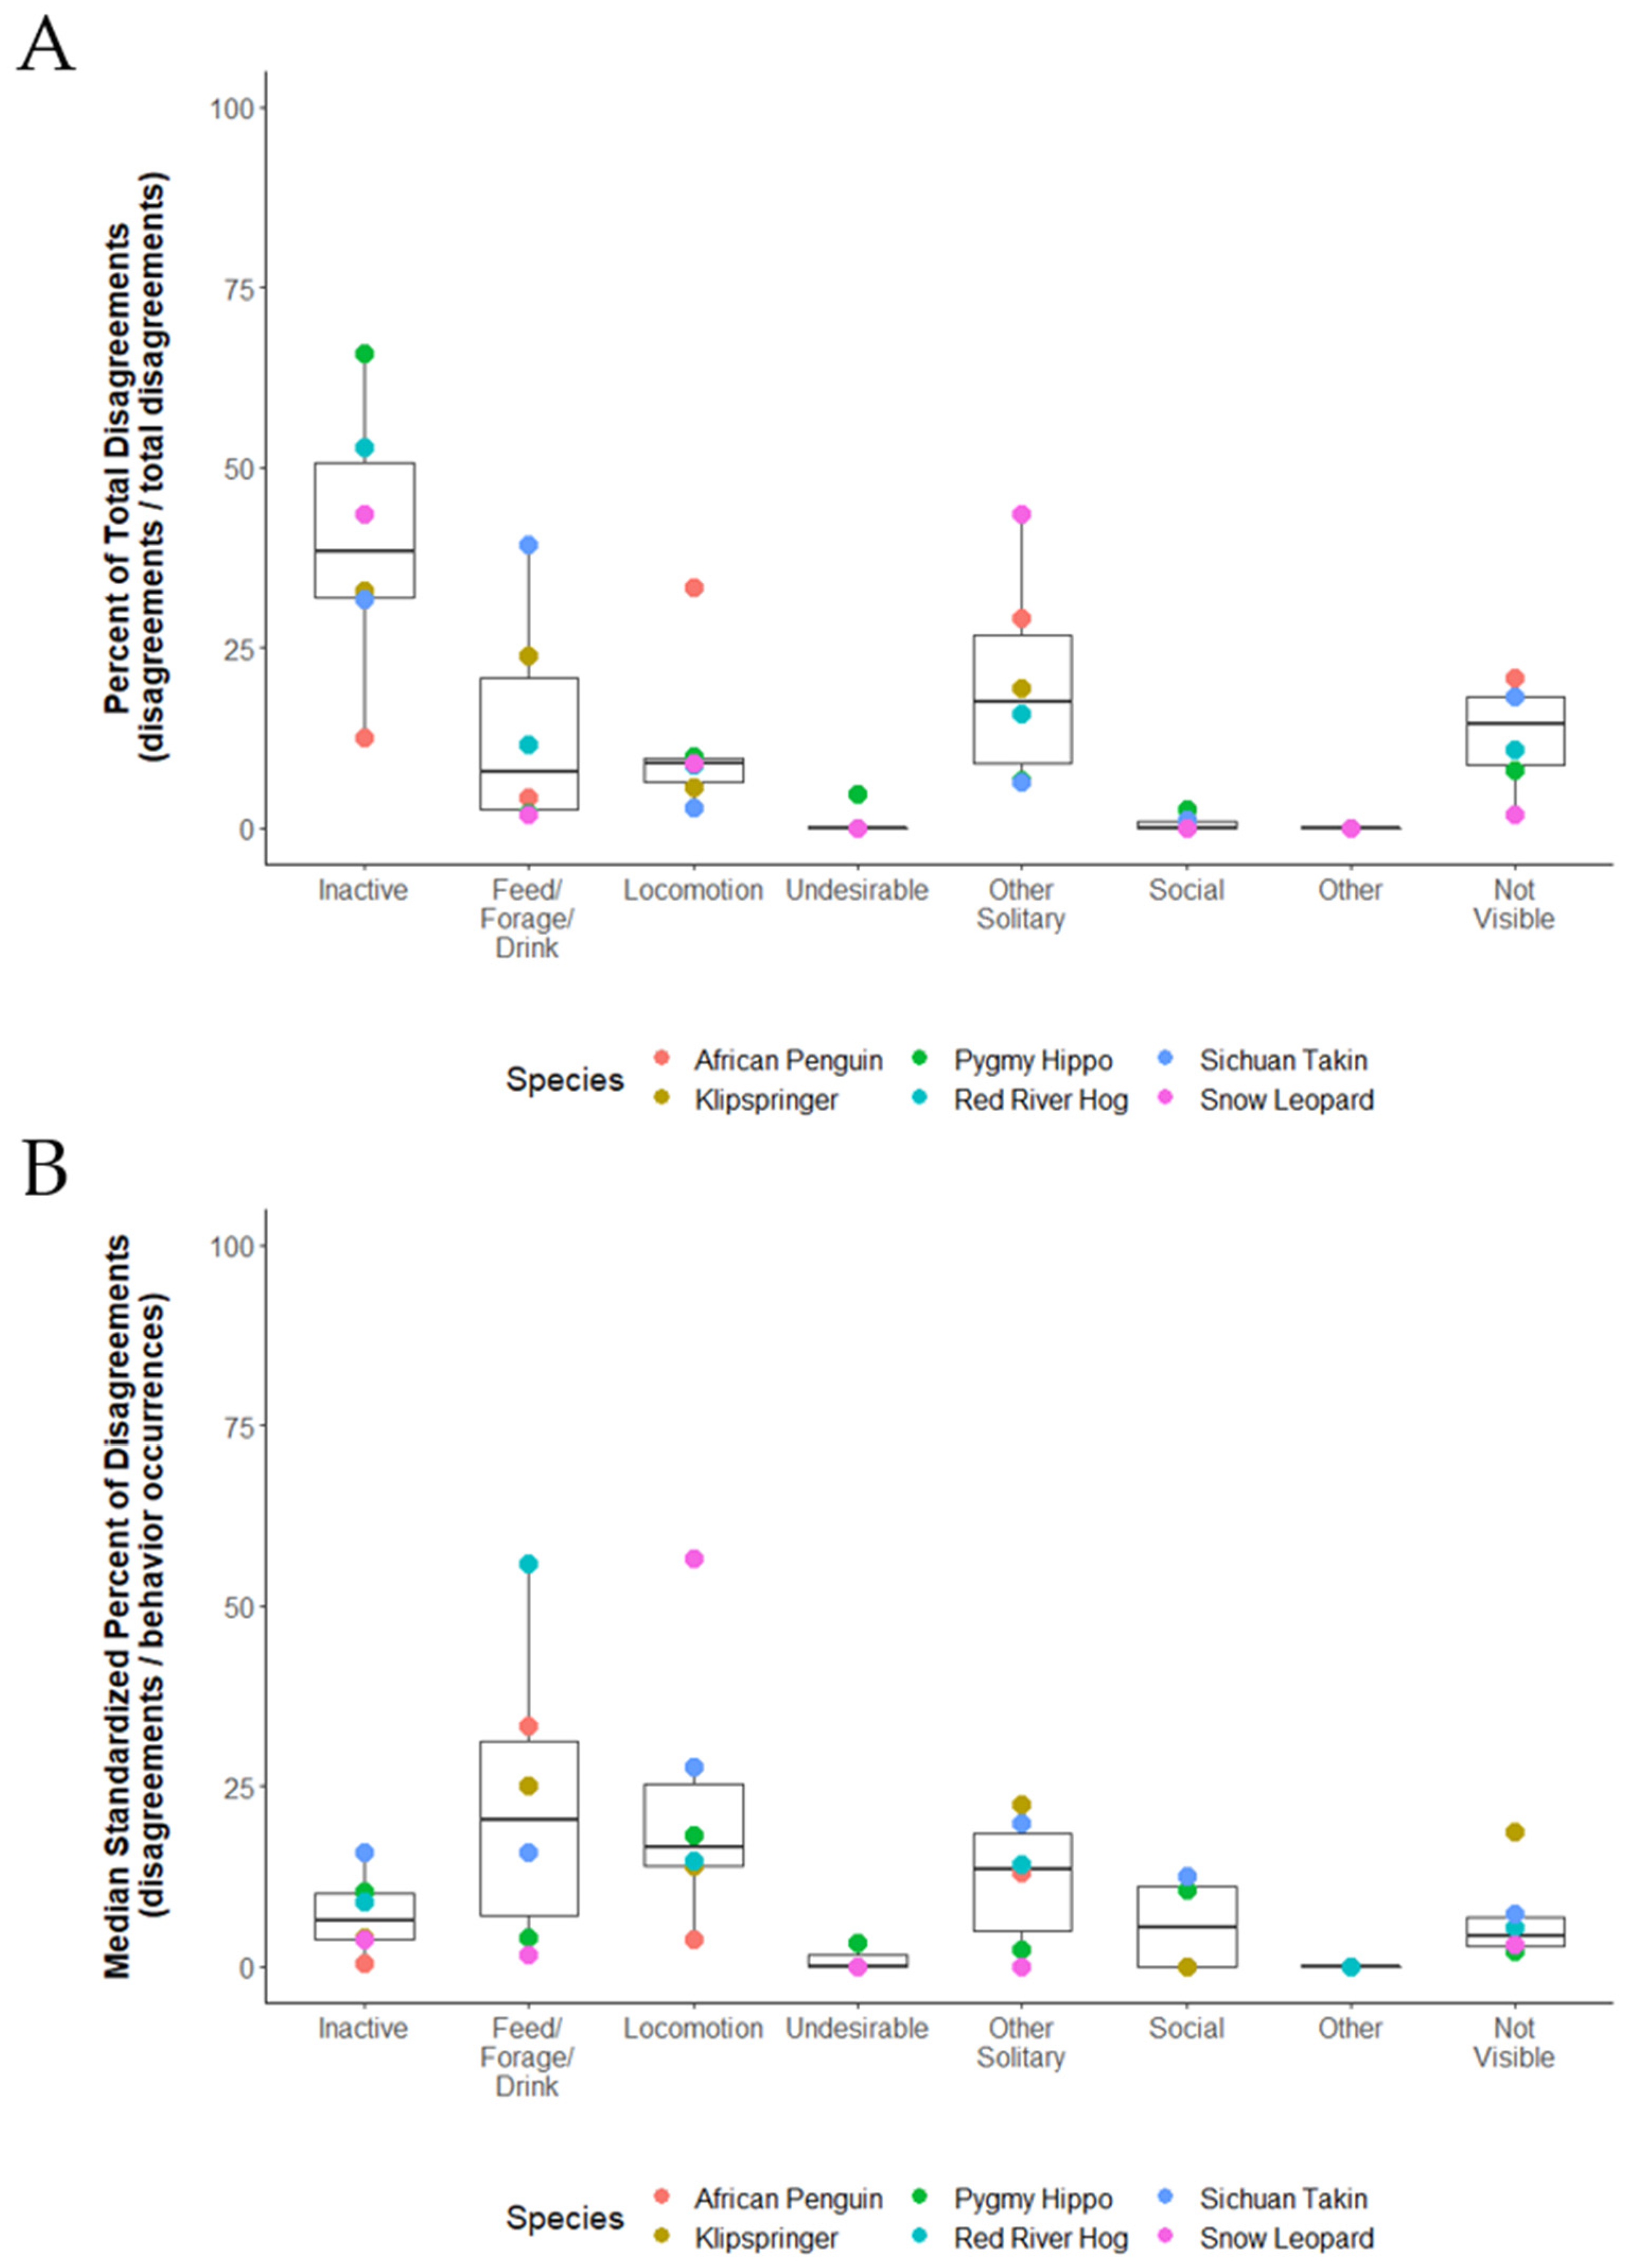
3.4. Question 4: Were Behavior Disagreements Related to How Frequenly Behaviors Occurred?

A positive relationship between the percent of total disagreements on behavior identifications and the percent of occurrences of behaviors was evident for all species (African penguin, rs = 0.72, p = 0.0027; klipspringer, rs = 0.85, p < 0.001; pygmy hippo, rs = 0.82, p < 0.001; red river hog, rs = 0.76, p < 0.001; Sichuan takin, rs = 0.87, p < 0.001; snow leopard, rs = 0.55, p = 0.021). Thus, most disagreements typically occurred for the most common behaviors (Figure 5A). No significant relationship (p > 0.05) was found between the standardized percent of disagreements and percent of occurrences (i.e., when controlling for how frequently behaviors occurred, disagreements occurred at chance levels across behaviors for each species; Figure 5B).

4. Discussion

We sought to identify potential pitfalls in inter-observer reliability testing processes as they are commonly carried out in zoos and aquariums. Specifically, we examine whether observer being certified through tests were being tested on all behaviors of the ethogram, an underlying assumption in the use of these tests. Through a review of six monitoring projects from our on-going, zoo-wide behavior monitoring program, we found the majority of behaviors on species’ ethograms were not evaluated during reliability tests. Approximately 25% of the species’ ethograms were considered during tests, which primarily included inactive and other common maintenance behaviors. Rare behaviors, such as social and other non-maintenance solitary behaviors (e.g., exploratory, scent marking, play, etc.), were less likely to occur during tests, highlighting a gap in our current testing process. Although successive reliability tests did help expose observers to a greater proportion of the species’ ethograms, this approach still fell short of closing the gap in reliability testing.
Species in the current study were chosen to provide representative taxa and methods found in our behavior monitoring program. Although a direct comparison across species was not intended given the limited sample size, some differences were noted that may provide insight into these issues. Specifically, observers on the Sichuan takin project did appear to encounter relatively more behaviors than observers on other species. We believe this might reflect some methodological differences in the monitoring protocols. While other studies observed one or a pair of individuals, focal observations on the Sichuan takin alternated between a breeding group of one male and two females and an adjacent habitat housing one solitary male. This resulted in observers being exposed to more individuals over the course of reliability tests, compared to other species projects. The importance of considering individual differences is widely recognized for welfare assessments [20,41] and our study suggests an additional benefit for reliability testing—exposure to a greater portion of the ethogram. However, these benefits may not override the systemic challenges inherent in reliability tests as the gap for all species, including Sichuan takin, remained large.
The implications of not establishing reliability on large portions of an ethogram are concerning. Inter-observer reliability testing has been considered best practice in the field of animal behavior but the interpretations of these tests, namely that they indicate observers will identify behaviors consistent with that of an expert rater hinges on the assumption that observers are being tested on the full ethogram. The absence of some behaviors during these tests makes this impossible to establish and may undermine the internal validity of the study.
These concerns of reliability testing are not new. Caro et al. [42] highlighted the problem of rare behaviors, stating, “reliability on each measure must be reviewed within the context of all behaviours that will be scored later”. In some cases, the behaviors missed in reliability testing may be so rarely shown by the animals that the lack of reliability established on these behaviors has minimal effect on conclusions drawn in any subsequent behavior-based inquiry. Going further, Caro et al. [42] suggested, “reliability could be expected to decrease as the frequency becomes relatively rarer”. This retrospective analysis was not designed to measure how behaviors rarely encountered in reliability testing are represented in typical activity budgets, and we hope future work will explore this relationship more directly. We add that although the behaviors not encountered during reliability tests may be rare in the animals’ lives, it is important to consider that rare behaviors are sometimes the most interesting when addressing questions of animal behavior and welfare.
The implications of not certifying rare behaviors during reliability testing on the subsequent performance of the observer is unclear. In the worst case, identifications of these rare behaviors could be scored incorrectly, however this would be unlikely to impact broad patterns of behavior. Thus, some types of findings, such as activity budgets, may be more immune. However, this does raise an intrinsic challenge for reliability tests—do these procedures accurately predict future performance? While a detailed review of this topic is beyond the scope of this paper [27,43], potential pitfalls in the predictive value of reliability testing are evident.
Several potential limitations of the current study should be considered. First, this study presents a review of one zoo’s behavior monitoring program, which may not be representative of others. However, we find this unlikely to be an actual shortcoming for several reasons. Most directly, behavioral monitoring programs have a shared challenge—provide broad information on a wide range of species housed within an organization—that likely lead to convergence on similar methods. Watters et al. [4] highlighted the importance of short, frequent observations for behavior monitoring programs, similar to the methods used in the current study at Lincoln Park Zoo. Furthermore, as creators of the ZooMonitor app, we have had the opportunity to work with many colleagues across the world. Through this experience, we have found the challenges faced by our behavior monitoring program to be, unfortunately, not unique.
Second, it may be perceived that the predominantly inactive behavior profile of the animals in this study may not be representative of animals housed at other institutions or in different contexts. Behavior patterns we observed of the study species during reliability testing do appear broadly consistent with others [44,45,46,47,48]. Furthermore, housing and care practices at Lincoln Park Zoo conform to standards set forth by the Association of Zoos and Aquariums. Future tools being developed to advance the accessibility of multi-institutional studies should add additional clarity to this question [49]. Fundamentally, the reality that some behaviors will occur more commonly than others is non-controversial but may lead to the concerns highlighted in this study. Indeed, Caro et al.’s concerns raised above were developed from an example study on kittens, a creature not known for having an inactive behavior profile [42].
Where do we go from here? While our intent is not to “throw the baby out with the bath water” and we do feel that reliability tests play an integral role in behavior research, we urge caution in using these tests to determine trust in our data without careful examination of assumptions and potential pitfalls. We recommend three actions to help address the concerns raised in this study. First, a review and possible revision of sampling methods should be considered. Watters et al. [4] provides a detailed discussion of this for zoo and aquarium practitioners. At minimum, this should include refining the ethogram to include behaviors of interest to the specific question at hand and perhaps those found to be reliably identified. Lumping similar behaviors for analysis has also been suggested but requires that categories maintain ‘face validity’ [35] and relies on the assumption that errors occur between closely related behaviors, which should be evaluated.
Second, we encourage others to establish criterion for what constitutes a strong reliability test, both in terms of the expected agreement and in terms of the behaviors to which observers are exposed. Although setting criterion for passing tests are well recognized, additional measures to standardize the observers experience across reliability tests may be valuable. For example, one could require all reliability tests to include a minimum number of unique behaviors, especially those that are of interest to the questions in hand. This change will likely require shifting when reliability tests occur to coincide with active periods for the species. While we do not expect this will fully address gaps in reliability testing and will require further analysis, this could lead to a greater breadth of testing.
Third, we must accept that our expectations of live reliability tests to certify all behaviors on an ethogram is unrealistic for most studies. Additional approaches are needed to ensure rare behaviors are well understood and readily identifiable by observers. Video is particularly valuable for this, allowing a detailed review and discussion of standardized exemplars. Acquiring a library of videos of rare behaviors over time, or seeking them out from colleagues in preparation for a study, may be one way to ensure rare behaviors are included in some aspect of training and reliability testing. Video can present logistical and technical challenges that may limit some organizations from developing these materials and implementing into their protocols in a widespread fashion, but a targeted approach may be feasible. Online resources that support community-wide sharing of videos and other training materials are needed. Several excellent online resources are currently available for some species [50,51].

5. Conclusions

Reliability testing holds a special place in behavior research, being the gatekeeper between data that can be used and data that must be excluded. Completing this rite of passage gives the observer carte blanche freedom to record any behavior included on the ethogram under study. Ideally, this certification would require multiple observations of each behavior. Ultimately, live reliability tests are inherently non-standardized—each observer experiences a different version of the test. This raises the concern of what behaviors are actually tested and what might be missed. As identified through a review of six representative projects from our behavioral monitoring program, these concerns of a gap in the reliability testing process are real. We suggest three approaches to address this challenge: (1) review the appropriateness of the sampling methodology; (2) incorporate additional criteria for ethogram coverage during reliability tests; and (3) supplement training and testing process with video to ensure greater standardization across observers. We hope this self-critique motivates others to examine their methods and strengthen their protocols to ensure high-quality data.

Supplementary Materials

The following are available online at https://0-www-mdpi-com.brum.beds.ac.uk/article/10.3390/jzbg2020014/s1, Table S1: The ethogram behaviors for six study species monitored as part of a zoo-wide behavior monitoring program, Table S2: The percent occurrences for all behaviors included on the ethogram of six study species monitored as part of a zoo-wide behavior monitoring program.

Author Contributions

Conceptualization, J.D.W., N.K.W. and K.A.C.; methodology, J.D.W.; formal analysis, J.D.W.; data curation, N.K.W. and J.D.W.; writing—original draft preparation, J.D.W.; writing—review and editing, J.D.W., K.A.C. and N.K.W.; visualization, J.D.W.; supervision, K.A.C. All authors have read and agreed to the published version of the manuscript.

Funding

This research received no external funding.

Institutional Review Board Statement

Ethical review and approval were waived for this study aas disclosure of the human subjects’ responses outside the research would not reasonably place the subjects at risk of criminal or civil liability or be damaging to the subjects’ financial standing, employability, educational advancement, or reputation.

Informed Consent Statement

Not applicable.

Data Availability Statement

Data is contained within the article.

Acknowledgments

We first thank many of the Lincoln Park Zoo animal behavior monitoring volunteers for their generous support that made this research, and our behavior monitoring program, possible. We would like to thank Clara Stahlmann Roeder, Marisa Shender, Jeremy Gill, Sean Linehan, Kelsey O’Neill, and Michael Wade for their assistance in conducting reliability tests. In addition, we thank Betsy Maher, Jeremy Gill, and the Lincoln Park Zoo volunteer services team for their support in managing the volunteer program. We are grateful to Megan Ross for her role in initiating and supporting the ZooMonitor software. Finally, thanks to Maureen Leahy, Dave Bernier, and the animal care management team for their ongoing support of our behavior monitoring program.

Conflicts of Interest

The authors declare no conflict of interest.

References

  1. Kleiman, D.G. Behavior research in zoos: Past, present, and future. Zoo Biol. 1992, 11, 301–312. [Google Scholar] [CrossRef]
  2. Burkhardt, R.W., Jr. Ethology, natural history, the life sciences, and the problem of place. J. Hist. Biol. 1999, 32, 489–508. [Google Scholar] [CrossRef]
  3. Crockett, C.M.; Ha, R.R. Data collection in the zoo setting, emphasizing behavior. In Wild Mammals in Captivity: Principles and Techniques for Zoo Management, 2nd ed.; Kleiman, D.G., Thompson, K.V., Baer, C.K., Eds.; The University of Chicago Press: Chicago, IL, USA, 2010; pp. 386–406. [Google Scholar]
  4. Watters, J.V.; Margulis, S.W.; Atsalis, S. Behavioral monitoring in zoos and aquariums: A tool for guiding husbandry and directing research. Zoo Biol. 2009, 28, 35–48. [Google Scholar] [CrossRef]
  5. Lincoln Park Zoo. ZooMonitor (Version 3.2) [Mobile Application Software]. 2020. Available online: https://zoomonitor.org (accessed on 23 February 2021).
  6. Wark, J.D.; Cronin, K.A.; Niemann, T.; Shender, M.A.; Horrigan, A.; Kao, A.; Ross, M.R. Monitoring the behavior and habitat use of animals to enhance welfare using the ZooMonitor app. Anim. Behav. Cogn. 2019, 6, 158–167. [Google Scholar] [CrossRef]
  7. Saiyed, S.T.; Hopper, L.M.; Cronin, K.A. Evaluating the behavior and temperament of African penguins in a non-contact animal encounter program. Animals 2019, 9, 326. [Google Scholar] [CrossRef] [PubMed] [Green Version]
  8. Woods, J.M.; Ross, S.R.; Cronin, K.A. The social rank of zoo-housed Japanese macaques is a predictor of visitor-directed aggression. Animals 2019, 9, 316. [Google Scholar] [CrossRef] [Green Version]
  9. Jacobson, S.L.; Kwiatt, A.C.; Ross, S.R.; Cronin, K.A. The effects of cognitive testing on the welfare of zoo-housed Japanese macaques (Macaca fuscata). Appl. Anim. Behav. Sci. 2019, 212, 90–97. [Google Scholar] [CrossRef]
  10. Spain, M.S.; Fuller, G.; Allard, S.M. Effects of habitat modifications on behavioral indicators of welfare for Madagascar giant hognose snakes (Leioheterodon madagascariensis). Anim. Behav. Cogn. 2020, 7, 70–81. [Google Scholar] [CrossRef]
  11. Fazio, J.M.; Barthel, T.; Freeman, E.W.; Garlick-Ott, K.; Scholle, A.; Brown, J.L. Utilizing camera traps, closed circuit cameras and behavior observation software to monitor activity budgets, habitat use, and social interactions of zoo-housed Asian elephants (Elephus maximus). Animals 2020, 10, 2026. [Google Scholar] [CrossRef] [PubMed]
  12. Eyer, A.E.; Miller, L.J. Evaluating the influence of conspecifics on a male giant anteater’s (Myrmecophaga tridactyla) pacing behavior. Anim. Behav. Cogn. 2020, 7, 556–566. [Google Scholar] [CrossRef]
  13. Wark, J.D.; Wierzal, N.K.; Cronin, K.A. Mapping shade availability and use in zoo environments: A tool for evaluating thermal comfort. Animals 2020, 10, 1189. [Google Scholar] [CrossRef] [PubMed]
  14. Dietmar, C.; Romani, T.; Llorente, M.; Kalcher-Sommersguter, E. Assessing the sociability of former pet and entertainment chimpanzees by using multiplex networks. Sci. Rep. 2020, 10, 20969. [Google Scholar] [CrossRef]
  15. Hansen, B.K.; Hopper, L.M.; Fultz, A.; Ross, S.R. Understanding the behavior of sanctuary-housed chimpanzees during public programs. Anthrozoös 2020, 33, 481–495. [Google Scholar] [CrossRef]
  16. Lasky, M.; Campbell, J.; Osborne, J.A.; Ivory, E.L.; Lasky, J.; Kendall, C.J. Increasing browse and social complexity can improve zoo elephant welfare. Zoo Biol. 2021, 40, 9–19. [Google Scholar] [CrossRef] [PubMed]
  17. Ramont, M.; Leahy, M.; Cronin, K.A. Domestic animal welfare at the zoo: The impact of an animal visitor interaction program on chickens. Anim. Behav. Cogn. 2021, 8, 1–14. [Google Scholar] [CrossRef]
  18. Wolfensohn, S.; Shotton, J.; Bowley, H.; Davies, S.; Thompson, S.; Justice, W.S.M. Assessment of welfare in zoo animals: Towards optimum quality of life. Animals 2018, 8, 110. [Google Scholar] [CrossRef] [PubMed] [Green Version]
  19. Dawkins, M.S. Using behaviour to assess animal welfare. Anim. Welf. 2004, 13 (Suppl. 1), S3–S7. [Google Scholar]
  20. Hill, S.P.; Broom, D.M. Measuring zoo animal welfare: Theory and practice. Zoo Biol. 2009, 28, 531–544. [Google Scholar] [CrossRef] [PubMed]
  21. Binding, S.; Farmer, H.; Krusin, L.; Cronin, K. Status of animal welfare research in zoos and aquariums: Where are we, where to next? J. Zoo Aquarium Res. 2020, 8, 1–9. [Google Scholar] [CrossRef]
  22. Association of Zoos and Aquariums. The Accreditation Standards and Related Policies. 2021. Available online: https://www.aza.org/accred-materials/ (accessed on 20 February 2021).
  23. European Association of Zoos and Aquaria. EAZA Standards for the Accommodation and Care of Animals in Zoos and Aquaria. 2020. Available online: https://www.eaza.net/about-us/eazadocuments/ (accessed on 20 February 2021).
  24. World Association of Zoos and Aquariums. WAZA 2023 Animal Welfare Goal. In Annual Report 2019. p. 13. Available online: https://www.waza.org/publications/ (accessed on 20 February 2021).
  25. Warsaw, D.; Sayers, J. The influence of animal welfare accreditation programmes on zoo visitor perceptions on the welfare of zoo animals. J. Zoo Aquar. Res. 2020, 8, 188–193. [Google Scholar] [CrossRef]
  26. Sherwen, S.L.; Hemsworth, L.M.; Beausoleil, N.J.; Embury, A.; Mellor, D.J. An animal welfare risk assessment process for zoos. Animals 2018, 8, 130. [Google Scholar] [CrossRef] [PubMed] [Green Version]
  27. Kazdin, A.E. Artifact, bias, and the complexity of assessment: The ABCs of reliability. J. Appl. Behav. Anal. 1977, 10, 141–150. [Google Scholar] [CrossRef] [PubMed] [Green Version]
  28. Tuyttens, F.A.M.; de Graaf, S.; Heerkens, J.L.T.; Jacobs, L.; Nalon, E.; Ott, S.; Stadig, L.; Van Laer, E.; Ampe, B. Observer bias in animal behaviour research: Can we believe what we score, if we score what we believe? Anim. Behav. 2014, 90, 273–280. [Google Scholar] [CrossRef]
  29. Burghardt, G.M.; Bartmess-LeVasseur, J.N.; Browning, S.A.; Morrison, K.E.; Stec, C.L.; Zachau, C.E.; Freeberg, T.M. Minimizing observer bias in behavioral Studies: A review and recommendations. Ethology 2012, 118, 511–517. [Google Scholar] [CrossRef]
  30. Kardish, M.R.; Mueller, U.G.; Amador-Vargas, S.; Dietrich, E.I.; Ma, R.; Barrett, B.; Fang, C.C. Blind trust in unblinded observation in ecology, evolution, and behavior. Front. Ecol. Evol. 2015, 3, 51. [Google Scholar] [CrossRef] [Green Version]
  31. Tuyttens, F.A.M.; Stadig, L.; Heerkens, J.L.T.; Van Laer, E.; Buijs, S.; Ampe, B. Opinion of applied ethologists on expectation bias, blinding observers and other debiasing techniques. Appl. Anim. Behav. Sci. 2016, 181, 27–33. [Google Scholar] [CrossRef] [Green Version]
  32. Lehner, P.N. Handbook of Ethological Methods, 2nd ed.; Cambridge University Press: Cambridge, UK, 1996; pp. 210–221. [Google Scholar]
  33. Munch, K.L.; Wapstra, E.; Thomas, S.; Fisher, M.; Sinn, D.L. What are we measuring? Novices agree amongst themselves (but not always with experts) in their assessment of dog behaviour. Ethology 2019, 125, 203–211. [Google Scholar] [CrossRef]
  34. Funder, D.C. On the accuracy of personality judgment: A realistic approach. Psychol. Rev. 1995, 102, 652–670. [Google Scholar] [CrossRef] [Green Version]
  35. Martin, P.; Bateson, P. Measuring Behavior: An Introductory Guide, 3rd ed.; Cambridge University Press: Cambridge, UK, 2007. [Google Scholar]
  36. Jansen, R.G.; Wiertz, L.F.; Meyer, E.S.; Noldus, L.P.J.J. Reliability analysis of observational data: Problems, solutions, and software implementation. Behav. Res. Methods Instrum. Comput. 2003, 35, 391–399. [Google Scholar] [CrossRef]
  37. Hartmann, D.P. Considerations in the choice of interobserver reliability estimates. J. Appl. Behav. Anal. 1977, 10, 103–116. [Google Scholar] [CrossRef] [PubMed] [Green Version]
  38. Cohen, J. A coefficient of agreement for nominal scales. Educ. Psychol. Meas. 1960, 20, 37–46. [Google Scholar] [CrossRef]
  39. R Core Team. R: A Language and Environment for Statistical Computing. Available online: https://www.r-project.org/ (accessed on 20 February 2021).
  40. Wickham, H. ggplot2: Elegant Graphics for Data Analysis. Available online: https://CRAN.R-project.org/package=ggplot2/ (accessed on 20 February 2021).
  41. Sherwen, S.L.; Hemsworth, P.H. The visitor effect on zoo animals: Implications and opportunities for zoo animal welfare. Animals 2019, 9, 366. [Google Scholar] [CrossRef] [PubMed] [Green Version]
  42. Caro, T.M.; Roper, R.; Young, M.; Dang, G.R. Inter-observer reliability. Behaviour 1979, 69, 303–315. [Google Scholar] [CrossRef]
  43. Reid, J.B. Reliability assessment of observation data: A possible methodological problem. Child Dev. 1970, 41, 1143–1150. [Google Scholar] [CrossRef]
  44. Powell, D.; Speeg, B.; Li, S.; Blumer, E.; McShea, W. An ethogram and activity budget of captive Sichuan takin (Budorcas taxicolor tibetana) with comparisons to other Bovidae. Mammalia 2013, 77, 391–401. [Google Scholar] [CrossRef]
  45. Farmer, H.; Dayrell, E.; Pullen, K. Encouraging enclosure use for red river hogs using scatter feedings. Shape Enrich. 2006, 15, 11–13. [Google Scholar]
  46. Sulser, C.E.; Steck, B.L.; Baur, B. Effects of construction noise on behaviour of and exhibit use by snow leopards Uncia at Basel zoo. Int. Zoo Yearb. 2008, 42, 199–205. [Google Scholar] [CrossRef]
  47. Flacke, G.L.; Chambers, B.K.; Martin, G.B.; Paris, M.C.J. The pygmy hippopotamus Choeropsis liberiensis (Morton, 1849): Bringing to light research priorities for the largely forgotten, smaller hippo species. Zool. Garten 2015, 84, 234–265. [Google Scholar] [CrossRef]
  48. Figel, T. Activity Budget and Behavior in the African Penguin (Spheniscus demersus). Master’s Thesis, University of Saint Joseph, West Hartford, CT, USA, 20 February 2020. [Google Scholar]
  49. Wark, J.D.; Cronin, K.A. Expansion of a Behavioral Monitoring App for Multi-Institutional Collaboration at Zoological and Aquarium Institutions (Institute of Museum and Library Services Grant MG-245613-OMS-20). Available online: https://www.imls.gov/grants/awarded/mg-245613-oms-20 (accessed on 20 February 2021).
  50. Watson, C.F.I.; Buchanan-Smith, H.M. Marmoset Care Website. Available online: http://marmosetcare.com/ (accessed on 23 February 2021).
  51. Mouse Ethogram: An Ethogram for the Laboratory Mouse. Available online: https://mousebehavior.org/ (accessed on 23 February 2021).
Figure 1. The percent of ethogram behaviors volunteer observers encountered during inter-observer reliability tests for six species monitored as part of a zoo-wide behavior monitoring program. Boxplots depict the median (line), inter-quartile range (box), and min and max values (whiskers).
Jzbg 02 00014 g001
Figure 2. The percent of ethogram behaviors encountered by volunteer observers during successive inter-observer reliability test sessions of six study species monitored as part of a zoo-wide behavior monitoring program. The median percent of ethograms evaluated is depicted as a blue line with 1 median absolute deviation (MAD) above and below the median shown in the grey band. One observer that required 11 sessions to pass reliability testing is not shown.
Jzbg 02 00014 g002
Figure 3. The percent of ethogram behaviors encountered by volunteer observers during successive inter-observer reliability test sessions of six study species monitored as part of a zoo-wide behavior monitoring program. Each line represents data from one volunteer observer.
Jzbg 02 00014 g003
Figure 4. The overall percent of occurrences of behavior categories during inter-observer reliability tests for six study species monitored as part of a zoo-wide behavior monitoring program. Points representing species values are superimposed over boxplots depicting the median (line), inter-quartile range (box), and min and max values (whiskers) across species.
Jzbg 02 00014 g004
Figure 5. The disagreements observed during inter-observer reliability tests for each behavior category of the six study species. The (A) percent of total disagreements observed, and (B) median standardized percent of disagreements are shown to demonstrate the overall pattern of disagreements and the pattern of disagreements when adjusting for how frequently a behavior occurred. Points representing species values are superimposed over boxplots depicting the median (line), inter-quartile range (box), and min and max values (whiskers) across species.
Jzbg 02 00014 g005
Table 1. The number of observers tested, and reliability test sessions conducted across six species monitored as part of an on-going behavior monitoring program.
SpeciesNo. of Observers TestedNo. of Observer Pairwise TestsNo. of Focal Animal Pairwise Tests
African Penguin248686
Klipspringer34128139
Pygmy Hippo38159213
Red River Hog31111186
Sichuan Takin1264136
Snow Leopard24100100
Table 2. The number of reliability test sessions required for observers to “pass 1”.
SpeciesMedian ± MADMin–Max
African Penguin3 ± 03–6
Klipspringer3 ± 03–11
Pygmy Hippo4 ± 1.53–11
Red River Hog3 ± 03–5
Sichuan Takin 25 ± 1.54–9
Snow Leopard4 ± 0.73–6
1 A mean session score of 85% agreement or greater between the trainer and observer across at least 3 sessions conducted over multiple days was required to “pass” reliability testing. 2 As the Sichuan takin were housed in two separate habitats, the above criterion was modified to include at least 2 reliability test sessions from each habitat.
Table 3. The percent of occurrences of ethogram behavior categories for the six study species recorded during inter-observer reliability tests of six study species monitored as part of a zoo-wide behavior monitoring program.
SpeciesInactiveFeed/Forage/DrinkLocomotionUndesirableOther SolitarySocialOtherNot Visible
African Penguin35.10.421.1 10.50.10.232.6
Klipspringer53.829.72.60.25.60.1 8.0
Pygmy Hippo49.83.310.49.41.61.30.124.1
Red River Hog56.419.34.50.03.50.00.216.2
Sichuan Takin33.929.41.30.05.00.9 29.6
Snow Leopard67.16.33.13.412.90.00.07.3
Publisher’s Note: MDPI stays neutral with regard to jurisdictional claims in published maps and institutional affiliations.

