Article

DNA Damage as a Potential Non-Invasive Indicator of Welfare: A Preliminary Study in Zoo-Housed Grizzly Bears (Ursus arctos horribilis)

1
Center for Zoo and Aquarium Animal Welfare and Ethics, Detroit Zoological Society, Royal Oak, MI 48067, USA
2
National Aquarium, Baltimore, MD 21202, USA
*
Author to whom correspondence should be addressed.
J. Zool. Bot. Gard. 2021, 2(3), 316-334; https://0-doi-org.brum.beds.ac.uk/10.3390/jzbg2030022
Submission received: 1 February 2021 / Revised: 19 May 2021 / Accepted: 21 June 2021 / Published: 25 June 2021
(This article belongs to the Special Issue Recent Advances in the Science of Zoo and Aquarium Animal Welfare)

Abstract

:
Measures of oxidative stress have potential for integrating positive and negative life experiences into comprehensive cellular indicators of animal welfare. We explored this possibility when three adult grizzly bear brothers at the Detroit Zoo were temporarily moved to a smaller habitat while their primary home was expanded. We expected that the spatial compression and construction activity might be sources of stress. We observed increased social play and other affiliative behavior in the smaller habitat, and we used daily fecal samples (17 to 24 per bear) to examine whether concentrations of fecal glucocorticoid metabolites (FGM) and 8-hydroxy-2′-deoxyguanosine (8-OHdG, a by-product of DNA damage) were correlated with social behavior. Our overall aim was to explore 8-OHdG as a potential indicator of welfare based on the prediction that 8-OHdG would be lower when more positive social interactions occurred. Concentrations of fecal 8-OHdG increased significantly with higher FGM concentrations, supporting a potential relationship between adrenal activity and rates of DNA damage. However, we found that on days when they engaged in higher rates of affiliative interactions, there were trends for 8-OHdG concentrations to increase for one bear and decrease for another, and no relationship for the third bear. These preliminary results should be interpreted with caution, but suggest a potential relationship between social behavior and 8-OHdG that is modulated by health, personality, or other individual factors. Further validation research is needed, but 8-OHdG may have promise as a non-invasive, cumulative indicator of animal welfare.

1. Introduction

Animal welfare is a holistic concept that encompasses an individual animal’s physical, mental, and emotional states measured over a period of time and on a scale from poor to good [1]. The current most common model of animal welfare is based on the concept of five domains, including the environment, nutrition, health, and behavioral interactions—which are processed through the fifth, mental domain, representing the individual’s affective experience [2]. Animal behavior is the most commonly used means of assessing welfare, but investigators often employ multiple cross-disciplinary measures (e.g., behavior, hormones, body condition) to account holistically for the different domains [3]. However, interpretation challenges sometimes arise when various indicators of welfare produce potentially conflicting results. These issues may occur because welfare is inherently complex, and an animal may have positive experiences in one domain but not another. Alternatively, problems may arise when it is unclear if a change in an indicator reflects positive or negative welfare [4].
Glucocorticoids represent one indicator for which the directional effects (i.e., positive or negative) are not always clear. Glucocorticoids are a class of metabolic hormones that perform a variety of regulatory functions, one of which involves mobilizing energy in response to perceived stressors [5]. When an animal identifies an environmental threat, a hormone cascade begins with the secretion of corticotropin-releasing hormone from the hypothalamus and results in the release of glucocorticoids from the adrenal cortex [6]. Measuring glucocorticoids has become increasingly common in zoo and aquarium research because these steroid hormones can be measured non-invasively in a variety of sample types (e.g., urine, feces, saliva, and hair), and captivity exposes animals to a variety of potential stressors that may affect their welfare [7].
Glucocorticoid data can be challenging to interpret because adrenal activity can increase due to negative or positive events (e.g., mating or enrichment [8]), resulting in conflicting or unclear relationships between behavioral and physiological welfare indicators. This problem can sometimes be resolved by utilizing an integrated measure of glucocorticoid activity. While blood values represent a point in time, integrated measures such as fecal hormone metabolites represent glucocorticoid activity averaged over a period of time, so results are less biased by transient responses [9]. Reactions to acute stressors are often fleeting and adaptive, while chronic stress is known to have damaging physiological effects and, ultimately, contributes to premature aging [10]. Biomarkers downstream of glucocorticoids that focus on the biological consequences of exposure to frequent, uncontrolled stressors also may be more informative about animal welfare. Examples of these may include DNA damage and other measures of oxidative damage [9].
The mechanisms linking glucocorticoids to organismal damage are still being elucidated, but appear to be mediated through oxidative stress at the cellular level. Reactive oxygen species (ROS) and other “free radicals” are normal byproducts of cellular metabolism that are highly reactive chemically and can damage proteins, lipids, DNA, and other critical cellular macromolecules [11]. During normal functioning, antioxidant defenses effectively neutralize ROS, resulting in a balanced state with little oxidative damage. An organism may experience oxidative stress and subsequent damage when this balance cannot be maintained, either due to lack of antioxidant capacity or an increase in conditions that promote the formation of ROS—such as elevated glucocorticoids [11,12]. Therefore, oxidative stress is likely an important mechanism by which life stressors (via glucocorticoid activity) can physically damage organisms.
Oxidative damage to DNA has been studied extensively in human biomedical research, in large part due to the role oxidative stress plays in generating carcinogenic mutations [13]. More recently, investigators have found evidence linking oxidative DNA damage to other conditions, including major depression [14] and schizophrenia [15]. Epidemiological studies are increasingly employing urinary 8-hydroxy-2′-deoxyguanosine (8-OHdG) as a non-invasive marker of DNA damage and have found meaningful relationships to lifestyle-based risk factors (e.g., smoking, activity level) for a variety of disease states [16]. One such study of Japanese workers found positive correlations between urinary 8-OHdG and both average number of working hours and serum cortisol concentrations, providing support for a relationship between glucocorticoid activity and DNA damage [17].
Increasingly, measures of oxidative stress are also being utilized to understand how environmental factors shape survival and fitness in wildlife [18]. For example, Larcombe et al. [19] explored relationships between body mass, activity levels, and oxidative damage to DNA in captive budgerigars (Melopsittacus undulatus). They used comet assays to measure several components of oxidative DNA damage in lymphocytes, including single-stranded DNA breaks, and found that higher body mass and greater activity levels were both associated with more DNA damage [19]. Gormally et al. [20] also used comet assays to measure DNA damage in house sparrows (Passer domesticus), and found it was detectable in whole blood after as little as 30 min of restraint stress. Similarly, Stier et al. [21] used an ELISA to find a significant increase in plasma 8-OHdG in wild king penguins (Aptenodytes patagonicus) after 30 min of restraint. These studies, along with in-vitro evidence, show potential for DNA damage as a biomarker for both acute and chronic stress [9].
Animals in captivity are exposed to a variety of potential stressors, including noise and vibrations associated with construction activities [22]. Other relevant stressors include space limitations that, for group-living animals, may also involve increased social density relative to free-ranging conditions [7]. Several models have been proposed to explain how mammals respond to elevated social density. Early research based on rodent models linked crowding to increased aggressive behavior (density–aggression model; described in [23]), but further research in group-living species suggests the opposite effect is more common. Instead, group-living animals use a variety of strategies to avoid potential conflicts accompanying increased social density. These include the conflict-avoidance strategy, which predicts a decrease in both aggressive and affiliative behaviors under crowded conditions, and the tension-reduction strategy, in which animals increase affiliative behavior to preempt conflict and defuse social stress (reviewed in [23,24]). At the proximate level, affiliative interactions can attenuate glucocorticoid activity associated with the stress response by increasing circulating levels of oxytocin [25]. Laboratory experiments have shown that experimentally administering oxytocin can prevent oxidative damage associated with corticosterone treatment [26], demonstrating mechanistically how social behaviors can help animals cope with potential stressors.
Grizzly bears (Ursus arctos horribilis) are a North American subspecies of brown bear found in western Canada with a range that once extended south to Mexico, but is now limited to the northwestern United States and Alaska [27]. Although brown bears are classified as carnivores, their diets vary with season and habitat type. Home range sizes also vary drastically with food availability and dietary strategy, ranging from an average of 200 km2 for males in coastal populations to 30,000 km2 in the Arctic tundra [27]. Brown bears are considered largely solitary. However, their home ranges may overlap, and they may aggregate when food is plentiful, such as during seasonal salmon runs [28,29]. Under these conditions, dominant individuals still have priority access to feeding sites, and subordinate males and females use a variety of behavioral strategies to avoid potentially lethal conflicts [29].
Zoos accredited by the Association of Zoos and Aquariums (AZA) maintain a non-breeding population of brown bears consisting predominantly of bears placed in AZA facilities when they were orphaned cubs by the Alaska Department of Fish and Game and the United States Fish and Wildlife Service [30]. As of 2019, this population numbered 130 individuals in 42 AZA zoos and 3 related facilities [31]. Related individuals are sometimes housed socially, as is the case with the three grizzly bears residing at the Detroit Zoo in Royal Oak, MI, USA. These three bears were wild-born littermates from Alaska who were orphaned at approximately ten months of age when their mother was killed by a poacher. The cubs were placed with the Detroit Zoological Society by the Alaska Department of Fish and Game in December 2011 and have resided together in the Detroit Zoo’s American Grasslands habitats since then.
We monitored the welfare of the grizzly bears at the Detroit Zoo throughout a construction process aimed at doubling the size of their former habitat, in part to assess how the habitat expansion affected their welfare. We collected data using a combination of behavioral observations and fecal glucocorticoid metabolite analysis. During a portion of the construction, the bears were moved to a temporary, smaller habitat, and we noticed a marked increase in positive social interactions (affiliative behavior and play) in that space. We analyzed fecal samples collected from the smaller habitat for DNA damage to explore its utility as a welfare indicator. To our knowledge, the tension-reduction model has not been explicitly studied in bears, but based on results from other taxa, we assumed the bears in this study were using social behavior as a buffer against stress. We also assumed that positive social behavior was itself a positive indicator of welfare [32]. Based on these assumptions, we predicted that DNA damage would be positively correlated with glucocorticoid expression, and that both measures would be lower when the bears engaged in more positive social interactions, providing preliminary evidence for DNA damage as an indicator of welfare. To our knowledge, this is the first study to measure DNA damage in wildlife non-invasively using fecal samples.

2. Materials and Methods

2.1. Ethical Statement

This study involved non-invasive observational research and fecal collection. The research proposal was approved by the Detroit Zoological Society’s Animal Welfare and Management Committee.

2.2. Subjects and Housing

The subjects of this investigation were three adult male grizzly bears named Boo, Mike, and Thor. Based on an estimated birthdate of December 2010, the bears were approximately six years and nine months old at the onset of this study. Their weights on 7 April 2018 were 385.56 kg for Boo, 410.50 kg for Mike, and 420.48 kg for Thor.
The bears occupied three spaces during the full study period, which occurred from 5 September 2017 to 30 September 2018 (Table 1). Initially, the bears occupied the same habitat (described here as the “Original, Medium” habitat) where they had lived since 2011, and they had access to the habitat during the day and overnight. Following their 2017–2018 winter torpor, the bears were moved to the “Temporary, Smaller” habitat to accommodate the process of expanding their former habitat by annexing two adjacent habitats formerly occupied by other bears. For the last month of construction (beginning 25 April 2018), the male grizzlies began splitting time in the temporary, smaller habitat during the day with an elderly female grizzly bear. The female typically was accessed to the habitat in the morning and the males during the afternoon. For the entire time in the temporary habitat, the males spent nights in the holding stalls. At the end of May 2018, the bears moved back to their “Expanded, Largest” habitat, which they again had access to during the day and overnight. Although some data are presented from all three habitats, the main focus of this report is to describe relationships between behavioral and physiological measures collected while the bears occupied the temporary, smaller habitat.
Other husbandry practices were as consistent as possible throughout the remainder of the study, although there were some seasonal changes to the quantity of foods fed, as well as changes to the diet composition based on produce availability. Keeper notes indicate an effort to incorporate more variety in the diet starting in early April 2018, while the bears occupied the temporary habitat. The typical diet shared by all three bears included: 4.5–9.1 kg of mixed fish (typically herring and capelin); 4.5–6.8 kg of mixed produce (primarily apple, pear, carrot, sweet potato, lettuce, and berries); 4.5–6.8 kg of Nebraska Brand® special beef (2102B, Central Nebraska Packing Inc., North Platte, NE, USA); and 2.3–13.6 kg of Wild CarnivoreTM Bear Maintenance Diet (5M4R, Mazuri® Exotic Animal Nutrition, St. Louis, MO, USA). The bears also typically received bones a few times a week, as well as other novel foods or non-food enrichment opportunities on a daily basis. The main diet was fed between 0730 and 0830 h when the bears were brought into holding while their outdoor yard was serviced.
In all habitats, the bears participated in daily positive reinforcement training sessions. Sessions lasted 5–15 min per bear and included training for blood draws, nail trims, shifting between enclosures, and other husbandry-related behaviors. Mike had an old injury that sometimes caused him to appear stiff or lame in his rear legs, and he received between 60–90 mg of oral meloxicam daily for the entire period he occupied the smaller, temporary habitat. His positive reinforcement training sessions also included learning a foot presentation behavior for X-rays to monitor his medical condition.

2.3. Behavioral Observations

Observers collected behavioral data on focal bears five days per week, twice a day, balanced across four hours in the mornings (0800 to 1200 h) and four hours in the afternoon (1200 to 1600 h). For each session of data collection, the order of focals was determined using an online list randomizer. Focal observations were 20 min in duration for data collected in 2017 and 15 min for data collected in 2018, including all data in the temporary, smaller habitat. Observations were conducted using scan sampling [33] at 1 min intervals of behavior, social proximity, substrate (e.g., dirt, mulch, grass), and location. Additionally, all occurrences of social behaviors were recorded along with initiator and recipient identities, as well as all occurrences of undesirable behaviors and enrichment use. For the purpose of this publication, we have included a partial ethogram of the behaviors that were utilized in data analysis (Table 2). The full ethogram is available as a supplemental file (Table S1) [34]. The data were collected using the ZooMonitor app [35] on iPad tablets (Apple, Cupertino, CA, USA). Four observers collected data for this study. Inter-observer reliability was tested in each habitat, and all observers demonstrated >90% consistency calculated by percent difference in behaviors scored over three separate simultaneous observations.
Over the course of the nine-month study (and in all three habitats), 74 h of observational data were collected per bear. However, we discarded observations when the focal bear was not visible for more than half of the time, so actual data totals were lower. The amount of behavioral data matched to physiological data for analyzing the DNA damage biomarker ranged from 8.5 to 12 h per bear, representing 17 days for Boo, 19 days for Mike, and 24 days for Thor in the smaller, temporary habitat.

2.4. Sample Collection and Analysis

Animal care staff attempted to collect fecal samples from each bear on a daily basis, although it was not always possible to find a fresh sample from each individual. Each bear was fed approximately 1/8 to 1/4 cup of a distinct color of non-toxic glitter daily to facilitate individual identification of fecal samples [36]. Samples were collected during habitat servicing (0800–0900 h), and only fresh samples were collected based on a visual assessment of location and moisture level or by observing defecation when possible. Samples were labeled and immediately frozen at −20 °C until analysis in the endocrinology laboratory at the Detroit Zoo. Prior to further analysis, all samples were lyophilized until they were completely desiccated (about 24 h), crushed with a rubber mallet, and sifted into a fine powder, with glitter and other large particles removed.
We analyzed the following number of samples collected in the smaller, temporary habitat from each bear for fecal glucocorticoid metabolites (FGM): 17 for Boo, 34 for Mike, and 24 for Thor. We followed our standard in-house procedure to extract FGM [37]. Briefly, 0.2 ± 0.01 g of fecal powder was suspended in 2.0 mL of 80% ethanol and shaken on a high-capacity mixer for 1 h. This suspension was then centrifuged for 20 min at 2500× g at 4 °C. The supernatant was poured into a clean glass culture tube and evaporated under forced air in a heated block at 37 °C. The sample was then reconstituted in 2.0 mL of assay buffer and incubated for 30 min in a sonicating water bath prior to analysis.
Samples were analyzed for FGMs in duplicate on randomly-assigned plates using a cortisol enzyme-immunoassay (EIA) with standard, enzyme conjugate, and antibody sourced from Arbor Assays (ISWE002; Ann Arbor, MI, USA) used with plates coated in house with goat anti-rabbit immunoglobulin G. The assay was chemically validated in the Detroit Zoo lab via parallelism (y = 1.115x − 9.369, R2 = 0.999, F1,4 = 3489.787, p < 0.001) and by spiked recoveries totaling 112.261% at 800.0 pg/mL of standard and 103.754% at 100.0 pg/mL of standard. Most samples were analyzed at a 1:8 dilution, but samples were reanalyzed at other dilutions ranging from 1:2 to 1:80 to ensure that the mean percent binding fell between 20% and 80%, and samples with a CV > 10% between duplicates were reanalyzed as well. The average intra-assay coefficient of variation (CV) for duplicates was 2.618%, and the average inter-assay CV based on three house controls analyzed on each plate was 6.203%.
For analysis of DNA damage, we analyzed the same samples (17 for Boo, 34 for Mike, and 24 for Thor). We extracted samples following a commercial protocol (Arbor Assays, 2019), in which 0.2 ± 0.01 g of fecal powder was suspended in 2.0 mL of 100% ethanol, shaken for 45 min on a high-capacity mixer, centrifuged for 15 min at 5000 rpm, and evaporated to dryness at 37 °C under forced air. Samples were reconstituted in 1.0 mL assay buffer/2% ethanol, incubated in a sonicating water bath for 20 min and analyzed in duplicate using a commercial EIA for DNA damage (K059; Arbor Assays, Ann Arbor, MI, USA). The DNA damage EIA detects all three oxidized guanine species: 8-hydroxy-2′-deoxyguanosine (8-OHdG) from DNA, 8-hydroxyguanosine from RNA, and 8-hydroxyguanine from digested DNA. The primary analyte is 8-OHdG, which is used to generate the standard curve for the EIA. The EIA was validated chemically in the Detroit Zoo lab via parallelism (y = 0.924x + 16.096, R2 = 0.941, F1,6 = 96.017, p < 0.001) and by spiked recoveries totaling 102.765% at 2000.0 pg/mL of standard, 105.804% at 1000 pg/mL of standard, and 89.898% at 500.0 pg/mL of standard. All samples were analyzed at a dilution of 1:16 or 1:20, which fell between 20% and 80% binding on the standard curve, and duplicates with a CV > 10% were reanalyzed as well. The average intra-assay CV for duplicates was 2.538%, and the average inter-assay CV based on the standard percent binding values was 7.836%.

2.5. Additional Assay Validation Tests

We conducted four additional small-scale tests to explore how fecal sample/extract storage and exposure to sunlight affected measured DNA damage concentrations. To test the effects of exposure to sunlight, we divided a single, fresh (i.e., defecation was observed) fecal sample into four parts. One part was frozen immediately, and the rest were exposed to sunlight (under a net cover to avoid insect activity or other sources of contamination) on a hot (32.2 °C), cloudless day and frozen after two, four, or six hours of exposure to these conditions. To test the effects of sample storage, we compared concentrations between fecals that were stored in powdered form and re-extracted after six months (n = 3 samples), and between initial measured concentrations and fecal extracts stored at −20 °C for three (n = 4) and six (n = 4) months. Note that all the fecal samples analyzed for DNA damage were from the temporary habitat and were initially analyzed in early 2019, meaning that the powdered fecal samples had already been stored at −20 °C for approximately one year before any analysis for DNA damage was conducted.

2.6. Statistical Analyses

We performed descriptive data analysis in Excel 2016 (Microsoft Corporation, Redmond, WA, USA). We summarized behavioral data by day for each bear based on visible time during their focal observations only, so the total number of scans per day was adjusted by subtracting scans scored as “not visible” to calculate the percent of time each scan behavior occurred. We also used the total number of not visible scans to estimate (one scan = one min) the number of minutes visible per day to calculate rates of all-occurrence behaviors. We focused our analysis on counts of social interactions from all-occurrence data rather than scan data because the former captured more interactions.
We used an iterative process to calculate FGM baseline concentrations for each bear using samples from the smaller, temporary habitat. The process consisted of taking the mean FGM value, eliminating values two standard deviations above or below the mean, recalculating the mean, and repeating the process until no values fell more than two standard deviations from the mean. Based on initial tests with the glitter fecal marker, we adjusted dates for concentrations of FGM backwards by 24 h to account for the lag time to hormone excretion. We also adjusted dates by 24 h to compare behavior to 8-OHdG based on its correspondence with FGMs in individual hormone profiles.
We performed all inferential statistics using SPSS v. 25 (IBM Corporation, Armonk, NY, USA). We compared the behavior of the bears in the three habitats using generalized linear mixed models (GLMM) to account best for the large number of repeated observations on the same bears. To examine differences in counts of affiliative and agonistic behavior among habitats, we used GLMM with Poisson distributions and log link functions. Fixed effects included habitat and study month. The models were offset by ln (number of visible scans) to account for visibility differences across observations. These models included a random intercept for subject, a random slope for subject x exhibit, and a first-order autoregressive (AR1) covariance structure. Degrees of freedom were calculated using a Satterthwaite approximation, and pairwise comparisons were made with estimated marginal means corrected for multiple comparisons using the least significant difference. The GLMM for all-occurrence counts of social play was constructed similarly, but utilized a negative binomial distribution and a log link function. It would not support a random slope but included a random intercept for individual bear.
Due to the size of the dataset, we were unable to fit mixed models for analyses limited to the time when the bears occupied the temporary, smaller habitat. Thus, we applied more traditional statistics to this dataset, acknowledging that these techniques do not fully account for the repeated measurements taken on individuals. Our intention was to identify areas of potential significance for further study, rather than to infer population trends. Therefore, we urge caution in extrapolating these results to other individuals or groups.
Physiological data were not normally distributed, so we log-transformed values of FGM and 8-OHdG for all analyses. To examine correlations between log(FGM) and log(8-OHdG), we used Pearson correlation coefficients on all samples. We used one-way ANOVAs to compare log-transformed FGM and 8-OHdG concentrations among the three bears and applied Dunnett T3 tests for pairwise comparisons.
To analyze relationships between physiological measures and behavior, we used only samples from days when behavioral data was collected. First, we examined behavioral differences among the three bears in the smaller, temporary habitat using one-way ANOVAs with Dunnett T3 tests for pairwise comparisons. For these analyses, we transformed rates of social interactions by adding a constant (+1) and taking the log of the rate per min to approximate normality. However, we compared the untransformed percent of time active, because inspection of q-q plots showed that it better approximated normality without a transformation. Next, we compared relationships between physiological and behavioral variables for the group and for each bear individually using Pearson correlation coefficients. We utilized the log-transformed versions of all variables in these analyses except for the mean daily temperature and the percent of time active. We compared binary daily keeper reports of Mike’s mobility (i.e., limping or not) to log(FGM) and log(8-OHdG) using non-parametric Spearman correlation coefficients. We limited our comparisons to rates of behaviors to minimize the number of tests performed to prevent Type I error. We elected to take this approach rather than controlling for multiple comparisons given the exploratory nature of this preliminary study.
Finally, to assess parallelism between pooled fecal extracts and standard curves, we used linear regression. We used paired t-tests to compare differences in DNA damage concentrations measured after different storage methods or times. We did not conduct statistical analyses on the sunlight/exposure test, which utilized a single sample, so we report these results descriptively.
For all analyses, we considered p < 0.05 to represent statistical significance, and p < 0.1 to represent statistical trends.

3. Results

3.1. Behavioral Comparisons among the Three Habitats

Counts of affiliative interactions did not vary by study month (F1,244 = 1.210, p = 0.272) but did vary significantly among habitats (F2,7 = 28.747, p < 0.001; Figure 1). Counts of affiliative interactions were higher in the temporary (smaller) habitat compared to both the original (medium) habitat (t3 = 6.379, p = 0.013) and the expanded (largest) habitat (t3 = 4.841, p = 0.020); the difference between the medium and largest habitats was also significant (t3 = −3.017, p = 0.017). Counts of social play also varied significantly by habitat (F2,245 = 21.277, p < 0.001) but not by month (F1,244 = 0.060, p = 0.807). Social play occurred more frequently in the smaller habitat compared to both the medium (t244 = 3.367, p = 0.001) and largest (t244 = 4.943, p < 0.001) habitats. The difference between the medium and largest habitats was not significant (t244 = 1.484, p = 0.139). Rates of agonistic interactions did not differ among the three habitats (F2,10 = 0.154, p = 0.860) or by study month (F1,244 = 0.117, p = 0.733; Figure 1).
The full activity budget for the bears in the temporary habitat is available as a supplemental file (Figure S1).

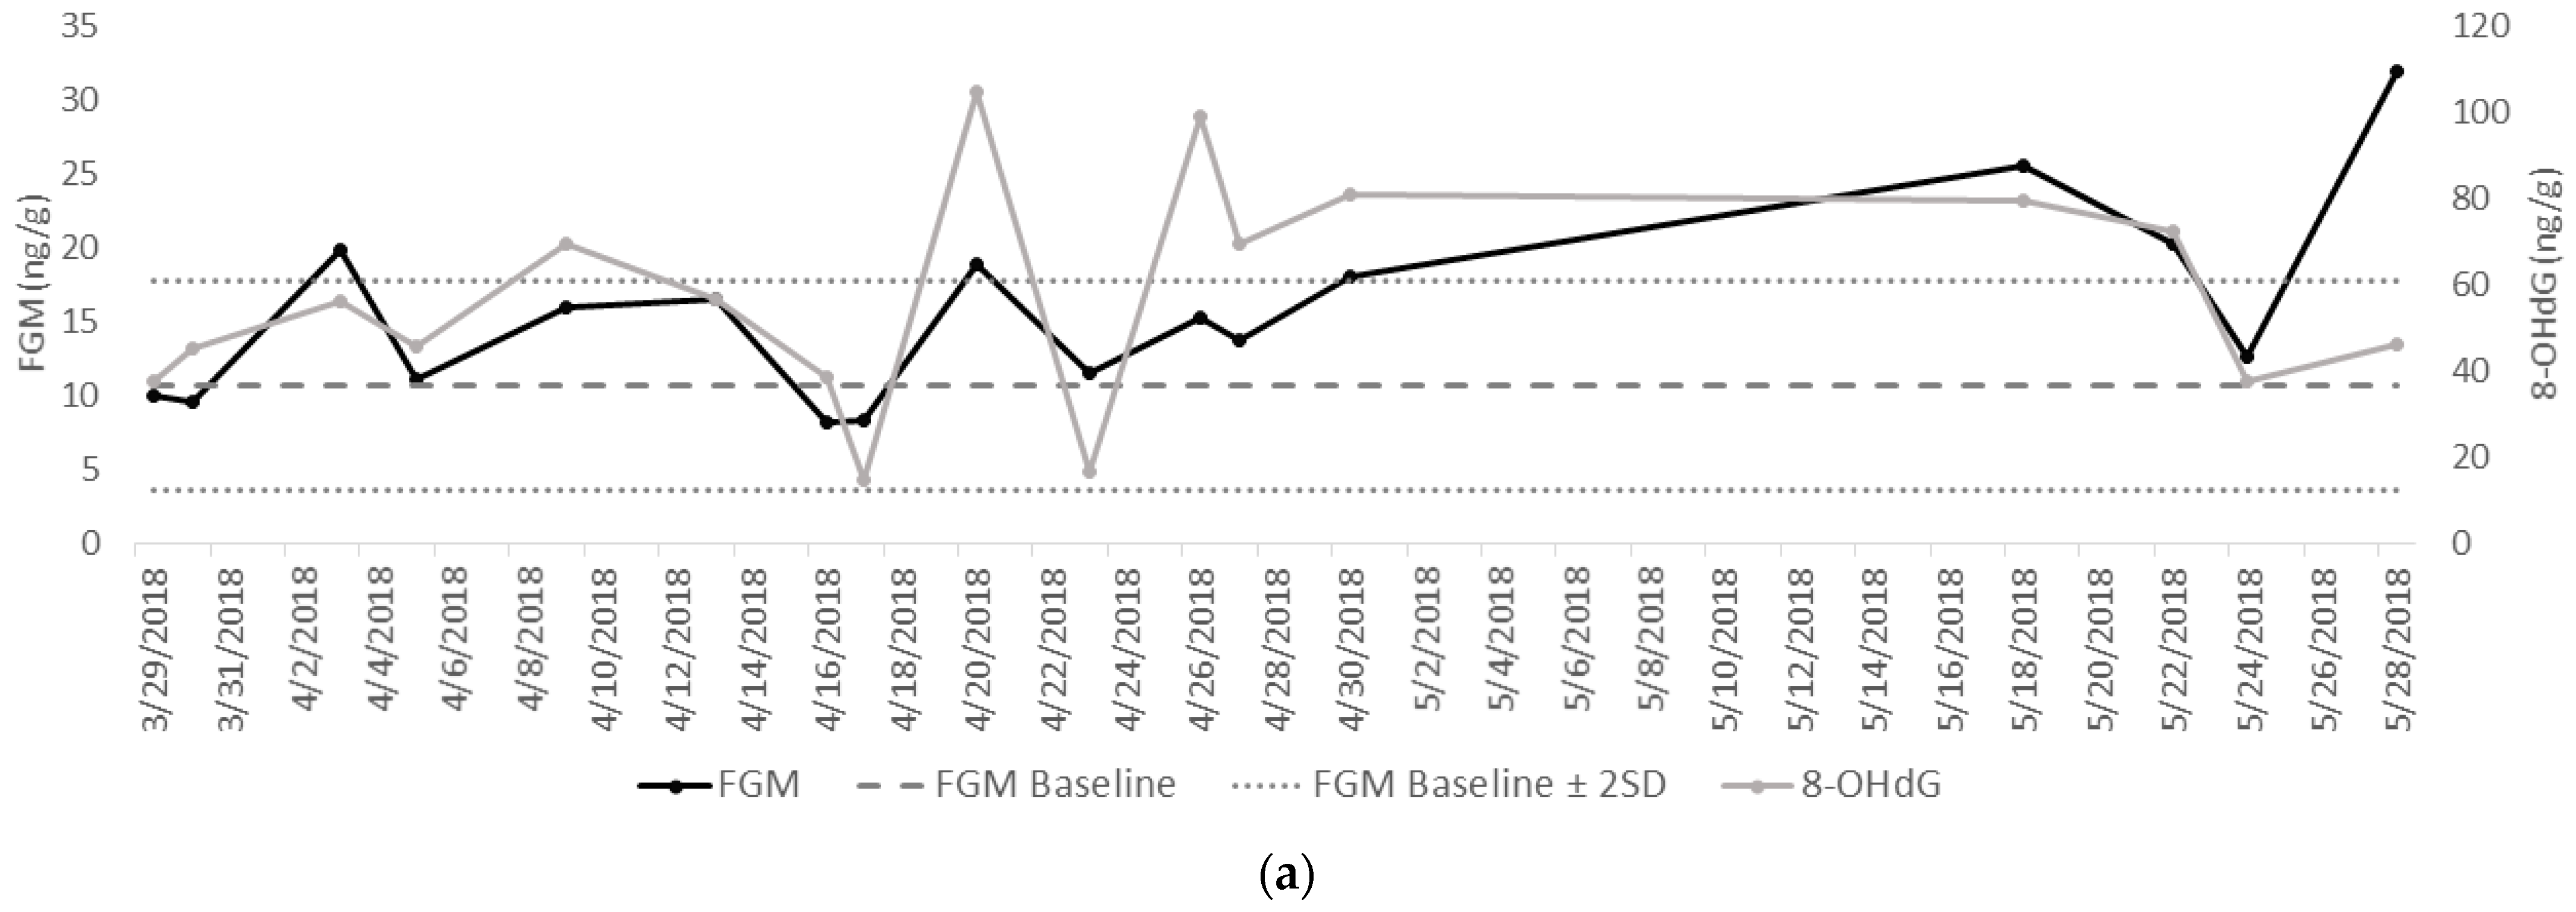
3.2. Patterns of FGMs and 8-OHdG in the Temporary, Smaller Habitat

Mean ± standard error FGM concentrations in the temporary habitat were 15.675 ± 1.546 ng/g dry feces for Boo (Figure 2a), 14.765 ± 1.980 ng/g for Mike (Figure 2b), and 17.140 ± 2.580 ng/g for Thor (Figure 2c). Log(FGM) concentrations did not vary significantly among the three bears in a one-way ANOVA (F2,72 = 0.559, p = 0.574).
Mean concentrations of 8-OHdG in the temporary habitat were 56.947 ± 6.231 ng/g dry feces for Boo, 97.474 ± 9.889 ng/g for Mike, and 79.234 ± 11.243 ng/g for Thor. In a one-way ANOVA, log(8-OHdG) varied significantly among the bears (F2,72 = 4.808, p = 0.011). Post-hoc tests revealed that log(8-OHdG) varied significantly between Boo and Mike (mean difference = −0.220 ± 0.071, p = 0.012). Pairwise comparisons between Boo and Thor, as well as between Mike and Thor, were non-significant. Concentrations of log(FGM) and log(8-OHdG) were significantly correlated (Figure 2a–c and Figure 3) across all bears and individually for Boo, Mike, and Thor (Table 3).

3.3. Behavioral Comparisons with Physiological Measures

The overall percent of time (mean ± SE) engaged in active behaviors in the small habitat was 86.099 ± 4.573 for Boo, 73.459 ± 5.426 for Mike, and 65.597 ± 5.700 for Thor. The difference among the bears was significant in a one-way ANOVA (F2,57 = 3.543, p = 0.035). Post-hoc tests showed that this difference was significant only between Boo and Thor (mean difference = 20.503 ± 7.308, p = 0.023). For the bears as a group, log(FGM) concentrations were higher when they spent a greater percentage of time engaged in active behaviors (Table 3). This relationship was not significant at the individual level for any of the bears, although it came close for Mike. Log(FGM) concentrations were also higher for Boo on days when the mean temperature was higher.
All the bears engaged in positive social interactions at a similar rate. Unadjusted rates of affiliative social interactions (mean ± SE) were 0.115 ± 0.025 events per min for Boo, 0.196 ± 0.058 for Mike, and 0.112 ± 0.033 for Thor. Log-transformed affiliative rates did not vary significantly among the bears in a one-way ANOVA (F2,57 = 1.180, p = 0.315) and were not correlated with log(FGM) concentrations (Table 3). Unadjusted rates of social play were 0.098 ± 0.024 events per min for Boo, 0.128 ± 0.032 for Mike, and 0.110 ± 0.033 for Thor, and log-transformed rates also did not vary among them in a one-way ANOVA (F2,57 = 0.195, p = 0.823). Rates of agonistic social behaviors were low overall and were allocated evenly among the bears, occurring at an untransformed rate per min of 0.014 ± 0.010 for Boo, 0.021 ± 0.008 for Mike, and 0.029 ± 0.010 for Thor. Individual differences in log-transformed rates of agonistic interactions were non-significant in a one-way ANOVA (F2,57 = 0.657, p = 0.522) and were also not correlated with log(FGM) (Table 3). Log-transformed FGM concentrations were also not correlated with daily caretaker records of Mike’s mobility (ρ = 0.166, p = 0.355, n = 33).
For the bears as a group, log(8-OHdG) concentrations were significantly higher on warmer days (Table 3). Temperature was positively correlated with log(8-OHdG) for Mike, and there was a nearly significant trend for Mike’s log(8-OHdG) to increase with log-transformed rates of affiliative interactions. There was a slight trend for Boo to have lower log(8-OHdG) on days with more positive social interactions, and there was no relationship between these two variables for Thor (Table 3; Figure 4). Neither the log(rate) of social play nor the log(rate) of agonistic interactions was correlated with log(8-OHdG) for any bears. The percent of time active also was not correlated with log(8-OHdG) for any bears, although Thor did show a trend towards a positive relationship (Table 3). The relationship between Mike’s mobility score and log(8-OHdG) was also non-significant (ρ = 0.090, p = 0.618, n = 33).

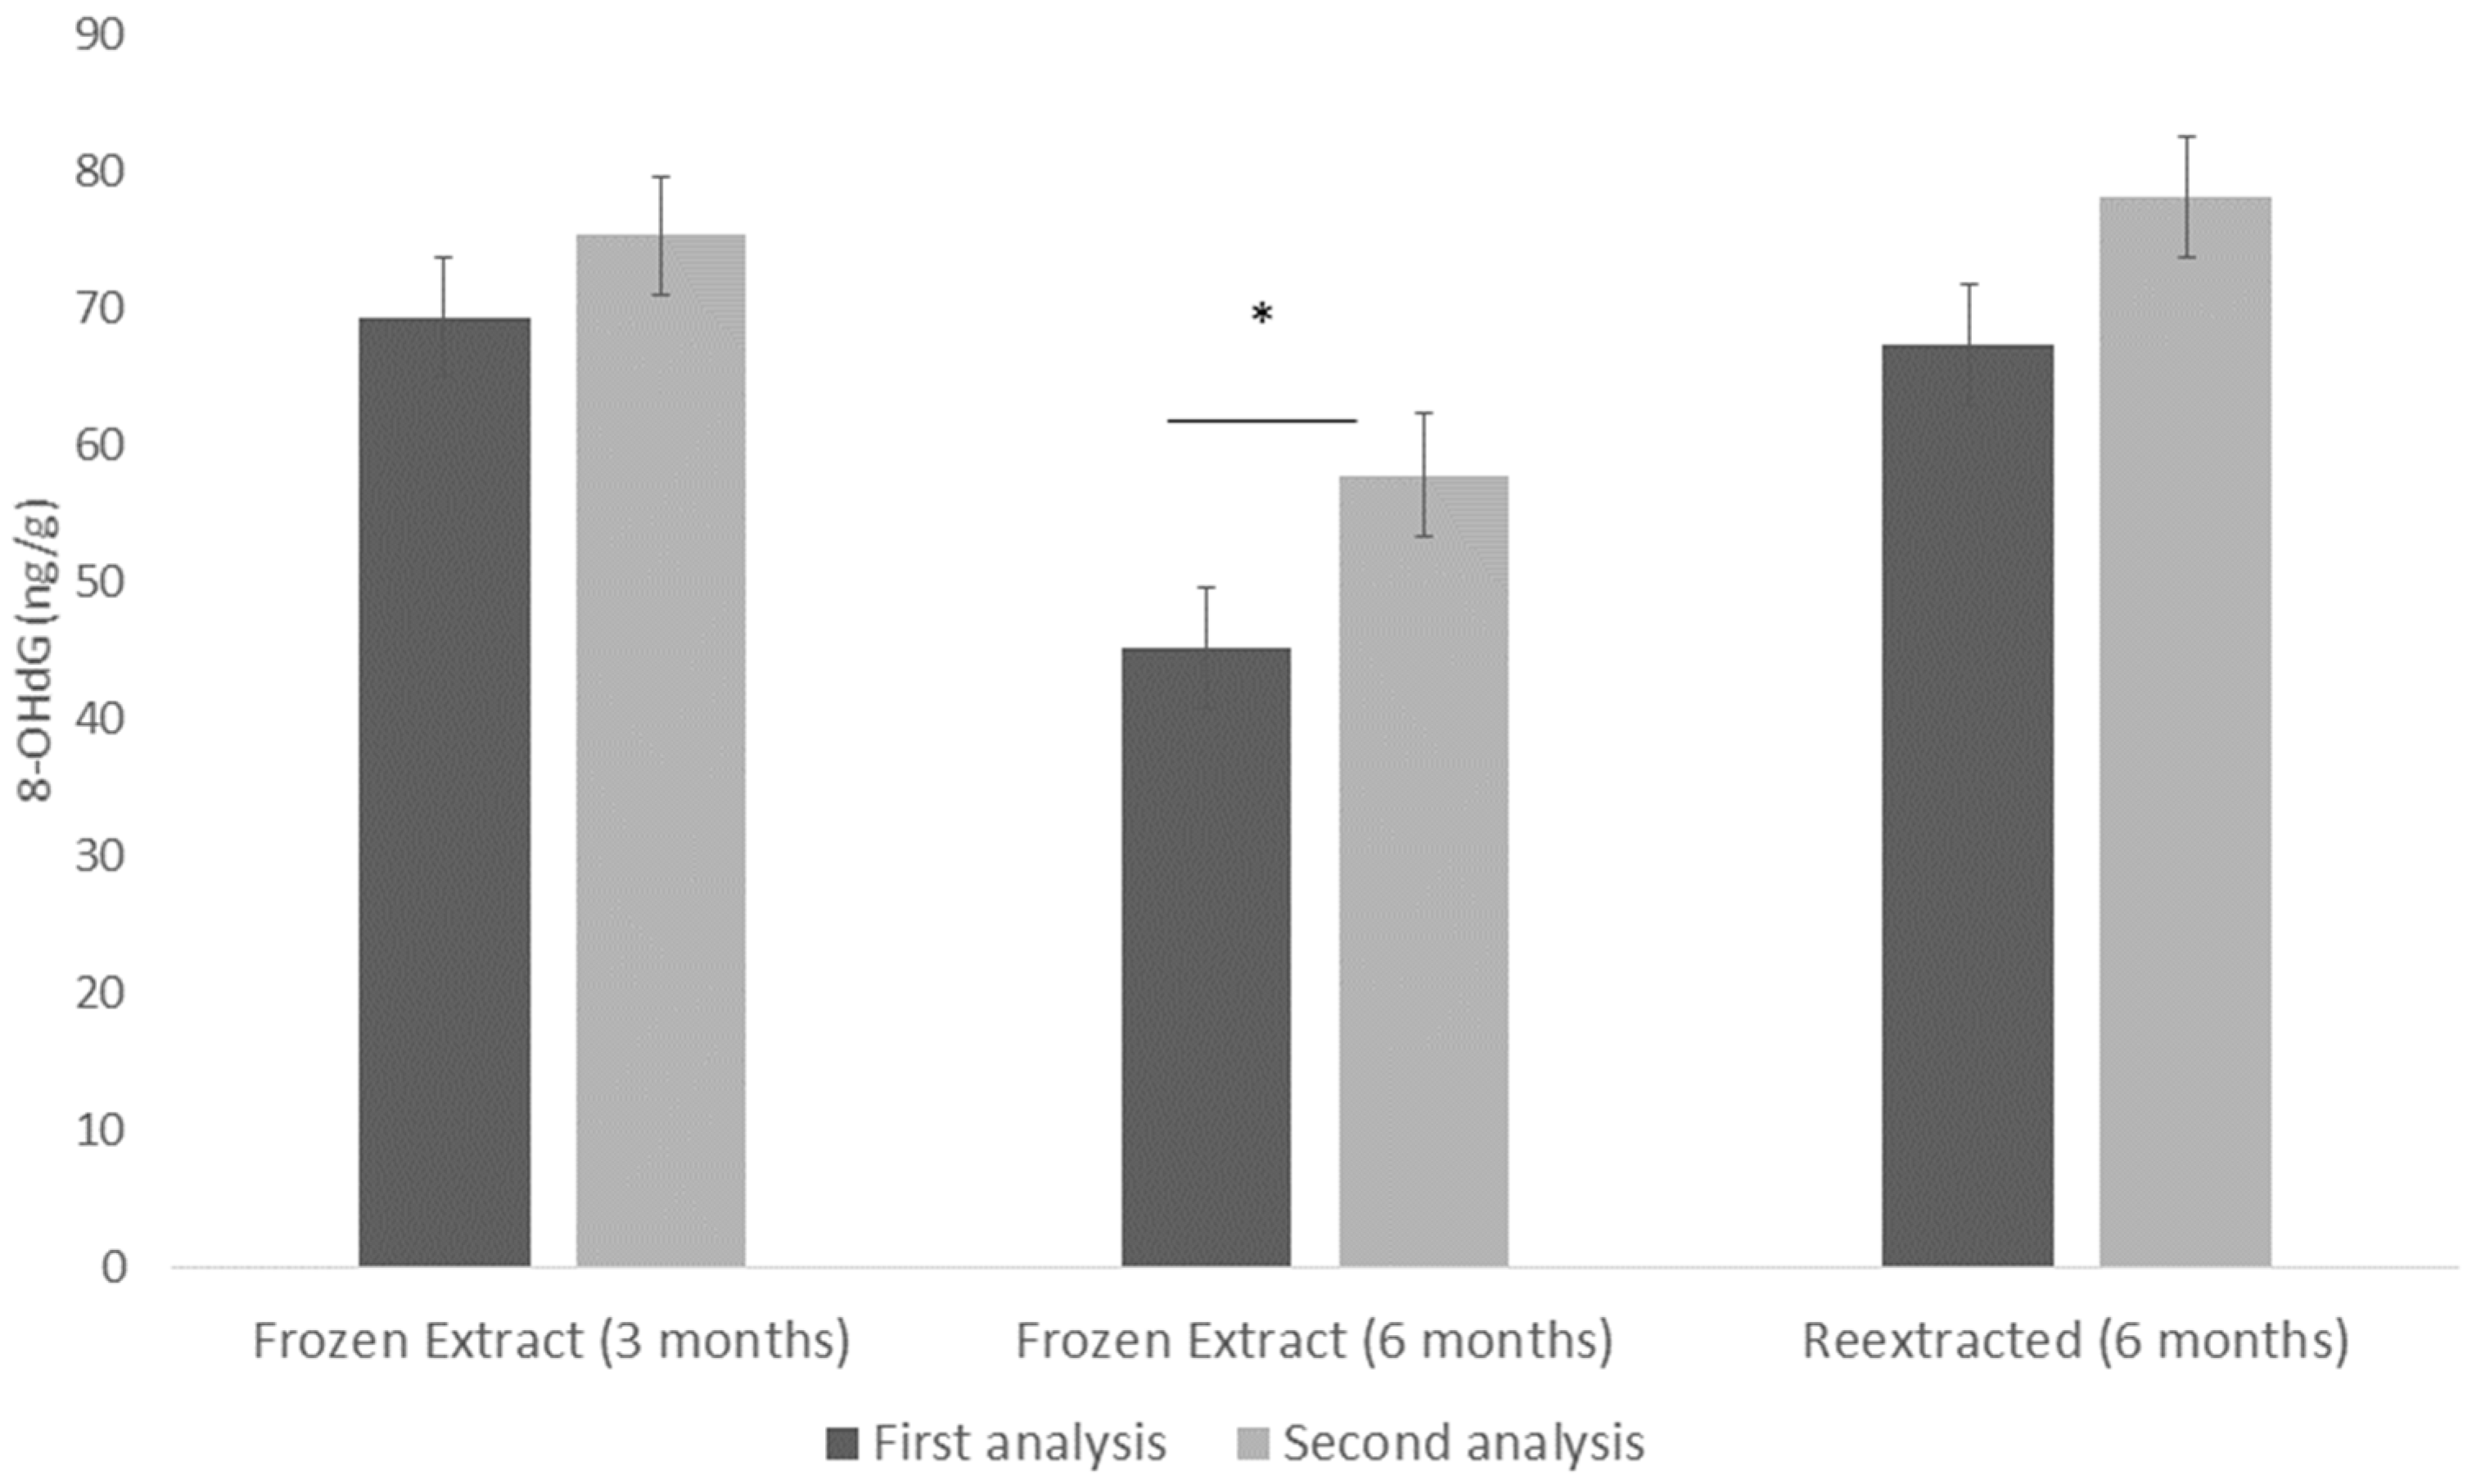
3.4. Assay Validation Tests

Exposing a fresh fecal sample to outdoor conditions under bright sunlight at 32.2 °C led to reductions in measured concentrations of 8-OHdG. After two hours, the sample concentration decreased by 28.400%, from 79.289 ng/g dry feces to 56.771 ng/g. After four hours, the concentration had decreased by 36.971%, to 49.975 ng/g. Finally, after six hours, the sample concentration had decreased by 40.805% to 46.935 ng/g.
The next set of tests compared samples under three storage conditions and lengths (Figure 5). There was no significant difference in the measured concentrations of n = 4 samples after the original sample extract was stored at −20 °C for three months (t3 = −0.957, p = 0.409), but after six months under the same conditions, the measured concentration in n = 4 samples increased significantly (t3 = −4.523, p = 0.020). For n = 3 samples that were re-extracted and analyzed after the dried fecal powder was stored at −20 °C for three months, measured concentrations increased close to, but did not reach, a significant level (t2 = −3.245, p = 0.083).

4. Discussion

4.1. Summary

We examined the correspondence between an established (but sometimes difficult to interpret) physiological marker of animal welfare, FGMs, and a new potential non-invasive marker, fecal 8-OHdG, while three male grizzly bears temporarily occupied a smaller space. In that space, the bears exhibited a marked increase in their rates of positive social interactions (affiliative behavior and play), suggesting that they may have been using social support to cope with the challenges of their temporary living conditions. Our results showed a strong correspondence between daily values of FGMs and 8-OHdG, which is consistent with the hypothesis that adrenal activity contributes to oxidative stress and subsequent DNA damage. We also saw a trend for 8-OHdG to increase with rates of affiliative interactions in one bear, while there was a decreasing trend for another. The relationship between 8-OHdG and behavior should be interpreted with caution due to the small sample size employed in this study. These results could reflect individual differences related to health, dominance and personality, or perception of social interactions as a stressor. These findings, as well as preliminary laboratory validation tests, suggest that 8-OHdG has links to animal welfare that may be promising to explore, but further investigations are necessary to unravel its implications.

4.2. Behavioral Patterns in the Three Habitats

The patterns of social behavior we observed among the grizzly bears in their three different habitats were striking. In spite of the large reduction in space available to them during the construction process, rates of agonistic interactions among the bears did not change in the temporary habitat relative to both their original and expanded habitats. Similarly, Montaudouin and Pape [34] observed brown bears (Ursus arctos) across 28 European zoos and did not find a relationship between enclosure design and agonistic behavior in the groups they observed. They found agonistic behavior was more common in groups with three or more bears, but they did not link group size and enclosure size to form an overall metric of social density [34].
In this study, agonistic behaviors did not change in the temporary habitat, but the bears engaged in significantly more positive social interactions while they lived there, including frequent social play and other affiliative interactions. These trends are very consistent with the tension-reduction model [24], and the lack of an increase in agonistic behavior in the temporary habitat suggests this coping strategy was effective.

4.3. Relationships between Physiological and Behavioral Indicators of Welfare

Each of the three bears showed a strong positive correlation linking increases in fecal 8-OHdG concentrations to elevated FGMs. This relationship is consistent with the metabolic role of glucocorticoids, as is the positive relationship we found between FGM concentrations and the percent of time engaged in active behaviors for the group. Metabolic activity is also the primary source of ROS, and increasing metabolic activity is the mechanism by which glucocorticoids likely contribute to oxidative stress [38]. Studies in nonhuman animals confirm that oxidative stress increases after physical activity. For example, high-intensity exercise causes rapid increases in markers of oxidative stress in domestic horses (Equus ferus caballaus) [39], and activity levels were correlated with DNA damage in captive budgerigars [19]. However, we did not find a relationship between overall activity levels and 8-OHdG in this study. This relationship did trend towards significance for Thor, who was also the least active of the three bears. Our definition of active behaviors included relatively low-energy activities such as eating or grooming. Perhaps relationships between FGMs, 8-OHdG, and activity levels would have been clearer had we employed a more rigorous measure of physical exertion.
Given the abundance of evidence linking adrenal activity to aggressive behavior in other animals [40], it is surprising that the bears showed no statistical relationship between agonistic behavior and either FGM or 8-OHdG concentrations. However, in contrast to our overall results, Mike showed the largest spike in both FGMs and 8-OHdG the day after animal care staff reported that he and Thor had been regularly in conflict for a few days while indoors. Perhaps this extended period of conflict was detectable in our integrated fecal measure, while the typically brief agonistic encounters we observed in the habitat were not. Unfortunately, we do not have samples from Thor during this time, but the data from Mike do provide some biological validation for our FGM assay. Overall, relationships between behavior and adrenal activity are not well-studied in captive bears. One case study did not find an expected increase in FGMs for a female Himalayan black bear (Ursus thibetanus laniger) following agonistic interactions with a male [41], suggesting that for bears, the relationship between agonistic interactions and FGMs may need further research. Other factors to consider are the relatively low rates of agonistic behavior seen in the current data and the effects of this on the statistical power of the analysis, as well as the relatively low stakes of these conflicts for three related individuals who have lived together for their entire lives.
Given the limited number of available social partners, it is unsurprising that rates of agonistic, affiliative, and social play behaviors did not vary statistically among the bears. It is also unclear why affiliative behavior was linked to 8-OHdG while social play was not; perhaps, it was because affiliative behavior was more frequent. Each bear expressed a different relationship between affiliative behavior and 8-OHdG. For Mike, there was a trend to have higher 8-OHdG on days when he engaged in higher rates of affiliative behavior, while higher affiliative behavior rates were associated with lower 8-OHdG for Boo and showed no relationship for Thor. These three different patterns reflect one weakness of this study, the small sample size, and these statistical trends are intriguing but preliminary. Still, potential explanations for these individual differences in 8-OHdG related to affiliative behavior may reveal hypotheses for future investigations.
The different relationships between affiliative interactions and 8-OHdG for Boo and Mike may parallel their dominance relationships. Studies in wild mandrills (Mandrillus sphinx) [42] and cichlid fish (Astatotilapia burtoni) have both linked dominance status to oxidative physiology [43]. Animal care staff generally regard Mike as the least dominant individual in the group, and he is often the odd man out in social interactions. Perhaps even positive social interactions were a source of stress for Mike, and the greater DNA damage he incurred reflects a biological cost of maintaining harmony under greater conditions of social density for a subordinate individual. There could also be a relationship between diet, dominance, and DNA damage. When wild brown bears aggregate, larger, dominant individuals tend to displace others aggressively and gain access to more salmon as a result [29]. As the least dominant bear, Mike could have reduced access to preferred food items, and dietary antioxidant levels can also impact the oxidative stress response [44]. Interestingly, the most dominant individual, Boo, had the lowest overall average 8-OHdG concentrations, which were significantly lower than Mike’s. Although animal care staff have not reported changes in these dominance relationships over time, the connection between dominance and DNA damage is speculative given that we did not systematically assess dominance over the course of the study.
Differences in their physiological responses to environmental stressors and affiliative interactions may also be related to individual personalities or coping styles [45]. Costantini et al. [46] found that changes in oxidative status related to restraint in Alpine marmots (Marmota marmota) depended on the coping styles of the individual marmots, as measured during an open field test [46]. Personality also significantly impacted baseline oxidative status in strains of mice (Mus musculus) bred to exhibit different levels of aggression [47]. Additionally, Mike had chronic bouts of lameness, which is associated with oxidative stress in dairy cows [48]. Any of these factors could have interacted with Mike’s social position or unique personality to render him more susceptible to oxidative stress under challenging conditions.
The relationship between social behavior and 8-OHdG in this study is fascinating but difficult to interpret due to the multiple competing explanations for the results. Had we been able to analyze samples from all three habitats for 8-OHdG, perhaps these relationships would have been clearer. However, we were reluctant to do so without knowing more about the stability of 8-OHdG in freezer storage, introducing time as a potential confound in our interpretations. Alternatively, measuring an indicator even further downstream might provide clarification. Techniques for measuring DNA damage typically employ oxidized guanine and related molecules as their targets, because guanine bases are particularly susceptible to oxidation [13]. Telomeres, which are the guanine-rich ends of chromosomes, shorten with every cell division and at higher rates under oxidative stress [49]. Rates of telomere attrition are both predictive of a species’ lifespan [50] and are accelerated in organisms exposed to repeated and/or intense environmental stressors [51]. The cumulative effects of stress on telomere attrition led Bateson [52] to identify this measure as the potential “holy grail” of animal welfare indicators. Telomere attrition has shown promise in recent studies exploring welfare-related questions; for example, African grey parrots (Psittacus erithacus erithacus), a highly social species, have significantly shorter telomeres when housed alone than with conspecifics [53]. The relationships between adrenal activity, oxidative stress, and telomere attrition may prove to be illuminating about the biological costs accrued by animals due to life challenges—following further validation.

4.4. Origins and Measurement of Fecal 8-OHdG

The results of the present study are intriguing but should be interpreted with caution due to a variety of questions that will require further validation studies. First of all, it is important to establish the source of the oxidized DNA detected in this study. Because cell replication and death are ongoing processes, early researchers cautioned that the presence of DNA lesions in urine could be due to these processes rather than oxidative stress. However, numerous studies have since confirmed that the lesions result from oxidative damage [54].
Given the fecal matrix employed, it is also reasonable to question if the DNA lesions were from the grizzly bears themselves or the food they consumed. Studies comparing normal dietary intake to a nucleic acid-free diet in humans [55] and mice [56] have indicated that dietary composition does not affect levels of urinary DNA damage. Although, to our knowledge, there are no diet comparison studies utilizing fecal samples, Bogdanov et al. [57] found that DNA lesions in food are destroyed under laboratory conditions mimicking digestion. Other studies utilizing ingested radiolabeled DNA have found evidence for excretion in feces, suggesting there is still reason to be cautious, and that there may be interspecific differences in excretion pathways [54].
We assert that the strong relationship we observed between longitudinal profiles of FGMs and 8-OHdG provide some (albeit circumstantial) evidence that the DNA lesions we measured came from the grizzly bears, rather than their diet. However, the exact origin of the DNA lesions remains an open question. Kato et al. [58] reviewed potential fecal biomarkers for colorectal cancer, including 8-OHdG, and concluded that the most likely source of DNA measured in these assays is endothelial cells exfoliated from the gastrointestinal (GI) tract during the digestion process. However, this raises further questions. The effects of glucocorticoids on oxidative stress vary in different tissues [12], and Wilson et al. [59] also found that levels of superoxide dismutase, an antioxidant enzyme, in grizzly bear skin varied based on the location on the body they sampled. Thus, we do not know if the 8-OHdG concentrations we measured were specific to the GI system or reflect physiological processes on a broader level in the bears. Although we found no evidence that the bears experienced GI distress during this time, gut health is another factor that would presumably influence concentrations of 8-OHdG in intestinal cells [58]. A related issue is the time course of these lesions and whether they represent an integrated measure like FGMs, or they reflect DNA damage accrued as the feces pass through the lower digestive tract over a shorter period.
Diet could also have affected levels of DNA damage by modulating antioxidant capacity. Grizzly bears are omnivorous, with diets that vary drastically by season [60], and diet is known to exert a strong influence on grizzly FGMs [61]. In this study, the period while the grizzly bears occupied the smaller habitat was relatively brief but coincided with a reported increase in the variety of produce in their primary diet. However, we saw no evidence that either FGMs or 8-OHdG changed drastically around this time, and it is not clear how meaningful the diet change really was compared to the great variety of foods the bears already received. Antioxidants that can neutralize DNA damage are both developed endogenously and acquired through food [62], so ideally, studies should control for the effects of diet.
Finally, there are still issues related to sample collection and storage to consider. Environmental factors such as temperature and precipitation are known to affect grizzly bear FGMs [63], and both FGMs and 8-OHdG showed some relationships with temperature in this study. Interestingly, both FGM and 8-OHdG concentrations were higher on warmer days, while our validation study showed that 8-OHdG concentrations decreased by half after a sample was exposed to a very warm, sunny day for six hours. Therefore, it is not clear if these relationships are artifacts of sample collection or reflect responses to thermal conditions in the bears. Additionally, we would also like to offer a word of caution regarding the use of fecal markers in such research. We took pains during the homogenizing and weighing process to remove all the glitter from the dried fecal samples. These efforts were warranted, because when we extracted a small mass of glitter using our fecal extraction process and then analyzed it, the EIA showed low but detectable values for 8-OHdG. For this reason, we would recommend against using food dye or any type of marker for sample identification that cannot be removed prior to analysis.
Although exposure to the elements resulted in decreased concentrations of 8-OHdG in our study, measured concentrations tended to increase over time in fecal extracts and dry feces stored at −20 °C. Similarly, Gormally et al. [20] found that freezing blood samples, even for a few weeks, increased DNA damage. All of the samples we analyzed were collected within a few weeks of each other, and thus we believe that sample storage likely had a minimal effect, if any, on our results. However, this is yet another area where further validation research is needed.

5. Conclusions

The crux of oxidant physiology is maintaining a balance between reactive oxygen species and the antioxidants that neutralize them. The factors that affect this balance include (but are not limited to) nutrition, health, coping style, personality, and environmental stress [64]. Our data add to the body of evidence suggesting that the oxidative balancing act has meaningful parallels to how animal welfare is shaped by the net effects of positive and negative factors experienced across different domains. Similarly to telomere attrition [52], markers of oxidative stress seem to take into account both environmental insults and the organism’s ability to cope with them. The sum of these factors may add up to a biological cost that is ultimately reflected in physiological aging, health, reproductive output, survival, and perhaps animal welfare.
The results of this preliminary study in one group of bears should not be overstated or generalized to other captive groups. Ultimately, it is unclear whether the idiosyncratic findings of this study are a result of the small sample size, the complexity of various factors shaping individual oxidative physiology, or methodological issues related to measuring DNA damage in feces. Thus, we are unable to confidently validate DNA damage as an indicator of welfare on the basis of these results. However, we hope that this investigation inspires others to explore relationships between oxidative stress and animal welfare, and to conduct the validation studies that are strongly needed to employ these techniques non-invasively in wildlife. There is much still to learn, but there is reason to believe that measures of oxidative stress such as 8-OHdG could be a useful addition to the animal welfare scientist’s toolkit.

Supplementary Materials

The following are available online at https://0-www-mdpi-com.brum.beds.ac.uk/article/10.3390/jzbg2030022/s1, Table S1: Ethogram of grizzly bear behaviors, Figure S1: Grizzly bear activity budget in the temporary habitat.

Author Contributions

Conceptualization, S.A., J.H. and G.F.; methodology, J.H., S.A., and G.F.; assay validation and laboratory analysis, G.F.; formal analysis, G.F. and J.H.; investigation, J.H., S.A. and G.F.; data curation, J.H.; writing—original draft preparation, G.F.; writing—review and editing, G.F., J.H. and S.A.; visualization, G.F. and J.H.; supervision, S.A.; project administration, S.A., J.H., and G.F. All authors have read and agreed to the published version of the manuscript.

Funding

This research received no external funding.

Institutional Review Board Statement

The study was conducted according to the guidelines of the Declaration of Helsinki, and approved by the Animal Welfare and Management Committee of the DETROIT ZOOLOGICAL SOCIETY on 6 September 2017.

Informed Consent Statement

Not applicable.

Data Availability Statement

The data presented in this study are available on request from the corresponding author. The data are not publicly available due to other manuscripts in preparation.

Acknowledgments

The authors would like to thank Florence Yates, Charlie Kolodziejski, Mary Wulff, Betsie Meister, and Elizabeth Arbaugh for facilitating the study at the Detroit Zoological Society. We are also grateful to Emily Bovee for her assistance with validation experiments and Kylen Gartland for her input on data analysis. We also thank Deb Kingsbury, Mary Haga, Dennis Pelkey, and Danielle Durham for their assistance processing laboratory samples; and Leigh Walker for assisting with observational data collection.

Conflicts of Interest

The authors declare no conflict of interest.

References

  1. AZA. Association of Zoos and Aquariums, Animal Welfare Committee’s Definition of Animal Welfare. Available online: https://www.aza.org/animal_welfare_committee?locale=en (accessed on 1 February 2021).
  2. Mellor, D.J.; Beausoleil, N.J.; Littlewood, K.E.; McLean, A.N.; McGreevy, P.D.; Jones, B.; Wilkins, C. The 2020 Five Domains Model: Including Human–Animal Interactions in Assessments of Animal Welfare. Animals 2020, 10, 1870. [Google Scholar] [CrossRef]
  3. Binding, S.; Farmer, H.; Krusin, L.; Cronin, K. Status of Animal Welfare Research in Zoos and Aquariums: Where are we, Where to next? J. Zoo Aquar. Res. 2020, 8, 166–174. [Google Scholar]
  4. Mason, G.; Mendl, M. Why Is There No Simple Way of Measuring Animal Welfare? Anim. Welf. 1993, 2, 301–319. [Google Scholar]
  5. MacDougall-Shackleton, S.A.; Bonier, F.; Romero, L.M.; Moore, I.T. Glucocorticoids and “Stress” Are Not Synonymous. Integr. Org. Biol. 2019, 1, obz017. [Google Scholar] [CrossRef] [PubMed] [Green Version]
  6. Wielebnowski, N. Stress and Distress: Evaluating Their Impact for the Well-being of Zoo Animals. J. Am. Vet. Med Assoc. 2003, 223, 973–977. [Google Scholar] [CrossRef]
  7. Morgan, K.N.; Tromborg, C.T. Sources of stress in captivity. Appl. Anim. Behav. Sci. 2007, 102, 262–302. [Google Scholar] [CrossRef]
  8. Ralph, C.; Tilbrook, A.J. Invited Review: The Usefulness of Measuring Glucocorticoids for Assessing Animal Welfare. J. Anim. Sci. 2016, 94. [Google Scholar] [CrossRef] [Green Version]
  9. Mormede, P.; Andanson, S.; Auperin, B.; Beerda, B.; Guemene, D.; Malmkvist, J.; Manteca, X.; Manteuffel, G.; Prunet, P.; van Reenen, C.G.; et al. Exploration of the Hypothalamic-Pituitary-Adrenal Function as a Tool to Evaluate Animal Welfare. Physiol. Behav. 2007, 92, 317–339. [Google Scholar] [CrossRef]
  10. Bateson, M.; Poirier, C. Can biomarkers of biological age be used to assess cumulative lifetime experience? Anim. Welf. 2019, 28, 41–56. [Google Scholar] [CrossRef] [Green Version]
  11. Costantini, D. Oxidative Stress in Ecology and Evolution: Lessons from Avian Studies. Ecol. Lett. 2008, 11, 1238–1251. [Google Scholar] [CrossRef]
  12. Costantini, D.; Marasco, V.; Moller, A.P. A Meta-Analysis of Glucocorticoids as Modulators of Oxidative Stress in Vertebrates. J. Comp. Physiol. B 2011, 181, 447–456. [Google Scholar] [CrossRef]
  13. Olinski, R.; Gackowski, D.; Rozalski, R.; Foksinski, M.; Bialkowski, K. Oxidative DNA Damage in Cancer Patients: A Cause or a Consequence of the Disease Development? Mutat. Res. Fundam. Mol. Mech. Mutagenesis 2003, 531, 177–190. [Google Scholar] [CrossRef] [PubMed]
  14. Czarny, P.; Wigner, P.; Galecki, P.; Sliwinski, T. The Interplay between Inflammation, Oxidative Stress, DNA Damage, DNA Repair and Mitochondrial Dysfunction in Depression. Prog. Neuro Psychopharmacol. Biol. Psychiatry 2018, 80, 309–321. [Google Scholar] [CrossRef] [PubMed]
  15. Jorgensen, A.; Broedbaek, K.; Fink-Jensen, A.; Knorr, U.; Greisen Soendergaard, M.; Henriksen, T.; Weimann, A.; Jepsen, P.; Lykkesfeldt, J.; Poulsen, H.E.; et al. Increased Systemic Oxidatively Generated DNA and RNA Damage in Schizophrenia. Psychiatry Res. 2013, 209, 417–423. [Google Scholar] [CrossRef] [PubMed] [Green Version]
  16. Zanolin, M.E.; Girardi, P.; Degan, P.; Rava, M.; Olivieri, M.; Di Gennaro, G.; Nicolis, M.; De Marco, R. Measurement of a Urinary Marker (8-hydroxydeoxyGuanosine, 8-OHdG) of DNA Oxidative Stress in Epidemiological Surveys: A Pilot Study. Int. J. Biol. Markers 2015, 30, 341–345. [Google Scholar] [CrossRef]
  17. Irie, M.; Tamae, K.; Iwamoto-Tanaka, N.; Kasai, H. Occupational and Lifestyle Factors and Urinary 8-hydroxydeoxyguanosine. Cancer Sci. 2005, 96, 600–606. [Google Scholar] [CrossRef] [PubMed]
  18. Beaulieu, M.; Thierry, A.-M.; González-Acuña, D.; Polito, M.J. Integrating Oxidative Ecology into Conservation Physiology. Conserv. Physiol. 2013, 1, cot004. [Google Scholar] [CrossRef] [PubMed] [Green Version]
  19. Larcombe, S.D.; Tregaskes, C.A.; Coffey, J.; Stevenson, A.E.; Alexander, L.G.; Arnold, K.E. Oxidative Stress, Activity Behaviour and Body Mass in Captive Parrots. Conserv. Physiol. 2015, 3. [Google Scholar] [CrossRef] [Green Version]
  20. Gormally, B.M.G.; Estrada, R.; McVey, M.; Romero, L.M. Beyond Corticosterone: The Acute Stress Response Increases DNA Damage in House Sparrows. J. Exp. Zool. Part A Ecol. Integr. Physiol. 2020, 1–12. [Google Scholar] [CrossRef]
  21. Stier, A.; Schull, Q.; Bize, P.; Lefol, E.; Haussmann, M.; Roussel, D.; Robin, J.-P.; Viblanc, V.A. Oxidative Stress and Mitochondrial Responses to Stress Exposure Suggest that King Penguins are Naturally Equipped to Resist Stress. Sci. Rep. 2019, 9, 8545. [Google Scholar] [CrossRef] [Green Version]
  22. Jakob-Hoff, R.; Kingan, M.; Fenemore, C.; Schmid, G.; Cockrem, J.F.; Crackle, A.; Van Bemmel, E.; Connor, R.; Descovich, K. Potential Impact of Construction Noise on Selected Zoo Animals. Animals 2019, 9, 504. [Google Scholar] [CrossRef] [PubMed] [Green Version]
  23. de Waal, F.; Aureli, F.; Judge, P. Coping with Crowding. Sci. Am. 2000, 282, 76–81. [Google Scholar] [CrossRef]
  24. Cordoni, G.; Palagi, E. Response of Captive Lowland Gorillas (Gorilla gorilla gorilla) to Different Housing Conditions: Testing the Aggression-Density and Coping Models. J. Comp. Psychol. 2007, 121, 171–180. [Google Scholar] [CrossRef]
  25. Taylor, S.E. Tend and Befriend: Biobehavioral Bases of Affiliation under Stress. Curr. Dir. Psychol. Sci. 2006, 15, 273–277. [Google Scholar] [CrossRef]
  26. Stanic, D.; Plecas-Solarovic, B.; Petrovic, J.; Bogavac-Stanojevic, N.; Sopic, M.; Kotur-Stevuljevic, J.; Ignjatovic, S.; Pesic, V. Hydrogen Peroxide-Induced Oxidative Damage in Peripheral Blood Lymphocytes from Rats Chronically Treated with Corticosterone: The Protective Effect of Oxytocin Treatment. Chem. Biol. Interact. 2016, 256, 134–141. [Google Scholar] [CrossRef] [PubMed]
  27. Mittermeier, R.A.; Wilson, D.E. Handbook of the Mammals of the World: Carnivores; Lynx Ediciones: Barcelona, Spain, 2009. [Google Scholar]
  28. Smith, T.S.; Herrero, S.; DeBruyn, T.D. Alaskan Brown Bears, Humans, and Habituation. Ursus 2005, 16, 1–10. [Google Scholar] [CrossRef]
  29. Gende, S.M.; Quinn, T.P. The Relative Importance of Prey Density and Social Dominance in Determining Energy Intake by Bears Feeding on Pacific Salmon. Can. J. Zool. 2004, 82, 75–85. [Google Scholar] [CrossRef]
  30. BearTAG. Association of Zoos and Aquariums Bear Taxon Advisory Group Regional Collection Plan. Available online: https://ams.aza.org/iweb/upload/RCP_Bear2016-0f78e49b.pdf (accessed on 6 April 2021).
  31. BearTAG. Association of Zoos and Aquariums Bear Taxon Advisory Group Annual Report. Available online: https://ams.aza.org/eweb/upload/Bear%20TAG%20Annual%20Report%202019-75c53476.pdf (accessed on 6 April 2021).
  32. Whitham, J.C.; Wielebnowski, N. New Directions for Zoo Animal Welfare Science. Appl. Anim. Behav. Sci. 2013, 147, 247–260. [Google Scholar] [CrossRef]
  33. Altmann, J. Observational Study of Behavior: Sampling Methods. Behaviour 1974, 48, 227–265. [Google Scholar] [CrossRef] [Green Version]
  34. Montaudouin, S.; Pape, G.L. Comparison between 28 Zoological Parks: Stereotypic and Social Behaviours of Captive Brown Bears (Ursus arctos). Appl. Anim. Behav. Sci. 2005, 92, 129–141. [Google Scholar] [CrossRef]
  35. Ross, M.R.; Niemann, T.; Wark, J.D.; Heintz, M.R.; Horrigan, A.; Cronin, K.A.; Shender, M.A.; Gillespie, K. ZooMonitor (Version 3). 2016. Available online: http://zoomonitor.org (accessed on 6 April 2021).
  36. Fuller, G.; Margulis, S.W.; Santymire, R. The Effectiveness of Indigestible Markers for Identifying Individual Animal Feces and Their Prevalence of Use in North American Zoos. Zoo Biol. 2011, 30, 379–398. [Google Scholar] [CrossRef]
  37. Palme, R.; Touma, C.; Arias, N.; Dominchin, M.F.; Lepschy, M. Steroid extraction: Get the best out of faecal samples. Wien. Tierarztl. Mon. 2013, 100, 238–246. [Google Scholar]
  38. Bjelakovic, G.; Beninati, S.; Pavlovic, D.; Kocic, G.; Jevtovic, T.; Kamenov, B.; Saranac, L.J.; Bjelakovic, B.; Stojanovic, I.; Basic, J. Glucocorticoids and Oxidative Stress. J. Basic Clin. Physiol. Pharmacol. 2007, 18, 115–127. [Google Scholar] [CrossRef]
  39. MacNicol, J.L.; Lindinger, M.I.; Pearson, W. A Time Course Evaluation of Inflammatory and Oxidative Markers Following High Intensity Exercise in Horses: A Pilot Study. J. Appl. Physiol. 2018, 124, 860–865. [Google Scholar] [CrossRef] [PubMed]
  40. Tamashiro, K.L.K.; Nguyen, M.M.N.; Sakai, R.R. Social Stress: From Rodents to Primates. Front. Neuroendocrinol. 2005, 26, 27–40. [Google Scholar] [CrossRef] [PubMed]
  41. Young, K.; Walker, S.; Lanthier, C.; Waddell, W.; Monfort, S.; Brown, J. Noninvasive Monitoring of Adrenocortical Activity in Carnivores by Fecal Glucocorticoid Analyses. Gen. Comp. Endocrinol. 2004, 137, 148–165. [Google Scholar] [CrossRef] [PubMed]
  42. Beaulieu, M.; Mboumba, S.; Willaume, E.; Kappeler, P.M.; Charpentier, M.J.E. The Oxidative Cost of Unstable Social Dominance. J. Exp. Biol. 2014, 217, 2629. [Google Scholar] [CrossRef] [Green Version]
  43. Fialkowski, R.; Aufdemberge, P.; Wright, V.; Dijkstra, P. Radical change: Temporal patterns of oxidative stress during social ascent in a dominance hierarchy. Behav. Ecol. Sociobiol. 2021, 75, 43. [Google Scholar] [CrossRef]
  44. Kashif, S.M.; Zaidi, R.; Al-Qirim, T.M.; Hoda, N.; Banu, N. Modulation of Restraint Stress Induced Oxidative Changes in Rats by Antioxidant Vitamins. J. Nutr. Biochem. 2003, 14, 633–636. [Google Scholar] [CrossRef]
  45. Koolhaas, J.M.; Korte, S.M.; De Boer, S.F.; Van Der Vegt, B.J.; Van Reenen, C.G.; Hopster, H.; De Jong, I.C.; Ruis, M.A.W.; Blokhuis, H.J. Coping Styles in Animals: Current Status in Behavior and Stress Physiology. Neurosci. Biobehav. Rev. 1999, 23, 925–935. [Google Scholar] [CrossRef]
  46. Costantini, D.; Ferrari, C.; Pasquaretta, C.; Cavallone, E.; Carere, C.; von Hardenberg, A.; Réale, D. Interplay Between Plasma Oxidative Status, Cortisol and Coping Styles in Wild Alpine Marmots, Marmota marmota. J. Exp. Biol. 2012, 215, 374. [Google Scholar] [CrossRef] [PubMed] [Green Version]
  47. Costantini, D.; Carere, C.; Caramaschi, D.; Koolhaas, J.M. Aggressive and Non-Aggressive Personalities Differ in Oxidative Status in Selected Lines of Mice (Mus musculus). Biol. Lett. 2008, 4, 119. [Google Scholar] [CrossRef] [Green Version]
  48. Herzberg, D.; Strobel, P.; Chihuailaf, R.; Ramirez-Reveco, A.; Müller, H.; Werner, M.; Bustamante, H. Spinal Reactive Oxygen Species and Oxidative Damage Mediate Chronic Pain in Lame Dairy Cows. Animals 2019, 9, 693. [Google Scholar] [CrossRef] [Green Version]
  49. Von Zglinicki, T. Role of Oxidative Stress in Telomere Length Regulation and Replicative Senescence. Ann. N. Y. Acad. Sci. 2000, 908, 99–110. [Google Scholar] [CrossRef]
  50. Whittemore, K.; Vera, E.; Martínez-Nevado, E.; Sanpera, C.; Blasco, M.A. Telomere Shortening Rate Predicts Species Life Span. Proc. Natl. Acad. Sci. USA 2019, 116, 15122–15127. [Google Scholar] [CrossRef] [Green Version]
  51. Haussmann, M.; Marchetto, N.M. Telomeres: Linking Stress and Survival, Ecology and Evolution. Curr. Zool. 2010, 56, 714–727. [Google Scholar] [CrossRef]
  52. Bateson, M. Cumulative Stress in Research Animals: Telomere Attrition as a Biomarker in a Welfare Context? Bioessays 2016, 38, 201–212. [Google Scholar] [CrossRef]
  53. Aydinonat, D.; Penn, D.; Smith, S.; Moodley, Y.; Hoelzl, F.; Knauer, F.; Schwarzenberger, F. Social Isolation Shortens Telomeres in African Grey Parrots (Psittacus erithacus erithacus). PLoS ONE 2014, 9, e93839. [Google Scholar] [CrossRef] [Green Version]
  54. Cooke, M.S.; Evans, M.D.; Dove, R.; Rozalski, R.; Gackowski, D.; Siomek, A.; Lunec, J.; Olinski, R. DNA Repair is Responsible for the Presence of Oxidatively Damaged DNA Lesions in Urine. Mutat. Res. 2005, 574, 58–66. [Google Scholar] [CrossRef]
  55. Gackowski, D.; Rozalski, R.; Roszkowski, K.; Jawien, A.; Foksiński, M.; Olinski, R. 8-Oxo-7,8-dihydroguanine and 8-oxo-7,8-dihydro-2′-deoxyguanosine Levels in Human Urine Do Not Depend on Diet. Free Radic. Res. 2001, 35, 825–832. [Google Scholar] [CrossRef] [PubMed]
  56. Rozalski, R.; Siomek, A.; Gackowski, D.; Foksinski, M.; Gran, C.; Klungland, A.; Olinski, R. Diet Is Not Responsible for the Presence of Several Oxidatively Damaged DNA Lesions in Mouse Urine. Free Radic. Res. 2004, 38, 1201–1205. [Google Scholar] [CrossRef]
  57. Bogdanov, M.B.; McCabe, B.; McCabe, G.; Griffin Matson, W.R.; Matson, W.R. A Carbon Column-Based Liquid Chromatography Electrochemical Approach to Routine 8-Hydroxy-2′-Deoxyguanosine Measurements in Urine and Other Biologic Matrices: A One-Year Evaluation of Methods. Free Radic. Biol. Med. 1999, 27, 647–666. [Google Scholar] [CrossRef]
  58. Kato, I.; Startup, J.; Ram, J.L. Fecal Biomarkers for Research on Dietary and Lifestyle Risk Factors in Colorectal Cancer Etiology. Curr. Colorectal Cancer Rep. 2014, 10, 114–131. [Google Scholar] [CrossRef]
  59. Wilson, A.E.; Michaud, S.A.; Jackson, A.M.; Stenhouse, G.; Coops, N.C.; Janz, D.M. Development and Validation of Protein Biomarkers of Health in Grizzly Bears. Conserv. Physiol. 2020, 8, coaa056. [Google Scholar] [CrossRef]
  60. Munro, R.H.M.; Nielsen, S.E.; Price, M.H.; Stenhouse, G.B.; Boyce, M.S. Seasonal and Diel Patterns of Grizzly Bear Diet and Activity in West-Central Alberta. J. Mammal. 2006, 87, 1112–1121. [Google Scholar] [CrossRef]
  61. Christina, G.; Wasser, S.K.; Hunt, K.E.; Servheen, C. Factors Associated with Fecal Glucocorticoids in Alaskan Brown Bears (Ursus arctos horribilis). Physiol. Biochem. Zool. 2004, 77, 313–320. [Google Scholar]
  62. Loft, S.; Møller, P.; Cooke, M.S.; Rozalski, R.; Olinski, R. Antioxidant Vitamins and Cancer Risk: Is Oxidative Damage to DNA a Relevant Biomarker? Eur. J. Nutr. 2008, 47, 19–28. [Google Scholar] [CrossRef] [PubMed]
  63. Stetz, J.; Hunt, K.; Kendall, K.C.; Wasser, S.K. Effects of Exposure, Diet, and Thermoregulation on Fecal Glucocorticoid Measures in Wild Bears. PLoS ONE 2013, 8, e55967. [Google Scholar] [CrossRef] [Green Version]
  64. Beaulieu, M.; Costantini, D. Biomarkers of oxidative status: Missing tools in conservation physiology. Conserv. Physiol. 2014, 2, cou014. [Google Scholar] [CrossRef]
Figure 1. Mean rates per minute ± SE of social interactions for n = 3 male grizzly bears when they occupied three different-sized habitats.
Jzbg 02 00022 g001
Figure 2. Longitudinal concentrations of fecal glucocorticoid metabolites (FGM) and fecal oxidized guanine (8-OHdG) in three male grizzly bears while they occupied a temporary, smaller habitat. Concentrations are expressed as ng/g dry feces. Note the different scales on the graph for Boo (a) compared to Mike (b) and Thor (c).
Jzbg 02 00022 g002aJzbg 02 00022 g002b
Figure 3. Scatterplots comparing log-transformed concentrations of fecal glucocorticoid metabolites (FGM) and fecal oxidized guanine (8-OHdG) in three male grizzly bears while they occupied a temporary, smaller habitat. Concentrations are expressed as ng/g dry feces.
Jzbg 02 00022 g003
Figure 4. Scatterplots showing log-transformed rates of affiliative interactions as a predictor of log-transformed fecal oxidized guanine (8-OHdG) concentrations (ng/g) for three male grizzly bears.
Jzbg 02 00022 g004
Figure 5. Changes in mean ± SE sample concentrations of fecal oxidized guanine (8-OHdG) measured under different storage conditions in grizzly bear samples. The first two pairs on the graph show changes in concentrations (n = 4 for each) after samples were extracted and analyzed, and the extract was then stored at −20 °C for three or six months and reanalyzed. The final pair shows the effects of re-extracting dried, pulverized fecal samples (n = 3) that had been stored at −20 °C for six months prior to re-analysis. Concentrations are expressed as ng/g dry feces. Standard error bars were calculated by taking the standard deviation of each individual sample at both time points, averaging those, and then calculating the standard error within each comparison. * p < 0.05.
Jzbg 02 00022 g005
Table 1. Grizzly bear habitats occupied during the study.
Habitat (Relative Size)Original (Medium)Temporary (Smaller)Expanded (Largest)
study period5 September 2017–11 November 201726 February 2018–30 May 201831 May 2018–30 September 2018
outdoor habitat size836.1 m2334.4 m21672.2 m2
outdoor habitat featuresgunite rockwork; dirt substrate; moat; two access points to holding; 246.0 m3 water feature with variable depths and a waterfallgunite rockwork; dirt substrate; moat; two access points to holding; 64.3 m3 water featuregunite rockwork; dirt, mulch, and grass substrates; several large trees; six access points to holding; large cave; same water feature as the original habitat (246.0 m3)
Table 2. Partial ethogram for grizzly bear observations. All behaviors were scored using both scan and all-occurrence sampling. The identity of social partners was also recorded, as was the role of the focal as the initiator or recipient or if the interaction was mutual.
BehaviorDescription
affiliative social interactionFocal is engaged in an interaction with another bear including sniffing, licking, nuzzling, calm contact (bear initiating the contact is alert), passive recipient to such behavior, mouthing with no injuries, etc.
social playFocal is engaged in a positive active interaction with another bear including wrestling, social chase, etc. Playful interactions should involve an alternating of offensive and defensive roles, and play should stop short of injury.
agonistic social interactionFocal is engaged in a negative interaction with another bear including swatting, charging, biting, or attempting to bite, etc.
Table 3. Pearson correlation coefficients among physiological, environmental, and behavioral variables for three male grizzly bears. All variables were log-transformed to approximate normality except for the mean daily temperature and the percent of time spent active. * indicates p < 0.05, and statistical trends (p < 0.1) are highlighted in bold.
Predictorlog(FGM)log(8-OHdG)
SubjectsGroupBooMikeThorGroupBooMikeThor
log(FGM)----r = 0.492
p < 0.001 *
n = 75
r = 0.597
p = 0.011 *
n = 17
r = 0.472
p = 0.005 *
n = 34
r = 0.698
p < 0.001 *
n = 24
daily mean temperaturer = 0.134
p = 0.252
n = 75
r = 0.646
p = 0.005 *
n = 17
r = 0.105
p = 0.554
n = 34
r = 0.057
p = 0.790
n = 24
r = 0.382
p = 0.001 *
n = 75
r = 0.155
p = 0.551
n = 17
r = 0.504
p = 0.002 *
n = 34
r = 0.268
p = 0.205
n = 24
log(rate affiliative)r = 0.015
p = 0.907
n = 60
r = −0.134
p = 0.609
n = 17
r = 0.093
p = 0.705
n = 19
r = 0.059
p = 0.785
n = 24
r = 0.075
p = 0.567
n = 60
r = −0.417
p = 0.096
n = 17
r = 0.445
p = 0.056
n = 19
r = −0.150
p = 0.484
n = 24
log(rate social play)r = −0.090
p = 0.496
n = 60
r = 0.293
p = 0.253
n = 17
r = −0.014
p = 0.956
n = 19
r = −0.220
p = 0.302
n = 24
r = −0.074
p = 0.574
n = 60
r = 0.178
p = 0.495
n = 17
r = −0.072
p = 0.768
n = 19
r = −0.250
p = 0.239
n = 24
log(rate agonistic)r = −0.138
p = 0.292
n = 60
r = −0.019
p = 0.942
n = 17
r = −0.166
p = 0.498
n = 19
r = −0.176
p = 0.410
n = 24
r = 0.071
p = 0.589
n = 60
r = 0.200
p = 0.442
n = 17
r = −0.144
p = 0.556
n = 19
r = 0.045
p = 0.836
n = 24
percent activer = 0.265
p = 0.041 *
n = 60
r = −0.238
p = 0.358
n = 17
r = 0.442
p = 0.058
n = 19
r = 0.363
p = 0.082
n = 24
r = 0.091
p = 0.490
n = 60
r = −0.170
p = 0.513
n = 17
r = 0.137
p = 0.575
n = 19
r = 0.376
p = 0.071
n = 24
Publisher’s Note: MDPI stays neutral with regard to jurisdictional claims in published maps and institutional affiliations.

