
Assessing the Impacts of Engaging with a Touch Table on Safari Park Visitors


Knowsley Safari, Prescot L34 4AN, Merseyside, UK
*
Author to whom correspondence should be addressed.
J. Zool. Bot. Gard. 2021, 2(3), 370-381; https://0-doi-org.brum.beds.ac.uk/10.3390/jzbg2030026
Submission received: 17 May 2021
/
Revised: 8 July 2021
/
Accepted: 13 July 2021
/
Published: 14 July 2021
(This article belongs to the Special Issue Zoos as a Tool for Re-Connecting People with Nature)
Abstract
:Modern zoos are increasingly viewed as educational facilities, with informal education programmes attempting to engage with visitors through a wide variety of methods. A ‘touch table’ consists of two collapsible tables which display a variety of artefacts to the public. This study investigated visitor engagement with touch tables alongside types of conversations being initiated by visitors. Covert observations recorded the type of groups visiting, their dwell time, perceived engagement level and the types of interactions and conversations they were initiating at the touch table. Dwell time was affected by the season, member of staff present, type of group visiting the touch table and engagement level of the group. Engagement level was also affected by group type. Longer average dwell time and higher engagement levels were displayed at a long-established touch table location, whereas more visitors engaged at the touch table when it was at a new location with predicted high footfall. Here, 68.3% of visitors initiated ‘surface level’ conversation, 27.2% initiated ‘deeper level’ conversation and 89.6% initiated ‘other’ conversation. This study resulted in touch table offerings being adapted to further increase their effectiveness as an informal education tool and to suggests ways in which touch tables can continue in a post COVID-19 world.
1. Introduction
Historically, zoological collections revolved around public entertainment [1]. Many modern collections now have policies and objectives centred around contributions to ongoing conservation efforts, including coordinated breeding programmes, the support of in situ conservation efforts and the provision of conservation education [2,3,4]. Modern zoos are increasingly being viewed as educational facilities, encouraging visitors to increase their knowledge of the natural world and awareness of global conservation issues [5,6,7]. UK zoological collections are legally required to provide an education provision to visitors [8]. Whilst this is undertaken relatively easily for groups seeking specific educational experiences, e.g., school groups, for many visitors their primary motivation for attending a zoological collection is not education, but recreation—they are looking for a shared family experience [9,10,11,12,13]. As a result, zoological collections are offering informal education programmes to engage with visitors, where learning is free choice but supported by wide ranging programmes, which could include species signs, interpretive material, keeper talks, encounters with staff at enclosures or discovery stations [14]. If the informal education activities are engaging and fun this then satisfies both the visitors and zoological collections motivations; visitors are having a fun family day out and the zoological collections are delivering educational content to their visitors.
To ensure that the onsite programmes being delivered are effective, the World Association of Zoos and Aquariums (WAZA) [3] strongly encourage all collections to carry out evaluation on their conservation education programmes. The British and Irish Association of Zoos and Aquariums (BIAZA) provide education guidelines, which also encourage collections to evaluate the programmes they are delivering [15]. It is advised that evaluation is incorporated into programme development to provide better educational products [16] and that evaluation is undertaken to a standard that prevents the validity of the evaluation from being questioned [7,17,18]. Typically, formal education programmes are evaluated, including workshops for schools and organised children’s clubs, with 70% of BIAZA collections regularly carrying out evaluation programmes [19]. In contrast, there is a lack of published material evaluating the outcomes of informal education programmes [7,13,19].
Collections are increasingly developing more innovative ways to undertake informal education and engage with visitors, beyond public talks and species signage. Touch tables have been shown to be an effective way to increase visitors’ knowledge of biology, ecology and conservation of a species [4]; however, like other informal education activities, touch tables do not directly create income for the collection and can be costly to operate. Despite being mission-fulfilling, this can mean their value is not recognised and resources are limited [4,19,20,21,22]. Many zoological collections are not publicly funded, such as museums and art galleries, which rely heavily on revenue generated by visitors; therefore, effective evaluation is essential, not only to ensure visitors are offered an educational experience that engages them with the desired messaging and to improve the delivery of informal education programmes, but also justify their costs.
Many publications use ‘dwell time’ as a measure of enjoyment or engagement [23,24,25,26], which is an important variable still factored into this study; however, more detailed data collection allows for a deeper understanding of visitor experiences.
The aims of this study were to examine the level at which visitors were engaging at a touch table and to understand the level of conversation they were initiating in order to further develop the touch table method of engagement, tailor delivery to relevant audiences and provide evidence that impact justified resource. The following criteria were explored:
- Which factors affected the dwell time of visitors at the touch table;
- Which factors affected the level of engagement of visitors at the touch table;
- The benefits of placing a touch table in an anecdotally successful location versus a new enclosure with predicted high footfall were compared;
- Establishing whether visitors will initiate conversations surrounding complex conservation topics;
- Understanding which interactions or actions visitors are more likely to participate in at the touch table.
2. Materials and Methods
2.1. Study Site
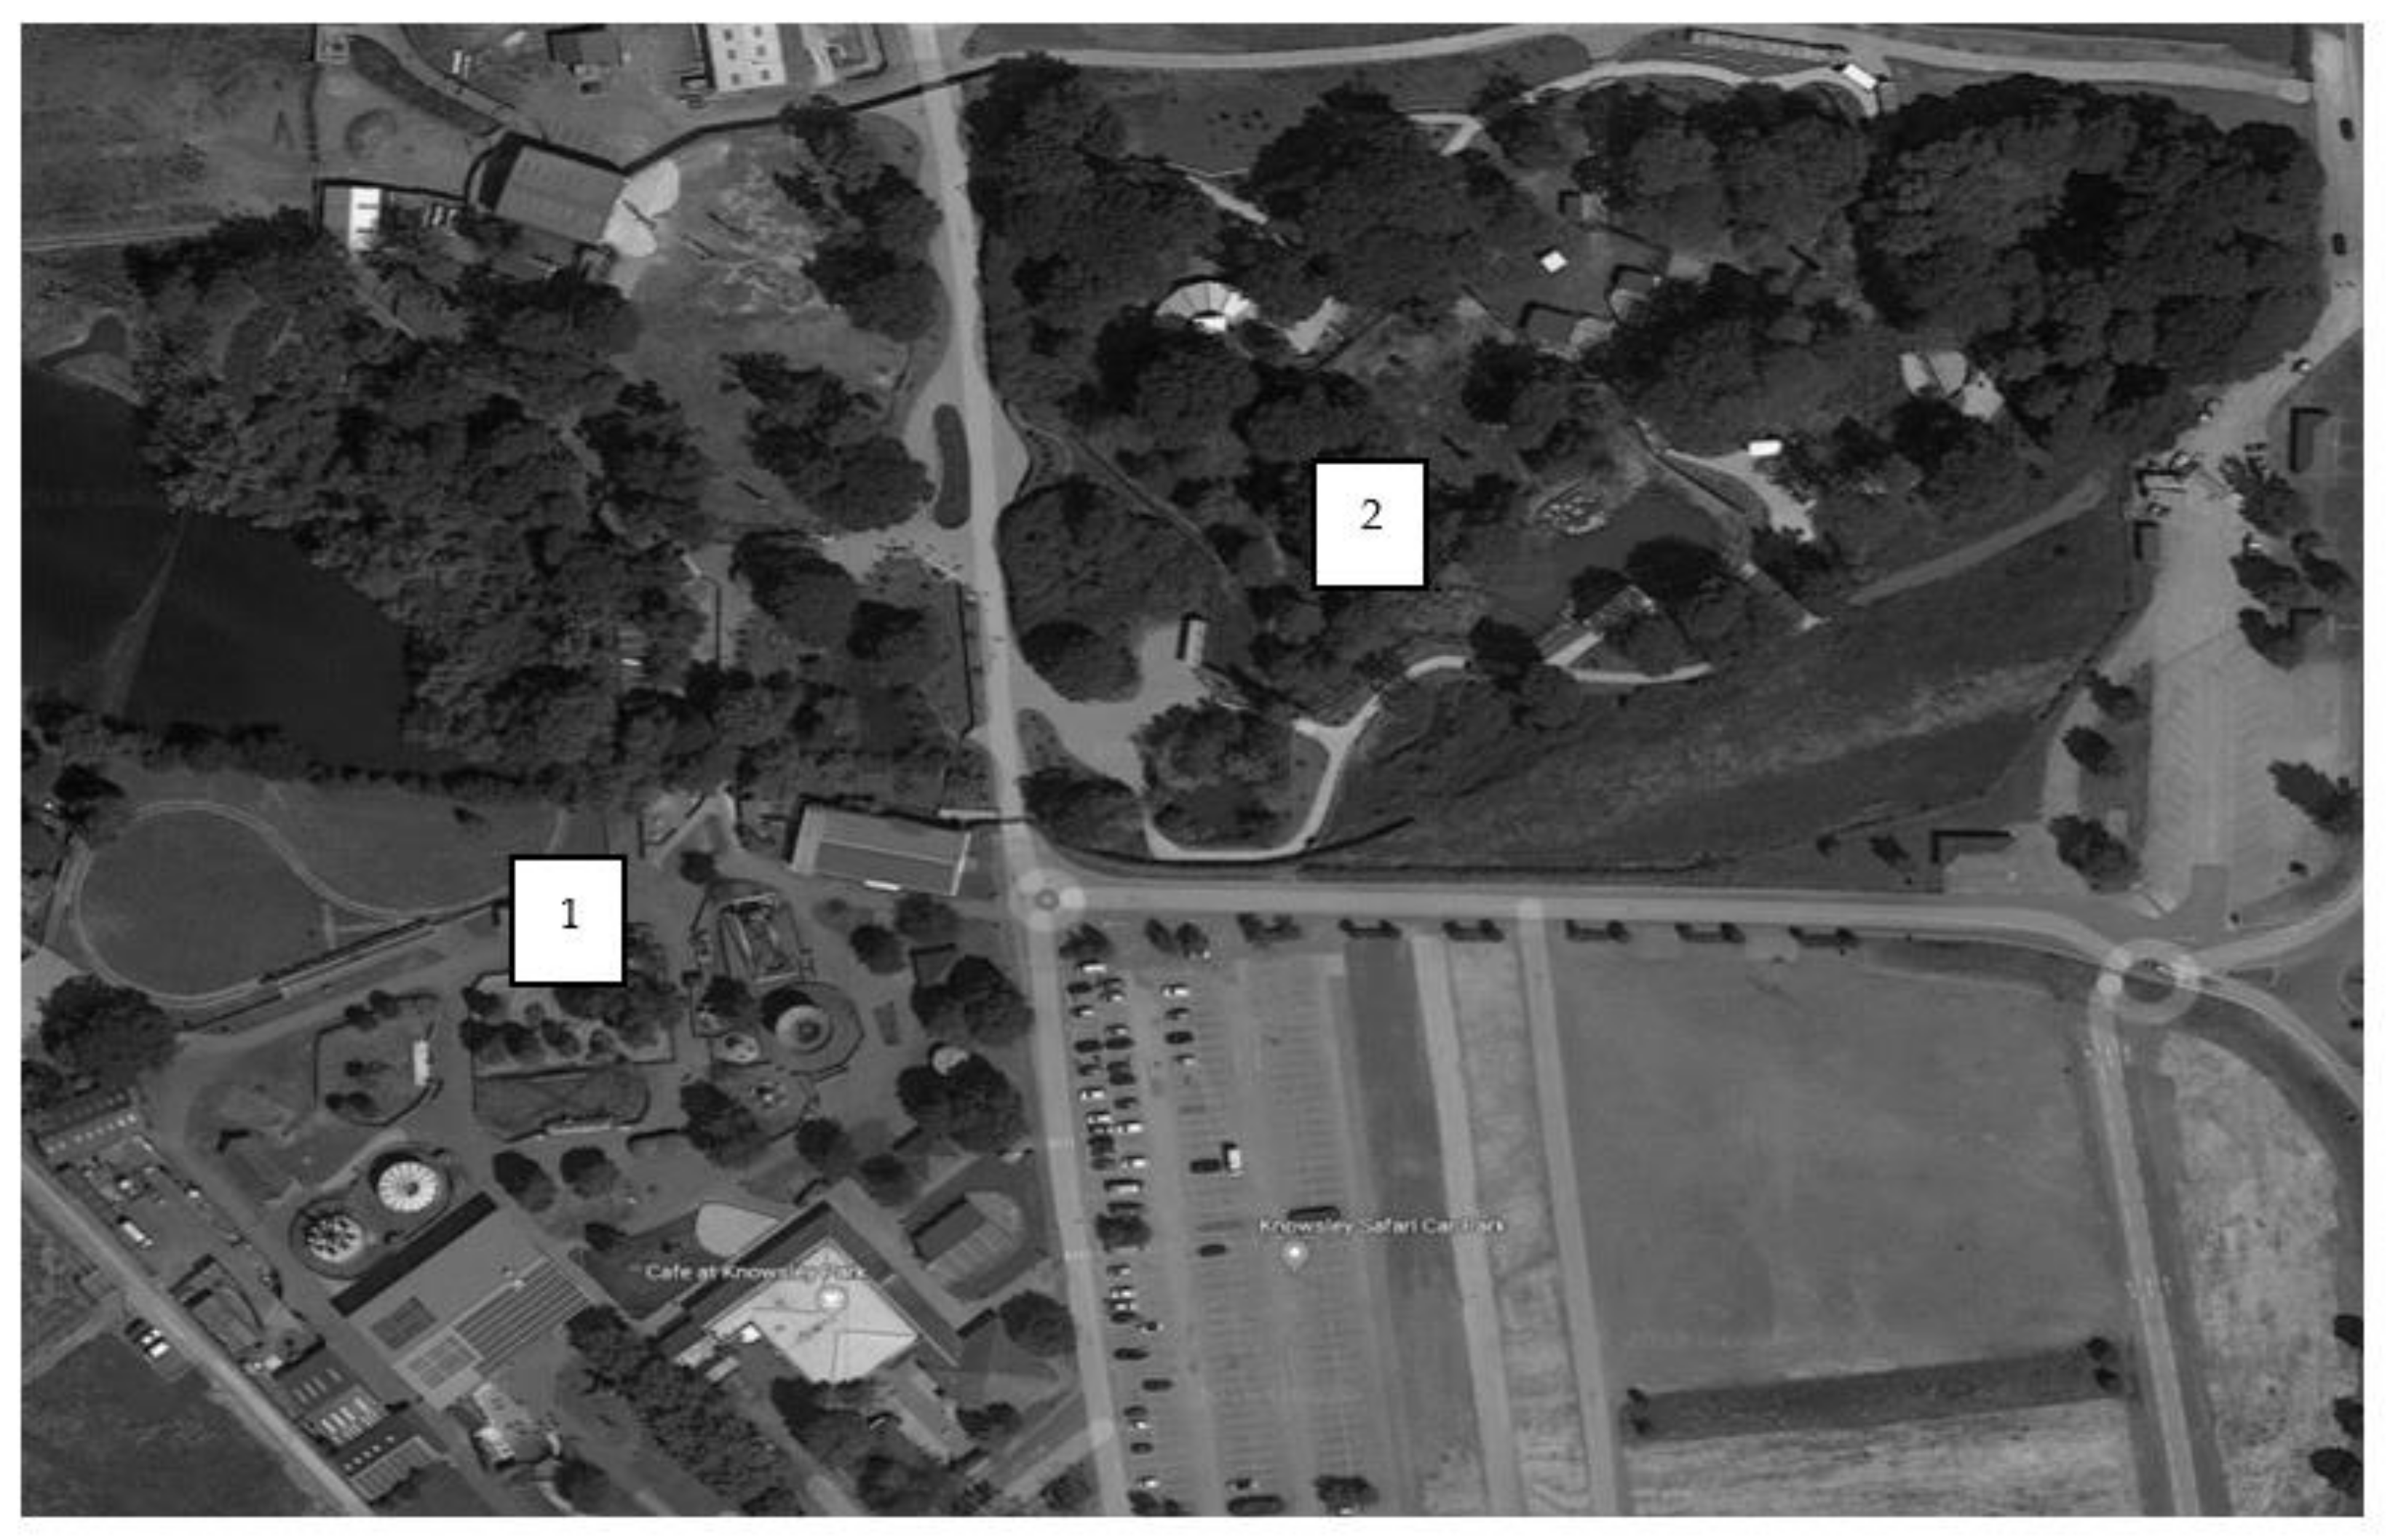
This study was undertaken at Knowsley Safari (KS). Touch tables were set up in two locations (Figure 1) during school holidays between 10 February and 31 October 2018. The first location, ‘rides’, was anecdotally reported by staff as being a high footfall location due to its position being close to the amusement rides. The second location was on the newly opened ‘tiger trail’, which was predicted to have high footfall because of the novelty factor.
2.2. Touch Table Delivery
Touch table content was designed to target ‘explorer families’, KS’s majority visitor demographic, who are motivated by a more intellectual or emotional day out [27]. Each touch table consisted of two-fold away tables, real artefacts sourced from a live or deceased animal, replica artefacts sourced from a company that made biologically accurate copies of animal bones, sound tiles which played animal noises when pressed and other miscellaneous artefacts (Figure 2).
One member of staff (hereafter educator) was responsible for visitor engagement. The educator would interact with anyone that approached the touch table. It was the educator’s responsibility to engage and include everyone that approached the table instead of focusing on one group in turn. The educator would play guessing games; provide information relating to animal biology, ecology and conservation; and answer any questions asked. Educators changed depending on the staff rota. A team of 18 learning and discovery staff members contributed to delivery; however, training for all staff was consistent.
2.3. Data Collection
One member of staff (hereafter the evaluator) was responsible for data collection, undertaking covert visitor observations at each touch table. The evaluator recorded total number of visitors on a clicker. Simultaneously, the evaluator would focus on one ‘focal’ group at a time to collect more in-depth data. A focal group was selected when a visitor or group of visitors passed a pre-determined imaginary line approximately 1 m from the touch table. This methodology was chosen to reduce selection bias where possible. Data recording started as soon as the group had passed this line. Engagement was recorded using the engagement level descriptions detailed in Table 1 [28]. The conversation topic initiated by the visitor was recorded using codes for ease and anonymity (Table 2). The conversation topic was later broken down into three more generic categories for analysis, namely ‘surface level’, ‘deeper level’ and ‘other’ (Table 2) [13]. All conversation topics were recorded for each focal group. Some focal groups engaged in more than one conversation topic with the educator, which was recorded accordingly. A stopwatch was used to record dwell time. The educator, evaluator, time, weather and number of individuals in each group were recorded. Group type (family, group, couple and individual) [13] was also recorded based on pre-determined definitions, where ‘family’ was an intergenerational group with any combination of adults and children, a ‘group’ was three or more adults, a ‘couple’ was any combination of two people and an ‘individual’ was a single adult. When the focal group had left the touch table and recrossed the invisible line, the evaluator stopped the stopwatch and restarted the process. Evaluators changed depending on the staff rota. The same team of 18 learning and discovery staff members contributed to evaluation; however, training for all staff was consistent to mitigate observer bias as far as possible.
2.4. Statistical Analysis
Data were analysed using RStudio Software Version 3.5.1 (2018). After checking for normality using a Shapiro–Wilk test and determining all the data to be not normal, a Kruskal–Wallis test was run for all data comparisons. A Spearman rank was used to identify association between ranked variables (engagement type and dwell time).
3. Results
During the data collection period, 22,854 visitors engaged with an educator at the touch table, with 1461 focal groups comprising 5207 participants observed for this study. Here, 14,629 visitors engaged with an educator at the ‘tiger trail’ touch table and 8225 at the ‘rides’ table. Across both locations, 88.1% of focal groups were classed as families, 6.2% as couples, 3.7% as individuals and 2% as groups.
3.1. Dwell Time
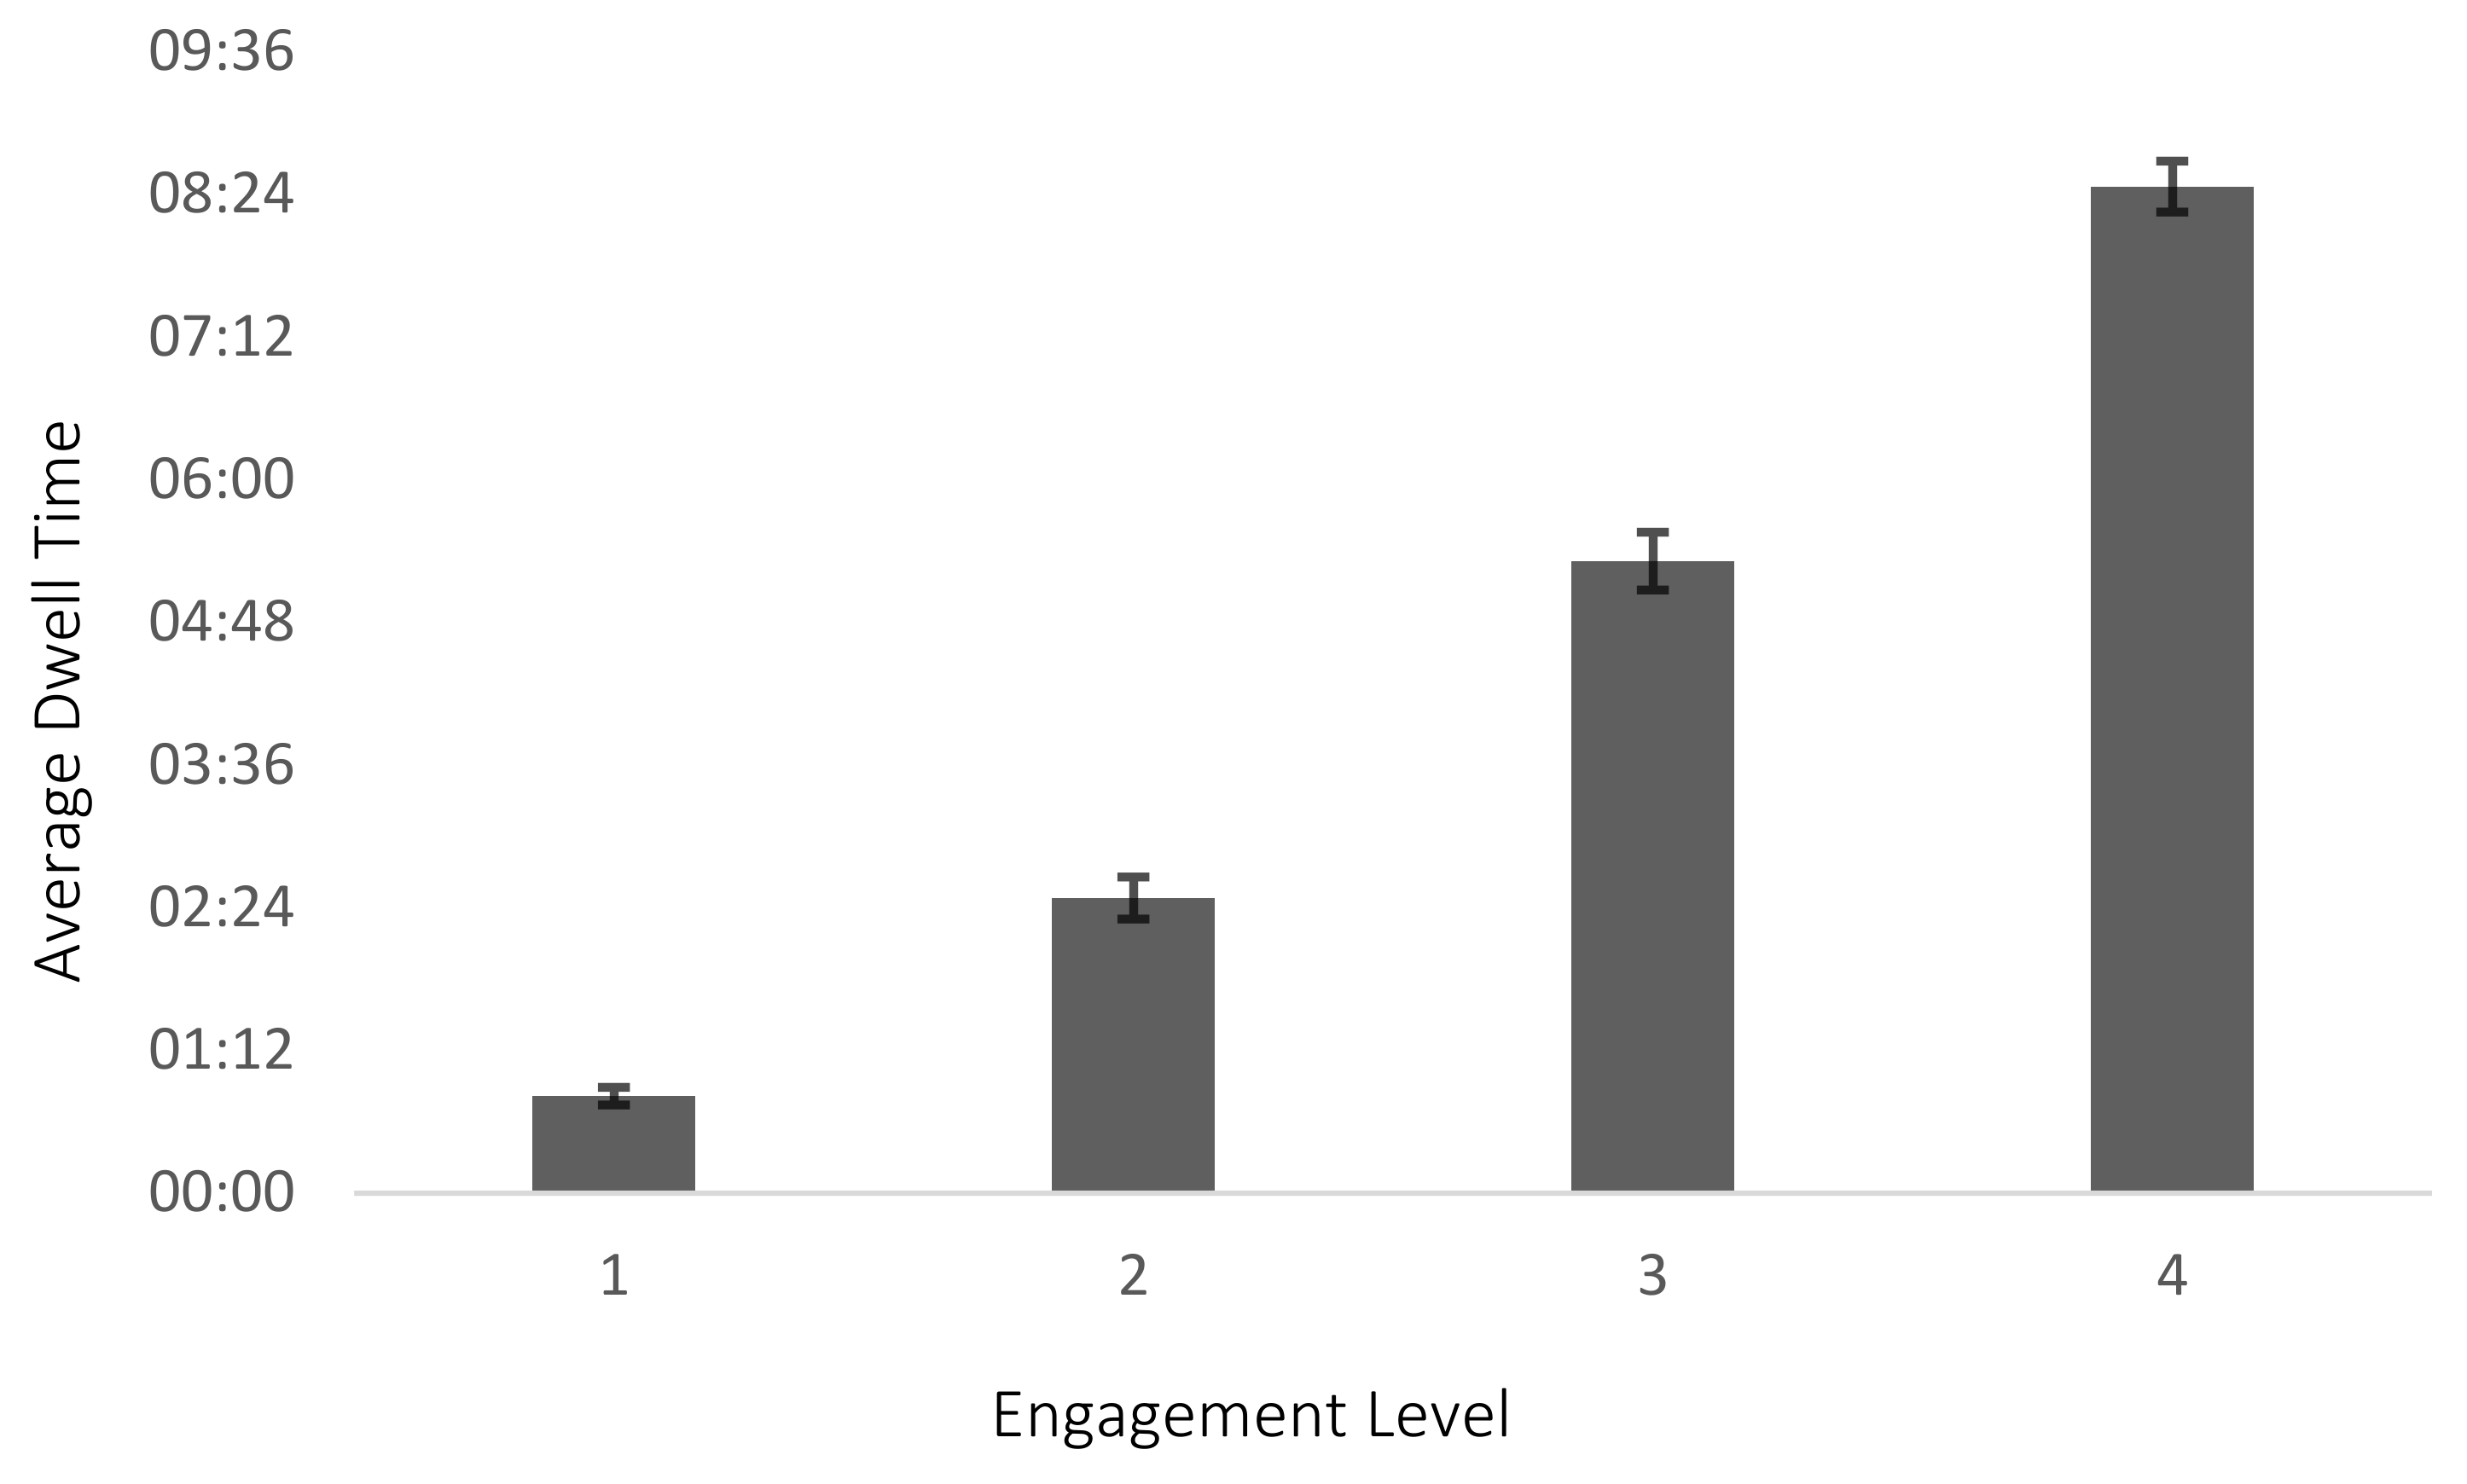
Differences in dwell time were seen in different seasons, with higher dwell times seen in colder seasons (H = 10.306, df = 3, p < 0.05). The member of staff on the touch table affected dwell time (H = 29.372, df = 17, p < 0.05). Staff who had worked at the collection longer facilitated a longer dwell time. Group type (H = 29.878, df = 3, p < 0.001) also affected dwell time, with families spending the most time at the touch table (Figure 3).
Significant differences were identified between the length of time visitors spent at the touch table and the level at which they were engaging (H = 524.35, df = 3, p < 0.001), with an association identified between longer dwell time and higher levels of engagement (rho = 0.5701841, p < 0.001) (Figure 4).
3.2. Engagement Level
Significant variations in engagement level were observed, depending on the group type (H = 38.7, df = 3 p =< 0.001). Groups and families displayed more level four engagement, couples were evenly spread between the four engagement levels and individuals displayed more level one engagement (Figure 5), suggesting that group types containing more people display higher levels of engagement.
3.3. Location
The dwell time at the touch table was significantly lower when it was located at the new ‘tiger trail’ compared to the original ‘rides’ location (H = 11.645, df = 1, p < 0.001), despite the tiger trail location attracting the predicted higher numbers of visitors. Similarly, on average the engagement level was lower at the tiger trail (H = 116.04, df = 1, p < 0.001).
3.4. Conversation Initiation and Visitor Interactions
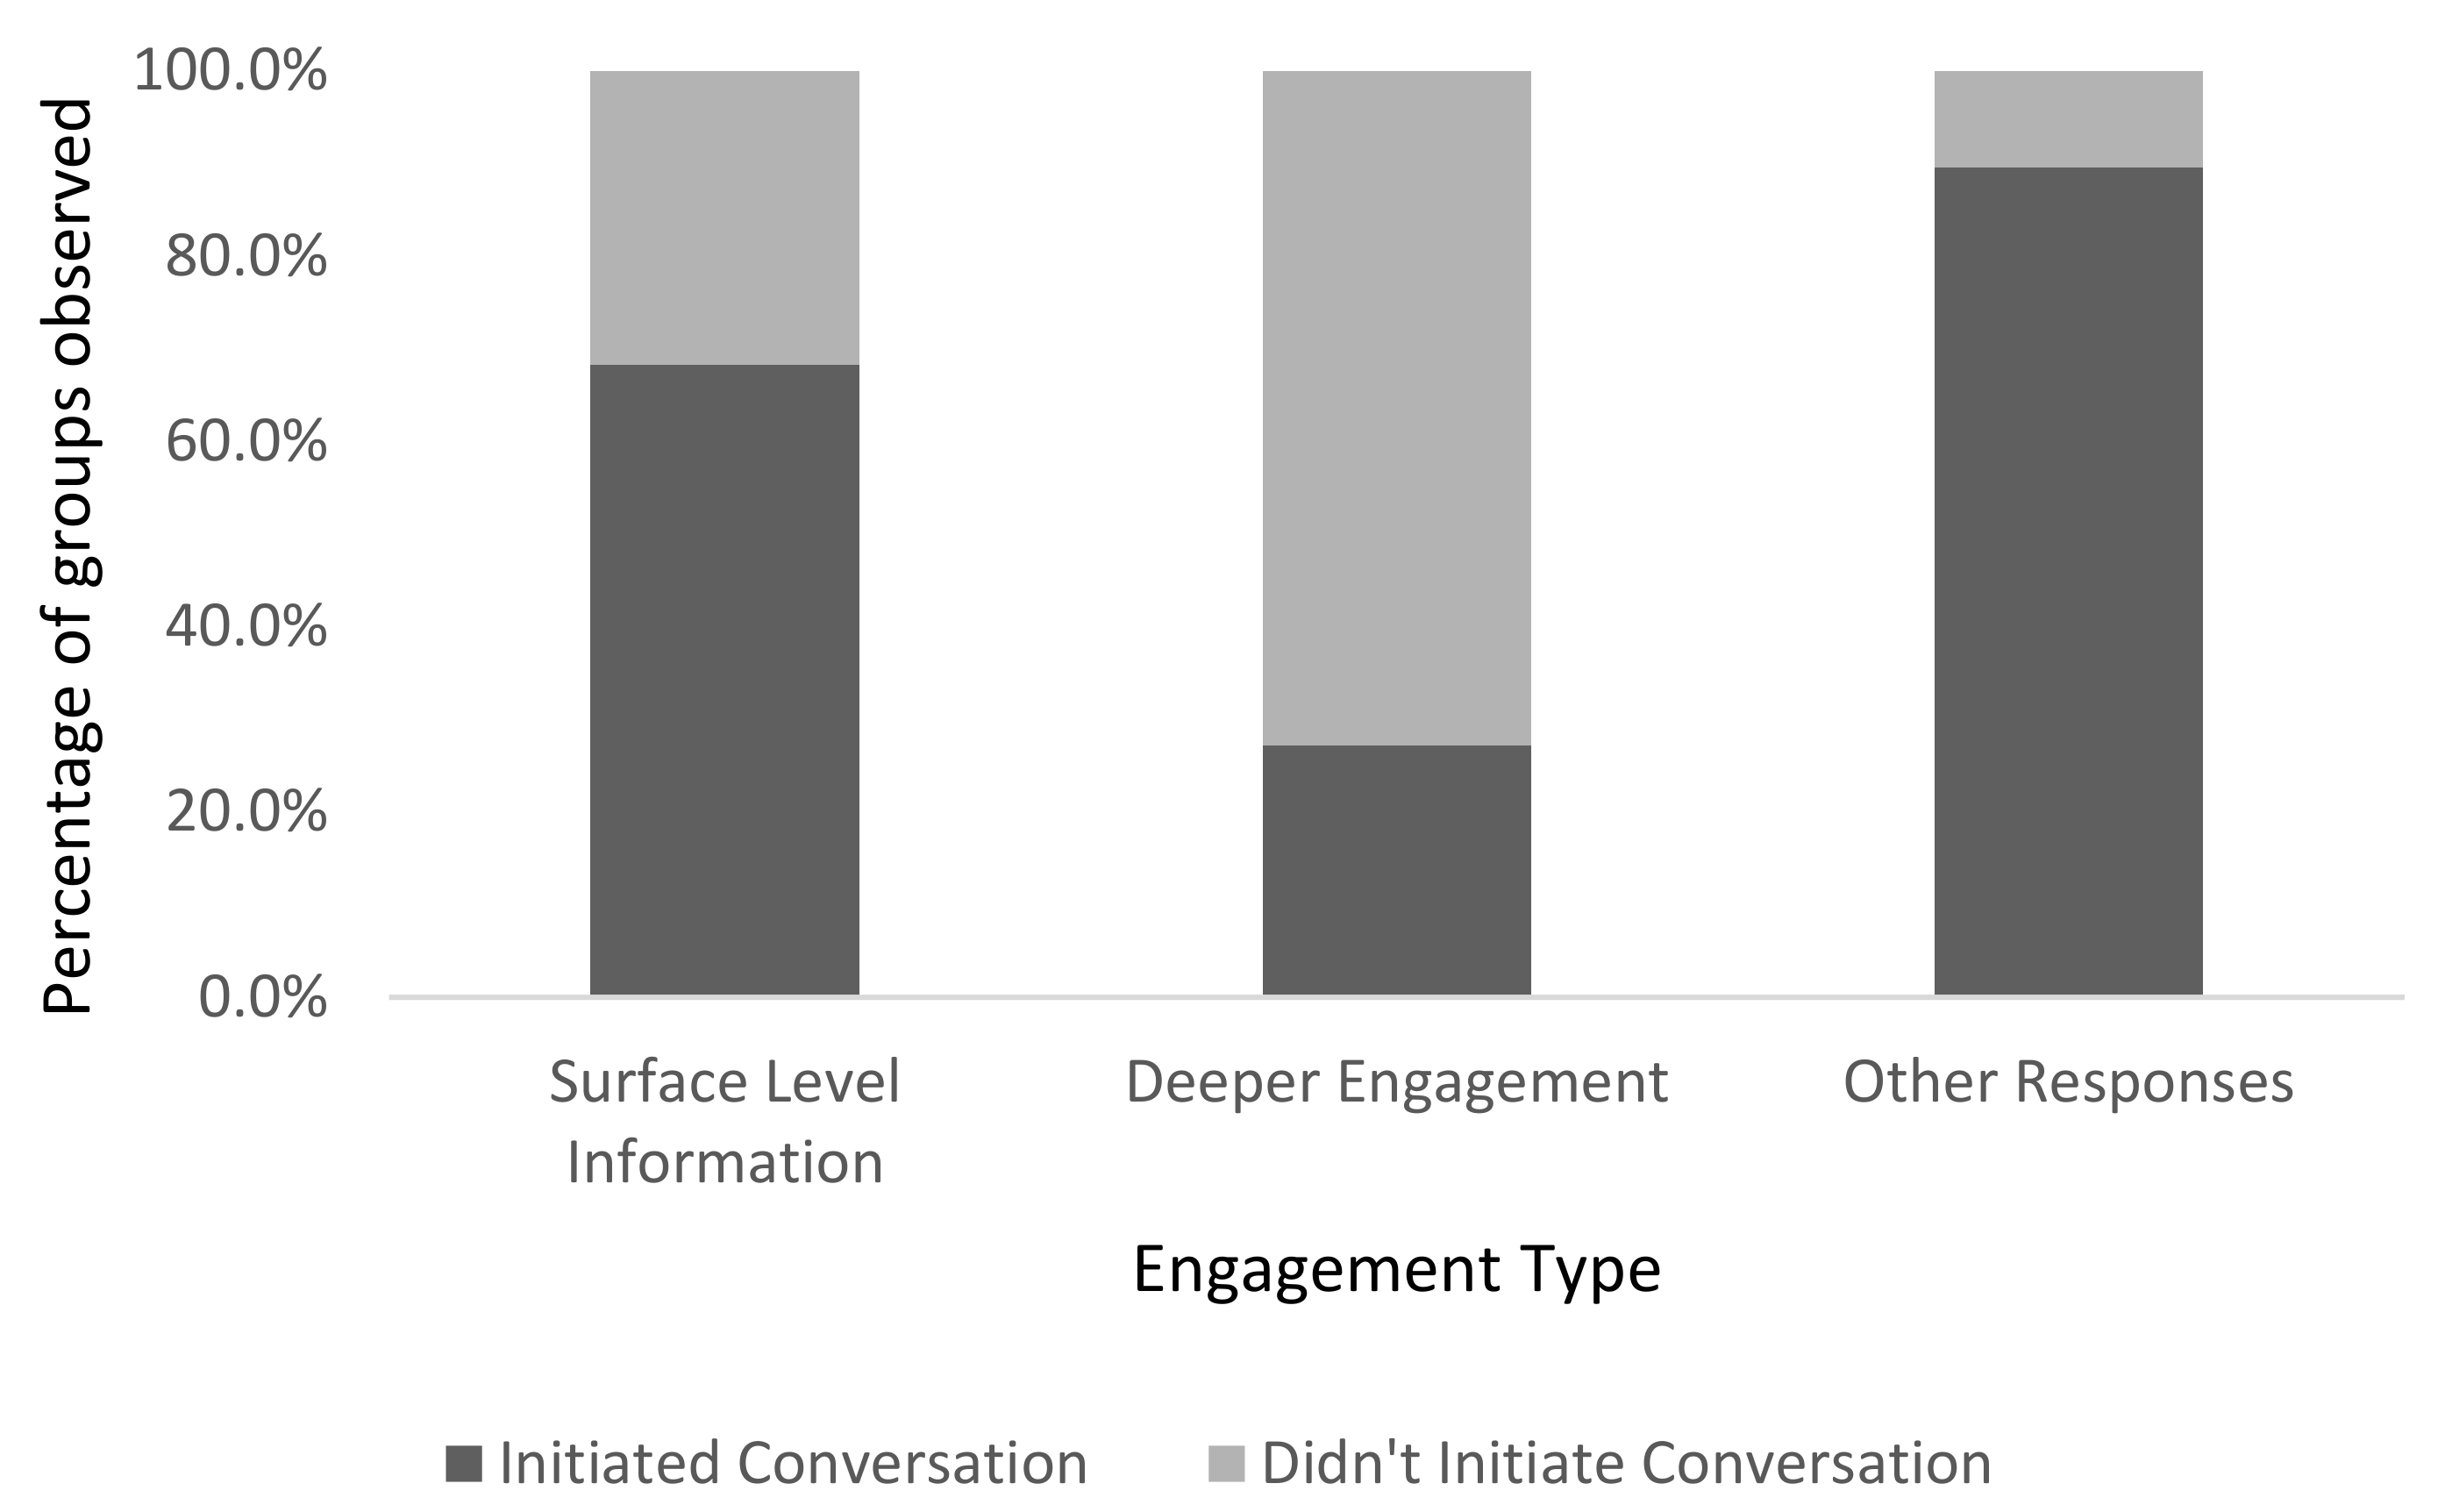
In total, 68.3% of visitors engaged in ‘surface level’ conversation topics, 27.2% of visitors engaged in ‘deeper level’ conversation topics and 89.6% of visitors engaged in ‘other’ conversation topics (H = 1053.2, df = 2, p < 0.001) (Figure 6).
When investigating the interactions displayed by visitors at the touch table, it was found that the most frequent interactions were ‘touch artefacts’ (84.4%), ‘participate in adult to child interaction’ (56.9%), ‘answer questions’ (55.9%), ‘name artefacts’ (43.9%) and ‘ask questions regarding the artefacts’ (43.7%). These interactions were all classed as ‘surface level’ or ‘other’.
4. Discussion
Understanding drivers for success is vital for the continued improvement of informal education programmes in zoological collections to improve the way conservation content is communicated to visitors. Demonstrating the effectiveness of resource-heavy informal education programmes also helps justify their existence [29]. This study has revealed which factors can affect a visitor’s experience at a touch table and influence the opportunity for a visitor to engage in ‘deeper level’ conservation with an educator.
4.1. Dwell Time
Dwell time appeared to be influenced by a number of factors, such as the staff member and group type. Having educators present has been shown to increase dwell time and enhance visitor engagement [13,30]; however, when looking at the average dwell times by staff member, the longer serving team members were able to promote higher dwell times, likely due to their increased experience in engaging visitors and delivering the content on the touch table. The shorter dwell times displayed by individuals, couples and groups could be explained by the content of the touch table, designed to appeal to KS’s primary demographic, ‘explorer families’. Although the information conveyed and delivery style could be tailored by the educator to the relevant age and education level, the content of the touch table did not vary to appeal to different groups.
It was not expected for higher dwell times to be recorded in colder seasons, which highlights the need for ongoing evaluation of any education programme. Previously, it was assumed that less favourable weather conditions and lower visitor numbers would reduce the overall effectiveness of touch tables [31,32]. In this case, weather conditions may have been countered by the physical locations of the touch tables. Both locations used for the touch table were located in sheltered areas, which could have promoted longer dwell times in winter months as visitors look for an activity that will take them out of the less favourable weather conditions. Overall visitor numbers recorded daily by Knowsley Safari outside of this study logged lower visitor numbers in the colder seasons, which may also have resulted in less competition for the attention of the educator. When fewer visitors were present, educators were able to tailor the delivery to the group in front of them, which may have resulted in the longer dwell times recorded. In contrast, in summer when the park was busier, the educator would ‘grow the show’ by including all visitors, which meant appealing to a larger audience instead of directing conversation towards a single group or individual. This may have resulted in groups moving off more quickly due to the lack of opportunity to have tailored conversations with the educator, identifying a potential trade-off between quantity and quality [18]. This trade-off is further evidenced by the relationship between engagement level and dwell time. As suggested by previous research [26,33], a positive association was seen between engagement level and dwell time.
4.2. Engagement Level
When examining individual factors affecting engagement level, groups that by definition consisted of more people, i.e., families and groups, displayed higher levels of engagement. This relationship could be explained by group demographics. Families always included at least one child judged to be up to the age of 18. Younger children were often observed to more eagerly engage with the educator and be more curious about the artefacts displayed on the touch table, leading to an early rapport with the educator [33,34]. Couples and individuals mainly comprising adults were often recorded engaging at lower levels (Figure 5), exhibiting behaviour such as standing and listening but not actively participating. In contrast, bigger groups of adults were more likely to engage at a higher level. This was perhaps due to a feeling of ‘safety in numbers’, which would not be the case for individuals or a couple, who might feel that due to their small group size more attention would be on them [35]. The nature of the ‘rides’ location may also be relevant. Often, it was noted alongside the recorded data that lone adults or couples would appear to be waiting for their children to finish using a ride and would visit the touch table while they were waiting; however, the educator would rarely have their full attention as they were waiting for their child or children to return and would leave soon after. Many zoological collections have similar areas such as playgrounds, fair rides and small animal petting areas, where lone adults or couples will be behaving in a similar manner. The results of this study could inform decisions on suitable areas for informal education opportunities to encourage a higher engagement level.
4.3. Location
The tiger trail was a large new development and had been highly publicised; therefore, there was an expected increase in footfall during the park as a whole, although specifically concentrated around the trail. Due to the higher predicted footfall, it was expected that a touch table in this location would have higher visitor numbers and would promote higher engagement levels and dwell times. Although visitor numbers were higher at the touch table at the ‘tiger trail’ location, given the above discussion we now have some understanding of why higher levels of engagement and dwell time were found at the ‘rides’ location. Another factor to consider is the layout of the location; the ‘tiger trail’ is a continuous experience, meaning all visitors must pass by the touch table, which initially seemed like a benefit, although locating the touch table in this location also means setting it up in close proximity to an enclosure housing a charismatic species with many interactive interpretative elements, meaning there are multiple distractions. Other collections have recorded visitors spending more time looking at flagship species than interacting with interpretive elements [36]. At the ‘rides’ location, there are still high levels of footfall as it is next to a main walkway, although there are no animals of interpretive elements in the area and visitors must consciously choose to step off the main route to take part. Other literature has discussed the idea that education in zoos is often as a result of self-directed learning [37], and the higher dwell times and engagement levels at the rides location following a choice to approach the touch table helped solidify this.
4.4. Conversation Initiation and Visitor Interactions
Previous studies have shown than visitor conversations with educators often cover surface level information about animals, e.g., name of animal and diet, rather than conversations relating to conservation [13,38]. The results from this study back this up but add an additional level of detail in that the present study focused on conversation initiated by the visitor rather than conversation initiated by the educator. The highest proportions of visitor-initiated conversations were recorded as ‘surface level’ engagement or ‘other’ (Table 2). A higher occurrence of interactions such as ‘adult–child interactions’ (56.9% of ‘other’ interaction) and ‘touching or moving artefacts’ (84.4% of ‘other’ interaction) can be attributed to the high proportion of family groups visiting the touch table, as these interactions are likely to involve children.
The lack of conversations falling under the category of ‘deeper level’ engagement may be related to the variety of group types visiting the touch table. It could be expected that deeper levels of conversation would be initiated by adults, meaning they would more often be initiated by the group types more likely to be comprised of adults (couples, groups and individuals). Family groups made up the remainder of observed groups, and although family groups always consisted of at least one adult, observations suggested that the role of the adult was supervising the children and encouraging the children to learn at their own level.
The distinction of conversation topics initiated by the visitor is also important to note. Although the educator would always include deeper topics such as IUCN Red List status, conservation issues and behaviour change when engaging, in the present study we did not investigate the effectiveness of this element of delivery, rather we sought to identify whether visitors were themselves initiating conversations categorised as ‘deeper level’ engagement. This is important, as it has been noted that learning depends on the previous knowledge and experience visitors bring with them [39], meaning visitors would be more likely to initiate conversations that could be classed as ‘deeper level’ engagement if they had pre-existing knowledge to help them do it. Only 27.2% of visitor-initiated conversations consisted of ‘deeper level’ engagement. The reasons for this could be multifactorial. As discussed above, distractions are rife in informal education opportunities, e.g., waiting for a child, display of charismatic species, etc. Visitors may have been unmotivated to initiate ‘deeper level’ conversations themselves, as interacting with a touch table may not be compatible with the main motivation most visitors have for attending a visitor attraction—spending time with family and friends [40,41]. Regardless of the driver, the relatively low figure highlights the importance of zoological collections in providing a relaxed and enjoyable opportunity for visitors to have these conversations that help visitors fulfil their desired outcomes, in addition to raising the baseline knowledge levels of those who do not come with prior knowledge of conservation issues. This in turn could lead to more in depth and meaningful interactions in the future.
4.5. COVID-19 and the Future of Touch Tables
This study has shown the value of touch tables in terms of engagement; however, the study was conducted pre-pandemic. Following many zoo closures during the COVID-19 pandemic, collections are likely to prioritise visitor activities that generate revenue, exacerbating previously acknowledged resource issues. Nevertheless, the value of visitor engagement should not be overlooked. During the crisis, people connected with nature on a deeper level [42], so there may now be an opportunity to use the momentum to continue this connection and engage with people while they may be open to learning more about the natural world. This study could be used to help adapt similar offerings across other zoological collections to optimise dwell time and engagement whilst being delivered in a ‘COVID-secure’ manner. Content could be shaped around popular but distanced interactions such as ‘answer questions’, ‘name artefacts’ and ‘ask questions regarding the artefacts’. Requirements for distancing, one-way systems and timed arrival slots on site also lend themselves to smaller groups experiencing a ‘no touch table’, where educators hold artefacts up but do not allow contact. This could be experienced one group at a time, as opposed to ‘growing the show’.
4.6. Limitations and Future Studies
To further expand the evaluation of touch tables in zoological collections, future studies would benefit from addressing some of the limitations of this study. For example, this present study is naturally limited by being observational [28]. Although consistent evaluator and educator training was implemented to reduce issues with observer bias, keeping one evaluator and one educator for the duration of the study would have reduced this further; however, this must be balanced with the realities of running a zoological collection. Additional studies that directly engage with visitors via survey or interview could allow for further demographic information and a deeper understanding of the impacts of engaging with informal education provisions. The limitations of the present study relating to understanding visitor motivations for engaging with informal education provisions would also benefit from further investigation. Qualitatively assessing visitor response to educator-initiated ‘deeper level’ conversation would give a more complete insight into visitor experiences at a touch table. It would also be beneficial to further investigate ‘adult–child interactions’, as the present study limits this to ‘other’ conversation types, e.g., asking where the family were going next, rather than acknowledging that these interactions could also have been undertaken at a ‘surface’ or ‘deeper’ level, e.g., a child telling an adult a fact they already knew related to the touch table. Further research might also address some of the limitations of the present study by testing different variables associated with a touch table, e.g., size, content and theme, set against similar parameters, e.g., engagement level and dwell time.
5. Conclusions
Continued research into the effectiveness of education provisions gives an opportunity to continually monitor educational success and make informed changes to the programme when necessary [16,25,43]. This study has identified that dwell time and engagement level at a touch table are dependent on a number of factors. The group type and location impacted both dwell time and engagement, whereas the season and educator affected dwell time, as did engagement level. The more engaged a group was, the longer they stayed at a touch table. ‘Deeper level’ conversations were not initiated by visitors as frequently as ‘surface level’ and ‘other’ conversations. Considering the relationship between prior knowledge and on-site learning documented in the literature, it is important for collections to consider learning more about pre-existing visitor knowledge to ensure delivery is tailored appropriately. Alongside careful consideration of location, staff training and deployment across seasons, this finding can help ensure touch tables can be an effective informal education tool throughout the zoological community.
Author Contributions
Conceptualization, B.J.; methodology, B.J.; formal analysis, N.D., E.S., writing—original draft preparation, N.D., writing—review and editing, N.D., E.S., B.J. All authors have read and agreed to the published version of the manuscript.
Funding
This research received no external funding.
Institutional Review Board Statement
The study was conducted in accordance with Knowsley Safari’s Research Policy and was approved by Knowsley Safari’s ethics committee prior to commencement. No personal or identifiable information about the visitors was recorded. Engaging with the touch table was a free choice activity that visitors could choose whether to participate in. Information is displayed on the KS webpages regarding visitor research carried out on site.
Informed Consent Statement
Informed consent was obtained from all subjects involved in the study.
Data Availability Statement
Data is available upon reasonable request from the corresponding author.
Acknowledgments
The authors would like to thank the Learning and Discovery team at Knowsley Safari for delivering the touch table content and assisting with the data collection necessary for this study.
Conflicts of Interest
The authors declare no conflict of interest.
References
- Carr, N.; Cohen, S. The public face of zoos: Images of Entertainment, education and conservation. Anthrozoös 2011, 24, 175–189. [Google Scholar] [CrossRef] [Green Version]
- Miller, B.; Conway, W.; Reading, R.P.; Wemmer, C.; Wildt, D.; Kleiman, D.; Monfort, S.; Rabinowitz, A.; Armstrong, B.; Hutchins, M. Evaluating the Conservation Mission of Zoos, Aquariums, Botanical Gardens, and Natural History Museums. Conserv. Biol. 2004, 18, 86–93. [Google Scholar] [CrossRef]
- WAZA. Building a Future for Wildlife—The World Zoo and Aquarium Conservation Strategy; World Aquarium and Zoo Association (WAZA) Executive Office: Gland, Switzerland, 2005. [Google Scholar]
- Lindermann-Matthies, P.; Kamer, T. The influence of an interactive educational approach on visitors learning in a Swiss zoo. Sci. Educ. 2006, 90, 216–315. [Google Scholar]
- Tribe, A.; Booth, R. Assessing the Role of Zoos in Wildlife Conservation. Hum. Dimens. Wildl. 2003, 8, 65–74. [Google Scholar] [CrossRef]
- Balmford, A.; Leader-Williams, N.; Mace, G.M.; Manica, A.; Walter, O.; West, C.; Zimmermann, A. Message received? Quantifying the impact of informal conservation education on adults visiting UK zoos. In Catalysts for Conservation: A Direction for Zoos in the 21st Century, Illustrated ed.; Cambridge University Press: London, UK, 2007; Volume 15, pp. 120–136. [Google Scholar]
- Marino, L.; Malamud, R.; Nobis, N.; Broglio, R.; Lilienfeld, S. Do Zoos and Aquariums Promote Attitude Change in Visitors? A Critical Evaluation of the American Zoo and Aquarium Study. Soc. Anim. 2010, 18, 126–138. [Google Scholar]
- DEFRA. Conservation and Education Measures. The Secretary of State’s Standards of Modern Zoo Practice. Available online: https://www.gov.uk/government/publications/secretary-of-state-s-standards-of-modern-zoo-practice (accessed on 21 January 2021).
- Hutchins, M.; Smith, B. Characteristics of a world-class zoo or aquarium in the 21st century. Int. Zoo Yearb. 2003, 38, 130–141. [Google Scholar] [CrossRef]
- Rabb, G.B.; Saunders, C.D. The future of zoos and aquariums: Conservation and caring. Int. Zoo Yearb. 2005, 39, 1–26. [Google Scholar] [CrossRef]
- Hosey, G.; Melfi, V.; Pankhurst, S. Zoo Animals: Behaviour, Management, and Welfare, 2nd ed.; Oxford University Press: New York, NY, USA, 2013. [Google Scholar]
- Moss, A.; Jensen, E.; Gusset, M. Evaluating the Contribution of Zoos and Aquariums to Aichi Biodiversity Target 1. Conserv. Biol. 2015, 29, 537–544. [Google Scholar] [CrossRef]
- Pavitt, B.; Moss, A. Assessing the effect of zoo exhibit design on visitor engagement and attitudes towards conservation. J. Zoo Aquar. Res. 2019, 7, 186–194. [Google Scholar]
- Tofield, S.; Coll, R.K.; Vyle, B.; Bolstad, R. Zoos as a source of free choice learning. Res. Sci. Technol. Educ. 2003, 21, 67–99. [Google Scholar] [CrossRef]
- BIAZA (British and Irish Association of Zoos and Aquariums). BIAZA Conservation Education Guidelines. Available online: https://www.bristolzoo.org.uk/cmsassets/heroes/BIAZA-Conservation-Education-Guidelines-2018.pdf (accessed on 21 January 2020).
- Gutierrez de white, T.; Jacobson, S.K. Evaluating Conservation education programs at a South American Zoo. J. Environ. Educ. 1994, 25, 18–22. [Google Scholar] [CrossRef]
- Falk, J.; Heimlich, J.; Vernon, C.; Bronnenkant, K. Critique of a Critique: Do Zoos and Aquariums Promote Attitude Change in Visitors? Soc. Anim. 2010, 18, 415–419. [Google Scholar] [CrossRef]
- Moss, A.; Esson, M. The educational claims of zoos: Where do we go from here? Zoo Biol. 2013, 32, 13–18. [Google Scholar] [CrossRef] [PubMed]
- ADAS (ADAS UK Ltd). Review of Zoos’ Conservation and Education Contribution. Available online: https://lwecext.rl.ac.uk/PDF/RES16756_final_report.pdf (accessed on 21 January 2020).
- Patrick, P.G.; Matthews, C.E.; Ayers, D.F.; Tunnicliffe, S.D. Conservation and Education: Prominent Themes in Zoo Mission Statements. J. Environ. Educ. 2007, 38, 53–60. [Google Scholar] [CrossRef]
- Jensen, E. Critical Review of Conservation Education and Engagement Practices in European Zoos and Aquaria. Available online: https://warwick.ac.uk/fac/soc/sociology/staff/jensen/ericjensen/durrell_critical_review_and_meta-analysis_handover_reduced_pic_size_96ppi.pdf (accessed on 21 January 2020).
- Senior, A. About—Crew Training. Available online: https://crewtraining.uk.net/about/ (accessed on 21 January 2020).
- Anderson, U.S.; Kelling, A.S.; Pressley-Keough, R.; Bloomsmith, M.A.; Maple, T.L. Enhancing the Zoo Visitor’s Experience by Public Animal Training and Oral Interpretation at an Otter Exhibit. Environ. Behav. 2003, 35, 826–841. [Google Scholar] [CrossRef]
- Moss, A.; Francis, D.; Esson, M. The Relationship between Viewing Area Size and Visitor Behavior in an Immersive Asian Elephant Exhibit. Visit. Stud. 2008, 11, 26–40. [Google Scholar] [CrossRef]
- Moss, A.; Esson, M.; Bazley, S. Applied Research and Zoo Education: The Evolution and Evaluation of a Public Talks Program using Unobtrusive Video Recording of Visitor Behavior. Visit. Stud. 2010, 13, 23–40. [Google Scholar] [CrossRef]
- Bowler, M.; Buchanan-Smith, H.; Whiten, A. Assessing Public Engagement with Science in a University Primate Research Centre in a National Zoo. PLoS ONE 2012, 7, e34505. [Google Scholar] [CrossRef] [PubMed] [Green Version]
- Morris Hargreaves McIntyre. Attracting Audiences Year-Round; Internal Document; Morris Hargreaves McIntyre: New York, NY, USA, 2018; pp. 1–59. [Google Scholar]
- Diamond, J.; Jessica, J.; Uttal, D.H. Practical Evaluation Guide: Tool for Museums and Other Informal Educational Settings, 3rd ed.; Rowman & Littlefield: London, UK, 2009. [Google Scholar]
- Major, K. Palm Oil: Shock Tactics or Happy Optimism. Evaluating a Behaviour Change Campaign. Available online: https://biaza.org.uk/projects/detail/using-rangers-to-deliver-a-zoo-based-behaviour-change-campaign-on-sustainable-palm-oil (accessed on 21 January 2020).
- Perdue, B.M.; Stoinski, T.S.; Maple, T.L. Using Technology to Educate Zoo Visitors About Conservation. Visit. Stud. 2012, 15, 16–27. [Google Scholar] [CrossRef]
- Aylen, J.; Albertson, K.; Cavan, G. The impact of weather and climate on tourist demand: The case of Chester Zoo. Clim. Chang. 2014, 127, 183–197. [Google Scholar] [CrossRef]
- Perkins, D.R.; Debbage, K.G. Weather and tourism: Thermal comfort and zoological park visitor attendance. Atmosphere 2016, 7, 44. [Google Scholar] [CrossRef] [Green Version]
- Whitehouse, J.; Waller, B.; Chanvin, M.; Wallace, E.; Schel, A.; Peirce, K.; Mitchell, H.; Macri, A.; Slocombe, K. Evaluation of Public Engagement Activities to Promote Science in a Zoo Environment. PLoS ONE 2014, 9, e113395. [Google Scholar] [CrossRef] [PubMed] [Green Version]
- Ross, S.R.; Lukas, K.E. Zoo visitor behaviour at an African ape exhibit. Visit. Stud. Today 2005, 8, 4–12. [Google Scholar]
- Park, E.S.; Hinsz, V.B. “Strength and safety in numbers”: A theoretical perspective on group influences on approach and avoidance motivation. Motiv. Emot. 2006, 30, 135–142. [Google Scholar] [CrossRef]
- Francis, D.; Esson, M.; Moss, A. Following visitors and what it tells us. IZE (Int. Zoo Educ. Assoc.) J. 2005, 43, 20–24. [Google Scholar]
- Ballantyne, R.; Packer, J.; Hughes, K.; Dierking, L. Conservation learning in wildlife tourism settings: Lessons from research in zoos and aquariums. Environ. Educ. Res. 2007, 13, 367–383. [Google Scholar] [CrossRef]
- Mony, P.R.S.; Heimlich, J.E. Talking to Visitors about Conservation: Exploring Message Communication through Docent–Visitor Interactions at Zoos. Visit. Stud. 2008, 11, 151–162. [Google Scholar] [CrossRef]
- Rennie, L.J. Measuring affective outcomes from a visit to a science education centre. Res. Sci. Educ. 1994, 24, 261–269. [Google Scholar] [CrossRef]
- MacDonald, S. The Active Audience and the politics of appropriation. In Behind the Scenes at the Science Museum; MacDonald, S., Ed.; Berg: New York, NY, USA, 2020; pp. 217–243. [Google Scholar]
- Pekarik, A.; Doering, Z.; Karns, D. Exploring satisfying experiences in museums. Curator 1999, 42, 152–173. [Google Scholar] [CrossRef] [Green Version]
- Rousseau, S.; Deschacht, N. Public Awareness of Nature and the Environment During the COVID-19 Crisis. Env. Resour. Econ 2020, 76, 1149–1159. [Google Scholar] [CrossRef]
- Roe, K.; McConney, A.; Mansfield, C. Using evaluation to prove or to improve? An international, mixed method investigation into zoos’ education evaluation practices. J. Zoo Aquar. Res. 2014, 2, 108–116. [Google Scholar]
Figure 1.
Map showing the two locations where the touch table was set up. 1 = rides; 2 = tiger trail (www.google.co.uk/maps/, accessed on 19 January 2020).
Figure 1.
Map showing the two locations where the touch table was set up. 1 = rides; 2 = tiger trail (www.google.co.uk/maps/, accessed on 19 January 2020).

Figure 2.
Photograph showing example setup of the touch table. Educators would stand directly behind the table delivering information to visitors and the evaluator would stand out of the way within earshot of the conversation.
Figure 2.
Photograph showing example setup of the touch table. Educators would stand directly behind the table delivering information to visitors and the evaluator would stand out of the way within earshot of the conversation.

Figure 3.
Average dwell times of different group types at the touch table. Error bars denote 95% confidence intervals.
Figure 3.
Average dwell times of different group types at the touch table. Error bars denote 95% confidence intervals.

Figure 4.
Average dwell times of visitors engaging at different engagement levels with the educator. Error bars denote 95% confidence intervals.
Figure 4.
Average dwell times of visitors engaging at different engagement levels with the educator. Error bars denote 95% confidence intervals.

Figure 5.
Percentages of groups observed displaying different engagement levels (1–4 detailed in Table 1) over the four group types.
Figure 5.
Percentages of groups observed displaying different engagement levels (1–4 detailed in Table 1) over the four group types.

Figure 6.
Percentages of visitors that took part in three different conversation types.


Table 1.
Pre-defined categories for engagement level, adapted from an engagement scale used to assess visitors’ engagement with exhibits [28].
Table 1.
Pre-defined categories for engagement level, adapted from an engagement scale used to assess visitors’ engagement with exhibits [28].
| Engagement Category | Definition |
|---|---|
| Visitor pauses briefly, glances at one or more items on the touch table but does not engage with the educator. |
| Visitor stops, interacts with artefacts on the table, touching or pointing to items but does not engage with the educator. |
| Visitor stops, interacts with artefacts on table, touching and holding items, is somewhat engaged and focused on what the educator is saying, takes part in some activities. |
| Visitor stops, interacts with artefacts on the table, touching and holding items, is engaged and listening to what the educator is saying, interacts with the educator and is focused, answers questions and engaging with activities. |
Table 2.
Pre-defined categories for conversation topics at the Touch Table adapted from previous literature [13].
Table 2.
Pre-defined categories for conversation topics at the Touch Table adapted from previous literature [13].
| Conversation Topic | Conversation Type |
|---|---|
| Surface level engagement |
| |
| |
| Deeper level engagement |
| |
| |
| |
| |
| |
| Other response |
| |
| |
| |
| |
|
Publisher’s Note: MDPI stays neutral with regard to jurisdictional claims in published maps and institutional affiliations. |
© 2021 by the authors. Licensee MDPI, Basel, Switzerland. This article is an open access article distributed under the terms and conditions of the Creative Commons Attribution (CC BY) license (https://creativecommons.org/licenses/by/4.0/).
Share and Cite
MDPI and ACS Style
Davies, N.; Sowerby, E.; Johnson, B. Assessing the Impacts of Engaging with a Touch Table on Safari Park Visitors. J. Zool. Bot. Gard. 2021, 2, 370-381. https://0-doi-org.brum.beds.ac.uk/10.3390/jzbg2030026
AMA Style
Davies N, Sowerby E, Johnson B. Assessing the Impacts of Engaging with a Touch Table on Safari Park Visitors. Journal of Zoological and Botanical Gardens. 2021; 2(3):370-381. https://0-doi-org.brum.beds.ac.uk/10.3390/jzbg2030026
Chicago/Turabian StyleDavies, Naomi, Ellie Sowerby, and Bridget Johnson. 2021. "Assessing the Impacts of Engaging with a Touch Table on Safari Park Visitors" Journal of Zoological and Botanical Gardens 2, no. 3: 370-381. https://0-doi-org.brum.beds.ac.uk/10.3390/jzbg2030026