Communication

Non-Invasive Monitoring of the Spatio-Temporal Dynamics of Vocalizations among Songbirds in a Semi Free-Flight Environment Using Robot Audition Techniques

1
Graduate School of Informatics, Nagoya University, Nagoya 464-8601, Japan
2
School of Engineering, Tokyo Institute of Technology, Tokyo 152-8552, Japan
3
Honda Research Institute Japan Co. Ltd., Saitama 351-0188, Japan
4
Kyoto University, Kyoto 606-8501, Japan
5
Future Robotics Organization, Waseda University Tokyo, Tokyo 169-8555, Japan
*
Author to whom correspondence should be addressed.
Submission received: 5 March 2021 / Revised: 15 April 2021 / Accepted: 16 April 2021 / Published: 21 April 2021
(This article belongs to the Special Issue Feature Papers of Birds 2021)

Abstract

:

Simple Summary

We propose a framework based on robot audition techniques for automatic and fine-scale extraction of spatial-spectral-temporal patterns of bird vocalizations in a densely populated environment. We used robot audition techniques to integrate information from multiple microphone arrays (array of arrays) deployed in an environment, which is non-invasive. We examined the ability of the method to extract active vocalizations of multiple Zebra Finches in an outdoor mesh tent as a realistic situation in which they could fly and vocalize freely, as a proof-of-concept. We found that localization results of vocalizations reflected the arrangements of landmark spots in the environment such as nests or perches. We also classified their vocalizations as either songs or calls by using a simple method based on the tempo and length of the separated sounds, as an example of the use of the information obtained from the framework.

Abstract

To understand the social interactions among songbirds, extracting the timing, position, and acoustic properties of their vocalizations is essential. We propose a framework for automatic and fine-scale extraction of spatial-spectral-temporal patterns of bird vocalizations in a densely populated environment. For this purpose, we used robot audition techniques to integrate information (i.e., the timing, direction of arrival, and separated sound of localized sources) from multiple microphone arrays (array of arrays) deployed in an environment, which is non-invasive. As a proof of concept of this framework, we examined the ability of the method to extract active vocalizations of multiple Zebra Finches in an outdoor mesh tent as a realistic situation in which they could fly and vocalize freely. We found that localization results of vocalizations reflected the arrangements of landmark spots in the environment such as nests or perches and some vocalizations were localized at non-landmark positions. We also classified their vocalizations as either songs or calls by using a simple method based on the tempo and length of the separated sounds, as an example of the use of the information obtained from the framework. Our proposed approach has great potential to understand their social interactions and the semantics or functions of their vocalizations considering the spatial relationships, although detailed understanding of the interaction would require analysis of more long-term recordings.

1. Introduction

Songbirds communicate using various vocalizations that have been classified into two main types: songs and calls. Songs are relatively long and complex vocalizations, which are used for territorial defense and courtship toward females [1]. Calls are short and simple sounds used to exchange more specific information such as warning of predators and signals for forming social bonds [2].
A population of songbirds can be regarded as a complex system in that they communicate with each other via vocalization, through which various emergent phenomena have been observed [3]. Intra-specific interactions in a population of songbirds could produce complex results and various studies have been conducted to understand their interactions. One approach for obtaining such complex vocalization and associated spatial data has been to attach a device to each bird and observe their behaviors[4,5,6]. In particular, Farine et al. investigated the social transmission of information about foraging patches by attaching passive integrated tags (PITs) to songbirds for detecting their presence and absence at bird feeders [4]. By examining the social network created by the encountering data of each individual, they suggested that the intra-specific network contributed to the transmission of feeder information rather than an inter-specific network. Gill et al. investigated call communication among Zebra Finch (Taeniopygia guttata, ZF) by using a recording technique that included attaching microphone transmitters to the birds. They found that the vocal interaction and social relationships changed along with breeding stages [5]. Although such methods enable us to obtain detailed data on contacts between individuals, they are invasive; moreover, it is difficult to obtain the exact spatial information of vocalizations while their vocal communication might depend on their spatial situations (e.g., their territories and vegetation factors) and the relationships among them [7]. For example, the distance between individuals during their vocal communication may reflect the degree of their social bonding or aggression [8].
Sound localization techniques based on a microphone array have been recognized as promising, non-invasive approaches that enable us to extract the sound direction and spatial information from the recording [9,10]. There have been several empirical studies to spatially localize or estimating the direction of arrival (DOA) bird songs using multiple microphones. Gayk and Mennill successfully estimated the position of the vocalizations of warblers on the wing using three-dimensional triangulation based on 8 microphones [11]. Mennill et al. conducted playback experiments to examine the accuracy of two-dimensional localization based on an array made up of four stereo recorders [12]. Hedley et al. conducted three-dimensional estimations of the DOAs of playback sounds using two stereo recorders, showing the ability of the system to discriminate up to four simulated birds singing simultaneously [13]. Collier et al. conducted playback tests and wild bird observation using an array of microphone arrays [14]. Also, there have been applications of sound source localization for behavioral or habitat surveys of the songbirds. Araya-Salas et al. used multiple microphones to estimate the distance between two songbirds for investigating the overlap and alternation of the vocal interaction between them [15]. Ethier and Wilson investigated the microhabitat preference of two songbird species using microphone arrays [16].
These experiments were conducted mainly in simple situations such as cases in which a sound was replayed from a loudspeaker, or a small number of individuals were vocalizing [17]. It is worth tackling the challenge of automatically capturing the spatial distribution of many bird vocalizations in a densely populated field environment, and that method could be expanded to a larger field observation if it works.
The objective of this study is to propose a framework for automatic and fine-scale extraction of spatial-spectral-temporal patterns of bird vocalizations in a densely populated environment. For this purpose, we used robot audition techniques to integrate information (i.e., the timing, duration, direction of arrival, and separated sound of localized sources) from multiple microphone arrays (array of arrays) deployed in an environment. Robot audition is a research field aiming at the construction of a robot’s auditory functions, which provides integrated audio signal processing such as sound source localization, separation, and recognition in a real environment. It is currently applied in a wide range of fields such as search and rescue by mounting arrays on unmanned aerial vehicles as well as audio-visual scene reconstruction [18,19].
We adopt Honda Research Institute Japan Audition for Robots with Kyoto University (HARK), which is an open-source robot audition software program [20,21], among a few software programs for handling sound source localization techniques [21,22,23]. This is because we can extract the spatio-temporal information of sounds (e.g., their DOAs and their timings) and separate the sounds to conduct further processing online, which is essential for robots to grasp the soundscape around them. We used HARKBird, which is a collection of Python scripts used to extend HARK to specialize in monitoring birdsongs [24,25]. HARKBird has been applied for observing behavioral patterns of songbirds on playback experiments [26,27], and for investigating the temporal dynamics of vocal communication among songbirds [28].
We devised a spatial division-based 2D localization performed by dividing the entire space in the experimental environment into several areas and selecting an appropriate pair of microphone arrays for each area for triangulation with the directional information of sources with high spectral affinity, which is to reduce the localization error caused by unsuitable positions in such a dense environment.
As a proof of concept of this framework, we examined the ability of the method to extract active vocalizations of a few Zebra Finches in an outdoor mesh tent as a realistic situation in which they could fly and vocalize freely. This species is well known as a model animal for vocal learning [29,30] of songs and uses various calls to form social relationships [5,31,32]. In addition, ZF is a colonial species and can be a good example to observe vocalizations of multiple birds in a densely populated field environment by using our approach. It is also recently pointed out that its life history or behavior might be different from many of the well-studied birds in the northern hemisphere [33].
We first conducted a recording trial of the vocalizations of ZF individuals immediately after introducing them in a tent, expecting their active vocalizations. Then we estimated the spatial distribution of their vocalizations using the proposed method. We also classified their vocalizations as either songs or calls by using a simple method based on the tempo and length of the separated sounds, as an example of the use of the information obtained from the framework.

2. Method

2.1. Experimental Setting and Recording

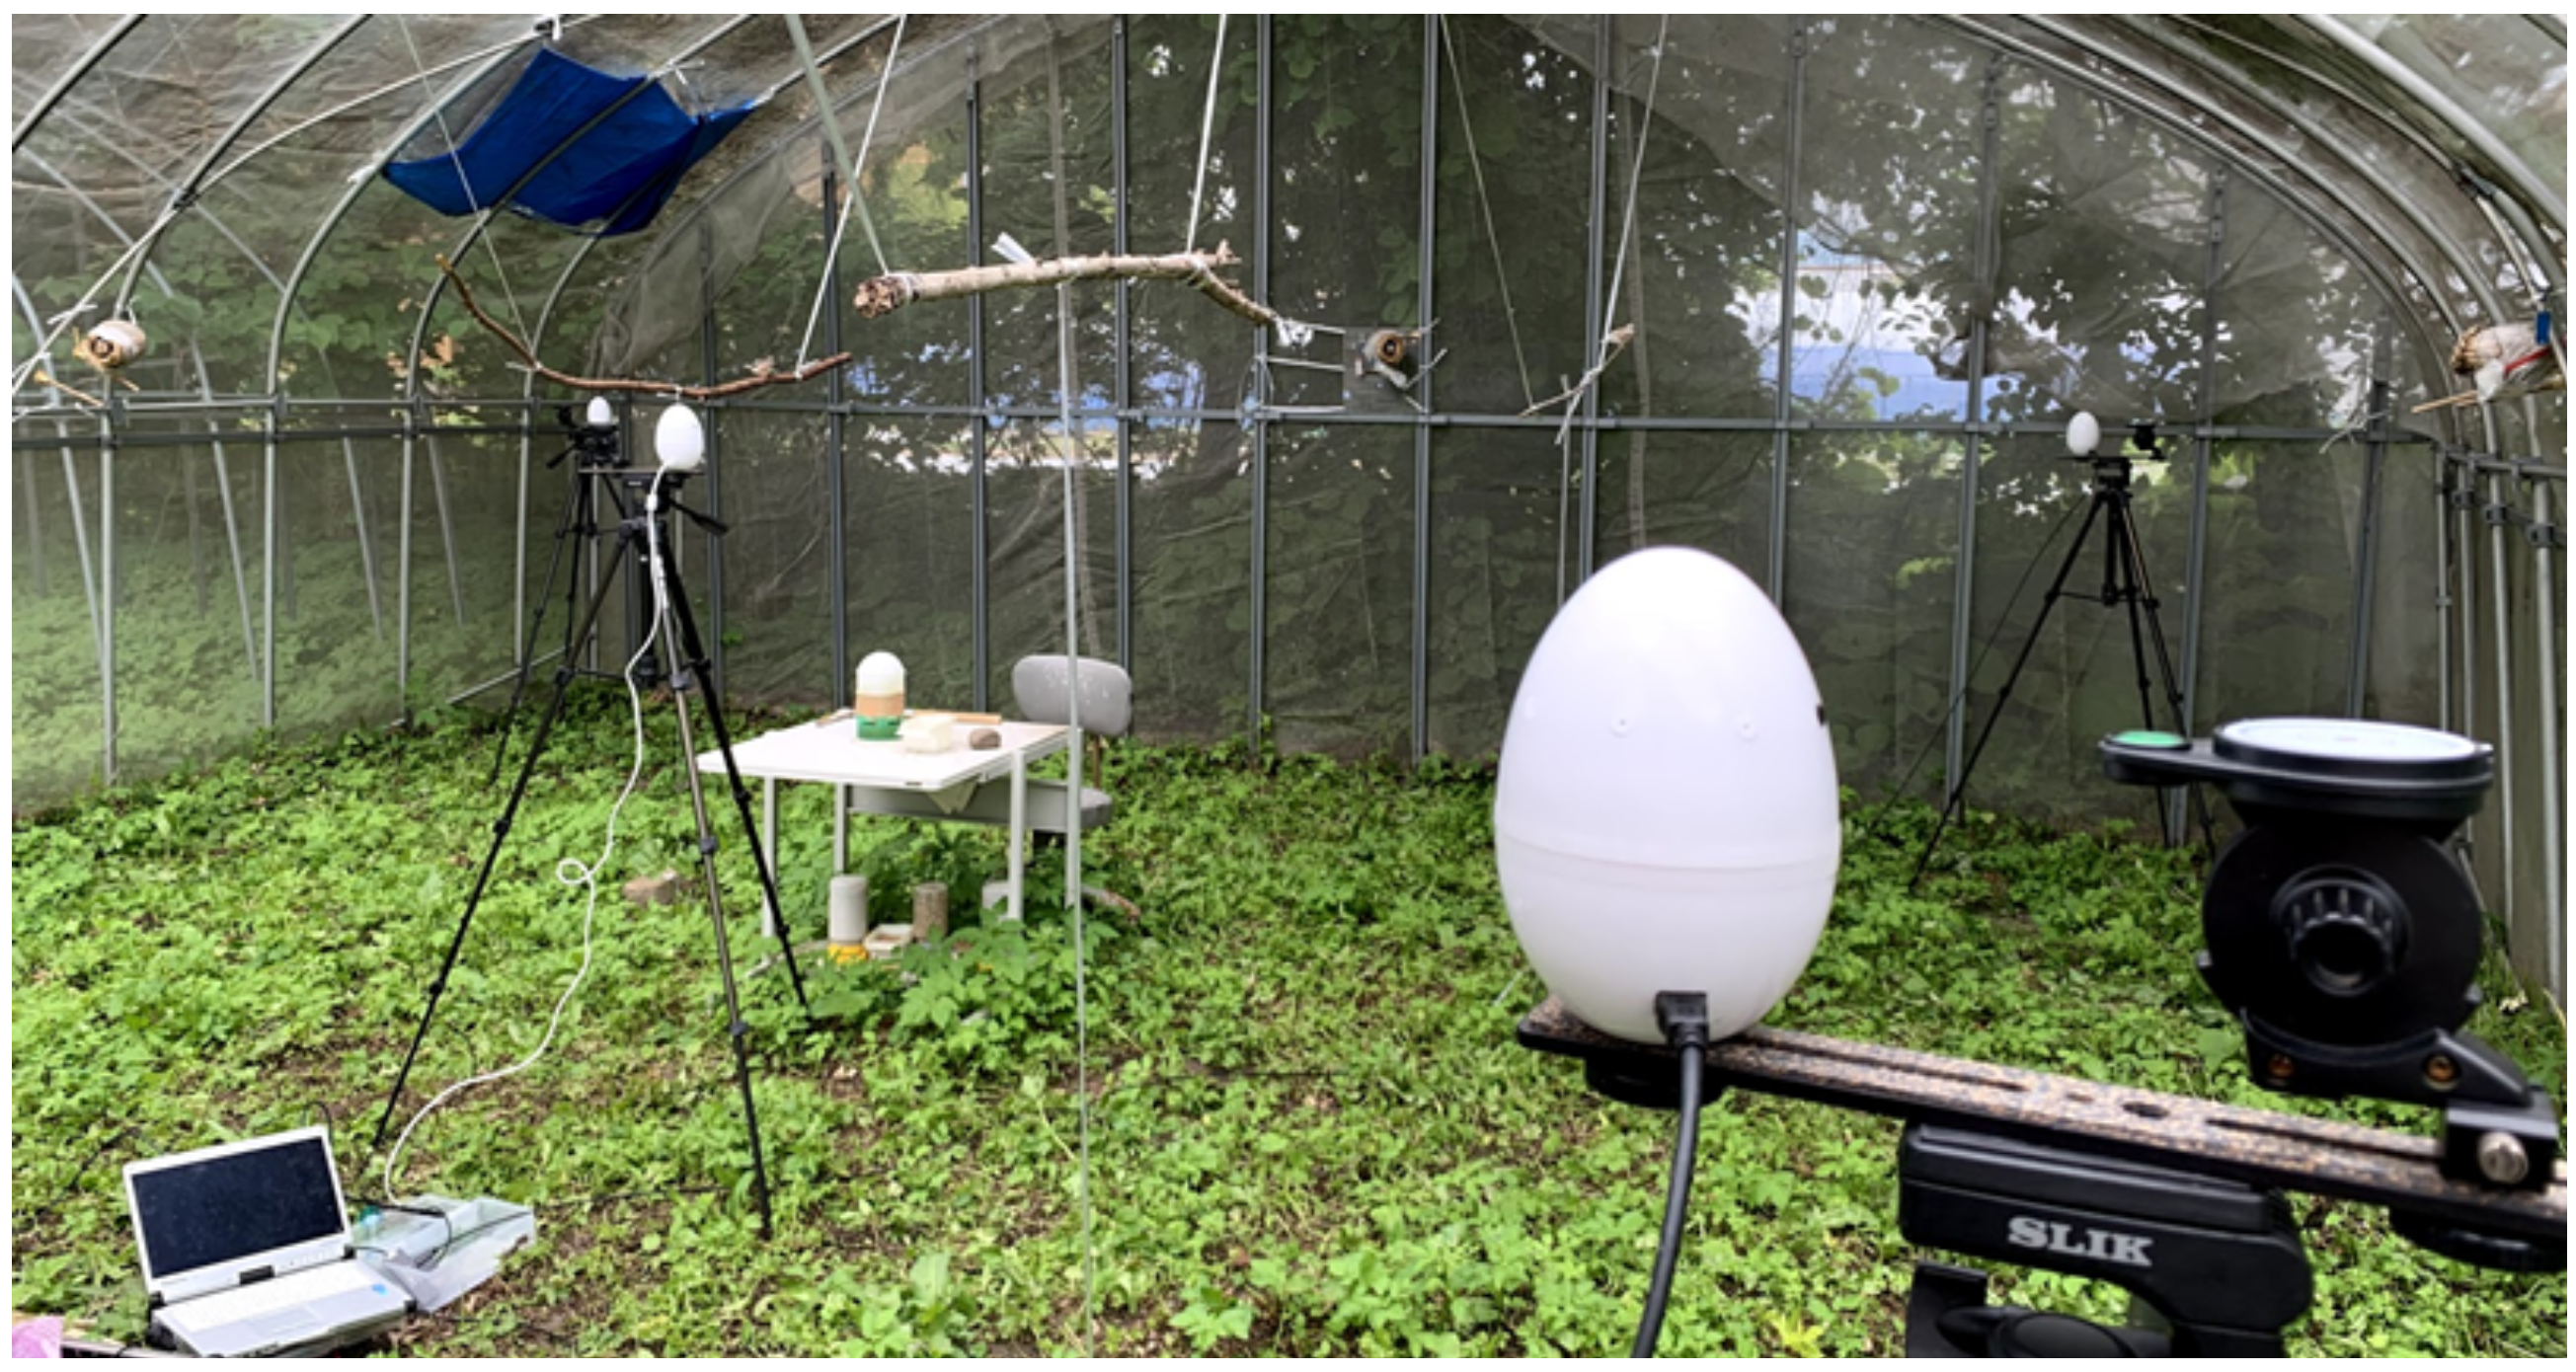
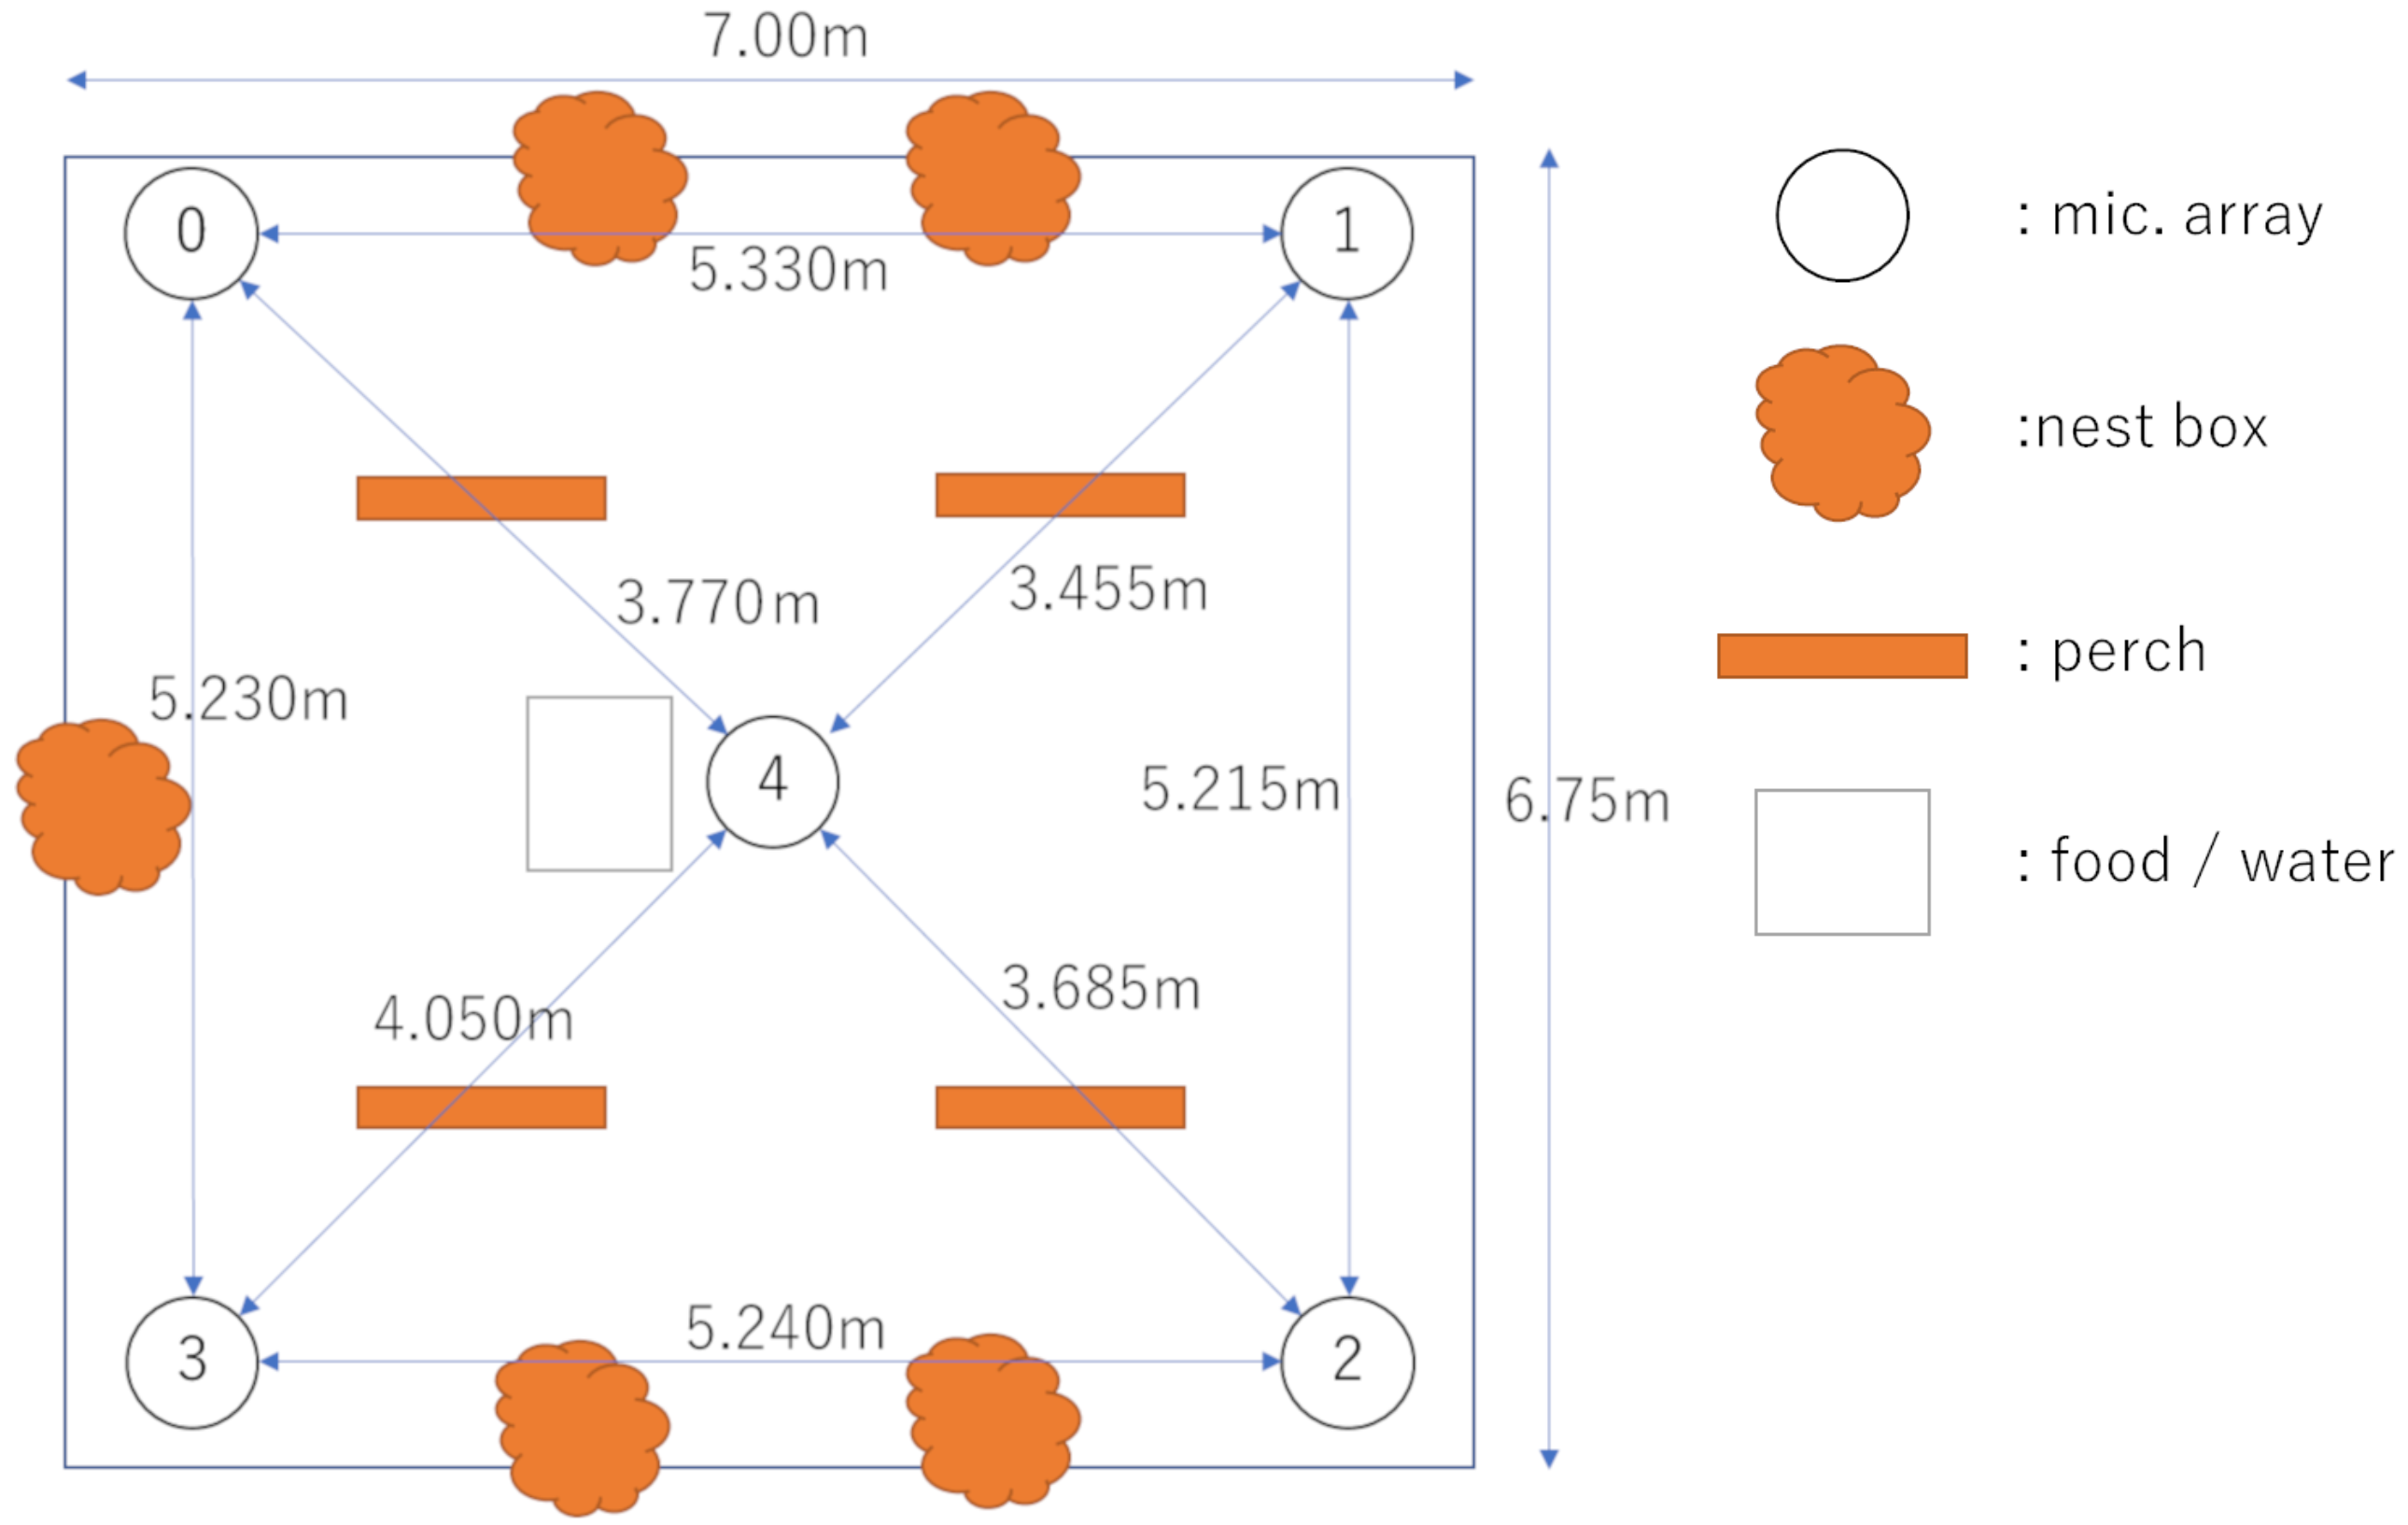
We created a recording environment in a rectangular mesh tent with dimensions of approximately 7 m × 7 m (Figure 1) set in a field on the campus of Hokkaido University (43 04 18.3  N, 141 20 28.4  E). In this environment, we arranged five straw nests and four perches approximately 1.5 m above the ground, and food and water spaces were provided near the center of the tent, as shown in Figure 2. This setting enabled the songbirds to fly around freely. We then connected five microphone arrays (TAMAGO-03, System in Frontier Inc., Tokyo, Japan) to a laptop computer (Toughbook CF-C2, Panasonic, Osaka Japan) and arranged them at the four corners and the center of the tent. The TAMAGO-03 has 8 microphones that are horizontally arranged 45 degrees apart around its egg-shaped body, which enables us to conduct 24 bit, 16 kHz recording.
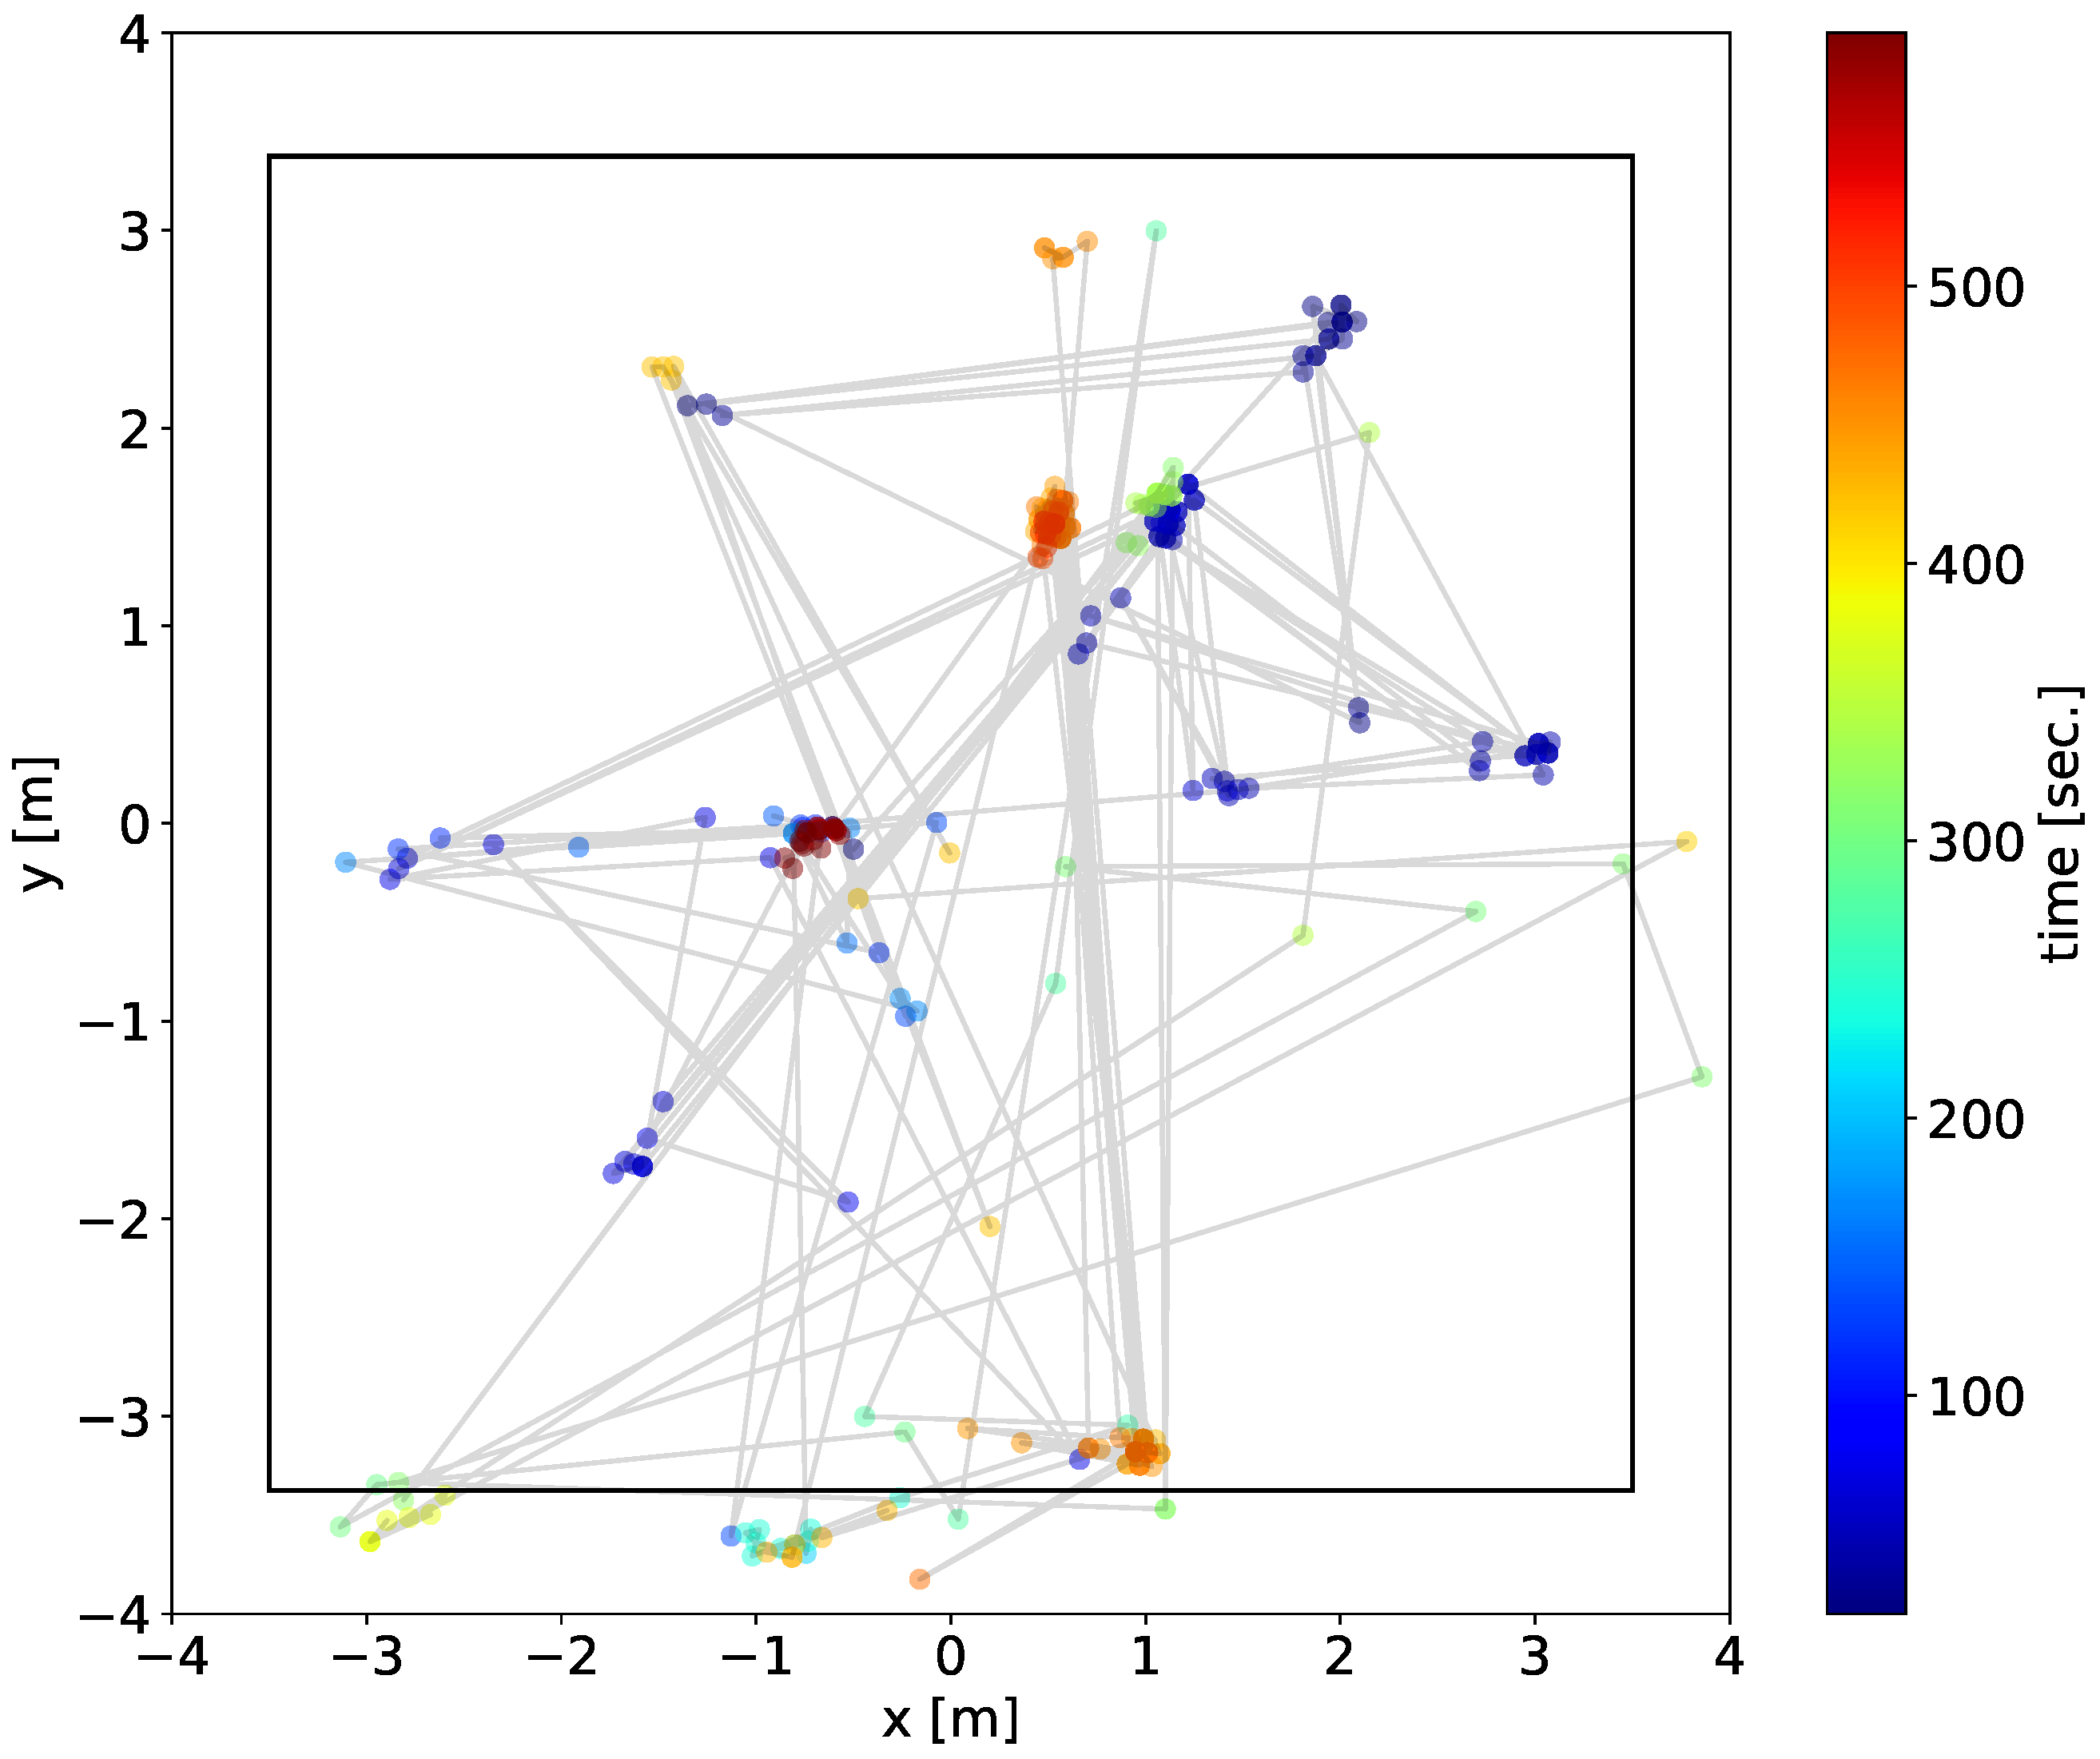
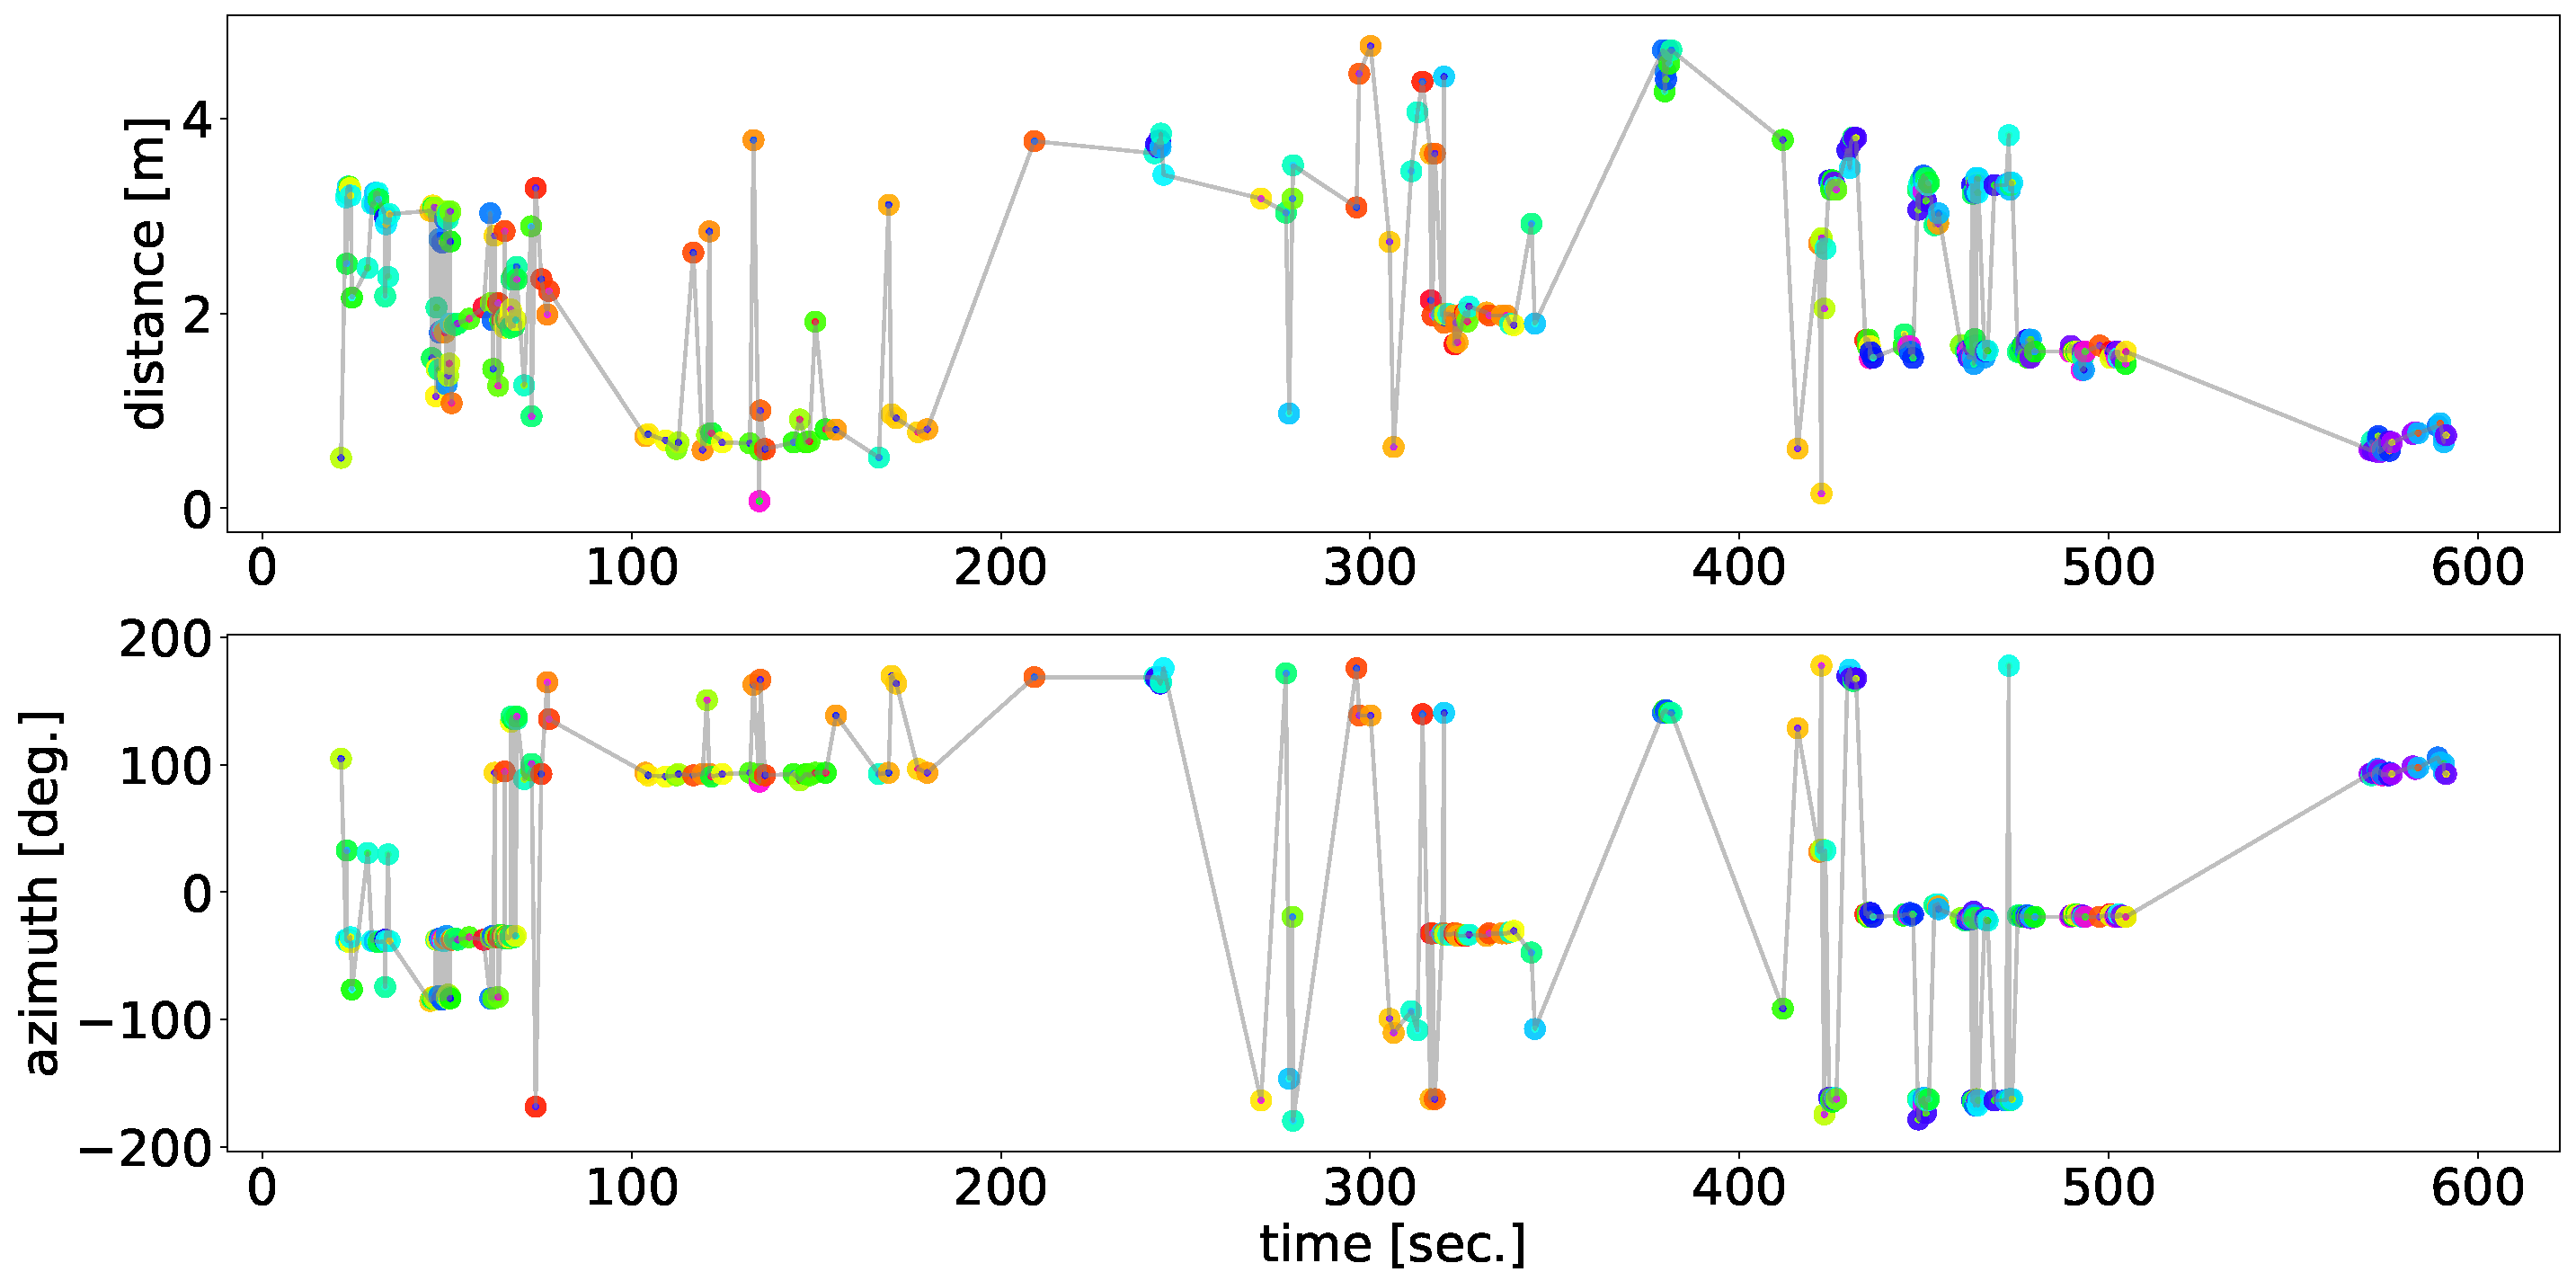
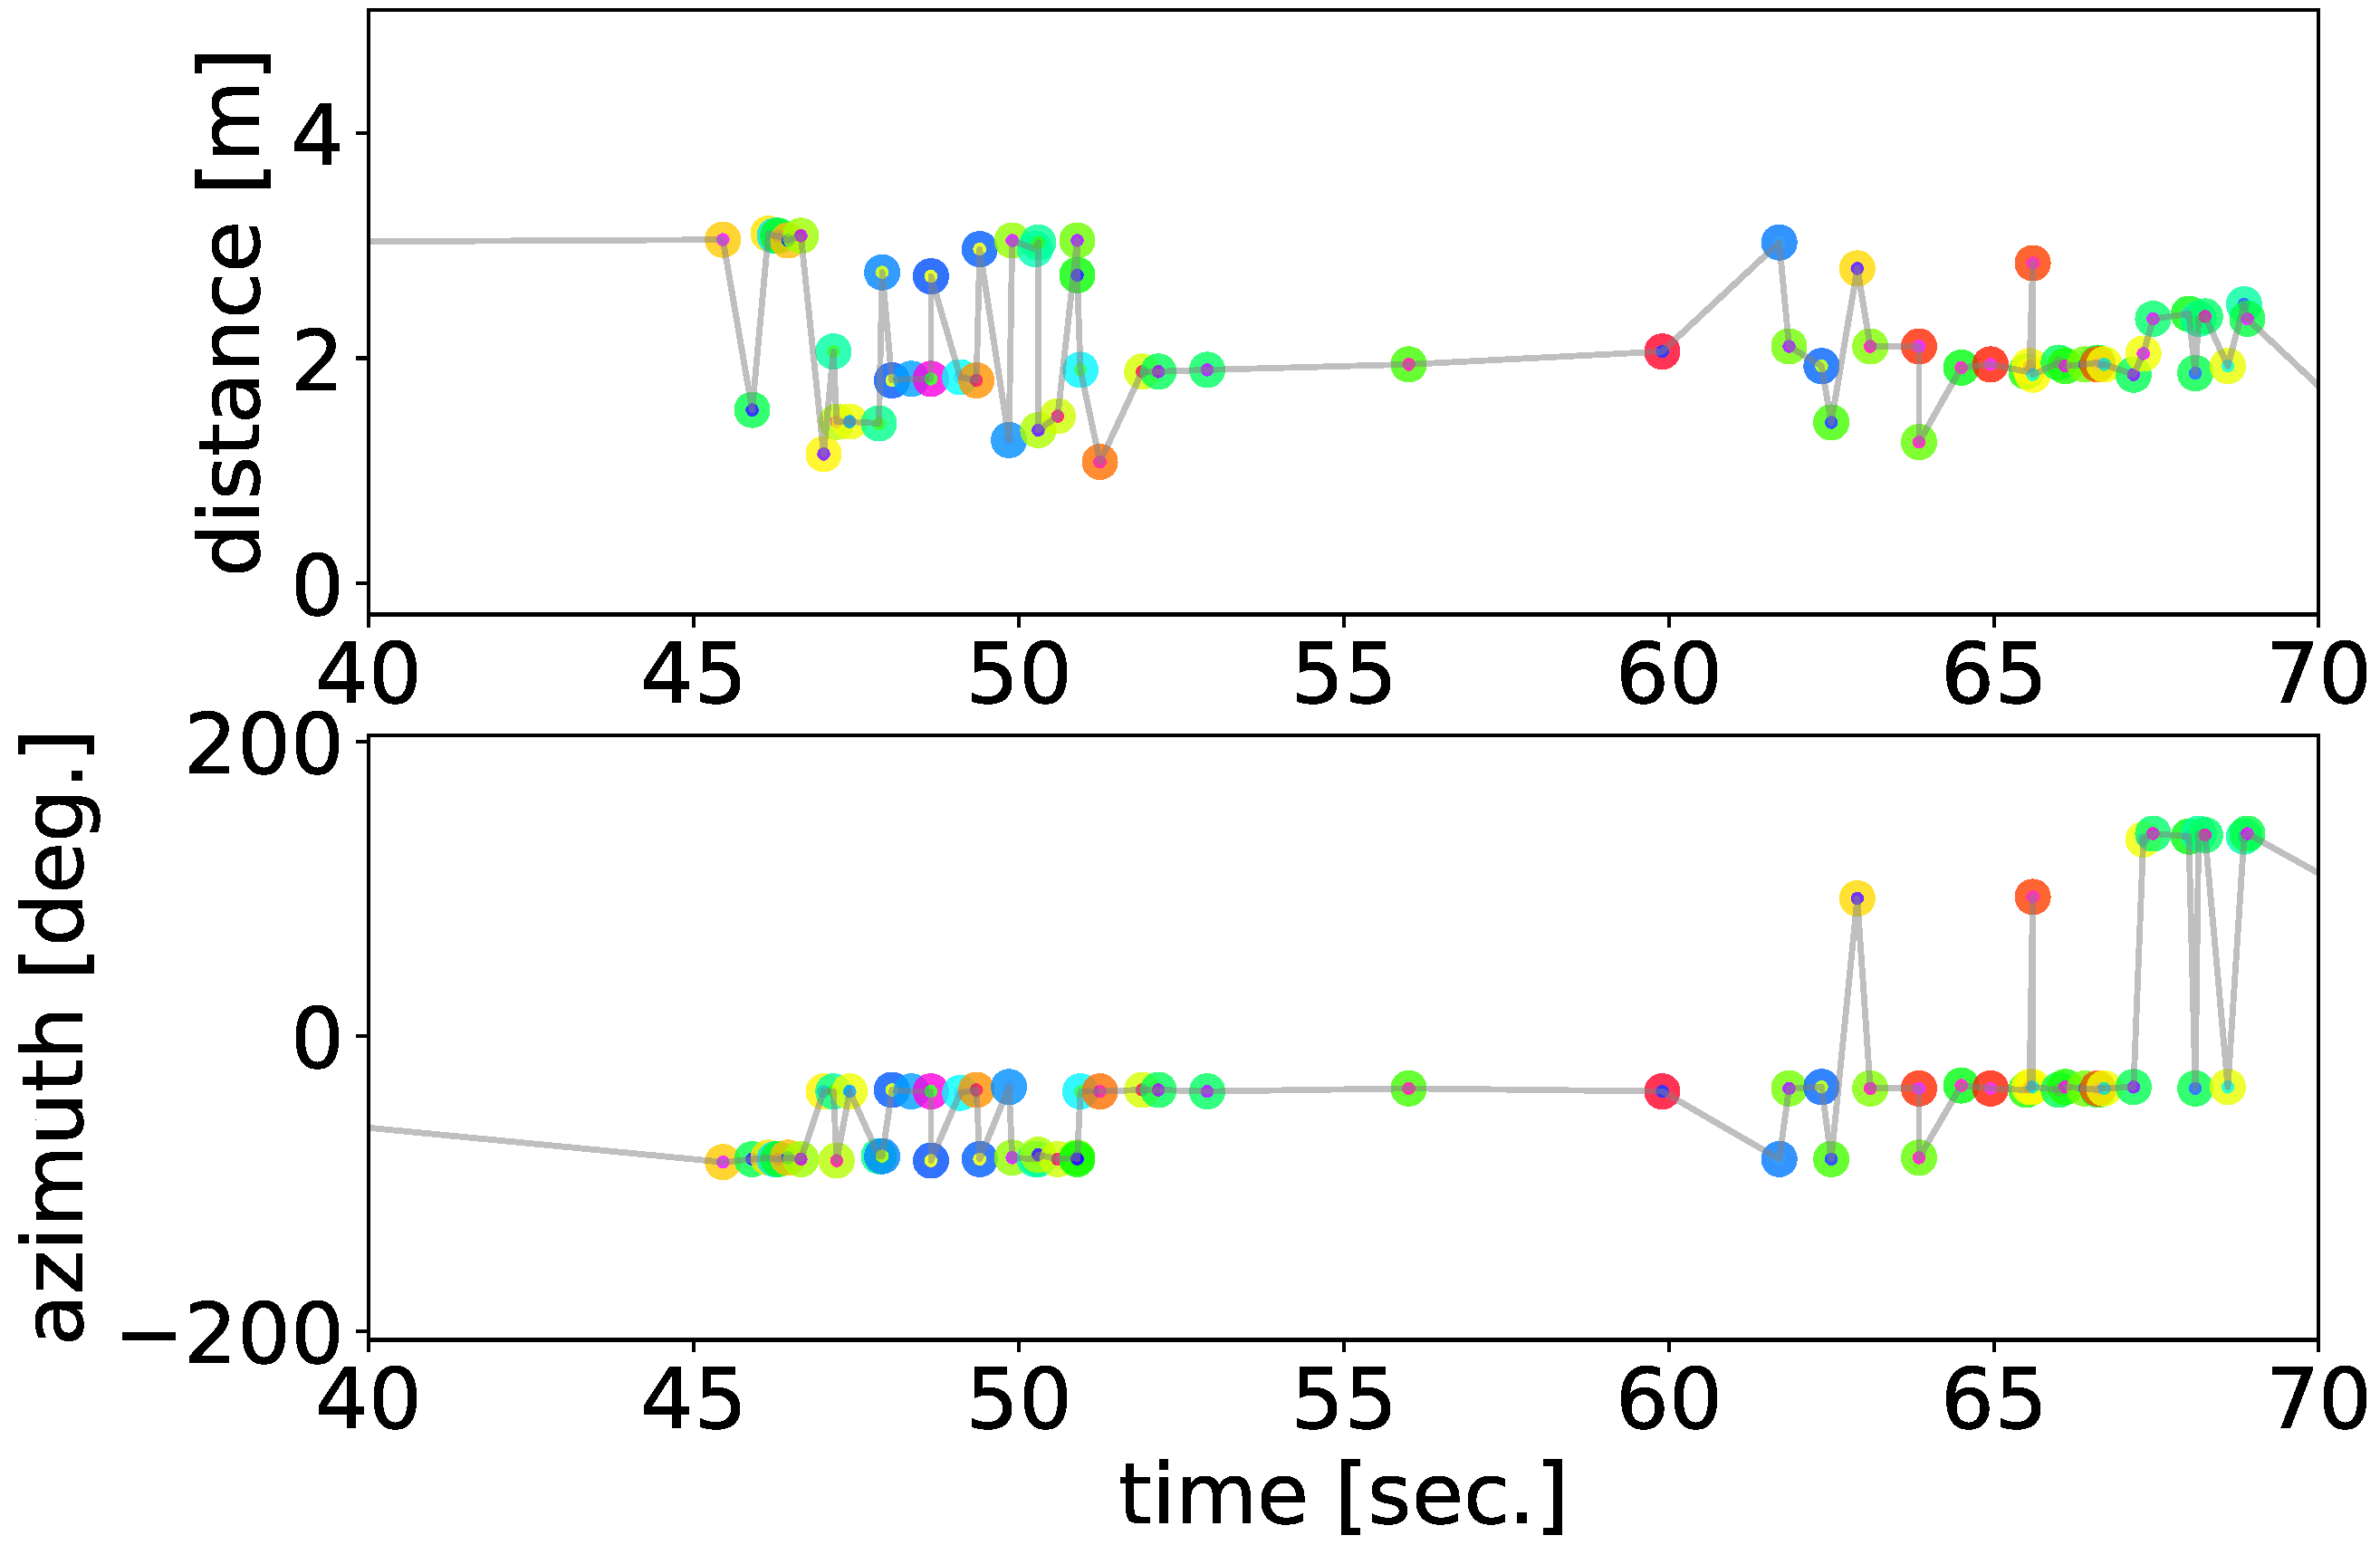
The analysis focused on a 10 min recording captured on 3 June 2019, that included five male individual ZF singing in the experimental environment. All of them were captive-bred individuals chosen from breeding facilities. They had not been familiar with each other and the recording began less than 1 h after the release of the individuals in the tent. Thus, we expected their active vocalizations (e.g., counter-singing between unfamiliar males) within a short time period. The situation in which Zebra Finches are attempting to establish social relationships is a good example for testing the potential of our method to grasp various vocalization patterns. Because these captive-bred birds tend to vocalize close to perches and nests, we expect the observed distribution of vocalizations reflects the spatial structures of perches and nests if the proposed method worked properly.

2.2. HARKBird

HARK is an open-source robot audition software program consisting of multiple modules for sound source localization, sound source separation, and automatic speech recognition of separated sounds that can be applied to any robot with any microphone configuration [21]. This software platform provides a web-based interface known as HARK designer, which is used for creating real-time signal processing software by composing a network of modules, each corresponding to a signal. We conducted localization and separation of sound sources in the recordings by each microphone array using HARKBird and obtained the DOAs and timings of the localized sound sources. HARKBird runs on Ubuntu Linux in which HARK, HARK-Python, PySide, etc. are installed. The hardware used in our system is commercially available from the developer, including the microphone array we used (TAMAGO, System in Frontier Inc., Tokyo, Japan). The software program is open-source and available online, including both HARKBird (http://www.alife.cs.i.nagoya-u.ac.jp/~reiji/HARKBird/, accessed on 20 April 2021), and the scripts (http://www.alife.cs.i.nagoya-u.ac.jp/~sumitani/HARKBird_scripts/, accessed on 20 April 2021) we used in this study.
The employed sound source localization algorithm is based on the multiple signal classification (MUSIC) method [34] using multiple spectrograms obtained by short-time Fourier transformation (STFT). The MUSIC method is a widely used high-resolution algorithm, and is based on the eigenvalue decomposition of the correlation matrix of multiple signals from a microphone array. All localized sounds are separated the sounds as wave files (16 bit, 16 kHz) using geometric high-order decorrelation-based source separation (GHDSS) [35].
We briefly reintroduce the basic functions of HARKBird [25]. 
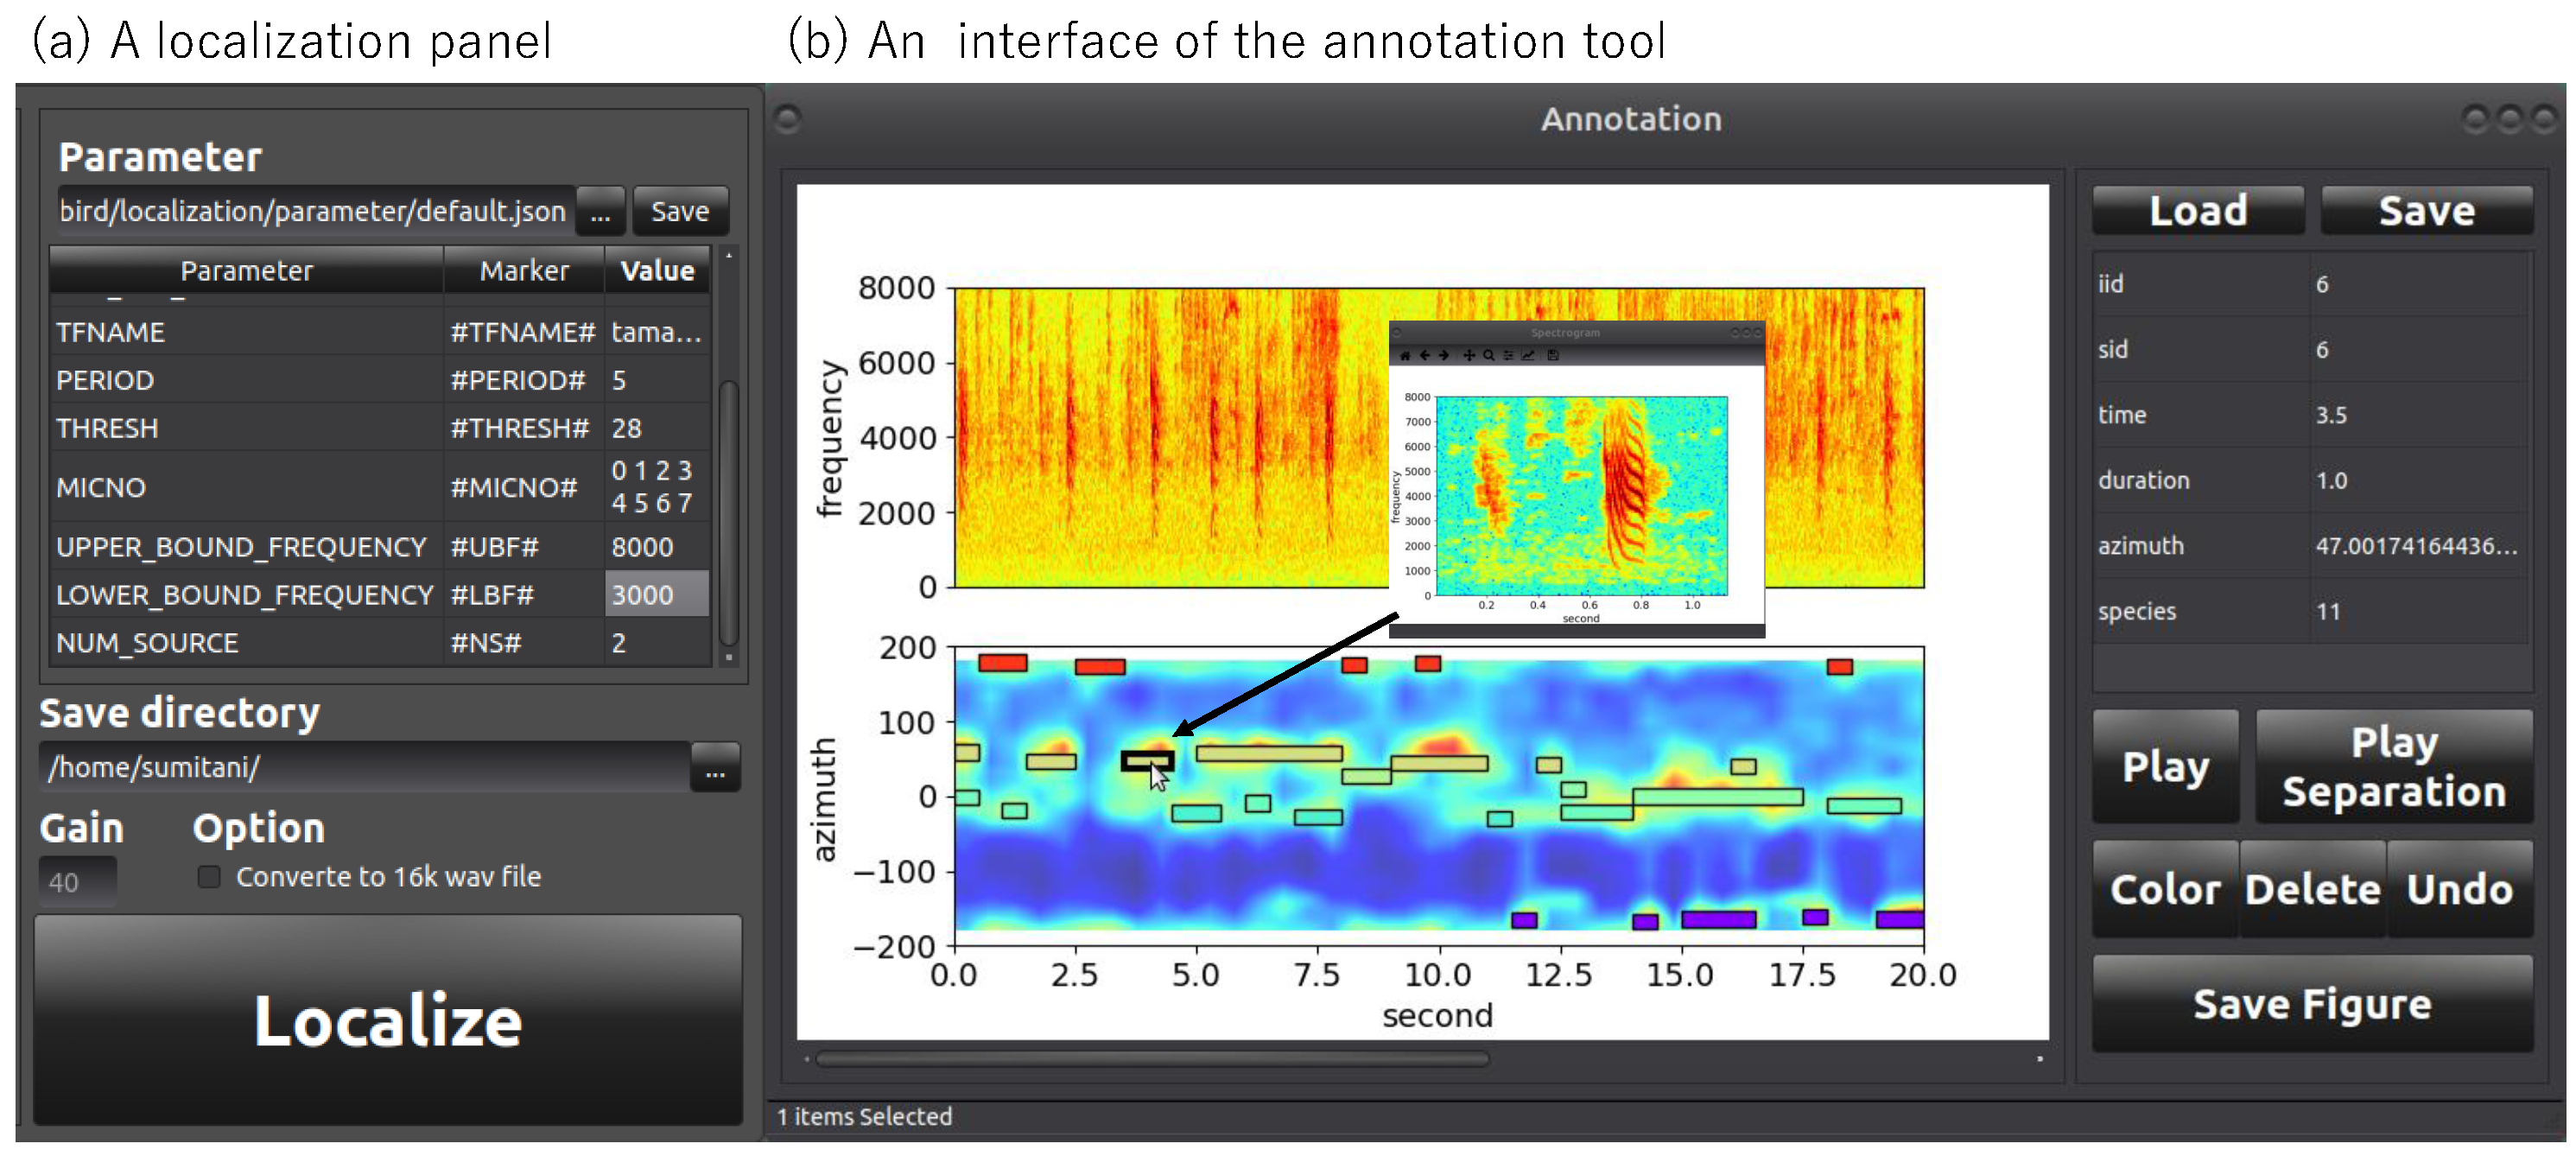
Figure 3 shows the GUI of HARKBird. In the localization panel (a), the user can set specific values of the essential parameters (explained below) related to localization and separation of bird songs using HARK, which are enumerated in a list. Additional parameters can be added to the list by defining the parameter name and the corresponding tag in the network file of HARK. A user can tweak these parameters: this helps to localize the target sound sources (i.e., vocalizations of ZFs) and exclude other noises or unnecessary sounds. This is important because the most appropriate settings depend strongly on the acoustic properties of the environment and the target sounds.This is important because the most appropriate settings depend strongly on the acoustic properties of the environment and the target sounds. The result of the source localization can be checked from the annotation tool interface (b), where both spectrogram and MUSIC spectrum are displayed. The MUSIC spectrum is a vector of values, each represents the power of sound in the corresponding direction. Each colored box represents the time and DOA of a localized sound source. The length of each box indicates the duration of the localization, and the spectrogram of each separated sound pops up and can be replayed by clicking the corresponding box. In addition, the interface also provides editing functions to edit each localization result such as correction of the localization time, duration and direction. Annotations can also be made, and the user can check each localized sound by playing back the separated sound and confirming the spectrogram image.
We used a geometrically computed transfer function, which was needed for sound source localization and separation, generated by a tool for generating and visualizing transfer function, HARKTOOL5. We adopted the values for the parameters: PERIOD (the interval between the frames to perform sound source localization) = 5 (=0.5 s interval), THRESH (the detection threshold of the MUSIC spectrum values for recognizing a sound source) = 28, UPPER(LOWER)_BOUND_FREQUENCY (the upper (lower) bound frequency for the spectrogram to be used in the MUSIC method) = 8000 (3000), and NUM_SOURCE (the number of expected sound sources when calculating the MUSIC spectrum) = 2.
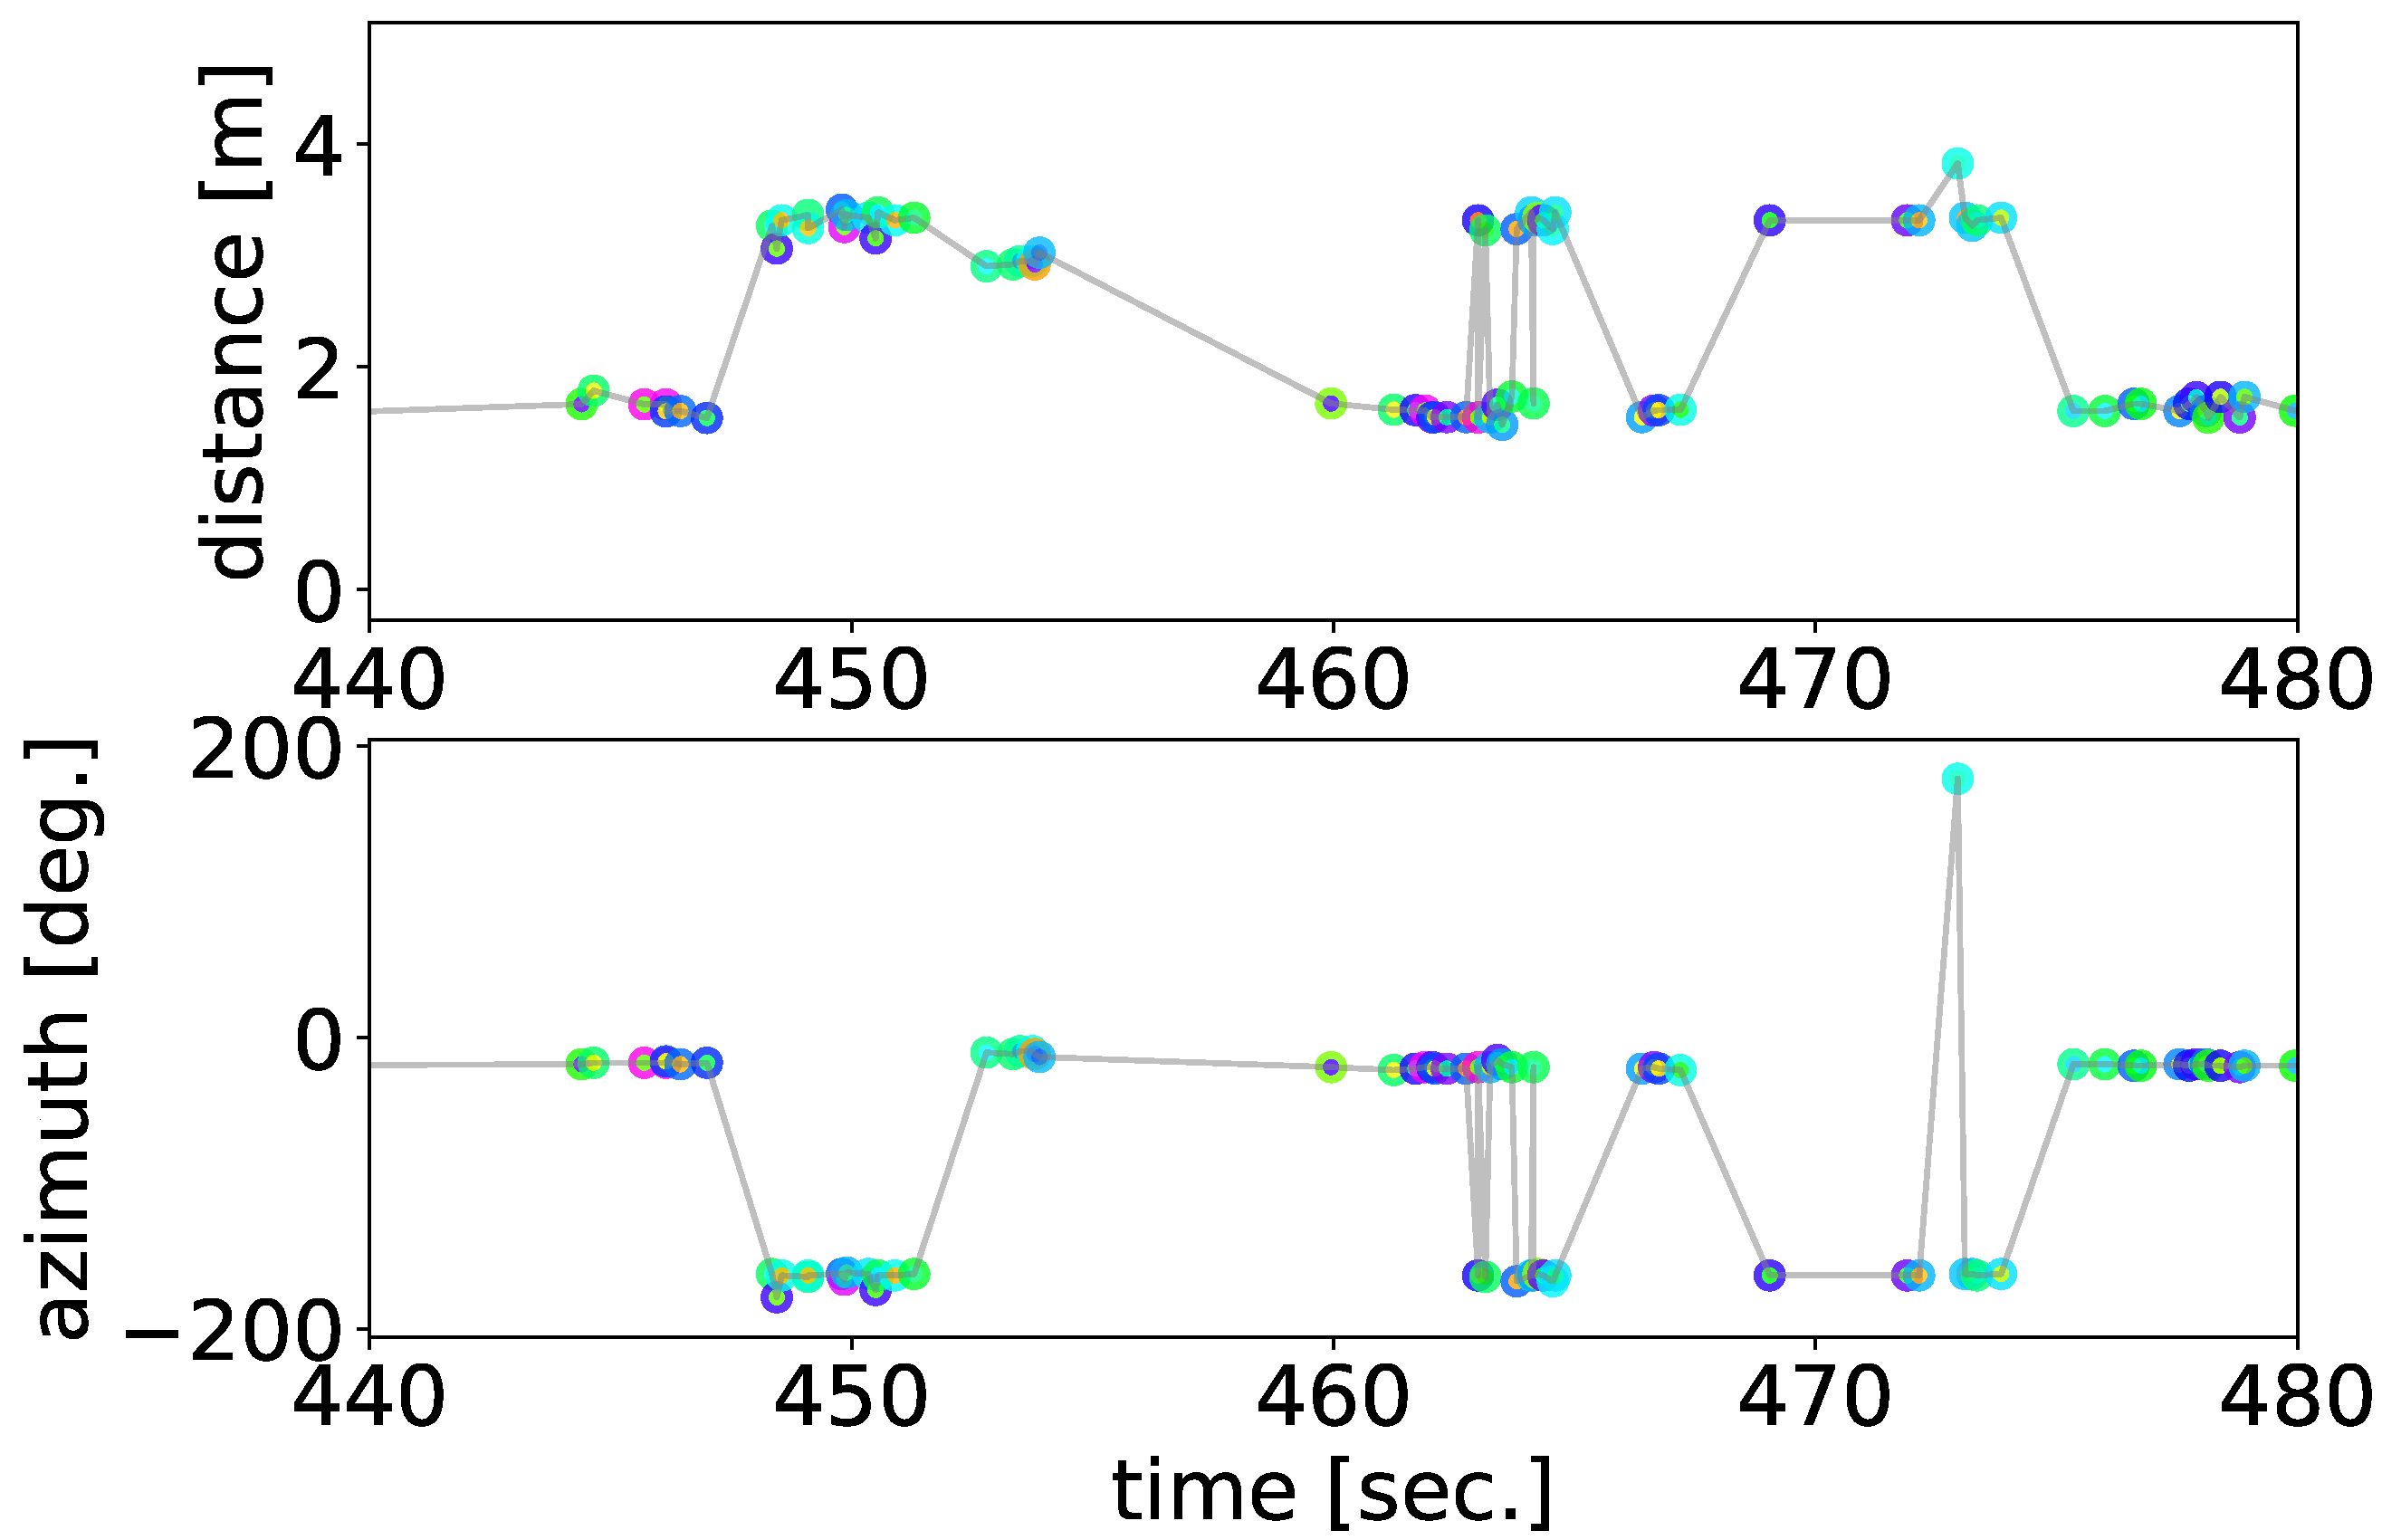
We obtained the localization results of a single recording from each microphone array, as illustrated in Figure 4. At the period in which the signal of the spectrogram at about 2000–6000 Hz is strong in the top panel of the figure, numerous black bars are displayed in the bottom panel, each indicating a localized sound source. The human inspection confirmed that these localized sounds included almost all vocalizations by the ZF individuals during the recording.

2.3. Spatial Division-Based 2D Localization Using Sound Sources with High Affinity

Algorithm 1 shows the overall procedures of the proposed 2D localization method, and 
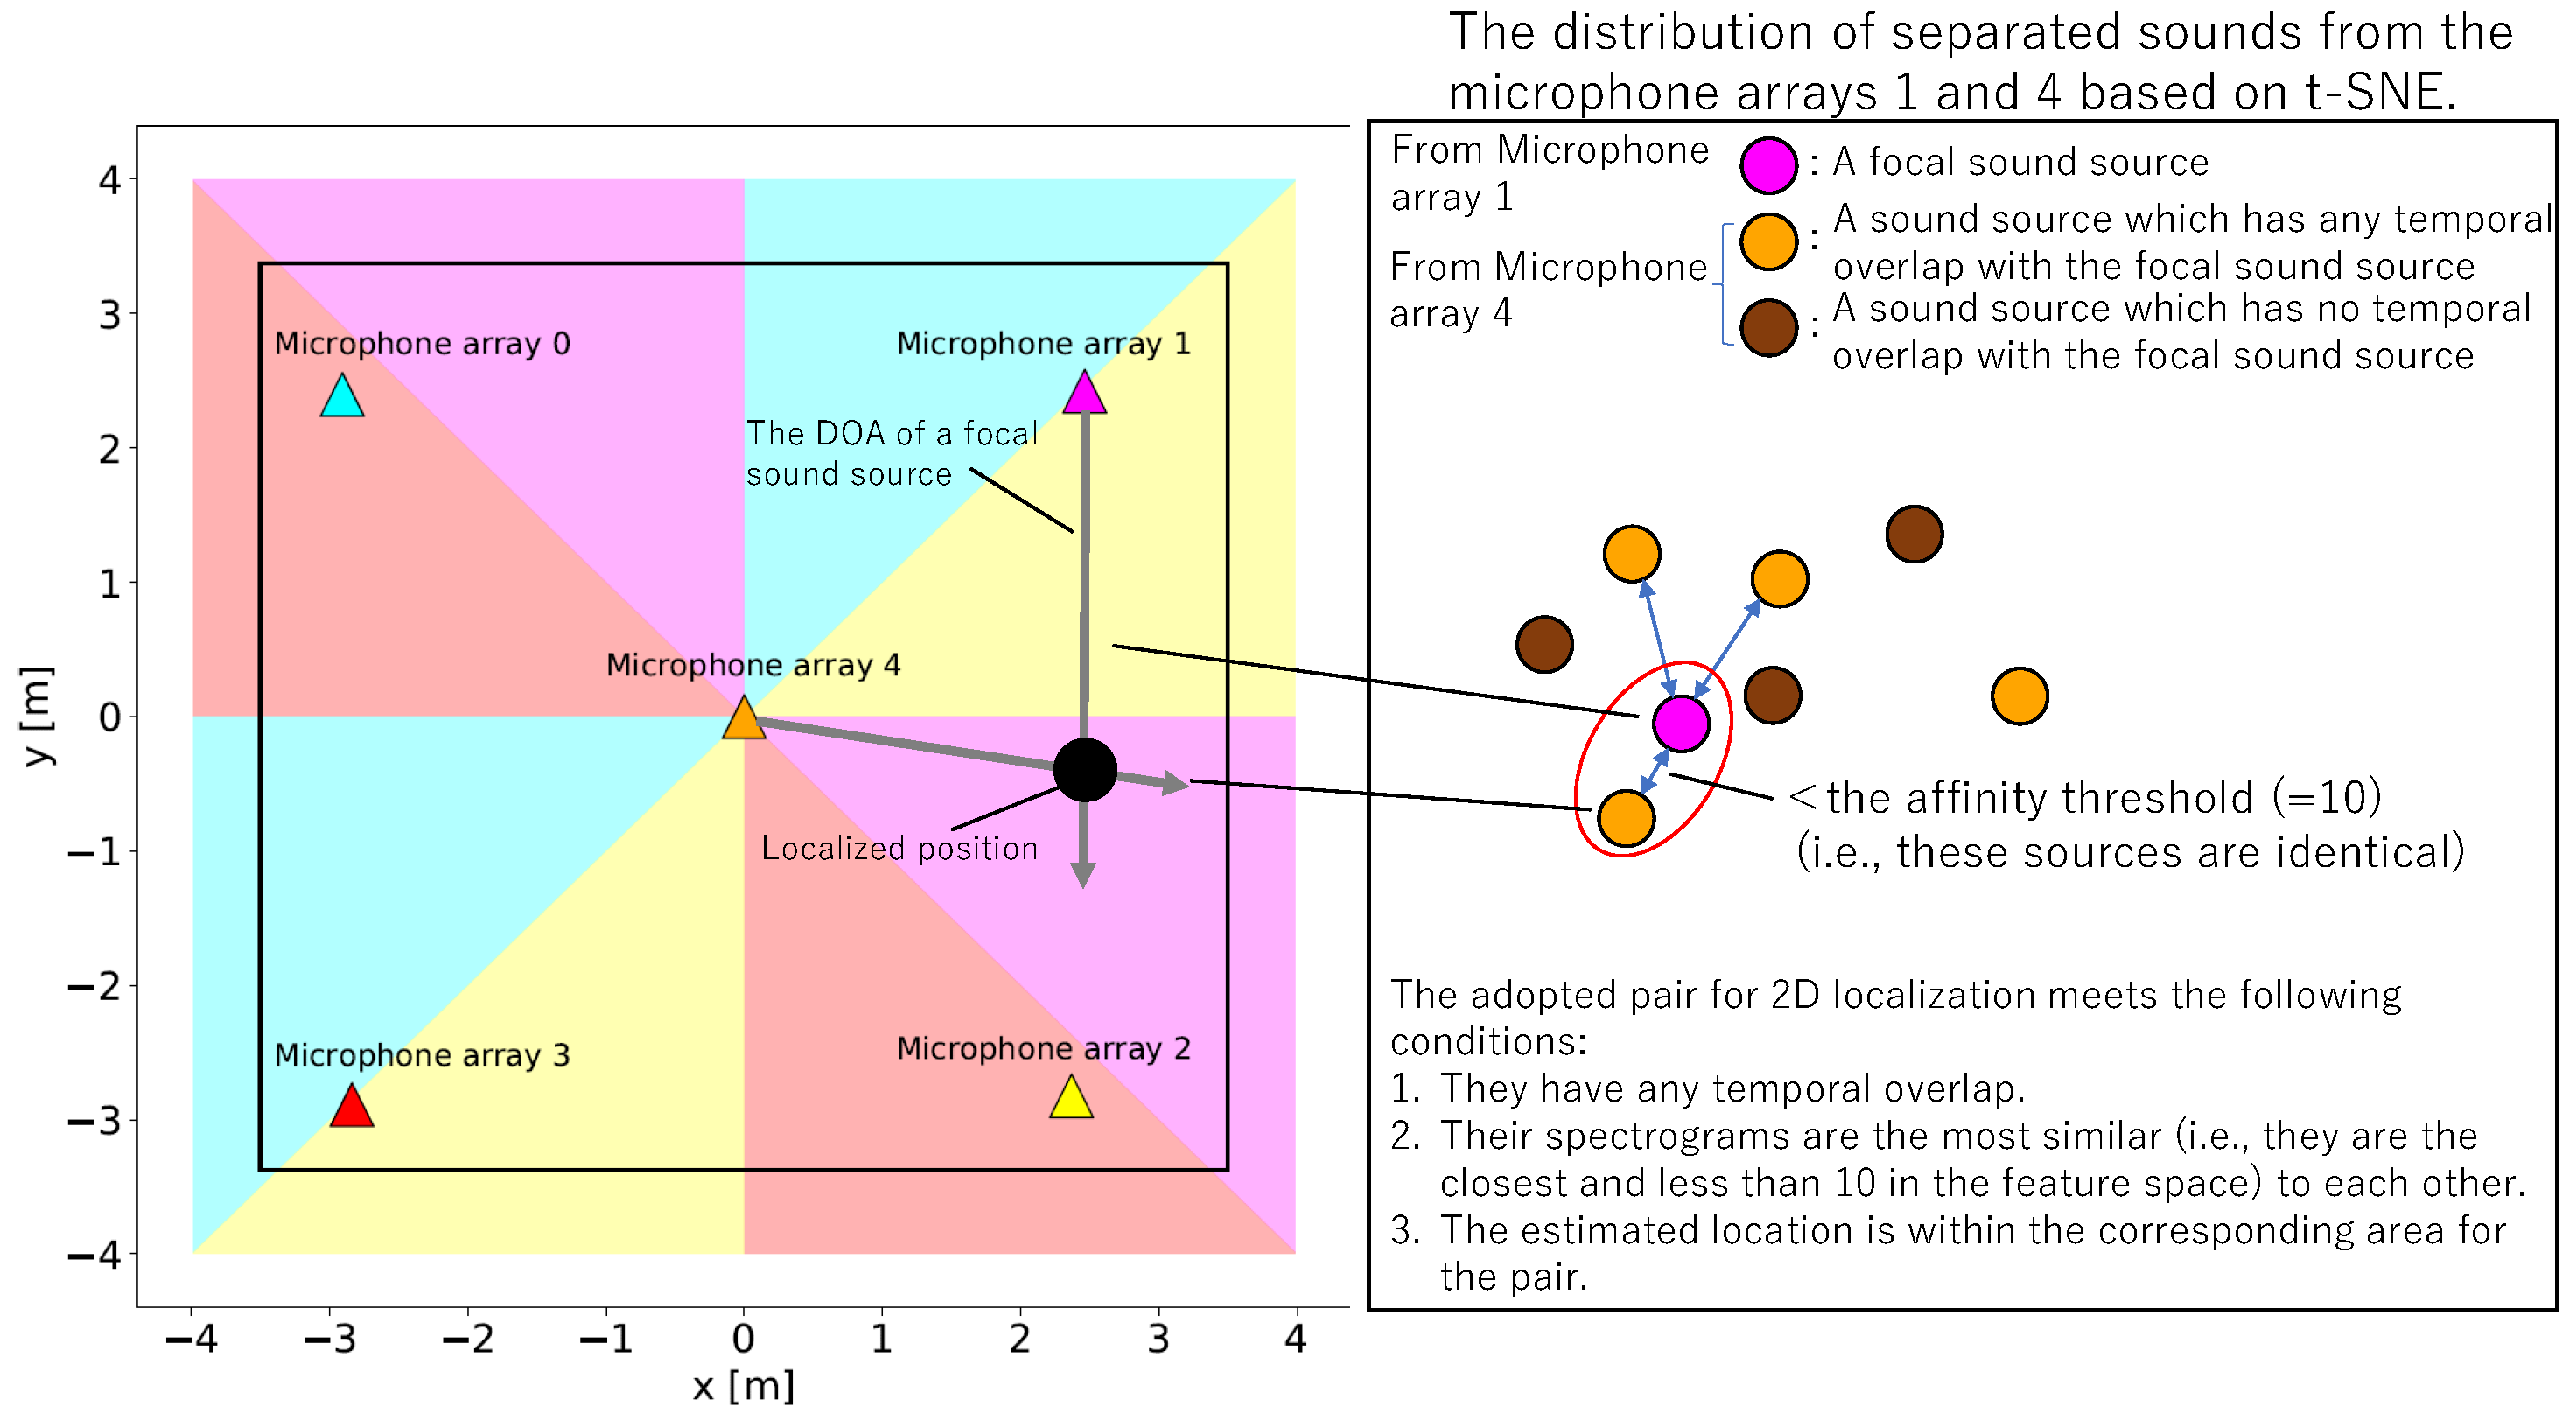
Figure 5 illustrates an example of the 2D localization process. To estimate the spatial positions of the vocalizations, we combined a simple 2D sound localization method based on triangulation of the DOAs of the sound sources using a pair of microphone arrays. Triangulation is a method of determining the location of an object relative to angular measurements made from two other locations. As illustrated in Figure 5 (left), we extended a half straight line from the position of each microphone array in the direction where the sound source was localized, and created an intersection point as the spatial position of the target source [36]. A limitation of the standard triangulation described above is that the localization of sources far distant from the two arrays or near the straight line connecting the arrays becomes difficult or unstable due to observation errors in the DOAs [25].
To address this problem, we divided the entire space in the experimental tent into several areas and selected an appropriate pair of microphone arrays for each area (Figure 5) to resolve such issues. In each area, we adopted the pair of the microphone array 4 (center) and another corresponding to the color of the area in Figure 5 (left). This spatial division-based 2D localization enabled us to estimate more accurate positions of the sound sources because each area is close to the corresponding pair of microphone arrays, and, this arrangement avoids the aforementioned localization problem.
Algorithm 1 Spatial division-based 2D localization.
  • Initialize an empty list L p for keeping localized positions.
  • Initialize an empty list L s for keeping separated sounds.
  • for each pair of microphone array (the centered and one of the peripheral arrays) do
  •     Make a dataset for t-SNE using the separated sounds by two arrays.
  •     Conduct t-SNE and obtain the source distribution on the feature space.
  •     for each sound source S i from the peripheral array do
  •         Find a separated sound S c from the centered array which is the closest to S i on the feature space and has any overlap of localization time to S i .
  •         Calculate the distance between S i and S c as d i .
  •         if d i < 10 then
  •            Localize the position of the source p i using their DOAs.
  •            if p i is in the corresponding area of the pair then
  •                Append p i to L p
  •                Append the separated sound of S c to L s
  • Create a 2D localization map using L p .
  • Make a dataset for t-SNE using L s .
  • Conduct t-SNE using L s , and obtain the source distribution on the feature space.
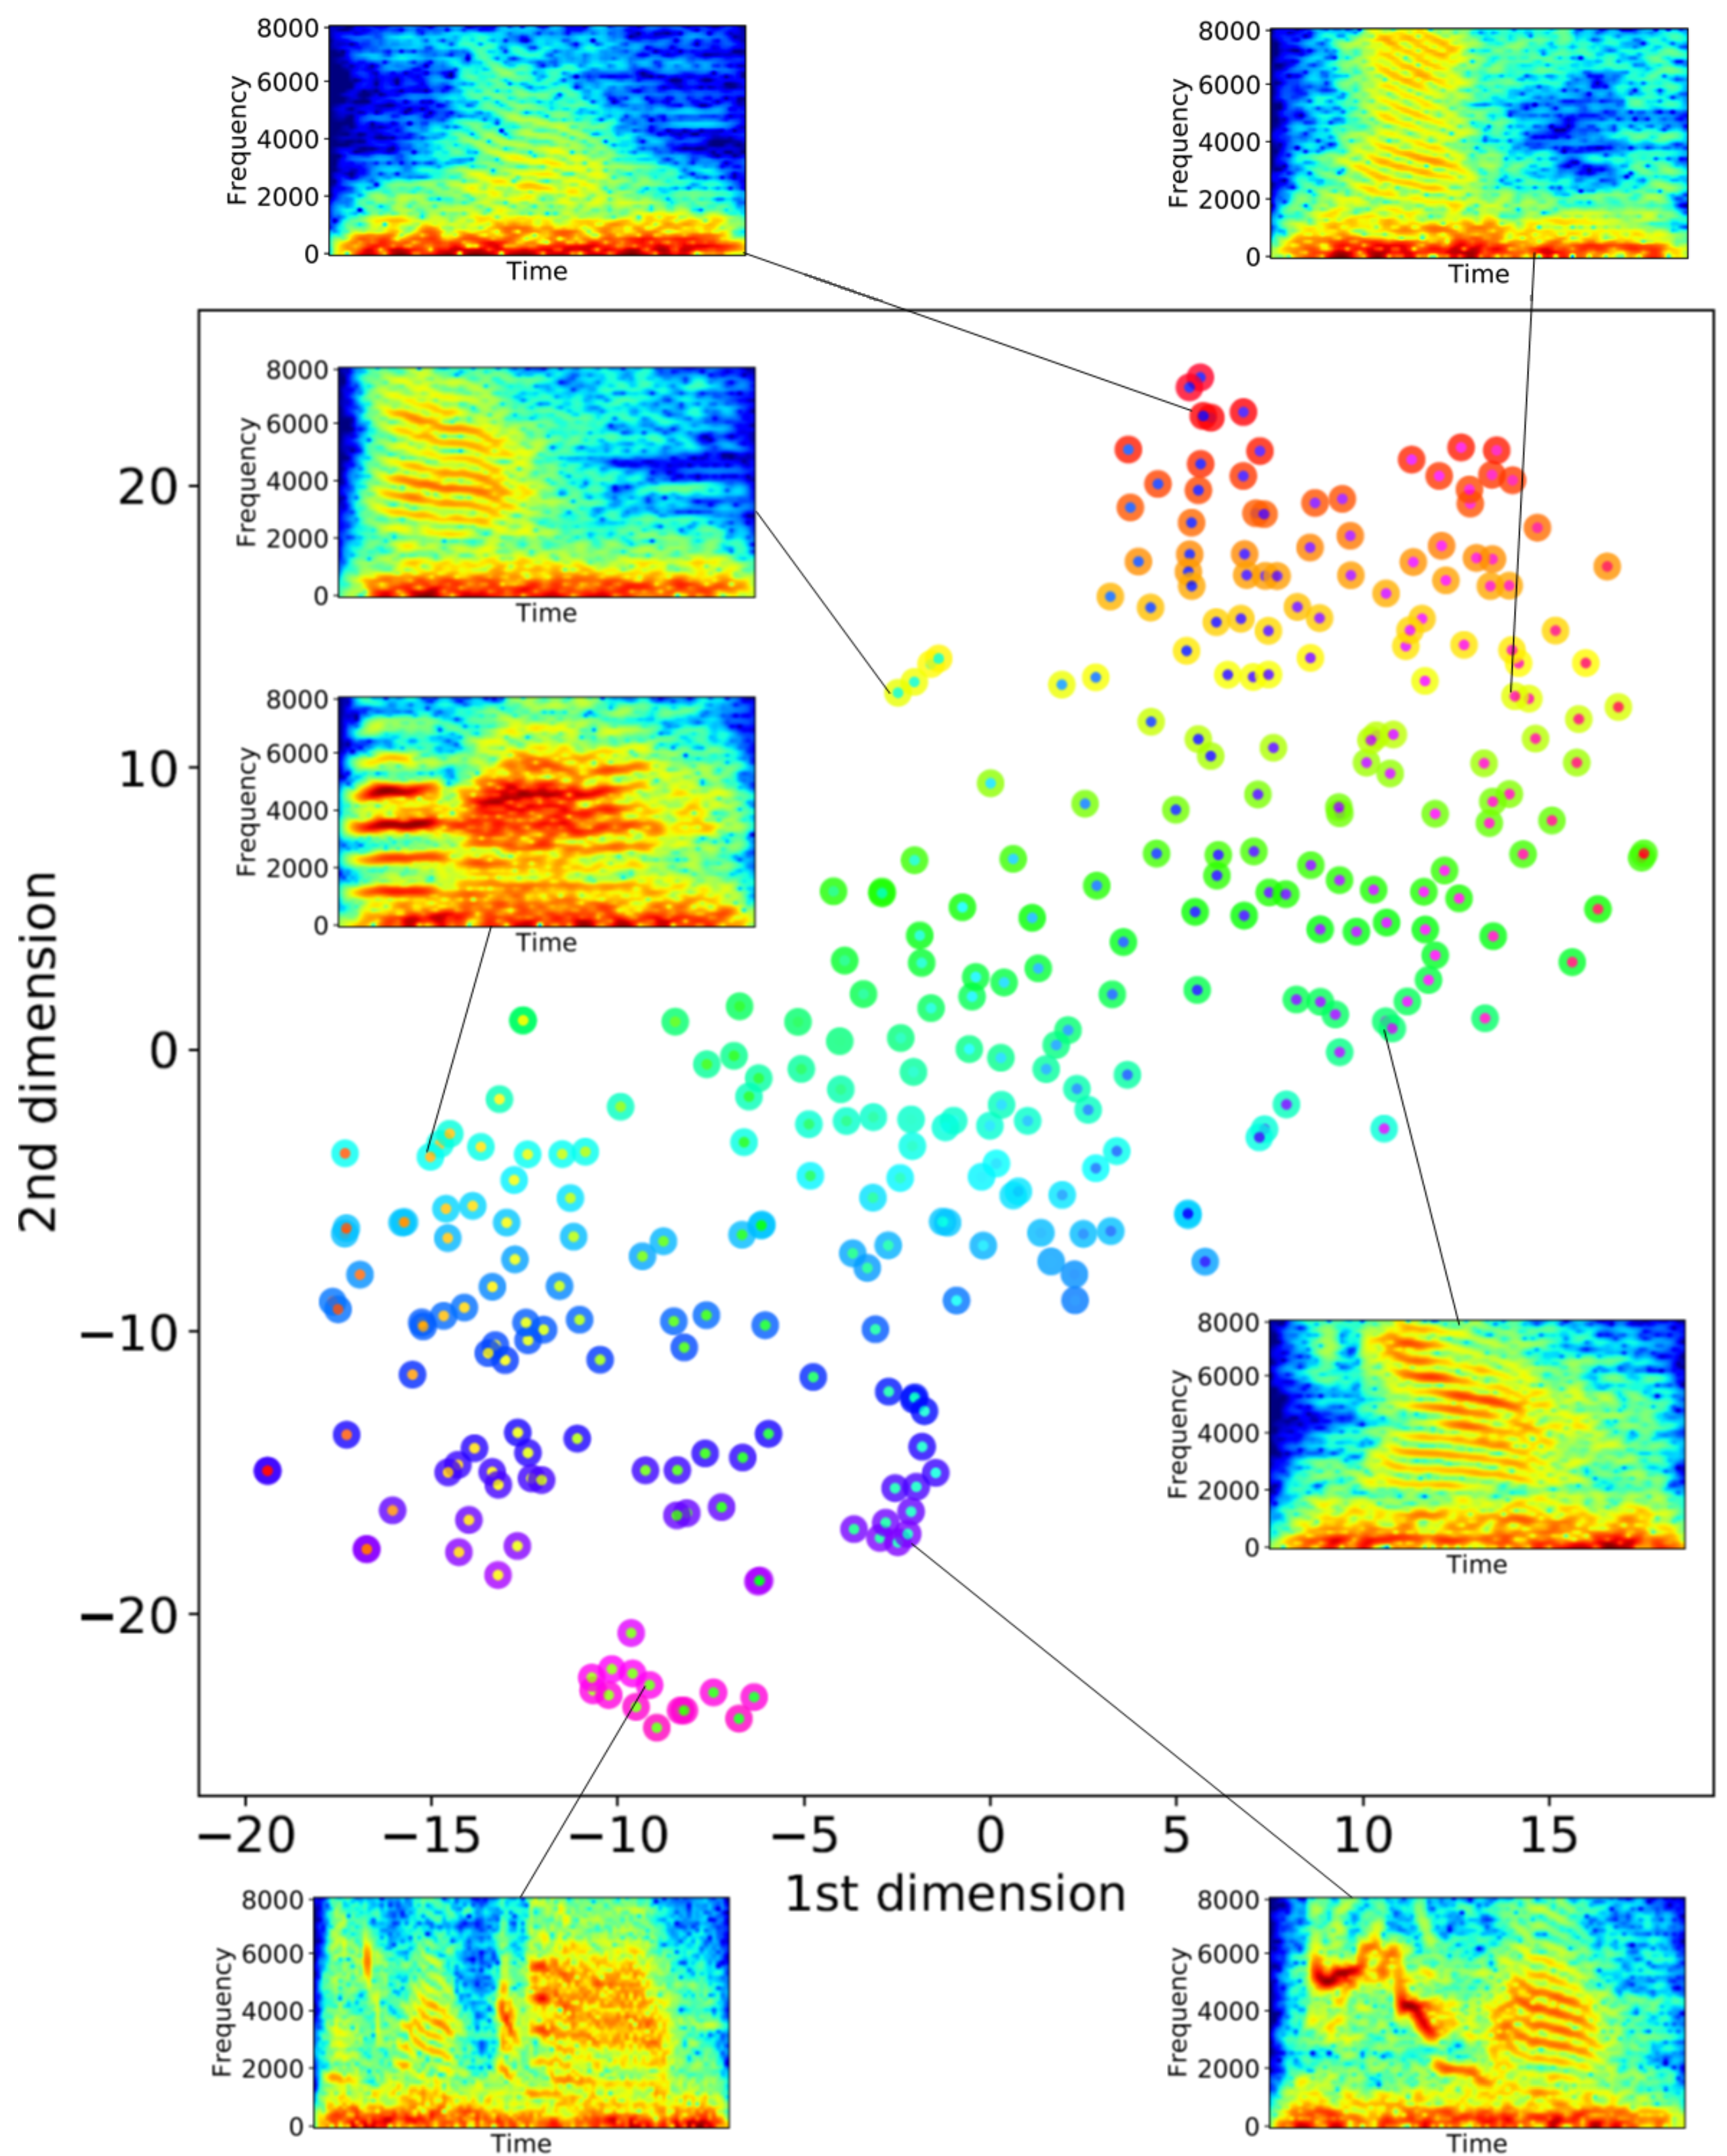
Furthermore, when multiple sources are localized simultaneously, it is necessary to identify a pair of DOA information sets of a unique source from two microphone arrays. Here, we used the t-Distributed Stochastic Neighbor Embedding (t-SNE) dimension reduction algorithm [37] to select the pair of separated sounds to be localized with similar spectral features (Figure 5 (right)). t-SNE has a feature to express proximity among data by a probability distribution and it is especially useful for visualizing high dimensional data. We created grey-scale 100 × 64 pixel images of the STFT spectrogram of the separated sounds from the two microphone arrays as a data set for dimension reduction using t-SNE, and we plotted the results on a 2D plane of the resultant feature space. Then, for each spectrogram of the separated sound sources obtained from the peripheral microphone array (0–3), we searched for the separated sound localized by the centered microphone array 4 in the closest proximity to the focal source on the feature space (Figure 5 (right)). We next conducted 2D localization using the pair of these sources if the distance between them was within 10 on the feature space. From these localization results, we extracted sound sources that were localized in the corresponding area of the pair. For example, in Figure 5, the DOA of a focal sound source (pink) localized by the microphone array 1 was used for triangulation because there existed a temporally overlapped sound source localized by the microphone array 4 of which the distance from the focal source in the feature space was the smallest and less than 10, and finally the estimated location (black) was within the corresponding area for the pair (pink). This method enabled us to estimate the spatial positions using the information from a unique source without explicit classification. The height of the birds relative to microphone height may affect the accuracy of the localization result. However, we did not take their height into account for sound source localization, assuming that sound sources and the microphone are on the same horizontal plane, for simplicity. This is because the height of the available perches or nests where the ZFs are expected to stay most is set to the same height as the microphone array and thus their movement in the vertical plane is likely much more limited than movement in the horizontal plane.
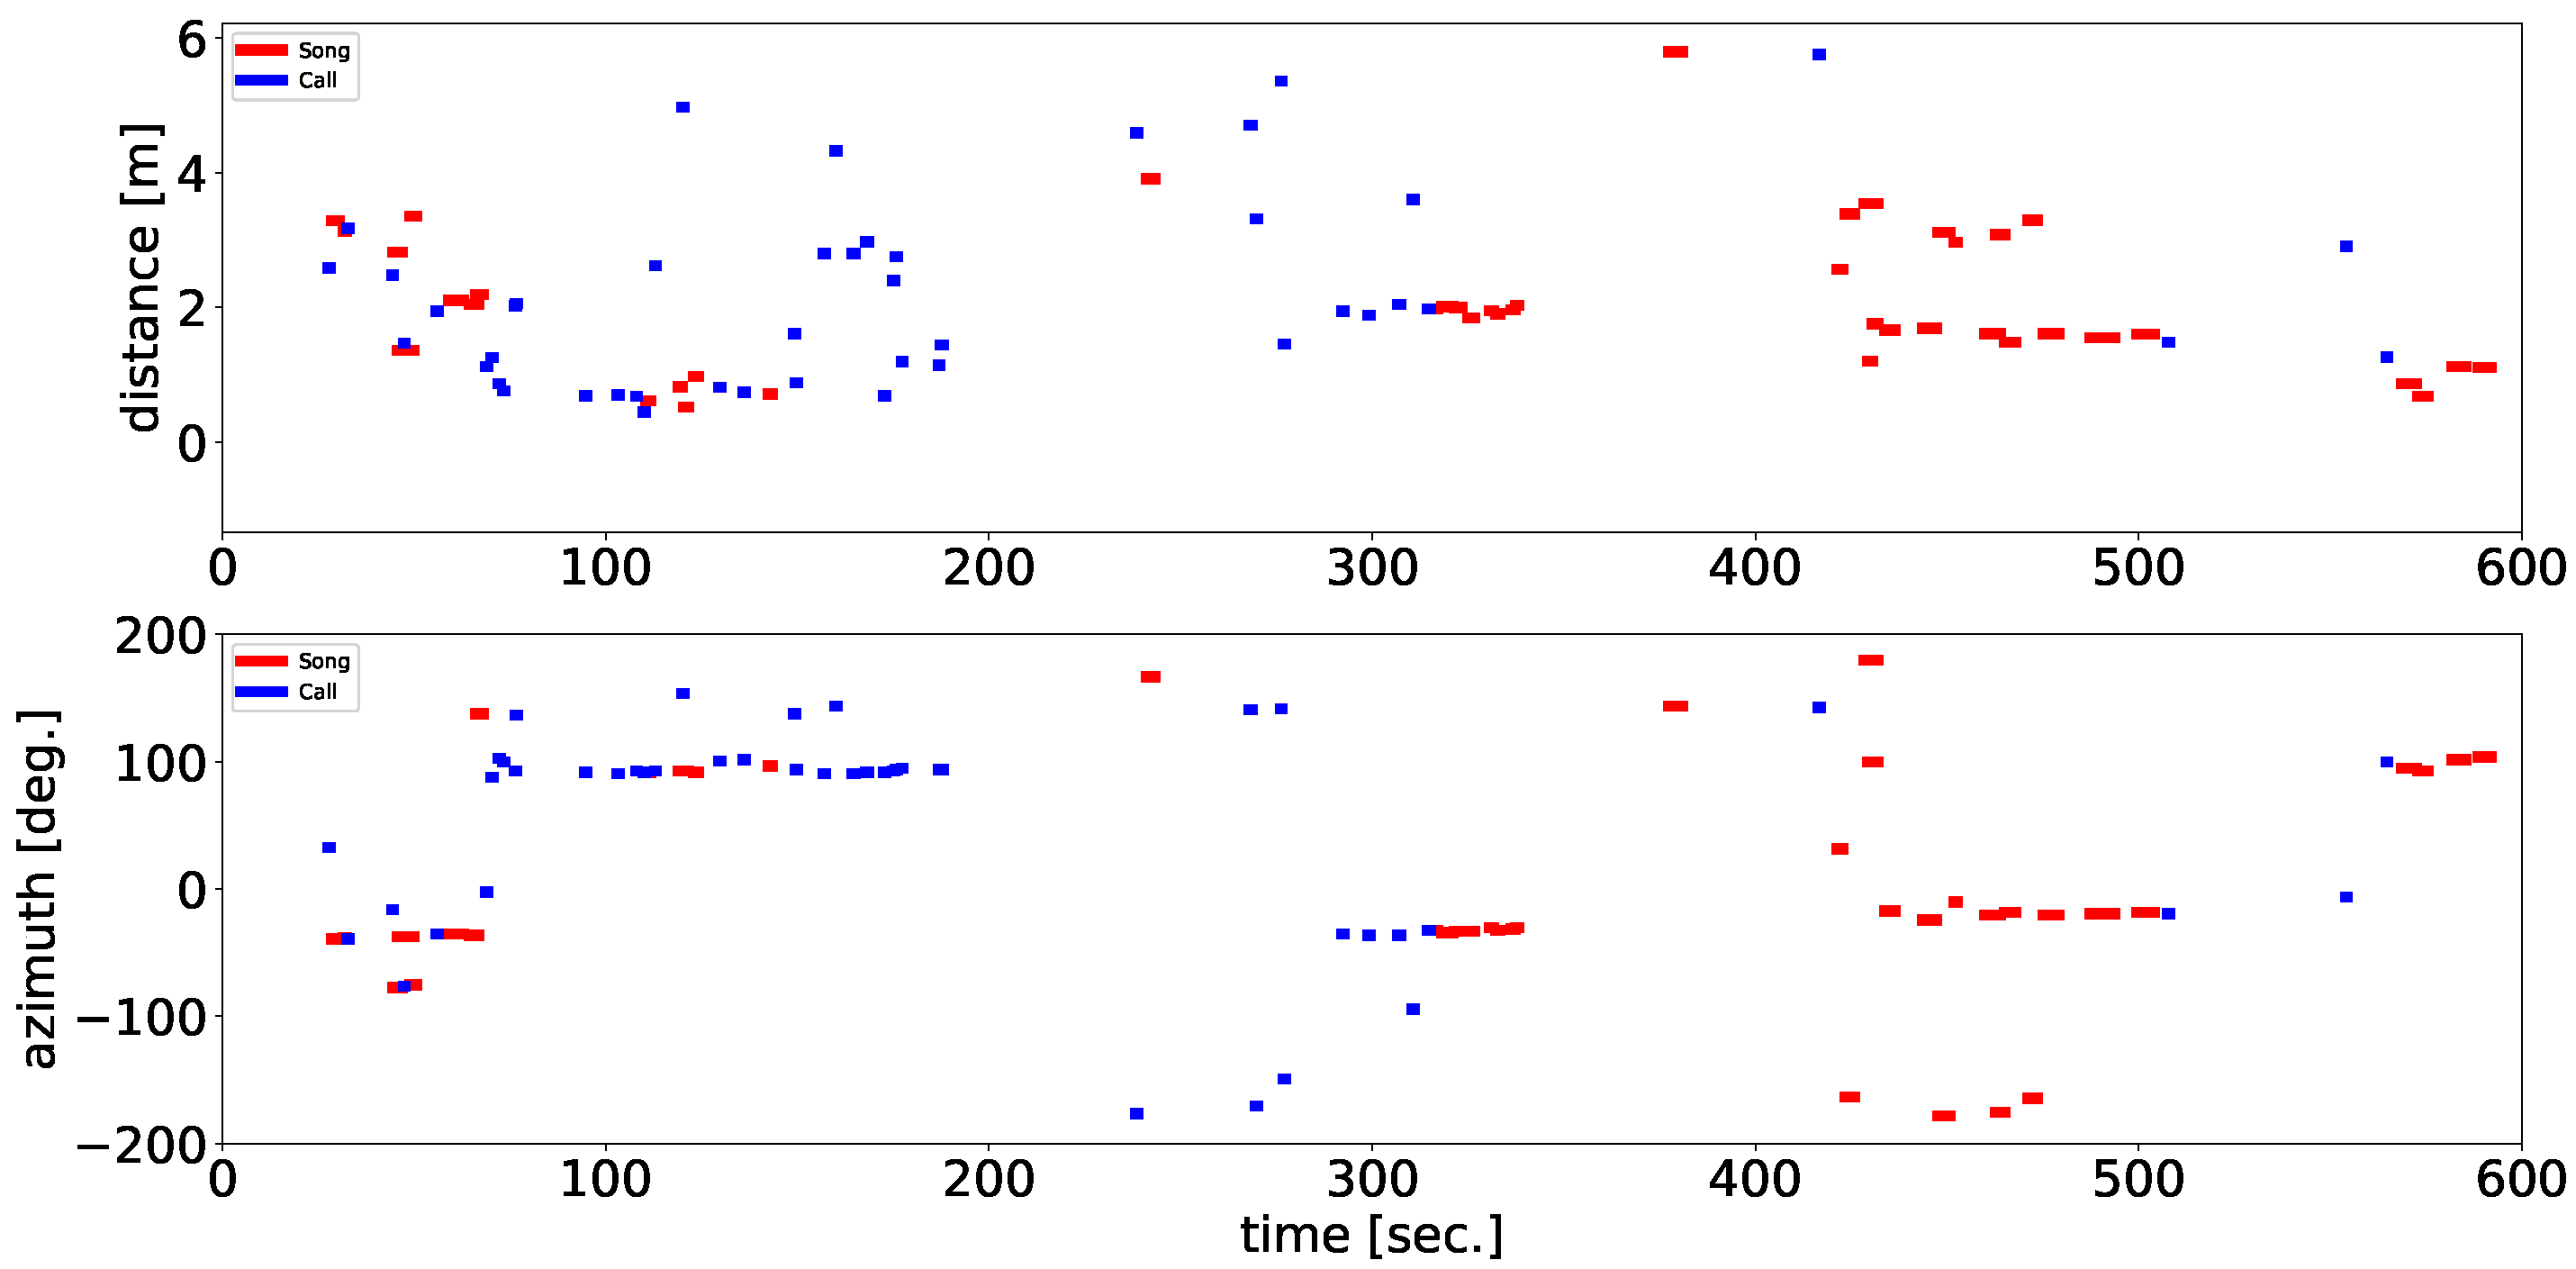
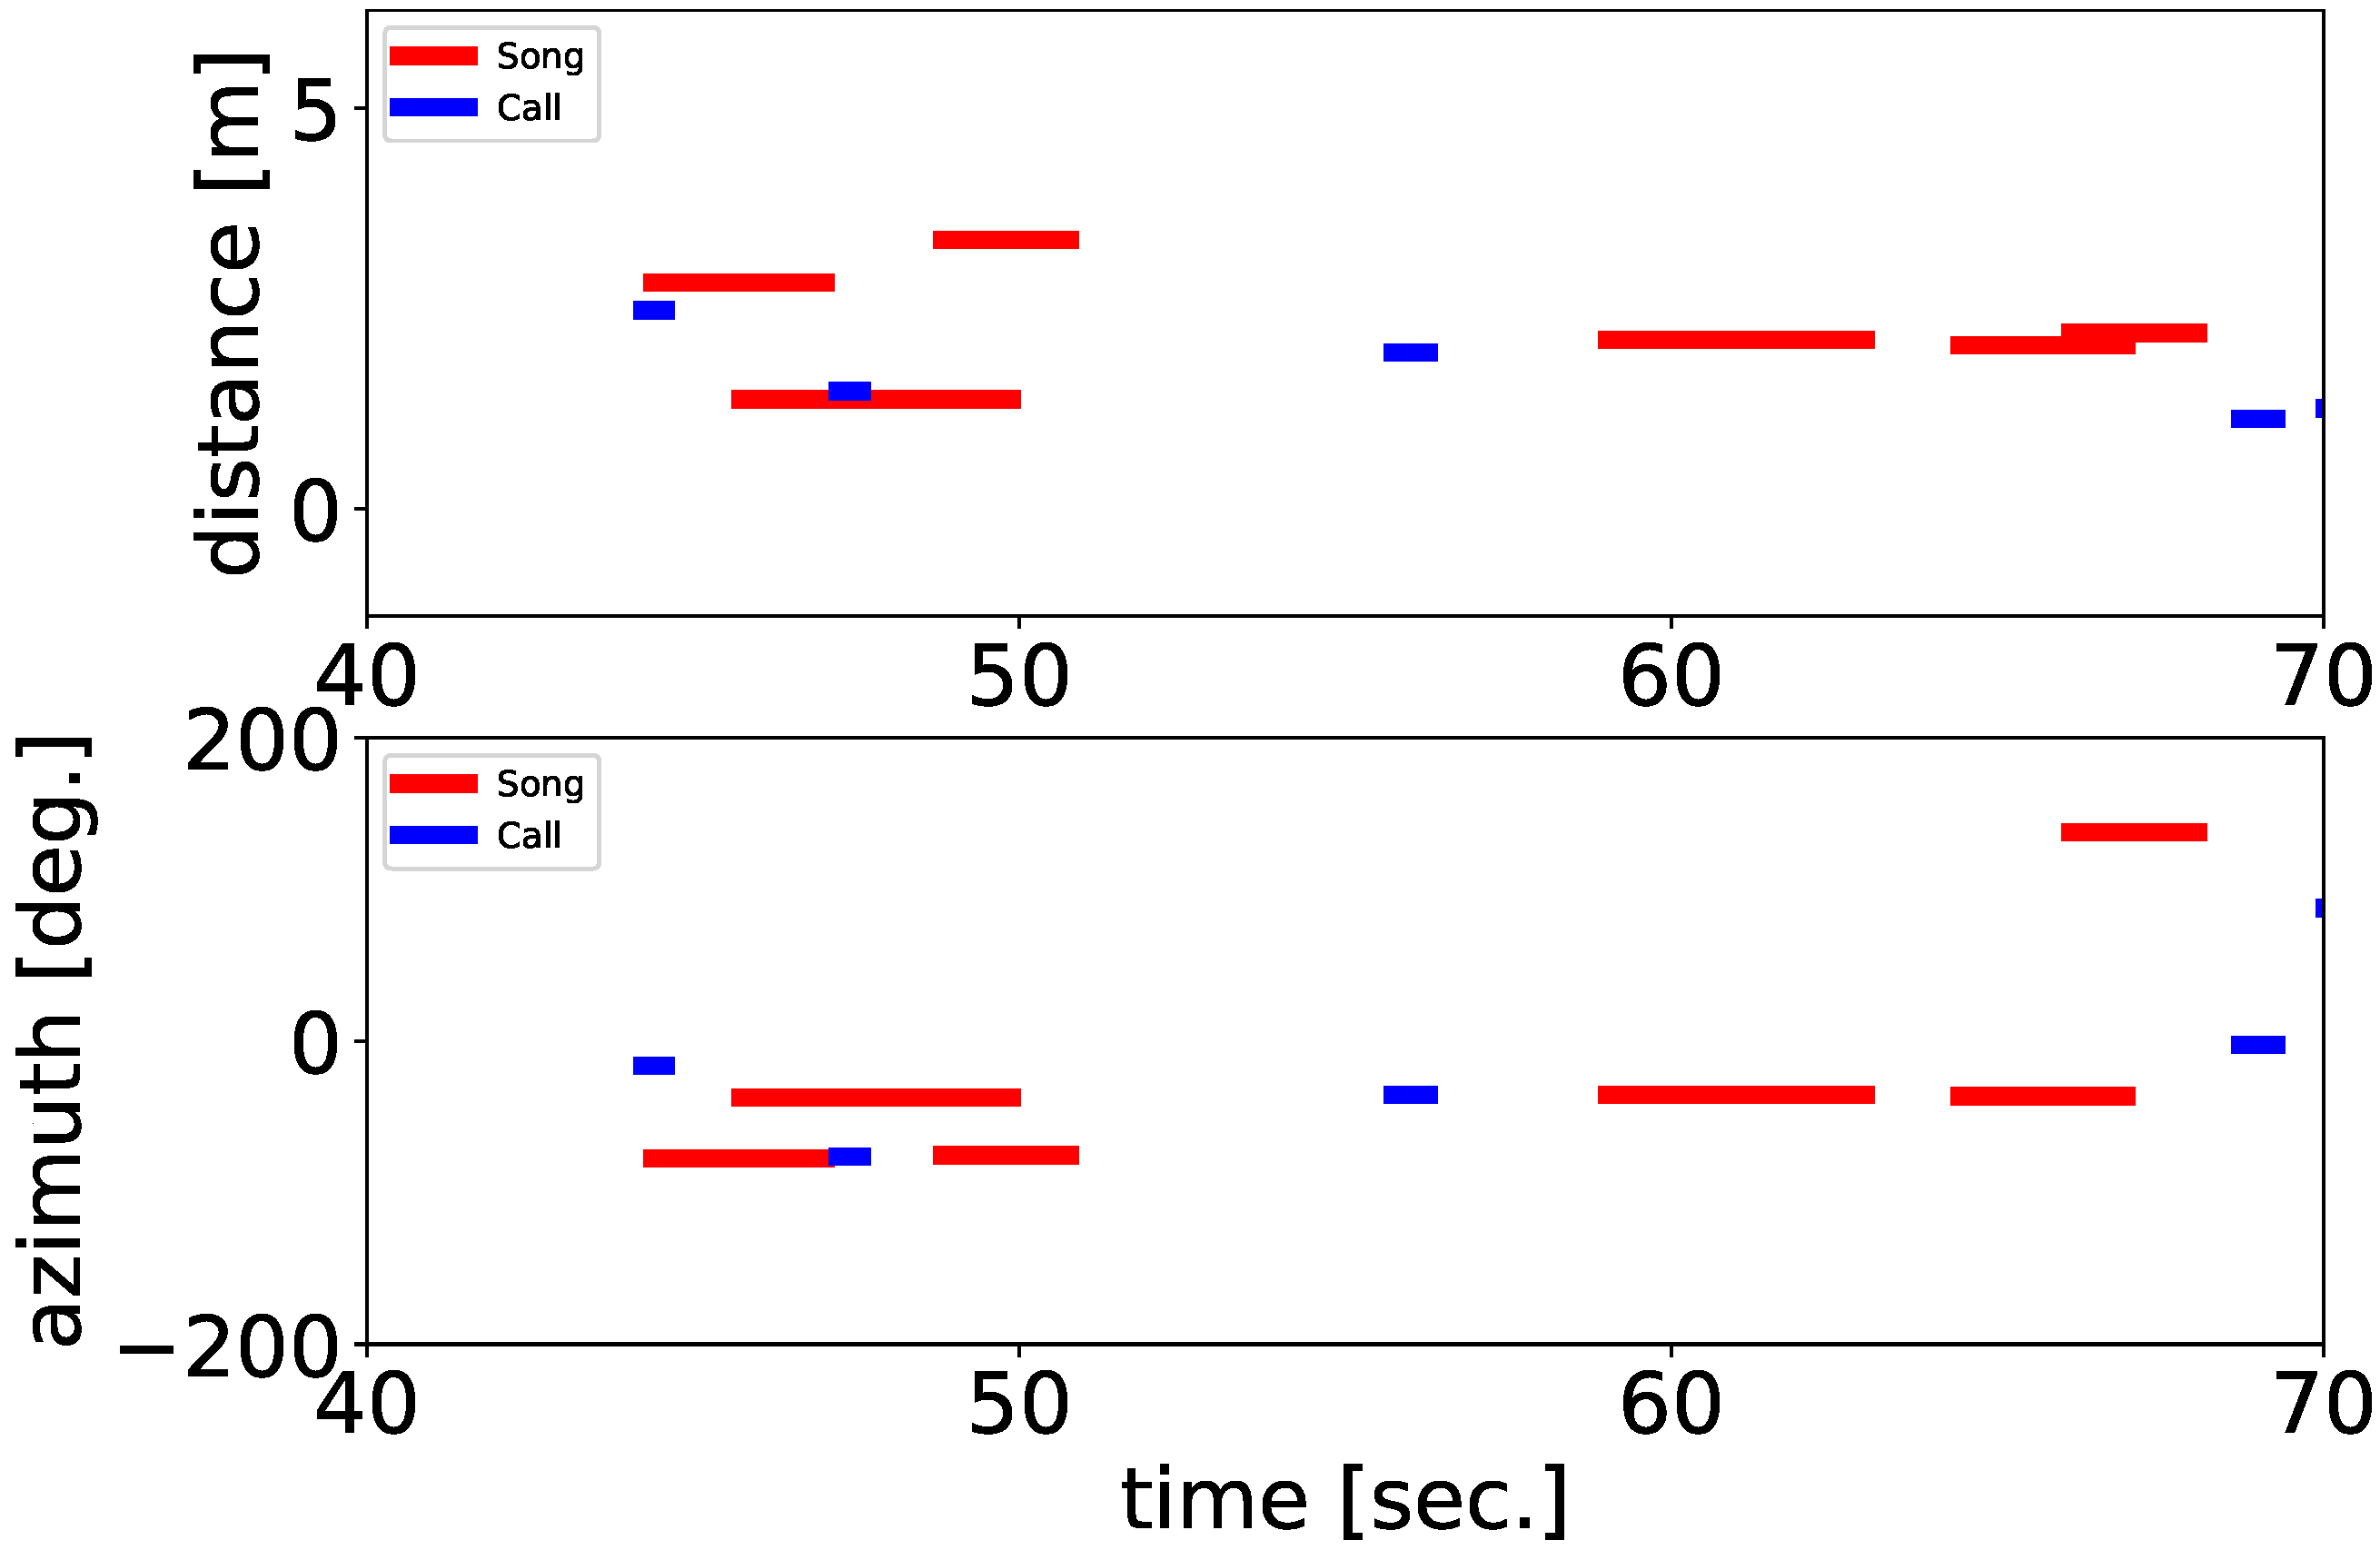
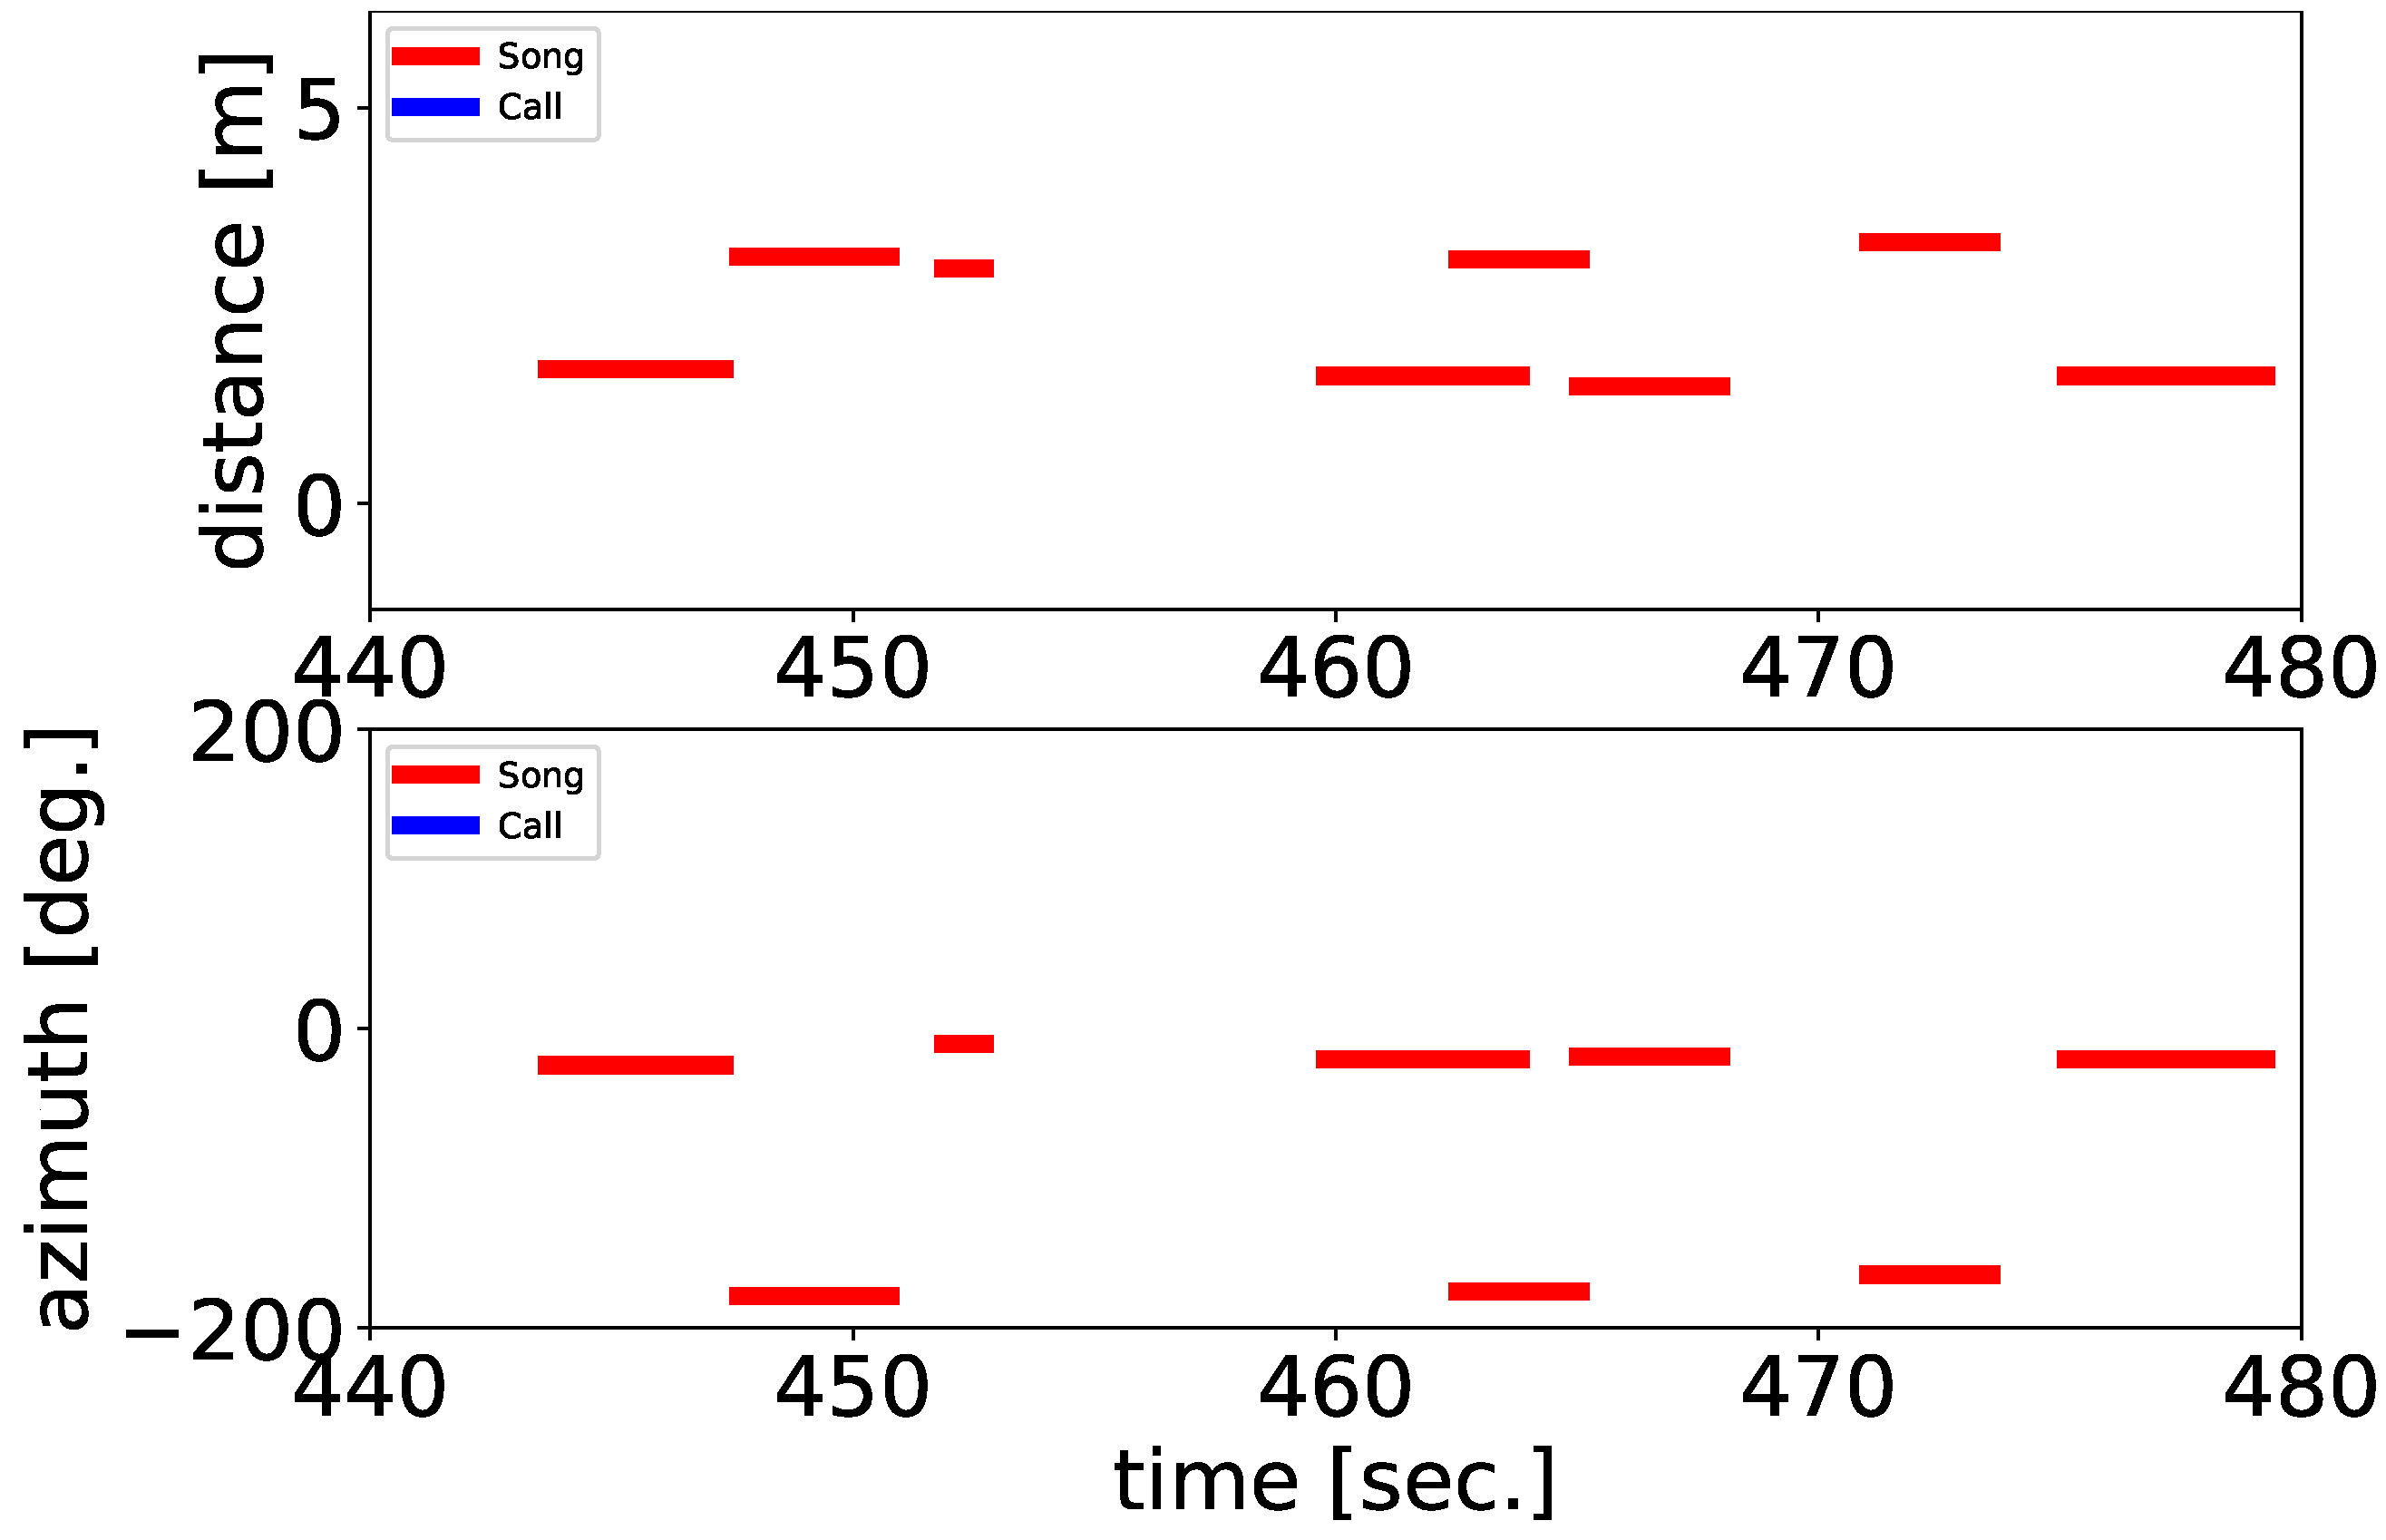
After estimating the spatial positions of sound sources with each pair, we integrated them and obtained the final result of 2D localization. To eliminate the sound sources outside the tent, we limited the localization range to an area of 4 m 2 at the center of the tent. We regarded the sounds as vocalizations of the ZF individuals and extracted the acoustic features by conducting dimension reduction using t-SNE for the separated sound sources obtained from the recordings of microphone array 4 which was localized in the 2D localization phase. By combining the localization results and the acoustic features, we obtained the integrated spatial, temporal, and spectral dynamics of the vocalizations of the ZF individuals.

2.4. Classification of Vocalization Type

We also classified their vocalizations as either songs or calls by using a simple method based on the tempo and length of the separated sounds, as an example of the use of the information obtained from the framework. As mentioned in the Introduction, songbirds have two vocalization types; are songs and calls. The recordings in our experiments include both songs and calls of the ZFs; classifying them makes it possible to illustrate the details of their interactions. The songs and calls of the ZFs differed significantly in duration and complexity. A song is composed of multiple consecutive syllable structures, whereas a call is a single note. To distinguish between them, we adopted a classification method based on these differences in acoustic properties as follows. First, we conducted sound source localization to better differentiate songs from calls under adjusted parameter settings (PERIOD = 10, THRESH = 28.5) so that a whole song including short breaks between syllables can be localized as a single sound source. Then, we calculated the number of peaks of sound volume and the duration of each separated sound. We regarded them as songs if the duration was longer than 0.8 s and the number of peaks of sound volume was more than four per second; if the separated sounds did not meet both conditions, they were regarded as calls.

3. Results

3.1. Spatial and Temporal Dynamics

Figure 6 shows the spatial and temporal distribution of the localized vocalizations of ZF individuals. The graph in the figure shows that the sound sources were localized at several positions close to perches and nests, which means that the estimated positions are appropriate. Several sound sources were localized at positions with no objects present because some individuals sang on the ground. We also noted temporal changes in the positions of localized sound sources, as indicated by the color of the dots in the figure. For example, the sound sources during the initial 100 s, as depicted by blue dots, were localized at five or more positions, whereas those during 400–500 s, as depicted by orange dots, were localized mainly at the other two positions.
In addition, we represented the temporal changes in the localized positions by connecting the position of the localized source and its subsequent one with a link. Many links were observed between two clusters of orange dots during 400–500 s. Detailed analyses confirmed that some individuals sang during this period, which will be explained later. Thus, it implies that some ZF individuals interacted with each other repeatedly by using their vocalizations.
On the contrary, some sound sources were localized outside the tent, as observable in the lower left in Figure 6. This is expected to be due to a small error in the location or direction of microphone array 2 when we deployed it manually. We expect to correct such errors by combining the information from three or more arrays (e.g., taking the center of gravity or majority vote for the localized positions).

3.2. Spectral Relationships

Figure 7 represents the feature distribution of sound sources based on t-SNE, as obtained from the final integration of the localization results. The localized sound sources were distributed widely on the feature space. In addition, some formed clusters, each of which was composed of many sources having similar acoustic properties in the spectrograms, as illustrated in Figure 6. This implies that the distribution reflected the acoustic properties of the sound sources. Further, we confirmed that almost all localized sound sources in the feature space were vocalization types of ZF individuals, although noises such as food-pecking sounds were included. These results can enhance the understanding of the acoustic properties and contexts of vocalizations of ZF individuals and their relationships.

3.3. Spatial, Temporal, and Spectral Dynamics

We combined the spatio-temporal dynamics (Figure 6) and the spectral properties (Figure 7) of vocalizations of ZF individuals to evaluate their overall spatial, temporal and spectral dynamics. Figure 8 shows the time and location at which the ZF individuals sang and as well as the type of vocalizations used. The source distribution shown at the bottom of Figure 8 was similar to that of the centered microphone array shown at the bottom of Figure 3; therefore, this result reflects the whole dynamics of vocalizations in the tent. Changes were evident in their group-level behaviors. For example, the sound sources were localized at multiple directions and distances during 0–100 s and 300–500 s, implying that some ZF individuals vocalized at various positions or moved actively. On the contrary, the sound sources were localized at similar directions and distances during 100–200 s and 500–600 s. This situation indicates that a single or a smaller number of ZF individuals vocalized at a unique position. It should be noted that the acoustic properties of the localized sources tended to correlate with the spatio-temporal dynamics in that spatially or temporally closer sources tended to share their spectral properties (i.e., their colors), at least in part.
In this study, we focused on the detailed behavioral patterns of the vocalizations. Figure 9 and Figure 10 show the durations at which multiple ZF individuals vocalized at multiple directions from the centered array, at about 135 , 30 , and 80 during 40–70 s and about 10 and 180 during 440–480 s, respectively. It is expected that different individuals vocalized at different positions (in both cases rather than a single individual moving very quickly) because some localized sound sources were located at multiple directions in a very short period. During 40–70 s (440–480 s) the ZF individuals vocalized close to (apart from) each other. In addition, the repeated sound source localization at one direction started immediately after those at a different direction began. This indicates that the first vocalization of one individual might become a trigger for the following vocalization of the other individual. We also found that the acoustic properties of the vocalizations were relatively similar at each period. Specifically, their vocalization types are indicated mainly by light-green dots in Figure 9 and by blue dots in Figure 10. This suggests that ZF individuals interacted with each other by using specific vocalization types, which might reflect their social situations.

3.4. Analysis for Vocalization Types

Figure 11, Figure 12 and Figure 13 show temporal changes in the azimuth and distance of each vocalization type from the centered array, as estimated by the proposed classification method. The time periods of these figures correspond to those in Figure 8, Figure 9 and Figure 10 respectively. We localized 99 sound sources, of which the separated sounds were classified into 44 songs and 45 calls in the 10-min recording. A manual inspection of the classified results showed that the song classification accuracy was 91% (40/44) and that the sounds that were not songs were calls that were vocalized repeatedly in a short time. The classification accuracy of the calls was 73% (33/45). Moreover, we confirmed that food-pecking sounds or introductory notes vocalized just prior to a song were included in these separated sounds classified as calls, although no songs were included.
Figure 11 shows that the vocalization types used by the individuals differed depending on the time period. For example, calls (songs) were mainly vocalized in 100–200 s (400–500 s). This result suggests that each individual might respond by using similar vocalization types.
In addition, during the times given in Figure 9 and Figure 10, the individuals interacted with each other by vocalizing songs (Figure 12 and Figure 13) that were localized alternately in two directions. These results suggested that songs alternated between ZF individuals.

4. Conclusions

We proposed a framework based on robot audition techniques for automatic and fine-scale extraction of spatial-spectral-temporal patterns of bird vocalizations in a densely populated environment and examined the ability of the method to extract active vocalizations of multiple ZFs in an outdoor mesh tent as a realistic situation in which they could fly and vocalize freely. In a short 10-minute and proof-of-concept experiment, the proposed localization method enabled us to extract the detailed vocalization positions, which had no spatial limitation within the experimental range. We also automatically classified their vocalizations as either songs or calls, as an example of the use of the information obtained from the framework.
However, there are still several works to be examined to see whether the proposed method can contribute to the understanding of social relationships in a realistic field condition. One is to conduct tests over a longer duration with more subjects and when the birds have had time to settle down. This is because we analyzed the vocalizations occurring so soon after introduction, thus their interactions would hardly be typical of normal, stable sociality.
Another is to compare our results with grand-truth data by direct observations including who is vocalizing, the social context and what the response is. In particular, we need to develop an individual identification method that combines the acoustic properties obtained from microphone arrays and deep learning techniques, by extending the proposed algorithm for the classification of their vocalizations as either songs or calls.
The other is to validate our framework with experiments in a real and wide field situation because this experiment was conducted in a limited space (i.e., a tent). Our framework is itself not limited by the scale (e.g., the number of microphone arrays, and the distance and spatial relationship between them). Thus, conducting more trials in various deployment conditions of microphone arrays will give us knowledge about the broader applicability of this framework.

Author Contributions

S.S., R.S. and T.A. designed the whole experimental framework, and K.N. and H.G.O. contributed to the software development using HARK. S.S., R.S. and T.A. conducted experiments and analyses. All authors have read and agreed to the published version of the manuscript.

Funding

This work was supported in part by JSPS/MEXT KAKENHI: JP21K12058, JP20J13695, JP20H00475, JP19KK0260, JP18K11467 and JP17H06383 in #4903 (Evolinguistics).

Institutional Review Board Statement

Animal experiments were conducted under the guidelines and approval of the Committee on Animal Experiments of Hokkaido University. These guidelines are based on the national regulations for animal welfare in Japan (Law for the Humane Treatment and Management of Animals with partial amendment No.105, 2011).

Informed Consent Statement

Not applicable.

Data Availability Statement

The scripts and data presented in this study are available from http://www.alife.cs.i.nagoya-u.ac.jp/~sumitani/HARKBird_scripts/ (accessed on 20 April 2021).

Acknowledgments

We thank Kazuhiro Wada (Hokkaido University) for providing the experimental environment and individuals of ZFs and comments.

Conflicts of Interest

The authors declare no conflict of interest.

References

  1. Catchpole, C.K.; Slater, P.J.B. Bird Song: Biological Themes and Variations; Cambridge University Press: Cambridge, UK, 2008. [Google Scholar]
  2. Marler, P. Chapter 5—Bird calls: A cornucopia for communication. In Nature’s Music; Marler, P., Slabbekoorn, H., Eds.; Academic Press: San Diego, CA, USA, 2004; pp. 132–177. [Google Scholar]
  3. Suzuki, R.; Cody, M.L. Complex systems approaches to temporal soundspace partitioning in bird communities as a self-organizing phenomenon based on behavioral plasticity. Artif. Life Robot. 2019, 24, 439–444. [Google Scholar] [CrossRef]
  4. Farine, D.R.; Aplin, L.M.; Sheldon, B.C.; Hoppitt, W. Interspecific social networks promote information transmission in wild songbirds. Proc. R. Soc. B Biol. Sci. 2015, 282, 2014–2804. [Google Scholar] [CrossRef] [PubMed] [Green Version]
  5. Gill, L.F.; Goymann, W.; Ter Maat, A.; Gahr, M. Patterns of call communication between group-housed zebra finches change during the breeding cycle. eLife 2015, 4, e07770. [Google Scholar] [CrossRef] [PubMed] [Green Version]
  6. Stowell, D.; Benetos, E.; Gill, L. On-Bird Sound Recordings: Automatic Acoustic Recognition of Activities and Contexts. IEEE/ACM Trans. Audio Speech Lang. Process. 2016, 25. [Google Scholar] [CrossRef] [Green Version]
  7. Todt, D.; Naguib, M. Vocal Interactions in Birds: The Use of Song as a Model in Communication. Adv. Study Behav. 2000, 29, 247–296. [Google Scholar] [CrossRef]
  8. Naguib, M. Singing interactions in songbirds: Implications for social relations and territorial settlement. In Animal Communication Networks; Cambridge University Press: Cambridge, UK, 2005; pp. 300–319. [Google Scholar] [CrossRef]
  9. Blumstein, D.; Mennill, D.J.; Clemins, P.; Girod, L.; Yao, K.; Patricelli, G.; Deppe, J.L.; Krakauer, A.H.; Clark, C.; Cortopassi, K.A.; et al. Acoustic monitoring in terrestrial environments using microphone arrays: applications, technological considerations and prospectus. J. Appl. Ecol. 2011, 48, 758–767. [Google Scholar] [CrossRef]
  10. Rhinehart, T.A.; Chronister, L.M.; Devlin, T.; Kitzes, J. Acoustic localization of terrestrial wildlife: Current practices and future opportunities Ecol. Evol. 2020, 10, 6794–6818. [Google Scholar]
  11. Gayk, Z.; Mennill, D.J. Pinpointing the position of flying songbirds with a wireless microphone array: three-dimensional triangulation of warblers on the wing. Bioacoustics 2019, 29, 1–12. [Google Scholar] [CrossRef]
  12. Mennill, D.J.; Battiston, M.; Wilson, D.R. Field test of an affordable, portable, wireless microphone array for spatial monitoring of animal ecology and behaviour. Methods Ecol. Evol. 2012, 3, 704–712. [Google Scholar] [CrossRef] [Green Version]
  13. Hedley, R.W.; Huang, Y.; Yao, K. Direction-of-arrival estimation of animal vocalizations for monitoring animal behavior and improving estimates of abundance. Avian Conserv. Ecol. 2017, 12, 6. [Google Scholar] [CrossRef] [Green Version]
  14. Collier, T.C.; Kirschel, A.N.G.; Taylor, C.E. Acoustic localization of antbirds in a Mexican rainforest using a wireless sensor network. J. Acoust. Soc. Am. 2010, 128, 182–189. [Google Scholar] [CrossRef] [PubMed] [Green Version]
  15. Araya-Salas, M.; Wojczulanis-Jakubas, K.; Phillips, E.M.; Mennill, D.J.; Wright, T.F. To overlap or not to overlap: context-dependent coordinated singing in lekking long-billed hermits. Anim. Behav. 2017, 124, 57–64. [Google Scholar] [CrossRef]
  16. Ethier, J.P.; Wilson, D.R. Using microphone arrays to investigate microhabitat selection by declining breeding birds. Ibis 2020, 162, 873–884. [Google Scholar] [CrossRef]
  17. O’neal, B. Testing the Feasibility of Bioacoustic Localization in Urban Environments. Master’s Thesis, University of South Florida, Tampa, FL, USA, 2014. [Google Scholar]
  18. Okuno, H.G.; Nakadai, K. Robot audition: Its rise and perspectives. In Proceedings of the 2015 IEEE International Conference on Acoustics, Speech and Signal Processing (ICASSP), South Brisbane, QLD, Australia, 19–24 April 2015; pp. 5610–5614. [Google Scholar] [CrossRef]
  19. Nakadai, K.; Okuno, H.G. Robot Audition and Computational Auditory Scene Analysis. Adv. Intell. Syst. 2020, 2. [Google Scholar] [CrossRef]
  20. Nakadai, K.; Takahashi, T.; Okuno, H.G.; Nakajima, H.; Hasegawa, Y.; Tsujino, H. Design and Implementation of Robot Audition System ’HARK’ — Open Source Software for Listening to Three Simultaneous Speakers. Adv. Robot. 2010, 24, 739–761. [Google Scholar] [CrossRef] [Green Version]
  21. Nakadai, K.; Okuno, H.G.; Mizumoto, T. Development, Deployment and Applications of Robot Audition Open Source Software HARK. J. Robot. Mechatronics 2017, 27, 16–25. [Google Scholar] [CrossRef]
  22. Anguera, X.; Wooters, C.; Hernando, J. Acoustic beamforming for speaker diarization of meetings. IEEE Trans. Audio Speech Lang. Process. 2007, 15, 2011–2021. [Google Scholar] [CrossRef] [Green Version]
  23. Grondin, F.; Michaud, F. Lightweight and optimized sound source localization and tracking methods for open and closed microphone array configurations. Robot. Auton. Syst. 2019, 113, 63–80. [Google Scholar] [CrossRef] [Green Version]
  24. Suzuki, R.; Matsubayashi, S.; Nakadai, K.; Okuno, H.G. HARKBird: Exploring acoustic interactions in bird communities using a microphone array. J. Robot. Mechatron. 2017, 27, 213–223. [Google Scholar] [CrossRef] [Green Version]
  25. Sumitani, S.; Suzuki, R.; Matsubayashi, S.; Arita, T.; Nakadai, K.; Okuno, H.G. An integrated framework for field recording, localization, classification and annotation of birdsongs using robot audition techniques—HARKBird 2.0. In Proceedings of the ICASSP 2019—2019 IEEE International Conference on Acoustics, Speech and Signal Processing (ICASSP), Brighton, UK, 12–17 May 2019. [Google Scholar]
  26. Suzuki, R.; Sumitani, S.; Naren, N.; Matsubayashi, S.; Arita, T.; Nakadai, K.; Okuno, H.G. Field observations of ecoacoustic dynamics of a Japanese bush warbler using an open-source software for robot audition HARK. J. Ecoacoustics 2018, 2, EYAJ46. [Google Scholar] [CrossRef]
  27. Sumitani, S.; Suzuki, R.; Matsubayashi, S.; Arita, T.; Nakadai, K.; Okuno, H.G. Fine-scale observations of spatio-spectro-temporal dynamics of bird vocalizations using robot audition techniques. Remote. Sens. Ecol. Conserv. 2020. [Google Scholar] [CrossRef] [Green Version]
  28. Suzuki, R.; Matsubayashi, S.; Saito, F.; Murate, T.; Masuda, T.; Yamamoto, Y.; Kojima, R.; Nakadai, K.; Okuno, H.G. A Spatiotemporal Analysis of Acoustic Interactions between Great Reed Warblers (Acrocephalus arundinaceus) Using Microphone Arrays and Robot Audition Software HARK. Ecol. Evol. 2018, 8, 812–825. [Google Scholar] [CrossRef]
  29. Eales, L.A. Song learning in zebra finches: some effects of song model availability on what is learnt and when. Anim. Behav. 1985, 33, 1293–1300. [Google Scholar] [CrossRef]
  30. Boogert, N.J.; Giraldeau, L.A.; Lefebvre, L. Song complexity correlates with learning ability in zebra finch males. Anim. Behav. 2008, 76, 1735–1741. [Google Scholar] [CrossRef]
  31. D’Amelio, P.; Trost, L.; Maat, A. Vocal exchanges during pair formation and maintenance in the zebra finch (Taeniopygia guttata). Front. Zool. 2017, 14. [Google Scholar] [CrossRef] [PubMed] [Green Version]
  32. Ikebuchi, M.; Okanoya, K. Growth of pair bonding in Zebra Finches: physical and social factors. Ornithol. Sci. 2006, 5, 65–75. [Google Scholar] [CrossRef]
  33. Griffith, S.C.; Ton, R.; Hurley, L.L.; McDiarmid, C.S.; Pacheco-Fuentes, H. The Ecology of the Zebra Finch Makes It a Great Laboratory Model but an Outlier amongst Passerine Birds. Birds 2021, 2, 60–76. [Google Scholar] [CrossRef]
  34. Schmidt, R. Bayesian Nonparametrics for Microphone Array Processing. IEEE Trans. Antennas Propag. (TAP) 1986, 34, 276–280. [Google Scholar] [CrossRef] [Green Version]
  35. Nakajima, H.; Nakadai, K.; Hasegawa, Y.; Tsujino, H. Blind Source Separation With Parameter-Free Adaptive Step-Size Method for Robot Audition. IEEE Trans. Audio Speech Lang. Process. 2010, 18, 1476–1485. [Google Scholar] [CrossRef]
  36. Sumitani, S.; Suzuki, R.; Matsubayashi, S.; Arita, T.; Nakadai, K.; Okuno, H.G. Extracting the relationship between the spatial distribution and types of bird vocalizations using robot audition system HARK. In Proceedings of the 2018 IEEE/RSJ International Conference on Intelligent Robots and Systems, Madrid, Spain, 1–5 October 2018; pp. 2485–2490. [Google Scholar]
  37. Van der Maaten, L.; Hinton, G. Viualizing data using t-SNE. J. Mach. Learn. Res. 2008, 9, 2579–2605. [Google Scholar]
Figure 1. Experimental environment employing the HARKBird program.
Birds 02 00012 g001
Figure 2. Arrangement of the experimental environment.
Birds 02 00012 g002
Figure 3. A GUI of HARKBird. In the localization panel (a), the user can set specific values of the essential parameters related to localization and separation of bird songs using HARK, which are enumerated in a list. A user can tweak these parameters This helps us to localize the target sound sources (i.e., vocalizations of ZFs) and exclude other noises or unnecessary sounds. The result of the source localization is displayed in can be checked from the annotation tool interface (b), where both spectrogram and MUSIC spectrum are displayed. Each colored box represents the time and DOA of a localized sound source. The length of each box indicates the duration of the localization, and the spectrogram of each separated sound pops up and can be replayed by clicking the corresponding box.
Birds 02 00012 g003
Figure 4. Visualization of localization based on microphone array 4. The top panel represents spectrograms obtained by STFT. The bottom panel shows the MUSIC spectrum (heat map) as well as the direction of arrivals (DOAs) distribution (black bars). We confirmed that these localized sounds included almost all vocalizations by the ZF individuals during the recording.
Birds 02 00012 g004
Figure 5. Spatial division of the tent area for 2D localization. For each area, we conducted 2D localization by using a pair of microphone arrays: array 4 (central) was always included, and was paired with one other array based on the target localization area (color-matched above). For each sound source from array 4, source localization is performed using the combination of sources with the closest distance in the feature space of t-SNE.
Birds 02 00012 g005
Figure 6. Spatial distribution of localized sound sources. The color corresponds to the localized time represented by the color bar. Each localized sound source is connected to the subsequent one by a gray line.
Birds 02 00012 g006
Figure 7. Distribution of localized sound sources from the recordings of the microphone array 4 in the feature space of t-SNE. All were localized in the 2D localization phase. The face color of each dot represented by the hue, saturation, and value color map corresponds to the position at the first dimension. The edge color represented by the gist-rainbow color map corresponds to the position at second dimension.
Birds 02 00012 g007
Figure 8. Spatial, temporal, and spectral dynamics of vocalization among ZF individuals. The top panel represents the temporal changes in the distance of localized sources from the microphone array 4. The bottom panel represents the temporal changes in the direction of the localization results from the microphone array 4. The colors of the dots correspond to the colors given in Figure 7.
Birds 02 00012 g008
Figure 9. Detailed results of that shown in Figure 8 during 40–70 s. Multiple individuals sang alternately at some directions. The dot colors correspond to the colors given in Figure 7.
Birds 02 00012 g009
Figure 10. Detailed results of that shown in Figure 8 during 440–480 s. Multiple individuals sang alternately at approximately 10 and 180 . The dot colors correspond to the colors given in Figure 7.
Birds 02 00012 g010
Figure 11. Changes in the azimuth and distance from the microphone array 4 (center) of each vocalization type. Red bars represent songs, and blue bars represent calls. The length of the bars corresponds to the length of each separated sound.
Birds 02 00012 g011
Figure 12. Vocalization types during 40–70 s.
Birds 02 00012 g012
Figure 13. Vocalization types during 440–480 s.
Birds 02 00012 g013
Publisher’s Note: MDPI stays neutral with regard to jurisdictional claims in published maps and institutional affiliations.

