
Polymer-Derived Nitrogen-Doped Carbon Nanosheet Cluster and Its Application for Water Purification


1
Department of Automotive Engineering, Clemson University, 4 Research Drive, Greenville, SC 29607, USA
2
Clemson Composites Center, Clemson University, Greenville, SC 29607, USA
3
Department of Materials Science and Engineering, Clemson University, Clemson, SC 29602, USA
4
Department of Mechanical Engineering, Clemson University, Clemson, SC 29602, USA
*
Author to whom correspondence should be addressed.
Macromol 2021, 1(2), 84-93; https://0-doi-org.brum.beds.ac.uk/10.3390/macromol1020007
Submission received: 17 December 2020
/
Revised: 16 March 2021
/
Accepted: 17 March 2021
/
Published: 2 April 2021
(This article belongs to the Special Issue Polymer-Based Nanomaterials)
Abstract
:A series of nitrogen-doped carbons (NCs) were prepared by the pyrolysis (300–900 °C) of crystalline polyazomethine (PAM) synthesized via a facile condensation reaction in methanol solvent. The controlled solvent evaporation resulted in PAM crystals in the form of nanosheet clusters with a sheet thickness of ~50 nm. Such architecture was maintained after pyrolysis, obtaining porous CNs of high specific surface areas of up to 700 m2/g. The resulting NCs were used as absorbents to remove aromatic Rhodamine B from water. The NC that pyrolyzed at 750 °C exhibited the highest adsorption capacity (0.025 mg/mg), which is attributed to its high surface area and surface condition.
1. Introduction
Porous carbons (PCs) are important materials that have been used throughout human history. Due to their large surface area, good conductivity, excellent chemical stability, and abundant availability, PC materials have been widely used as absorbents, energy storage materials, catalyst supports, etc. [1,2]. Historically, PCs have been obtained easily by pyrolyzing forestry and agricultural products. PCs produced by this top-down process have predetermined structures that are inherited from their naturally synthesized lignocellulose framework [3]. On the other hand, bottom-up routes which build PCs from molecules provide advantages of pre-designable architecture, controllable synthesis, and tunable functionality; therefore, it is an attractive option to create PCs with tailor-made structural and functional development. Among various bottom-up routes, including chemical vapor deposition (CVD) [4], the templating method [5], and the hydrothermal method [6], polymer-derived carbons are the most attractive one, owing to their high yield and low cost. In this method, PCs are created by pyrolyzing the synthesized polymeric precursors (e.g., phenol, resorcinol, ethylene glycol, formaldehyde etc. [7,8]), endowing us with the ability to alter the properties of PCs through synthesizing different precursors.
Besides the traditional polymeric precursors mentioned above, a special type of polymer termed covalent organic frameworks (COFs) has drawn great attention in preparing PCs. COFs are crystalline porous polymer frameworks with well-defined high-order structures. This special architecture is attributed to the “self-templated” polymerization, where the initial molecular structure provides specific sites to guide the subsequent monomers into place, letting the polymer chain extend over a 2D plane or 3D frame with a highly aligned arrangement [9]. COFs possess the advantages of having a large surface area, high porosity, tunable composition, and designable dimension of molecular skeleton and pores, all of which are essential parameters to design and build PCs in the bottom-up manner. To synthesize COFs, the building blocks, mainly the monomers with π-backbones and rigid conformations, are connected through boronate-ester, imine, C=C, and other linkages under mild conditions [9], thus resulting in a facile method to prepare COFs as precursors for PC production.
COFs have been reported as a PC precursor in many recent studies, exhibiting a high surface area, high porosity, and hetero-element doping in versatile applications such as absorbents [10], membrane capacitive deionization [11], electrodes of batteries [1], among others. In these studies, COFs were synthesized via a condensation reaction between geometrically symmetric building blocks with multiple reaction sites. The insoluble crosslinked COFs precipitated from the liquid phase in the form of irregular porous resins and yielded PCs of a similar architecture [1,10,11]. We therefore hypothesized that, if the COF separation process can be conducted in a more controlled manner (than precipitation), it could allow the slow stacking and organization of COFs molecules to yield COFs with long-range ordering and a well-developed 2D architecture. These resultant 2D COFs can be further converted to 2D carbons, which are reminiscent of graphene; the carbon has excellent properties but is difficult to produce.
In pursuit of the facile creation of 2D nanocarbon, we report a method to synthesize poly(azomethine)-based (PAM-based) 2D COFs via the condensation of p-phenylenediamine and terephthalaldehyde. Unlike any other previously reported PAM-based COFs, in this method the as-synthesized PAMs molecule self-assembled into a COF with a 2D architecture upon the controlled solvent evaporation. The product from the high-efficiency synthesis and controlled self-assembly process resembled a porous graphitic structure with individual graphenic planar sheets. Using a facile annealing method, the COF was further converted to 2D carbon with nitrogen-doped graphitic structures and a tunable surface area (up to ~700 m2/g). We also demonstrate the utility of the COF-derived PC for water purification. While this report confined the application to water purification, we expect the material to find use in various other areas, including electronics or optoelectronics, catalysis, photovoltaics, etc., leading to the greater utilization of PAM-based COFs.
2. Experimental Section
2.1. Materials
All the reagents used in this study including terephthalaldehyde (Acros Organics, 98%), p-phenylenediamine (Alfa Aesar, 97%), methanol (VWR chemicals BDH, 99.8+%), and Rhodamine B (Acros Organics, 98+%) were commercially available and used without further purification Deionized water was used in all experiments.
2.2. Synthesis of Polyazomethine
P-phenylenediamine (0.3 mol) and terephthalaldehyde (0.3 mol) were dissolved in 150 mL of methanol individually and mixed together in a glass beaker. The mixture was then placed in the fume hood to let the reaction complete and the methanol evaporate. After all the methanol evaporated, the solid product was collected and washed on a filter paper with 200 mL of methanol. The product was then subjected to the annealing at 300, 450, 600, 750, and 900 °C for 2 h (at the heating/cooling rate of 10 °C/min) under a N2 flow in a furnace. The final carbonaceous products were named NC-300, NC-450, NC-600, NC-750, and NC-900 according to their carbonization temperature and stored in dry conditions.
2.3. Material Characterization
Attenuated Total Reflectance Fourier Transform-Infrared (ATR-FTIR) Spectroscopy was performed on a Thermo-Nicolet Magna 550 FTIR spectrometer. Thermogravimetric analysis (TGA) was performed using a TGA Q5000 instrument. A ~5.0 mg specimen was heated from room temperature to 1000 °C at 10 °C/min in the N2 atmosphere. Scanning Electron Microscopy (SEM) (Hitachi, S-4800) was used to obtain the surface morphology of PAM and NCs at an accelerating voltage of 5.0 kV. The as-prepared PAM, NC-300, and NC-450 were coated with a 2 nm gold layer before imaging in order to obtain clear SEM images, while other CN samples were imaged without the Au coating due to their sufficient conductivity. Transmission Electron Microscopy (TEM) (Hitachi, HD-9500) was used to measure pristine PAM and NC-750 at voltages from 200 to 500 KV. All the specimens were imbedded in epoxy resin first and then cut into 80-nm-thick slides for observation. Both TEM images and live fast Fourier transform (FFT) of the TEM images were collected. X-ray Diffraction (XRD) measurements were carried out using a Rigaku Ultima III X-ray diffractometer equipped with a primary monochromator and Cu Kα source. The XRD patterns were collected with steps of 0.05° in the 2θ angular range from 10° to 50°. Raman spectroscopy were performed on a Jobin Yvon Horiba—LabRam confocal Raman spectrometer using the He-Ne laser with an emission at 632 nm. The spectra were collected from 100 to 300 nm. X-ray Photoelectron Spectroscopy (XPS) was performed with a Kratos Axis Ultra XPS spectrometer. The surface areas of PAM and CNs were determined using a Quantachrom Autosorb 1Q apparatus. The nitrogen adsorption isotherms were collected at −196 °C. The samples were degassed at 100 °C overnight before the adsorption measurement. The specific surface areas were calculated using the Brunauer–Emmett–Teller (BET) equation (P/Po = 0.05–0.20).
2.4. Water Purification Capacity Measurement
Adsorption experiments were carried out at room temperature to investigate the adsorption behaviors of Rhodamine B (RhB) towards the PAM and CNs. The absorbent—i.e., the PAM or NCs—was added to the 0.132 mg/mL RhB solution to the final concentration of 1, 2, 3, or 6 mg/mL, followed by stirring (200 rpm) at room temperature for 60 min. The free RhB in the solution was monitored using an Ultraviolet-Visible spectrophotometer (UV-Vis) (VWR UV-6300PC). Specifically, every 10 min an aliquot of the mixture was collected and centrifuged. Then, the absorbance of the supernatant was measured. The adsorption capacities of the adsorbents were calculated according to the Equation (1):
where A0 and At represent the UV-Vis absorbance values at the beginning and at t min. CR and CNR are the initial concentrations of RhB and CN, respectively.
3. Results
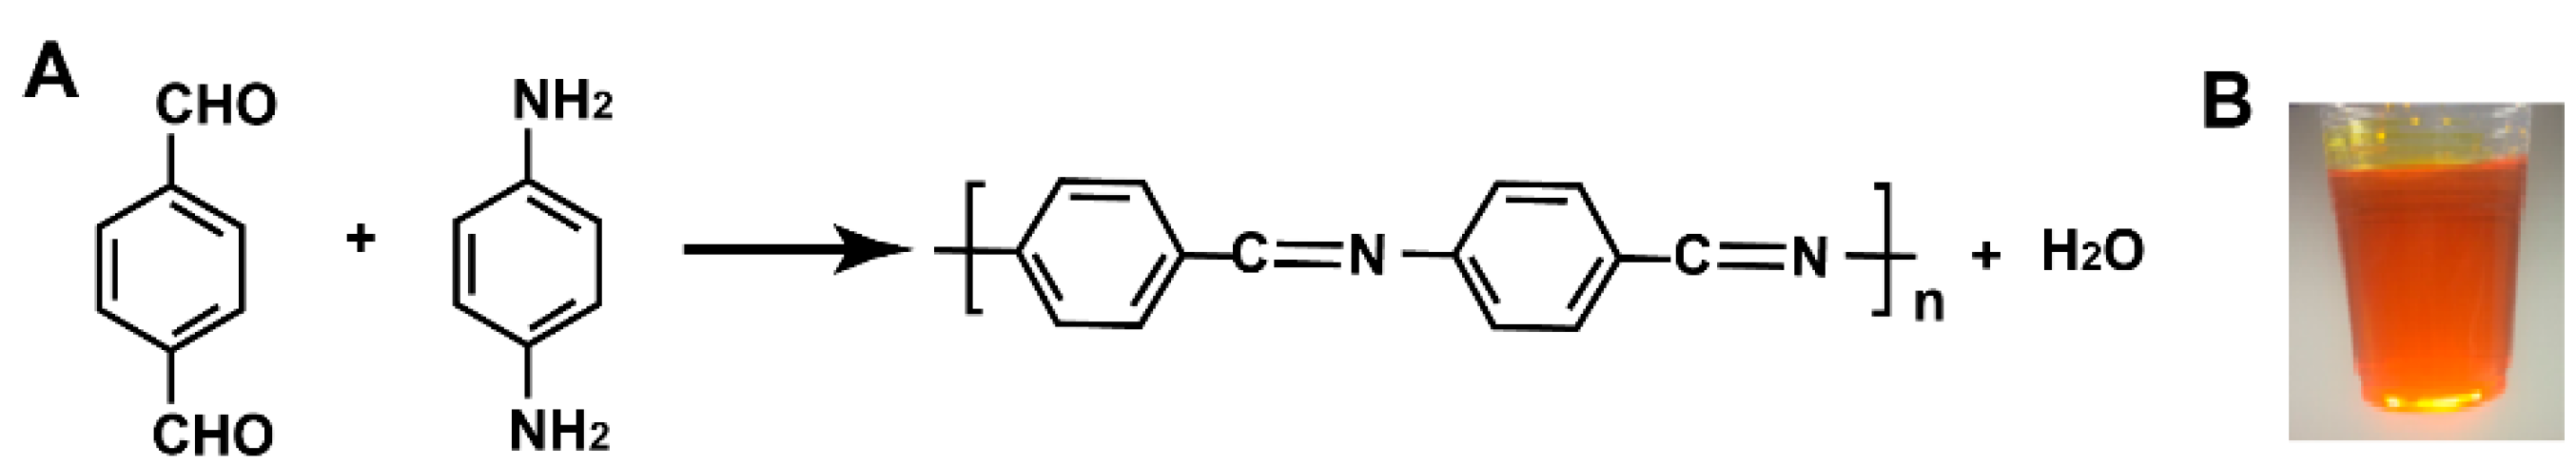
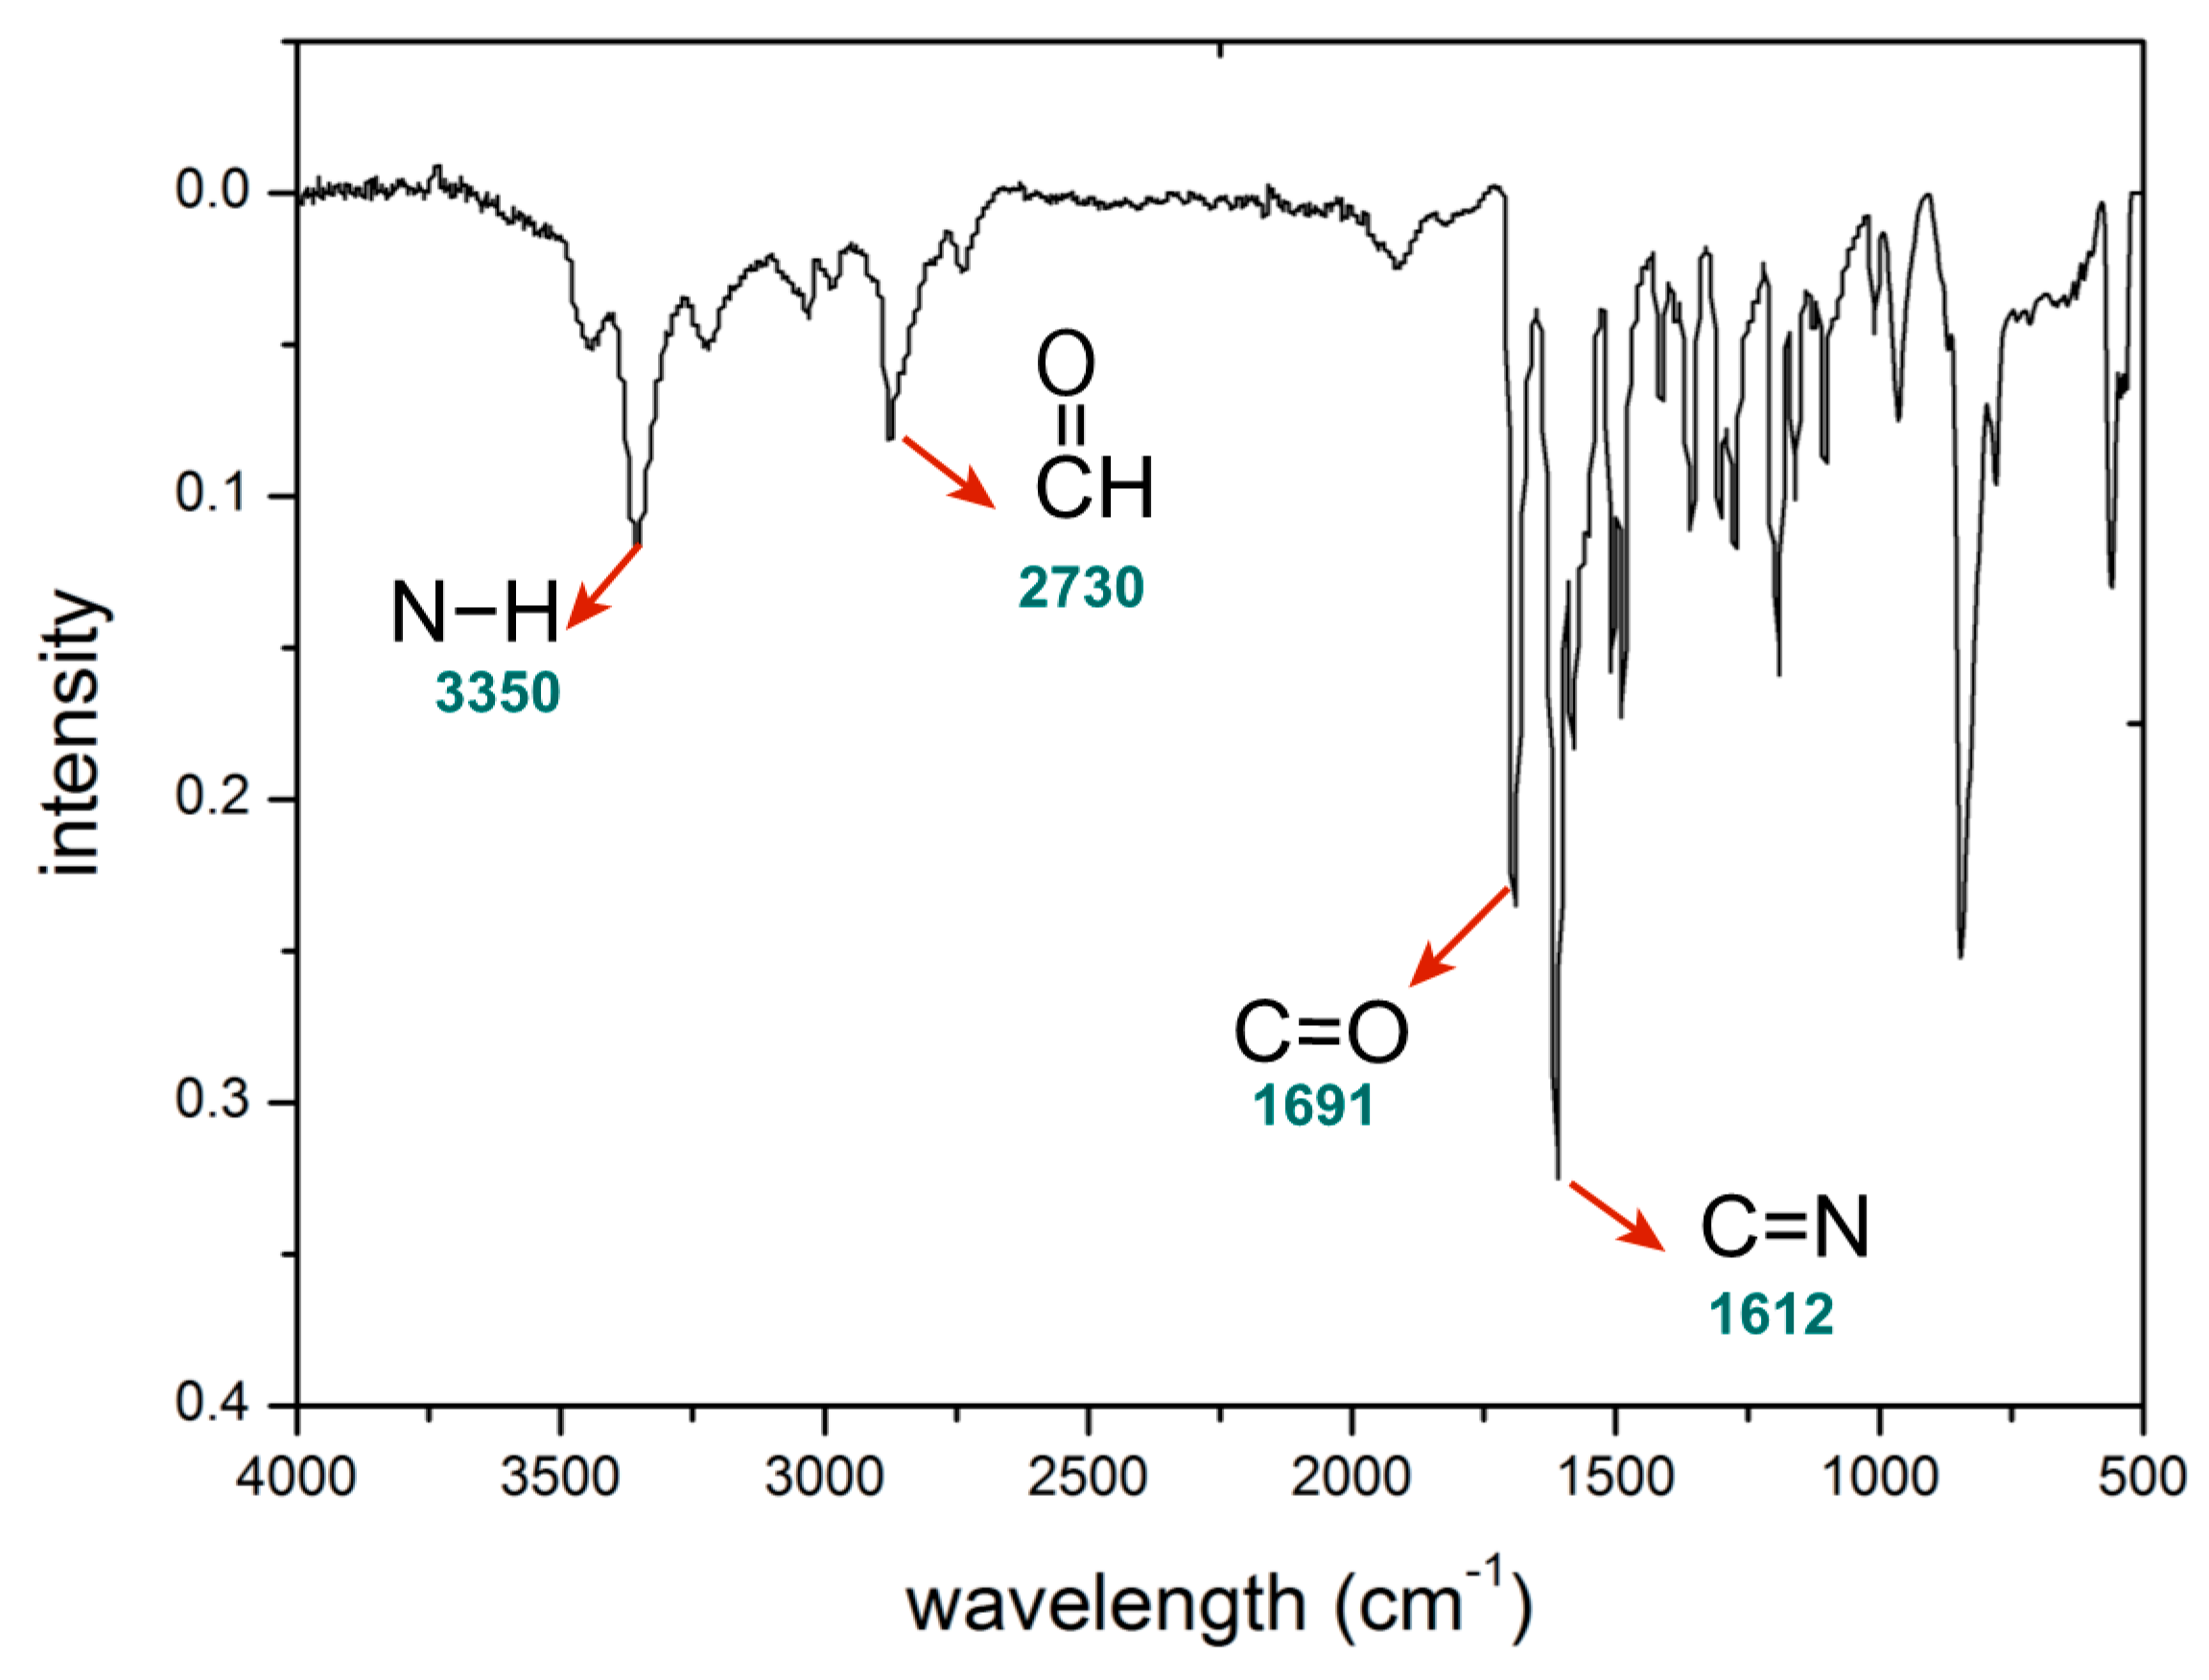
As shown in Figure 1, the PAM could be facilely prepared via the condensation reaction between the dialdehyde and diamine in the methanol. The FTIR spectra of the product are shown in Figure 2, confirming the formation of imine. The pronounced band at ~1612 cm−1 in the spectrum corresponds to CH=N stretch in azomethine, which is evidence of imine being synthesized by the reaction. The smaller band at ~1691 cm−1 can be assigned to the unreacted aldehydes and chain ends of synthesized PAM. The peak at ~2730 cm−1 corresponds to the aldehyde stretching; the peak at ~3350 cm−1 is attributed to the secondary amine stretching. These results indicate a large amount of residual aldehyde and amine groups existing in PAM, implying the relatively low degree of polymerization of PAM [12]. The low molecular PAM was dissolvable in methanol, resulting in a translucent solution in the color of orange (Figure 1B). The oligomers further self-assemble to layered structures during the evaporation of methanol, obtaining flask-like crystals.
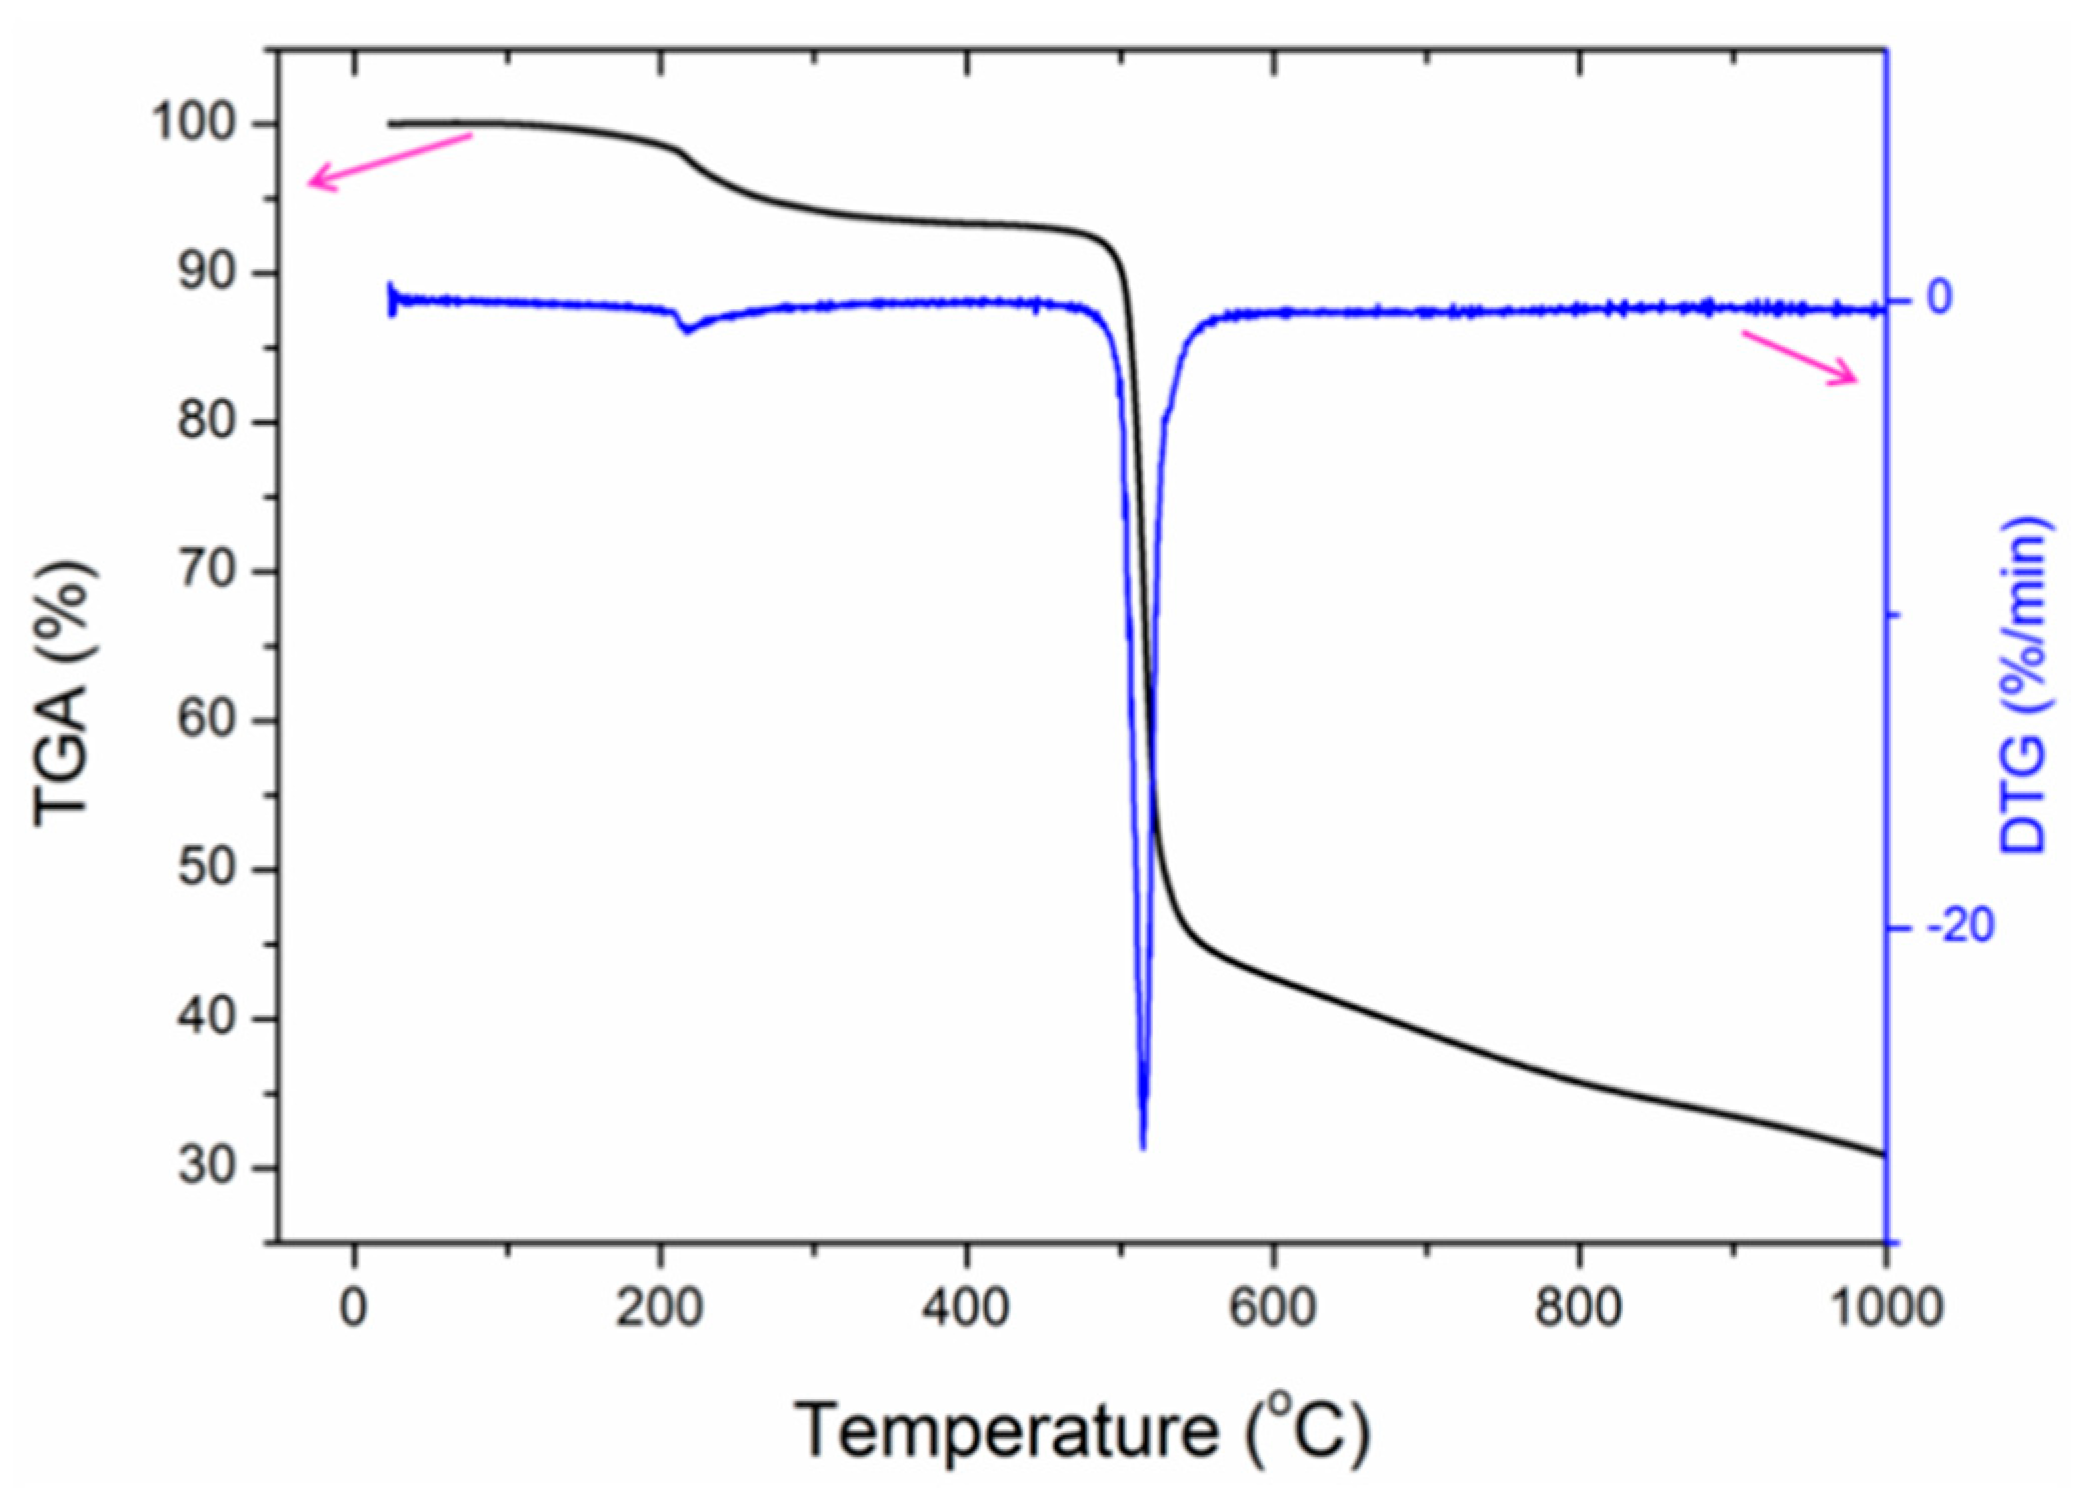
TGA was carried out to investigate the thermal stability of PAM (Figure 3). Two weight loss stages were observed in the TGA curve. The first stage of 6.4 wt% loss occurred in the range of 100 to 300 °C with a maximum mass loss rate at ~214 °C. This weight loss could be attributed to the release of the newly produced water by the condensation between the remaining dialdehyde and diamine at an elevated temperature. This result is consistent with that for the imine-linked amorphous and porous polymer reported earlier [13,14], suggesting that the condensation polymerization can further proceed at a high temperature (e.g., 214 °C). The second stage occurred between ~440 and ~540 °C, with a mass loss of ~55 wt%. This mass reduction is ascribed to the carbonization of PAM in N2, indicating the temperature range of carbonization [15].
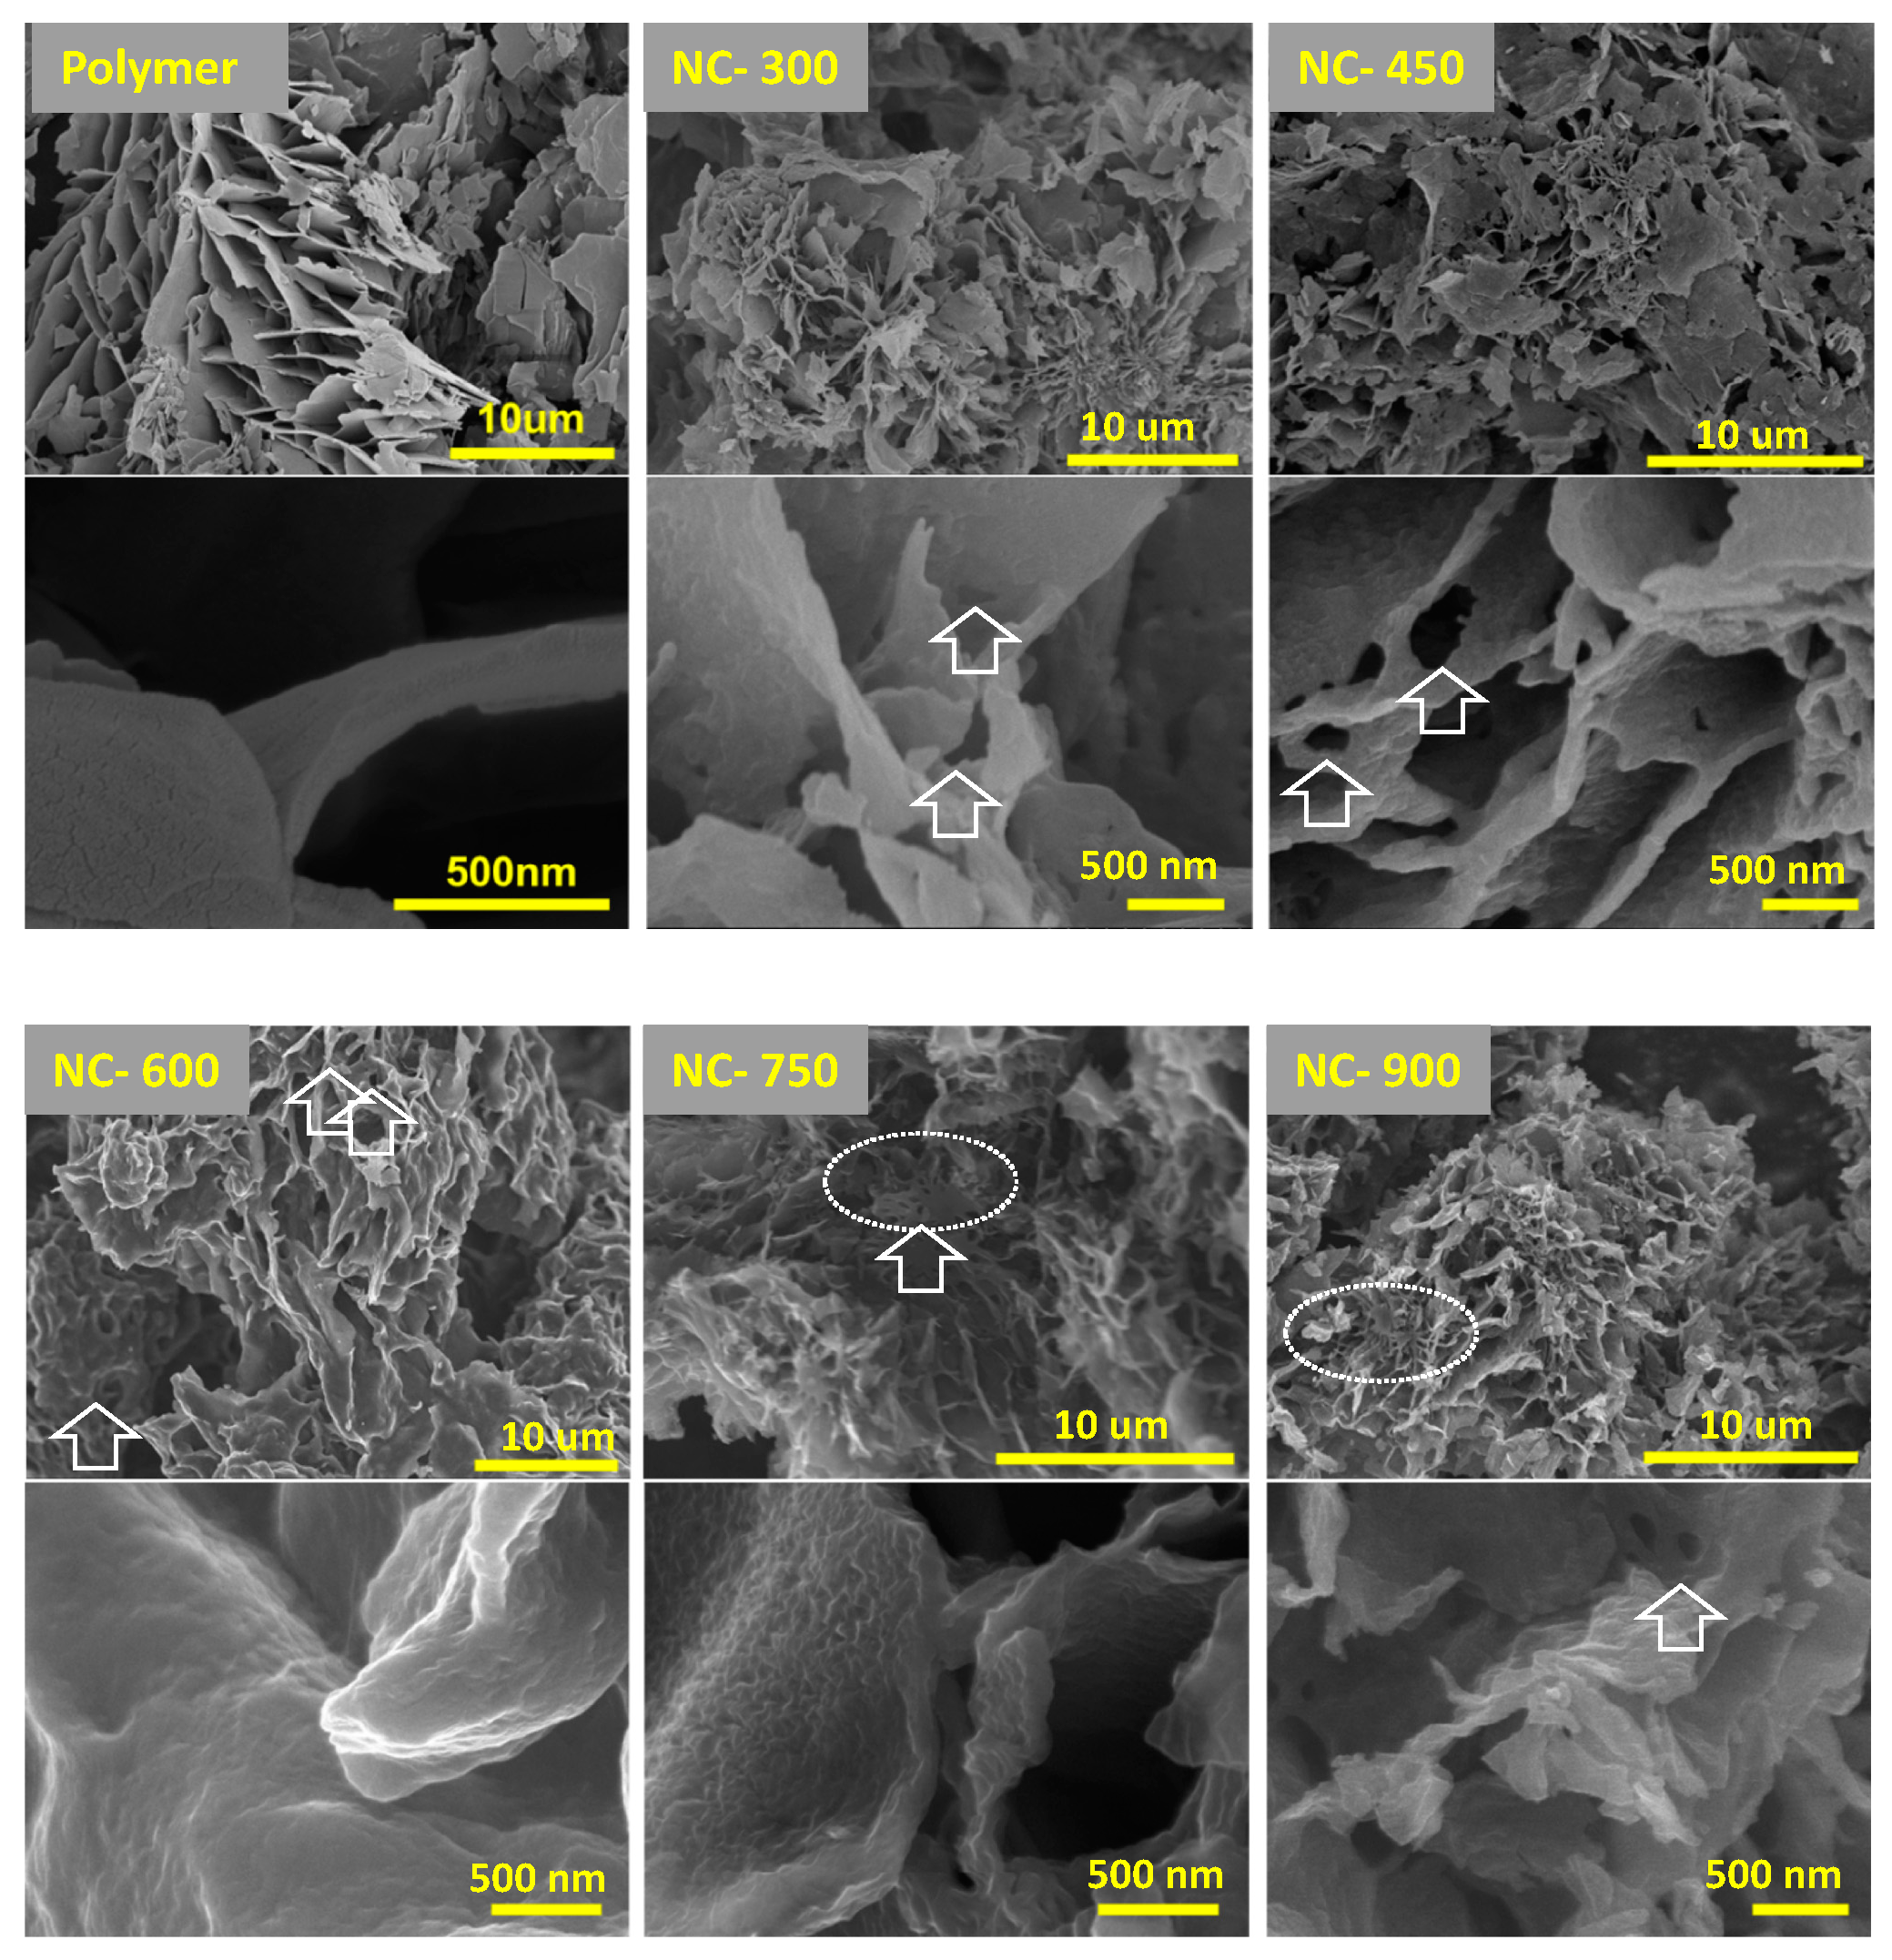
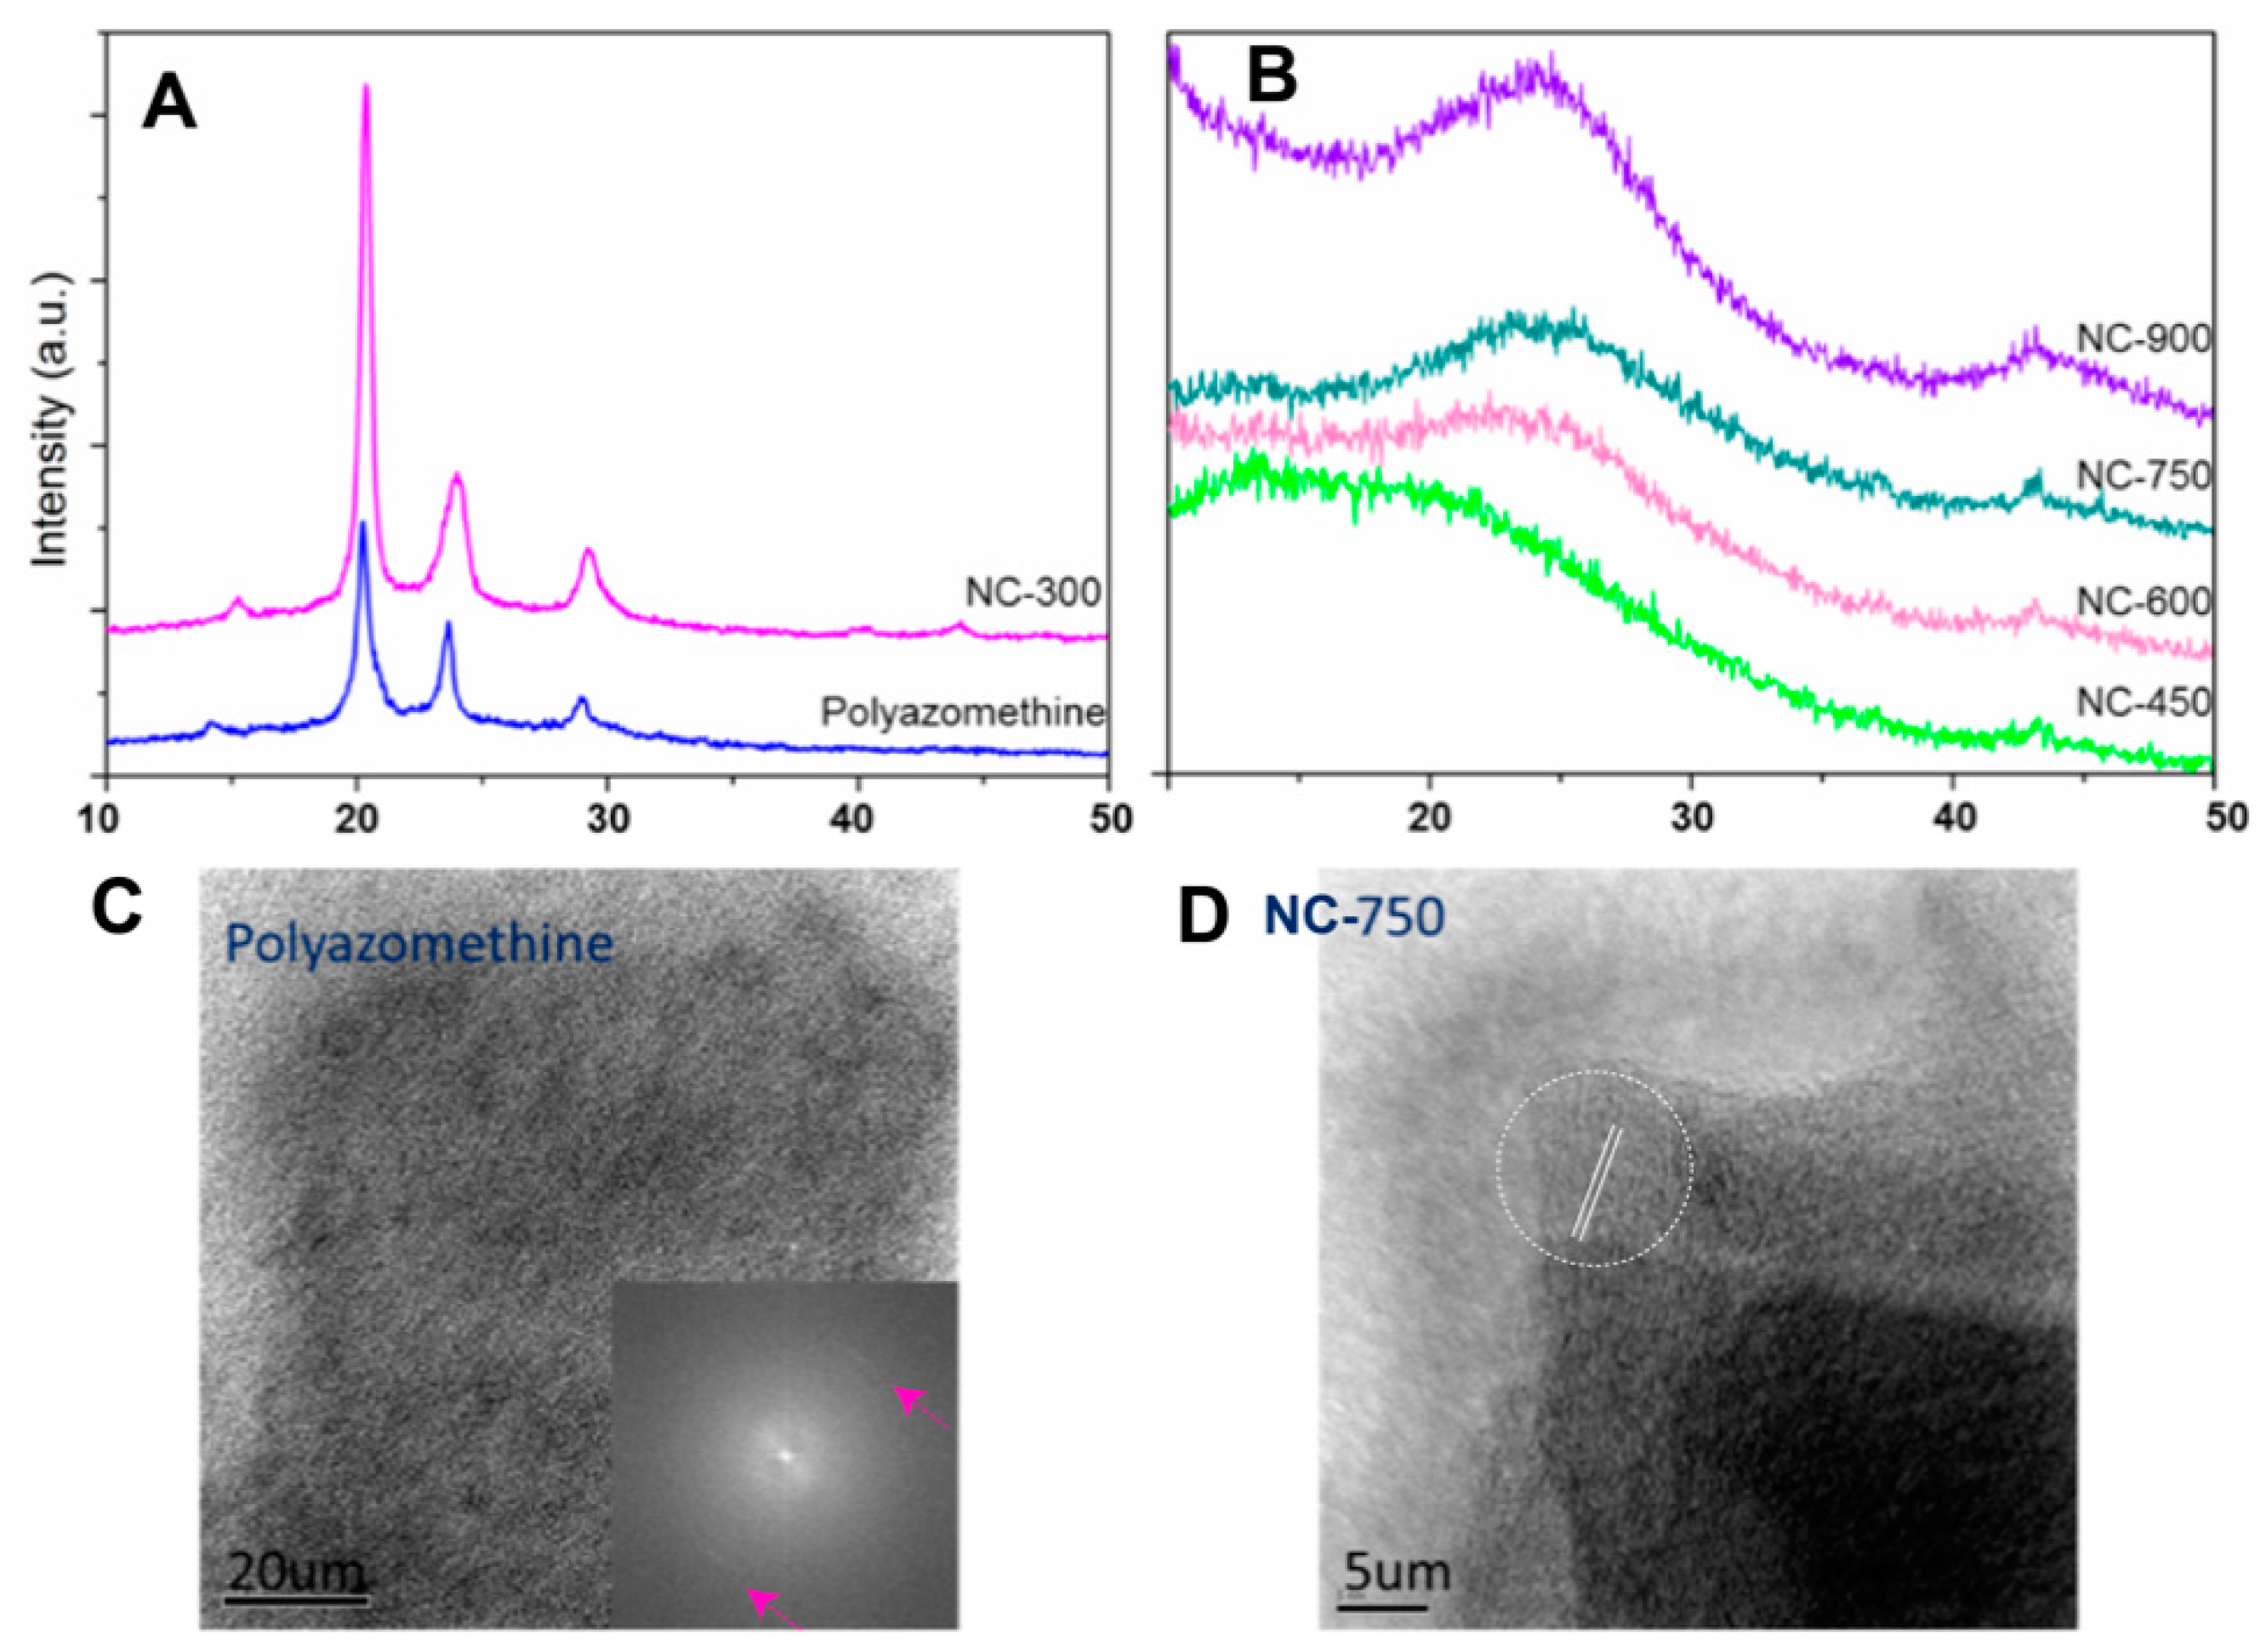
The morphology of the synthesized PAM and NCs derived at different temperatures is shown in Figure 4. The PAM shows a flake-like morphology and a porous architecture, which is distinct from that of other PAM-derived porous carbons in the morphologies of needlelike [12], disk-like [16], or random aggregates [13]. The formation of such highly ordered structures is due to the dynamic covalent chemistry controlled condensation reaction of p-phenylenediamine and terephthalaldehyde as well as the conjugation of the linear PAM molecule chains during evaporation [17]. The as-synthesized PAM exhibited a typical crystalline structure, with a thickness of sheets of less than 50 nm (Figure 4). After annealing, the polymer crystalline structure changed (Figure 5A,B), while the nanosheet cluster remained. As presented in the SEM images, the NC sheets are of ~50 nm in thickness, possessing large surface areas. Additionally, holes and defects appeared in the nanosheet after carbonization (white arrows in Figure 4), further increasing their surface area. The formation of defects results from the high-temperature annealing activation, which is evident in sample NC-750 (dash circle in Figure 4). When the carbonization temperature exceeds 750 °C, the surface defects were exacerbated, accompanied by the shrinkage and collapse of the nanosheet clusters, thereby reducing the overall surface area. These results are consistent with the decreased carbon yields at high carbonization temperatures, as observed in the TGA measurements (Figure 3).
The XRD patterns of PAM and CNs are presented in Figure 5. Four peaks were observed in both PAM and NC-300 at 2θ of 14.4°, 20.3°, 23.7°, and 29.0°, corresponding to (002), (110), (200), and (210) diffractions, respectively [18]. The sharp peaks suggest the PAM has a high crystallinity, which is associated with molecule self-assembly during methanol evaporation. The typical peaks observed in PAM were retained in NC-300. Meanwhile, for NC-450, NC-600, NC-750, and NC-900, a broad peak centered at 2 of 24° and a narrow peak centered at 2 of 44° were observed, which are attributed to (002) and (100) diffractions of a layered graphitic structure. The loss of sharp diffraction signals indicates the transition from crystalline polymer to an amorphous random framework during the pyrolysis. These two bands indicate the formation of graphitic structures in NC-450, NC-600, NC-750, and NC-900. Compared to other CNs, NC-900 exhibited the highest peak at 2 = 44°, implying its high graphite percentage [19]. Moreover, the high-resolution TEM image and FFT result show that the PAM has a highly regulated structure (see spots indicated by pink arrows in Figure 5), further confirming the crystallinity of the PAM-based COF. In addition, lattice fringes appeared in the NC-750 TEM image (white-circled region in Figure 4), suggesting the formation of nanostructures. These results are in agreement with the XRD analysis, demonstrating the structural transition from crystalline PAM to graphitic carbon.
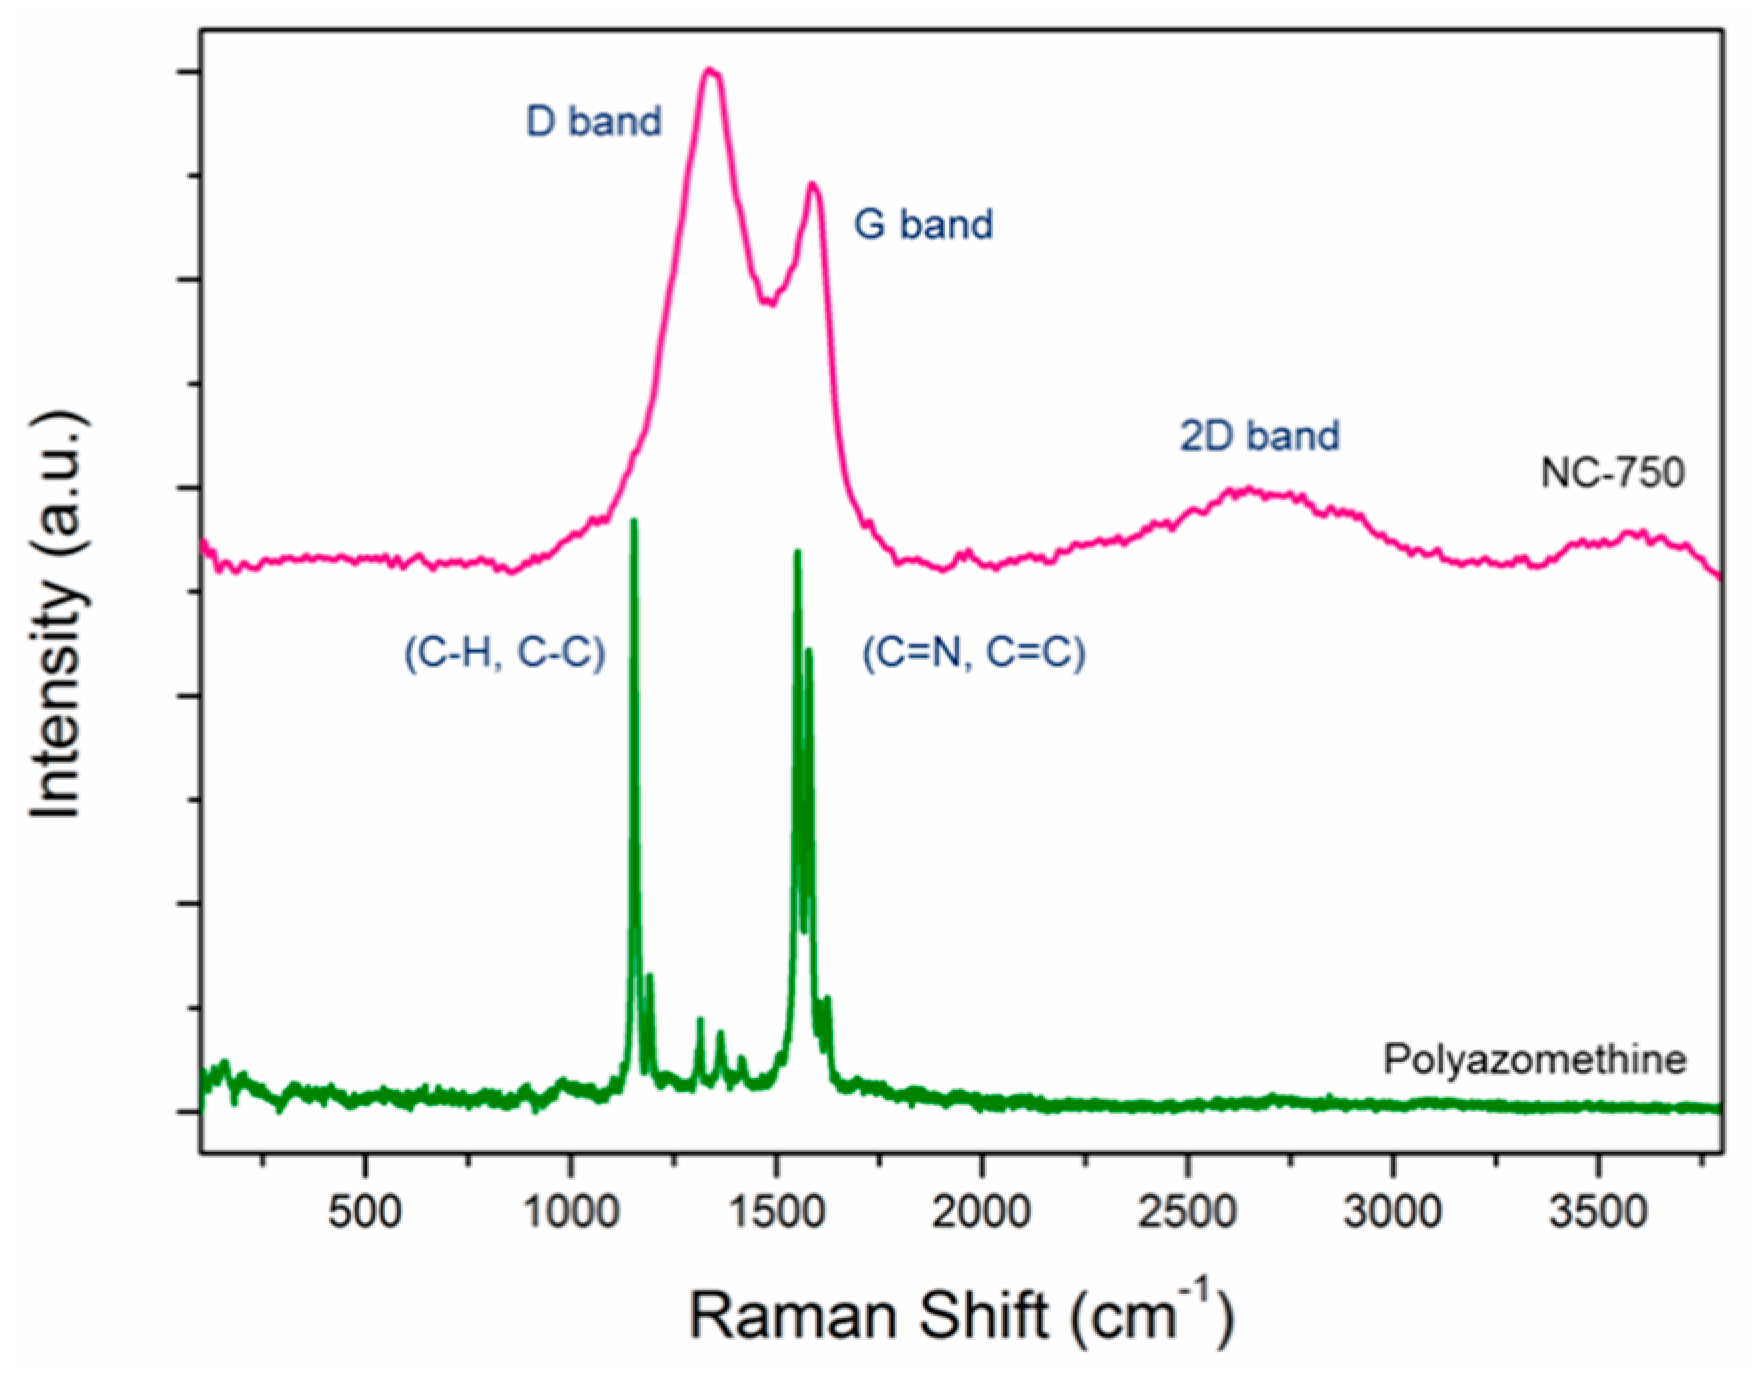
The Raman spectra of PAM and NC-750 are shown in Figure 6. NC-750 exhibits an evident D band (at 1337 cm−1) and G band (at 1584 cm−1), corresponding to the structure of sp3-hybridized disordered carbon and sp2-hybridized graphitic carbon, respectively. The Raman pattern suggests the formation of graphitic carbon after high-temperature annealing. The pronounced D band in NC-750 indicates the presence of defect sites [20,21], which are associated with defects caused by nitrogen atoms in the graphitic structure [22]. The 2D band in NC-750 at 2700 cm−1 suggests the graphitic sp2 materials and implies the existence of single-layer graphene-like structure in the materials. The Raman bands of PAM at 1570 cm−1 and 1622 cm−1 are attributed to the stretching vibrations of the benzene ring and C=N, respectively. Meanwhile, the band at 1197 cm−1 corresponds to the C-C of the benzene ring [23]. The spectra of PAM further confirm the imine formed by the condensation reaction [24].
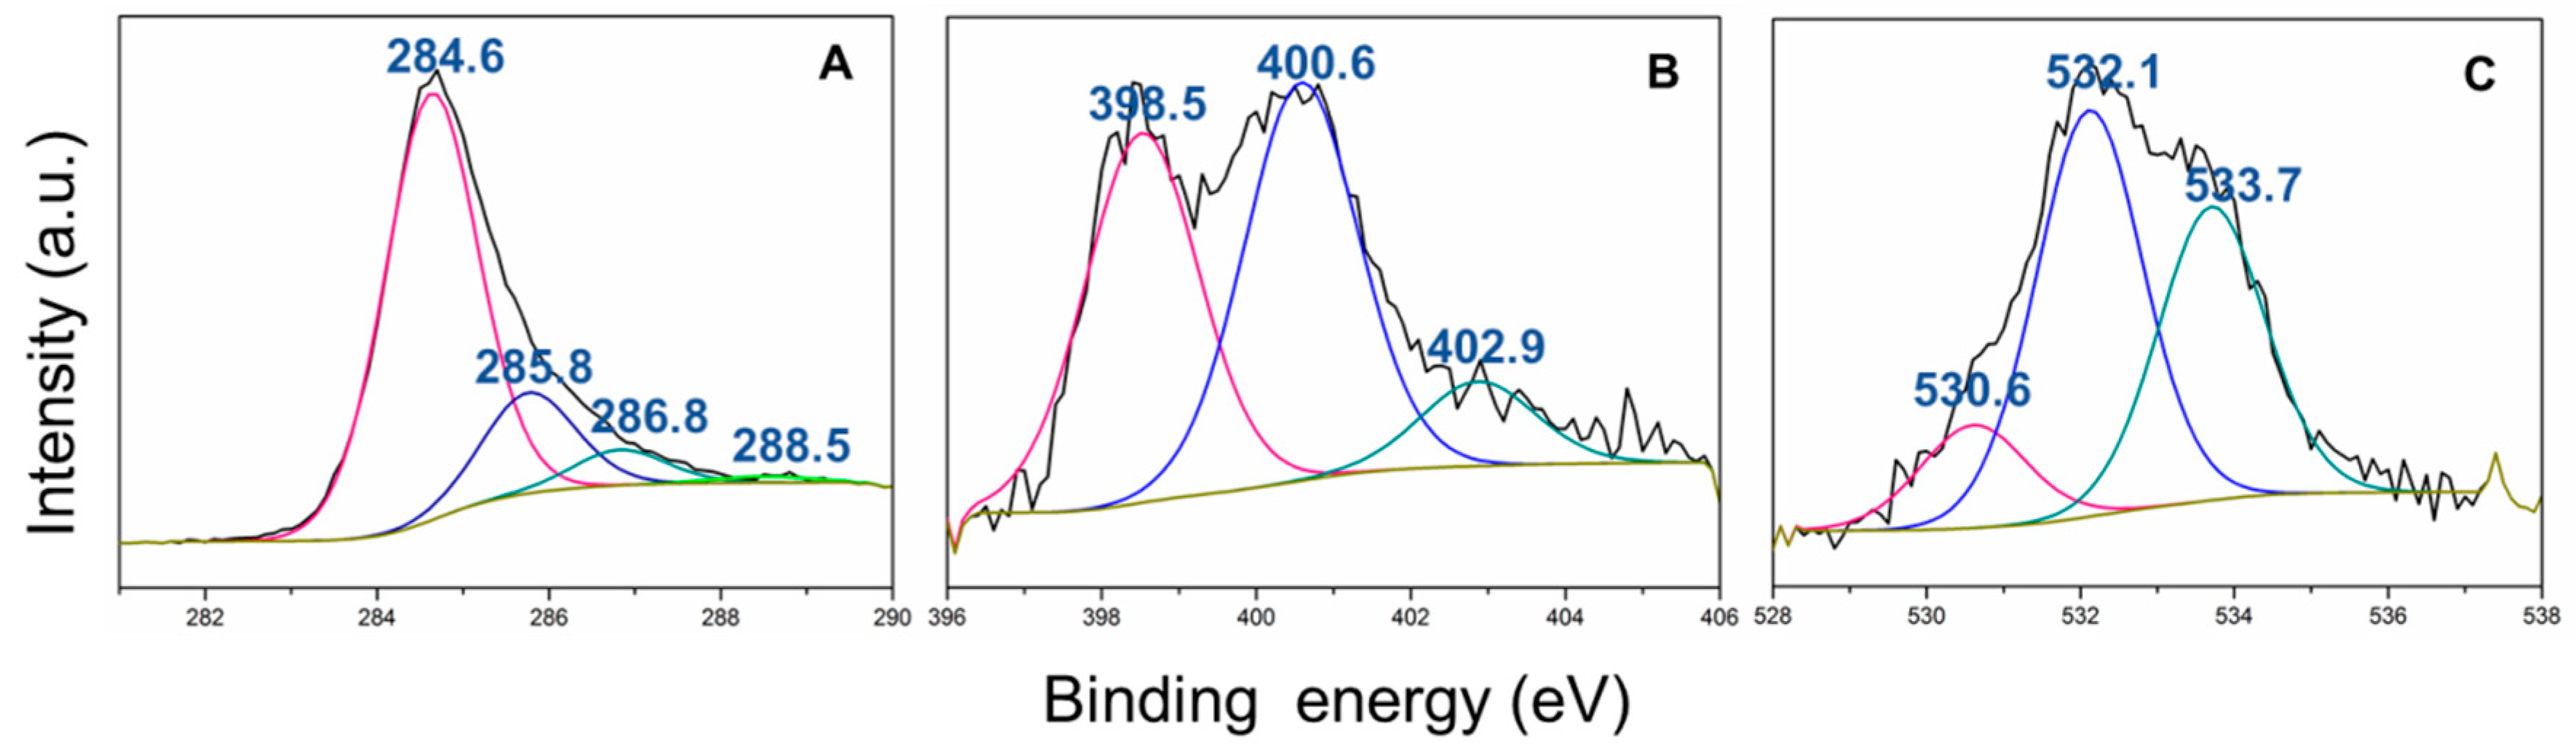
The existence of various functionalities is evident in the XPS spectrum (Figure 7). The strong C1s signal at 284.6 eV (Figure 7A) is associated with the sp2-hybridized carbon, suggesting that carbon elements were dominantly arranged in the graphitic structure. The broad peak at 288.5 eV is the overlaid C-N and C-O peaks, suggesting that the nitrogen or oxygen elements were doped into the graphitic structure as defects. The peak centered at 286.8 eV indicates the presence of C=N, probably related to the amide synthesized in the condensation reaction. The deconvolution of the O1s spectrum (Figure 7B) gives three components (centered at 530.6, 532.1, and 533.7 eV), which correspond to the N-C=O, C=O, and C-O entities, respectively. It has been reported that oxygen-containing functional groups at the carbon surface play a critical role in the adsorption capacity of porous carbons because they promote carbon wettability and also regulate the formation of water clusters at the carbon surface [25,26]. The N1s peaks centered at 398.5, 400.6, and 402.9 eV (Figure 7C) correspond to the -N=C-, -N+H-, and =N+H- components. The XPS spectra confirm the C-N conjugated structure in the graphitic structure of NCs.
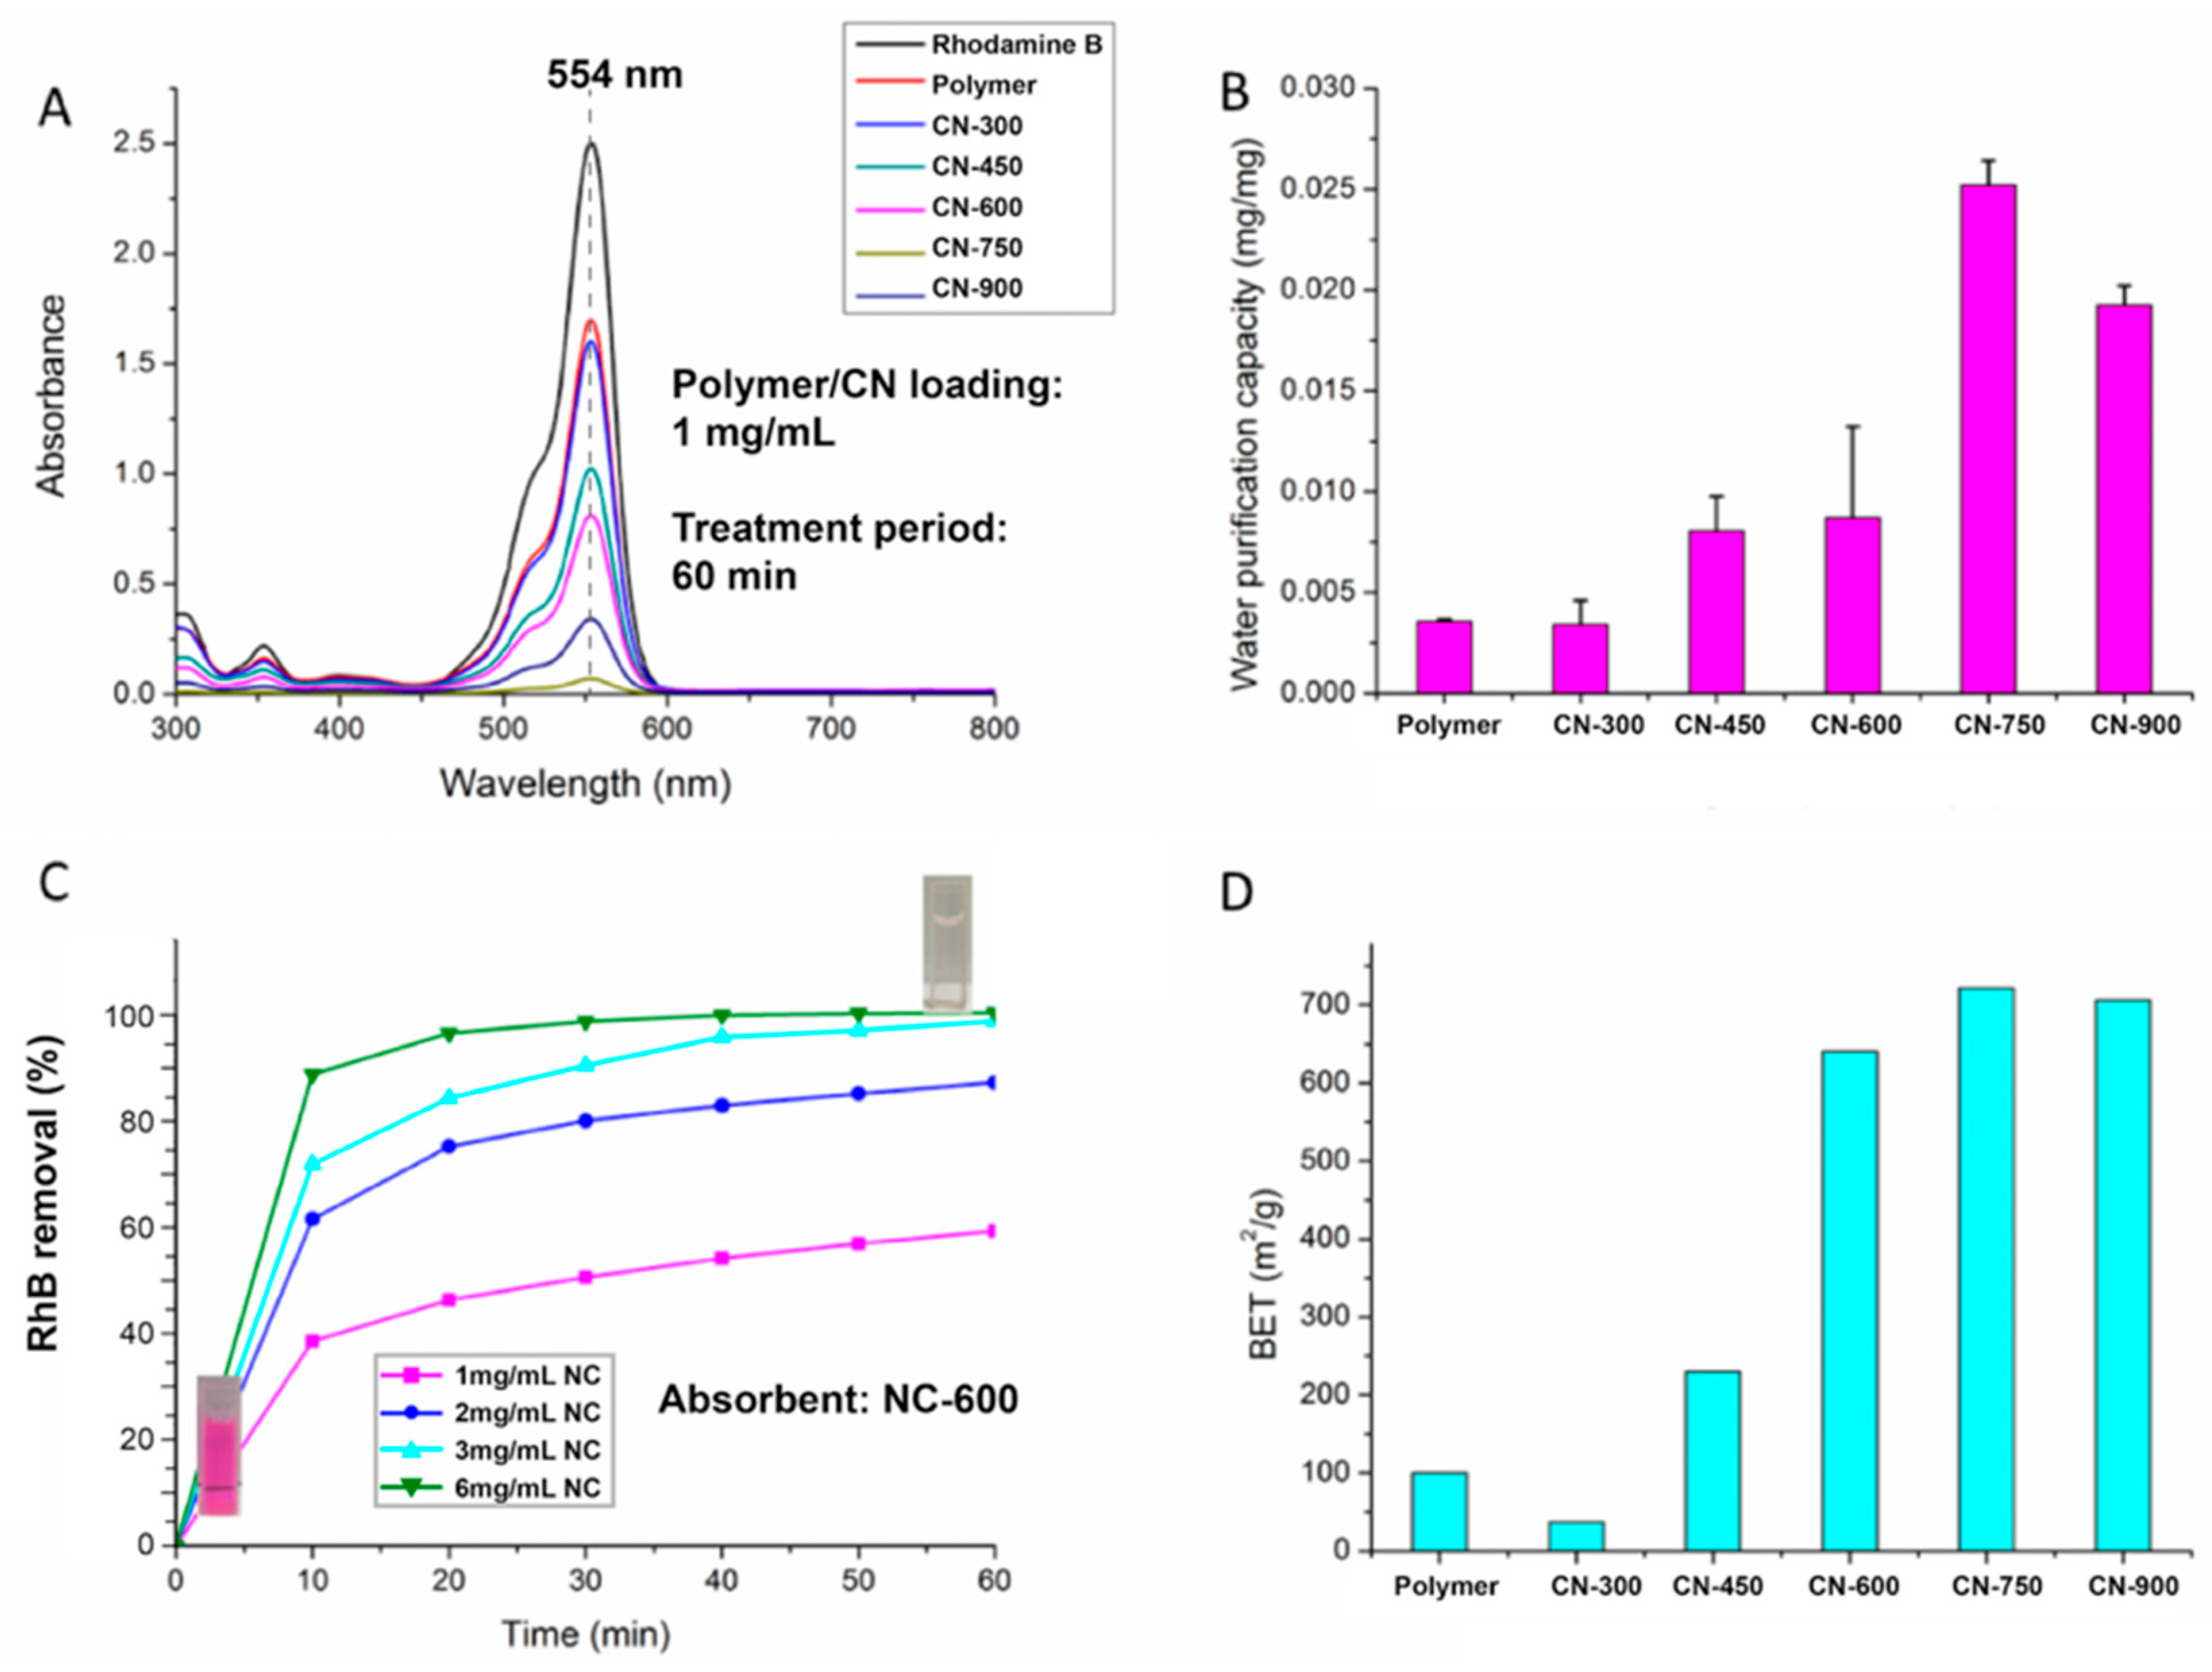
To evaluate the water purification capacity of NCs, the rhodamine B (RhB) was chosen as the model contaminant, and its aqueous solution was treated with CNs of different types and amounts. The levels of residual RhB in the solution were then determined by measuring the absorbance of the treated RhB solution. The maximum absorbance was observed at 554 nm (Figure 8A), which is proportional to the concentration of the remaining RhB in the solution. The RhB solution after the NC-750 treatment showed the lowest peak intensity, implying it had the highest purification capacity of NC-750 among CNs. On the contrary, NC-300 gave the highest peak height, suggesting it had the lowest adsorption capacity. Furthermore, the continuous increase in the adsorption capacity (from PAM to CN-750) reflects the evolution of the material during the carbonization. NC-300 presented a similar dye absorption profile to that of PAM (Figure 8A), implying the lower impacts of the 300 °C heat treatment on the adsorption properties of the polymer. This result is consistent with the XRD results (Figure 5A), in which the typical PAM crystalline structure was retained in NC-300. On the other hand, higher carbonization temperatures have significant impacts on the absorption properties of CNs. The water purification capacity of CNs increased dramatically when the carbonization temperature exceeded 300 °C, achieved a maximum at 750 °C, and reduced slightly in NC-900 (Figure 8B,D). The RhB absorption is related to the surface area (SA) and the dye-carbon interaction at the surface, both of which are associated with the pyrolysis temperature. The NC SA measured by the BET method clearly demonstrated the correlation between high SA and high carbonization temperature (Figure 8C,D). Pyrolysis at 300 °C leads to a decrease in SA, which might be related to the collapse of small pores caused by polymer melting. Pyrolysis above 600 °C led to an SA of 675–700 m2/g, which is considerably higher compared with that of other PAM-derived NCs without further activation [13]. Therefore, the lower purification capacity observed in NC-600 and NC-900 could be ascribed to their surface conditions, which are unfavorable for RhB-NC adsorption. It is conceived that aromatic RhB was adsorbed on the graphene-like carbons surface through intensive π-π stacking interaction and electrostatic interaction (graphene is negatively charged and RhB is positively charged) [27]. The CN-600 possessed a low adsorption capability in spite of its high SA, probably implying the undeveloped graphene structure processed at low temperature (600 °C). Figure 8C demonstrates absorption kinetics of the CN. It is noted that curves of CN-750 were not presented, regardless of its high purification capacity. This is because CN-750 absorbs RhB very fast, reaching a ~100% RhB removal at a low CN-750 loading within a short period (e.g., 1 mg/mL within 30 min and 2 mg/mL within 20 min), yielding overlapped curves that are unclear to demonstrate. Instead, the curves of CN-600 manifested the absorption behavior more clearly, suggesting that the purification rates decreased after 20 min and became stable gradually after 30 min for all different concentrations. Both the 3 and 6 mg NC-600 can remove all the contaminant within 60 min, resulting in the colorless solution seen in Figure 8C.
4. Conclusions
We have demonstrated an easy one-step method to synthesize polyazomethine nanosheet clusters via a condensation reaction followed by solvent evaporation. The hierarchical structure could be retained after pyrolysis, during which the crystalline polymer was converted to nitrogen-doped carbon nanosheets (NCs). The pyrolysis temperature was found to be a critical parameter for the properties of the CNs. CNs treated at 600–900 °C possessed large surface areas of up to 700 m2/g, assembled by ~50 nm-thick nanosheets. Pyrolysis also created holes and defects on the sheets, which further increased surface area of CNs. The resulting CNs were composed mainly of graphic carbons with nitrogen and oxygen doping that was introduced by the polymer synthesis and carbonization. The as-prepared porous CNs were used to absorb aromatic dye in the water. The CNs exhibited a good adsorption capacity. CN-750 displayed the highest adsorption capacity (0.025 mg), attributed to its high surface area, graphitic nature, and surface condition. This study highlights the bottom-up synthesis of 2D carbon nanosheets through self-templated assembly. This method enables molecular architectural design, controllable synthesis, and tunable functionality, therefore providing potential applications not only in water purification but also where next-generation carbon materials with a high surface area, open pores, precision molecular design, and long-range regularity could be used for, e.g., energy storage, gas separation, catalysis, and electronic devices.
Author Contributions
Conceptualization, X.Y. and S.P.; methodology, X.Y.; validation, X.Y., and T.Z.; formal analysis, X.Y. and T.Z.; writing—original draft preparation, X.Y.; writing—review and editing, T.Z.; supervision, S.P.; project administration, S.P.; funding acquisition, S.P. All authors have read and agreed to the published version of the manuscript.
Funding
This research was funded by the Animal Coproducts Research and Education Center consortium and the office of the Vice-President for Research at Clemson University, Robert Patrick Jenkins Professorship, and Dean’s Faculty Fellow Professorship. T.Z. would like to acknowledge the financial support provided by the Cooper-Standard Postdoctoral Fellowship.
Institutional Review Board Statement
Not applicable.
Informed Consent Statement
Not applicable.
Data Availability Statement
The data presented in this study are available on request from the corresponding author.
Acknowledgments
The authors would like to acknowledge Kimberly Ivey for her support in TGA and FTIR analysis.
Conflicts of Interest
The authors declare no conflict of interest.
References
- Zhang, X.; Zhu, G.; Wang, M.; Li, J.; Lu, T.; Pan, L. Covalent-organic-frameworks derived N-doped porous carbon materials as anode for superior long-life cycling lithium and sodium ion batteries. Carbon 2017, 116, 686–694. [Google Scholar] [CrossRef]
- Tian, W.; Zhang, H.; Duan, X.; Sun, H.; Shao, G.; Wang, S. Porous Carbons: Structure-Oriented Design and Versatile Applications. Adv. Funct. Mater. 2020, 30, 1909265. [Google Scholar] [CrossRef]
- Lee, J.; Kim, J.; Hyeon, T. Recent progress in the synthesis of porous carbon materials. Adv. Mater. 2006, 18, 2073–2094. [Google Scholar] [CrossRef]
- Fleming, E.; Du, F.; Ou, E.; Dai, L.; Shi, L. Thermal conductivity of carbon nanotubes grown by catalyst-free chemical vapor deposition in nanopores. Carbon 2019, 145, 195–200. [Google Scholar] [CrossRef]
- Sobrinho, R.A.L.; Andrade, G.R.S.; Costa, L.P.; de Souza, M.J.B.; de Souza, A.M.G.P.; Gimenez, I.F. Ordered micro-mesoporous carbon from palm oil cooking waste via nanocasting in HZSM-5/SBA-15 composite: Preparation and adsorption studies. J. Hazard. Mater. 2019, 362, 53–61. [Google Scholar] [CrossRef]
- Zhang, Z.; Jia, B.; Liu, L.; Zhao, Y.; Wu, H.; Qin, M.; Han, K.; Wang, W.A.; Xi, K.; Zhang, L. Hollow multihole carbon bowls: A stress–release structure design for high-stability and high-volumetric-capacity potassium-ion batteries. ACS Nano 2019, 13, 11363–11371. [Google Scholar] [CrossRef] [PubMed]
- Ariyanto, T.; Kurniasari, M.; Laksmana, W.; Prasetyo, I. Pore size control of polymer-derived carbon adsorbent and its application for dye removal. Int. J. Environ. Sci. Technol. 2019, 16, 4631–4636. [Google Scholar] [CrossRef]
- Wang, H.; Shao, Y.; Mei, S.; Lu, Y.; Zhang, M.; Sun, J.-k.; Matyjaszewski, K.; Antonietti, M.; Yuan, J. Polymer-derived heteroatom-doped porous carbon materials. Chem. Rev. 2020, 120, 9363–9419. [Google Scholar] [CrossRef]
- Geng, K.; He, T.; Liu, R.; Dalapati, S.; Tan, K.T.; Li, Z.; Tao, S.; Gong, Y.; Jiang, Q.; Jiang, D. Covalent organic frameworks: Design, synthesis, and functions. Chem. Rev. 2020, 120, 8814–8933. [Google Scholar] [CrossRef] [PubMed]
- Huang, L.; Mao, N.; Shuai, Q. Efficient removal of tetracycline from aqueous solution by covalent organic frameworks derived porous carbon. J. Environ. Chem. Eng. 2021, 9, 104842. [Google Scholar] [CrossRef]
- Li, Y.; Xu, X.; Hou, S.; Ma, J.; Lu, T.; Wang, J.; Yao, Y.; Pan, L. Facile dual doping strategy via carbonization of covalent organic frameworks to prepare hierarchically porous carbon spheres for membrane capacitive deionization. Chem. Commun. 2018, 54, 14009–14012. [Google Scholar] [CrossRef] [PubMed]
- Kimura, K.; Zhuang, J.-H.; Shirabe, K.; Yamashita, Y. Preparation of needle-like poly (azomethine) crystals by means of reaction-induced crystallization of oligomers. Polymer 2003, 44, 4761–4764. [Google Scholar] [CrossRef]
- Wang, J.; Senkovska, I.; Oschatz, M.; Lohe, M.R.; Borchardt, L.; Heerwig, A.; Liu, Q.; Kaskel, S. Imine-linked polymer-derived nitrogen-doped microporous carbons with excellent CO2 capture properties. ACS Appl. Mater. Interfaces 2013, 5, 3160–3167. [Google Scholar] [CrossRef] [PubMed]
- Wang, J.; Liu, Q. An efficient one-step condensation and activation strategy to synthesize porous carbons with optimal micropore sizes for highly selective CO2 adsorption. Nanoscale 2014, 6, 4148–4156. [Google Scholar] [CrossRef] [PubMed]
- Uribe-Romo, F.J.; Hunt, J.R.; Furukawa, H.; Klock, C.; O’Keeffe, M.; Yaghi, O.M. A crystalline imine-linked 3-D porous covalent organic framework. J. Am. Chem. Soc. 2009, 131, 4570–4571. [Google Scholar] [CrossRef]
- Yan, Y.; Chen, L.; Dai, H.; Chen, Z.; Li, X.; Liu, X. Morphosynthesis of nanostructured polyazomethines and carbon through constitutional dynamic chemistry controlled reaction induced crystallization process. Polymer 2012, 53, 1611–1616. [Google Scholar] [CrossRef]
- Iwan, A.; Sek, D. Processible polyazomethines and polyketanils: From aerospace to light-emitting diodes and other advanced applications. Prog. Polym. Sci. 2008, 33, 289–345. [Google Scholar] [CrossRef]
- Łużny, W.; Stochmal-Pomarzańska, E.; Proń, A. Structural properties of selected poly (azomethines). Polymer 1999, 40, 6611–6614. [Google Scholar] [CrossRef]
- Gupta, S.S.; Sreeprasad, T.S.; Maliyekkal, S.M.; Das, S.K.; Pradeep, T. Graphene from sugar and its application in water purification. ACS Appl. Mater. Interfaces 2012, 4, 4156–4163. [Google Scholar] [CrossRef]
- Beams, R.; Cançado, L.G.; Novotny, L. Raman characterization of defects and dopants in graphene. J. Phys. Condens. Matter 2015, 27, 083002. [Google Scholar] [CrossRef]
- Eckmann, A.; Felten, A.; Mishchenko, A.; Britnell, L.; Krupke, R.; Novoselov, K.S.; Casiraghi, C. Probing the nature of defects in graphene by Raman spectroscopy. Nano Lett. 2012, 12, 3925–3930. [Google Scholar] [CrossRef] [PubMed] [Green Version]
- Choi, Y.C.; Kim, M.S.; Ryu, K.M.; Lee, S.H.; Jeong, Y.G. Microstructures and electrothermal characterization of aromatic poly (azomethine ether)-derived carbon films. J. Appl. Polym. Sci. 2020, 49345. [Google Scholar] [CrossRef]
- Bronnikov, S.; Kostromin, S.; Asandulesa, M.; Pankin, D.; Podshivalov, A. Interfacial interactions and interfacial polarization in polyazomethine/MWCNTs nanocomposites. Compos. Sci. Technol. 2020, 190, 108049. [Google Scholar] [CrossRef]
- Tseng, R.J.; Baker, C.O.; Shedd, B.; Huang, J.; Kaner, R.B.; Ouyang, J.; Yang, Y. Charge transfer effect in the polyaniline-gold nanoparticle memory system. Appl. Phys. Lett. 2007, 90, 053101. [Google Scholar] [CrossRef] [Green Version]
- Warta, C.L.; Papadimas, S.P.; Sorial, G.A.; Suidan, M.T.; Speth, T.F. The effect of molecular oxygen on the activated carbon adsorption of natural organic matter in Ohio river water. Water Res. 1995, 29, 551–562. [Google Scholar] [CrossRef]
- Yu, F.; Ma, J.; Wu, Y. Adsorption of toluene, ethylbenzene and m-xylene on multi-walled carbon nanotubes with different oxygen contents from aqueous solutions. J. Hazard. Mater. 2011, 192, 1370–1379. [Google Scholar] [CrossRef]
- Liu, K.; Li, H.; Wang, Y.; Gou, X.; Duan, Y. Adsorption and removal of rhodamine B from aqueous solution by tannic acid functionalized graphene. Colloids Surf. A Physicochem. Eng. Asp. 2015, 477, 35–41. [Google Scholar] [CrossRef]
Figure 1.
(A) The condensation reaction and (B) a picture of the as-prepared PAM in methanol solution.
Figure 1.
(A) The condensation reaction and (B) a picture of the as-prepared PAM in methanol solution.

Figure 2.
FT-IR spectrum of PAM.

Figure 3.
TGA and DTG curve for PAM.

Figure 4.
SEM images of PAM crystal and CNs. White arrows and circles indicate the surface defects of CNs.
Figure 4.
SEM images of PAM crystal and CNs. White arrows and circles indicate the surface defects of CNs.

Figure 5.
(A,B) XRD and of PAM and NCs. (C,D) The high-resolution TEM image and FFT results of PAM and NC750.
Figure 5.
(A,B) XRD and of PAM and NCs. (C,D) The high-resolution TEM image and FFT results of PAM and NC750.

Figure 6.
Raman spectra of PAM and NC-750.

Figure 7.
The deconvoluted XPS spectra of (A) the C1s, (B) N1s, and (C) O1s signal of NC-750.

Figure 8.
(A) The UV-visible spectra, (B) water purification capacity, (C) absorption curves, and (D) BET surface area of PAM and NCs.
Figure 8.
(A) The UV-visible spectra, (B) water purification capacity, (C) absorption curves, and (D) BET surface area of PAM and NCs.
Publisher’s Note: MDPI stays neutral with regard to jurisdictional claims in published maps and institutional affiliations. |
© 2021 by the authors. Licensee MDPI, Basel, Switzerland. This article is an open access article distributed under the terms and conditions of the Creative Commons Attribution (CC BY) license (https://creativecommons.org/licenses/by/4.0/).
Share and Cite
MDPI and ACS Style
Yu, X.; Zheng, T.; Pilla, S. Polymer-Derived Nitrogen-Doped Carbon Nanosheet Cluster and Its Application for Water Purification. Macromol 2021, 1, 84-93. https://0-doi-org.brum.beds.ac.uk/10.3390/macromol1020007
AMA Style
Yu X, Zheng T, Pilla S. Polymer-Derived Nitrogen-Doped Carbon Nanosheet Cluster and Its Application for Water Purification. Macromol. 2021; 1(2):84-93. https://0-doi-org.brum.beds.ac.uk/10.3390/macromol1020007
Chicago/Turabian StyleYu, Xiaoyan, Ting Zheng, and Srikanth Pilla. 2021. "Polymer-Derived Nitrogen-Doped Carbon Nanosheet Cluster and Its Application for Water Purification" Macromol 1, no. 2: 84-93. https://0-doi-org.brum.beds.ac.uk/10.3390/macromol1020007