Article

Integrative Statistics, Machine Learning and Artificial Intelligence Neural Network Analysis Correlated CSF1R with the Prognosis of Diffuse Large B-Cell Lymphoma

1
Department of Pathology, School of Medicine, Tokai University, 143 Shimokasuya, Isehara 259-1193, Japan
2
Monoclonal Antibodies Unit, National Centre for Cancer Research (Centro Nacional de Investigaciones Oncológicas, CNIO), Melchor Fernandez Almagro 3, 28029 Madrid, Spain
3
Department of Pathology, MD Anderson Cancer Center Madrid, Calle de Arturo Soria 270, 28033 Madrid, Spain
4
Department of Cell Pathology, Faculty of Live Sciences, Graduate School of Medical Sciences, Kumamoto University, 1-1-1 Honjo, Chuo-ku, Kumamoto 860-8556, Japan
5
Department of Clinical Sciences, College of Medicine, University of Sharjah, Sharjah 27272, United Arab Emirates
6
Division of Surgery and Interventional Science, University College London, Gower Street, London WC1E 6BT, UK
*
Authors to whom correspondence should be addressed.
Submission received: 15 March 2021 / Revised: 6 April 2021 / Accepted: 8 April 2021 / Published: 10 April 2021
(This article belongs to the Section Lymphomas)

Abstract

:
Tumor-associated macrophages (TAMs) of the immune microenvironment play an important role in the Diffuse Large B-cell Lymphoma (DLBCL) pathogenesis. This research aimed to characterize the expression of macrophage colony-stimulating factor 1 receptor (CSF1R) at the gene and protein level in correlation with survival. First, the immunohistochemical expression of CSF1R was analyzed in a series of 198 cases from Tokai University Hospital and two patterns of histological expression were found, a TAMs, and a diffuse B-lymphocytes pattern. The clinicopathological correlations showed that the CSF1R + TAMs pattern associated with a poor progression-free survival of the patients, disease progression, higher MYC proto-oncogene expression, lower MDM2 expression, BCL2 translocation, and a MYD88 L265P mutation. Conversely, a diffuse CSF1R + B-cells pattern was associated with a favorable progression-free survival. Second, the histological expression of CSF1R was also correlated with 10 CSF1R-related markers including CSF1, STAT3, NFKB1, Ki67, MYC, PD-L1, TNFAIP8, IKAROS, CD163, and CD68. CSF1R moderately correlated with STAT3, TNFAIP8, CD68, and CD163 in the cases with the CSF1R + TAMs pattern. In addition, machine learning modeling predicted the CSF1R immunohistochemical expression with high accuracy using regression, generalized linear, an artificial intelligence neural network (multilayer perceptron), and support vector machine (SVM) analyses. Finally, a multilayer perceptron analysis predicted the genes associated with the CSF1R gene expression using the GEO GSE10846 DLBCL series of the Lymphoma/Leukemia Molecular Profiling Project (LLMPP), with correlation to the whole set of 20,683 genes as well as with an immuno-oncology cancer panel of 1790 genes. In addition, CSF1R positively correlated with SIRPA and inversely with CD47. In conclusion, the CSF1R histological pattern correlated with the progression-free survival of the patients of the Tokai series, and predictive analytics is a feasible strategy in DLBCL.

1. Introduction

Diffuse large B-cell lymphoma (DLBCL) is one of the most frequent histological subtypes of non-Hodgkin lymphoma (NHL) in the Western countries, representing approximately 25% of the cases. DLBCL not-otherwise specified (NOS) is characterized for being a heterogeneous disease because of the morphological characteristics, the biological background, and the genetic alterations [1]. In the current classification of the World Health Organization (WHO) [2], DLBCL has some separate diagnostic categories including the T-cell/histiocyte rich large B-cell lymphoma, the primary DLBCL of the mediastinum, and the intravascular lymphoma, etc.
DLBCL can be cured in around 50% of the cases with current therapy, mainly based on the R-CHOP (Rituximab, cyclophosphamide, doxorubicin, vincristine, and prednisone). Due to the clinical heterogeneity, it is important to identify the patients with a worse outcome. The International Prognostic Index (IPI) and its derivatives are the main tools being used to stratify the prognosis of the patients with DLBCL. The IPI includes the following variables: age, serum lactate dehydrogenase, Eastern Cooperative Oncology Group (ECOG) performance status, clinical stage, and the number of extranodal disease sites. The variants of the original IPI include the age-adjusted, the stage-adjusted, and the National Comprehensive Cancer Network International Prognostic Index (NCCN IPI) [3]. The gene expression analysis (GEP) classified the DLBCL patients according to the cell-of-origin as germinal centre B-cell-like (GCB) associated with a good prognosis, and as activated B-cell-like (ABC) associated with a poor prognosis [4,5,6]. Importantly, the role of the immune microenvironment was also highlighted [7].
The microenvironment is comprised of several immune cells including CD8 + cytotoxic T-lymphocytes, CD4 + helper T-lymphocytes, natural killer (NK) cells, FOXP3 + regulatory T-lymphocytes (Treg), and macrophages, among others [8]. The tumor-associated macrophages (TAMs) are of special interest because the ones with an M2-like phenotype have tumor-promoting capabilities [9], which involve tumor proliferation, invasion, angiogenesis, metastasis, and suppression of anti-tumor immunity [10,11]. In DLBCL, it has been reported that high numbers are associated with a poor prognosis of DLBCL [9,12].
Macrophage colony-stimulating factor 1 receptor (CSF1R) is a tyrosine-protein kinase that functions as a cell-surface receptor for CSF1 and IL34 and regulates the survival, proliferation, and differentiation of macrophages [13]. Due to the association of TAMs with tumorigenesis and the suppression of the anti-tumor immunity, CSF1R is of great interest as a target for cancer treatment using small molecules CSF1R inhibitors [14,15]. In case of Hodgkin Lymphoma, an abstract report by Moskowithz CH et al. described the use of a CSF1R inhibitor (PLX3397) in patients with relapsed or refractory disease, a phase 2 single agent clinical trial, and concluded that the efficacy of single agent PLX3397 in that study population was modest, and that the manageable safety profile and evidence of target inhibition might warrant further testing in combination therapy trials. To the best of our knowledge, the use of CSF1R inhibitors in DLBCL has not been performed [16].
The purpose of this work was to analyze the expression of CSF1R in DLBCL. First, we analyzed the immunohistochemical protein expression of CSF1R in a series of 198 cases of DLBCL from Tokai University Hospital and performed several clinicopathological correlations. Then, we analyzed the gene expression of CSF1R in DLBCL using a robust series from western countries of 414 from the Lymphoma/Leukemia Molecular Profiling Project (LLMPP), and we focused on the identification of genes associated with the CSF1R as a dichotomic variable (high vs. low levels) and then with other relevant cancer-related genes.

2. Materials and Methods

2.1. Subjects of Study

DLBCL Series from the Tokai University Hospital

For the immunohistochemical analysis of CSF1R, we used a Japanese series of 198 cases of DLBCL from the Tokai University Hospital. The complete clinicopathological characteristics of this series are shown in Table 1. In summary, this series has the characteristics of a conventional series of DLBCL not-otherwise specified. The disease location is nodal (+spleen) and Waldeyer’s ring is in around half of the cases. The treatment was R-CHOP (rituximab, cyclophosphamide, doxorubicin hydrochloride, vincristine, and prednisolone) or R-CHOP-like in 96% of the cases, and a 75% had a clinical response to treatment. The immunophenotype showed CD10 positivity in 30% of the cases, CD5 positivity in 16%, MUM1 positivity in 74%, BCL2 positivity in 74%, and a cell-of-origin, according to the Hans’ classifier of non-GCB, in 64% of the cases. Epstein-Barr virus (EBER) was found in 9% of the cases. The clinicopathological variables were correlated with the overall survival and progression-free survival. In Table 2, the correlation with the overall survival is shown. Relevant variables that correlated with the overall survival were IPI, clinical response to treatment, some immunohistochemical markers (CD10, MUM1, BCL2, Ki67 and RGS1), cell-of-origin Hans’ classification, and Epstein-Barr virus (EBER). The correlations with the progression-free survival was like the ones of the overall survival. Of note, the original series for the immunohistochemistry was around 130 cases. This is the reason why some variables such as the fluorescence in situ hybridization (FISH) is only available in around 130 cases. Later, the series was expanded up to 198 to increase the statistical power.
The study was conducted according to the guidelines of the Declaration of Helsinki and approved by the Institutional Review Board and the Ethics Committee of Tokai University, School of Medicine (protocol code IRB14R-080 and IRB-156).

2.2. Immunohistochemistry and Digital Image Quantification

The immunohistochemistry was performed on formalin-fixed paraffin embedded whole-tissue sections (FFPET) in a Leica Bond-Max automatic equipment and Bond reagents (Leica K.K., Tokyo, Japan). The immunophenotype included the following markers of CD3, CD5, CD20, CD10, MUM1 (IRF4), BCL2, BCL6, Ki67, and RGS1 (Novocastra primary antibodies, Leica K.K.), and MDM2 (IF2, Invitrogen, Life Technologies K.K., Tokyo, Japan). The slides were visualized in an Olympus BX63 microscope and DP73 camera (Olympus K.K, Tokyo, Japan). More than 30% expression by the tumoral B-cells was assessed as positive. CSF1R was initially evaluated in an ordinal manner as 0, 1+, 2+, and 3+. Then, digital image quantification of the CSF1R was performed using the Fiji software. The CSF1R expression was calculated using an ROI in the tissue. This ROI was representative of the overall CSF1R expression in the entire tissue section. Additional characterization included testing for Epstein-Barr virus (EBER in-situ hybridization #PB0589, Leica K.K.), BCL2 and MYC FISH (split probes, #Y5407 and #Y5410, Dako/Agilent), and a MYD88 (L265P) mutation [17,18,19,20,21,22].
The additional markers related to CSF1R were used in a set of 100 cases of DLBCL form the same series. The primary antibodies were the following: CSF1 (2D10, LSBio, Tokyo, Japan), phospho-STAT3 (Tyr705, D3A7, Cell Signaling, Tokyo, Japan), NF-KB p105/p50 (#3035, Cell Signaling), MYC (Y69, ab32072, Abcam, Tokyo, Japan), PD-L1 (E1J2J, Cell Signaling), TNFAIP8 (#14559-MM01, Sino Biological, Beijing, China), IKAROS (D6N9Y, #14859, Cell Signaling), CD163 (10D6, Leica), and CD68 (514H12, Leica).
The CSF1R monoclonal antibody was developed by Dr Juan Fernando Garcia (Department of Pathology, MD Anderson Cancer Center, Madrid, Spain) and created by Dr. Giovanna Roncador from the Monoclonal Antibodies Unit, Spanish National Centre for Cancer Research (Centro Nacional de Investigaciones Oncologicas, CNIO, Madrid, Spain). This mouse monoclonal primary antibody targets human CSF1R, of which the clone name is FER216, and the isotype is IgG1, and the antibody used the antigen ecCSF1R-Fc-6His recombinant protein (84kDa-extracellular portion). The FER216 mAb can detect human CSF1R protein by Western Blotting, immunoprecipitation, immunocytochemistry, immunohistochemistry (frozen, paraffin, and immunofluorescence), and flow cytometry [23].

GSE10846 DLBCL Series of the Lymphoma/Leukemia Molecular Profiling Project (LLMPP)

For the gene expression analysis of CSF1R, we used a robust and well characterized series of 414 cases of DLBCL from Western countries, the GSE10846 of the Lymphoma/Leukemia Molecular Profiling Project (LLMPP) [24,25].
The clinicopathological characteristics of this series are shown in Table 2. In summary, the age ranged from 14 to 92 years old, with a mean of 61 and a median of 62.5 years. The male/female ratio was 1.3 (224/172). The 1, 3, 5, and 10-year overall survival was 78%, 63%, 57%, and 47%. According to the National Comprehensive Cancer Network International Prognostic Index (NCCN IPI), low risk patients represented a 16.8% of the series (54/321), low-intermediate represented a 47.4%, high-intermediate represented a 30.5%, and high represented a 5.3%. According to the cell-of-origin molecular classification, a 44.2% (183/414) were germinal center B-cell-like (GCB), a 40.3% were activated B-cell-like (ABC), and a 15.5% were unclassified. The variables age, LDH ratio, ECOG performance status, clinical stage, number of extranodal sites, NCCN IPI, and cell-of-origin molecular classification correlated with the overall survival of the patients. Therefore, this is a conventional series of DLBCL (Table 2).

2.3. Bioinformatics and Statistical Analysis

The GSE10846 data was downloaded from the National Center for Biotechnology Information (NCBI) Gene Expression Omnibus (GEO) public functional genomics data repository (https://0-www-ncbi-nlm-nih-gov.brum.beds.ac.uk/gds; accessed on 9 April 2021). The gene expression array used in this series is the GPL570, Affymetrix Human Genome U133 Plus 2.0 Array (HG-U133_Plus_2). The data was normalized and log2 transformed. The probes were collapsed to a one expression value per gene using the maximum probe values. Therefore, the series was comprised of 414 cases and 20,684 genes.
All the analyses were performed using the following software according to the manufacturers’ instructions: R programming language with R version 3.6.3 (https://www.r-project.org/; accessed on 9 April 2020) and R Studio (version 1.3.959; https://rstudio.com/; accessed on 9 April 2020), the Gene set enrichment analysis software (GSEA 4.1.0, build: 27, Broad Institute, Cambridge, MA 02142, USA), IBM SPSS statistics (version 26; New Orchard Road Armonk, NY 10504-1722, USA), IBM Modeler (version 18), Xlstat (version 2018.1, Addinsoft, Suite E100, NY 10001, USA), Excel (version 16.0.13127.21062, Microsoft, Redmond, WA 98052-7329, USA) and EditPad Lite (version 8.1.2 x64, Just Great Software Co. Ltd., Rawai Phuket 83130, Thailand).
The gene expression values of CSF1R in the series were selected and an appropriate cut-off value for prediction of the overall survival was found. The series of cases was divided into two groups of cases: high versus low CSF1R gene expression. Then, the genes associated with the high or low CSF1R groups were searched using the multilayer perceptron analysis. The multilayer perceptron analysis was performed as thoroughly described in our recent publications [26,27,28]. First, the 20,683 genes were ranked according to their normalized importance for their association with the high or low CSF1R expression groups. Second, a predefined set of 1825 genes was also ranked, according to the association with the two groups. This defined set of 1825 is a cancer transcriptome atlas panel (LBL-10809-2) designed for comprehensive profiling of the tumor, microenvironment, and immune response. The genes are summarized as follows: adaptive and innate immunity, immune response, cell function, metabolism, physiology and disease, signaling pathways, tissue compartment (tumor, immune, and stroma), and biological categories (tumor biology, immune response, and microenvironment). For example, in the category apoptosis, the genes ACTB, AKT1, AKT2, AKT2, APC, ATM, BAD, BCL2, etc. are found. The FOXP3 gene belongs to the Treg differentiation. PDCD1 (PD-1) belongs to the immune exhaustion and T-cell checkpoints. PAX5 belongs to the epigenetic modification. SETD2 belongs to ammino acid synthesis and transport. Of note, one gene can be present in more than one category.
The criteria for overall survival and progression-free survival were standard values [29,30]. The survival was calculated with the Kaplan-Meier with the Log rank (Mantel-Cox) test (in the calculation, the Breslow and Tarone-Ware test were also included) and the Cox regression (enter method). Comparisons between groups were performed with nonparametric tests (independent samples, Mann-Whitney U-test for 2 samples, or Kruskal-Wallis one-way ANOVA for k samples, if necessary), and crosstabulations with Pearson Chi-Square, Likelihood Ratio, and Fisher’s Exact Test. Bivariate correlations was performed by Pearson and Spearman correlations (2-tailed).

3. Results

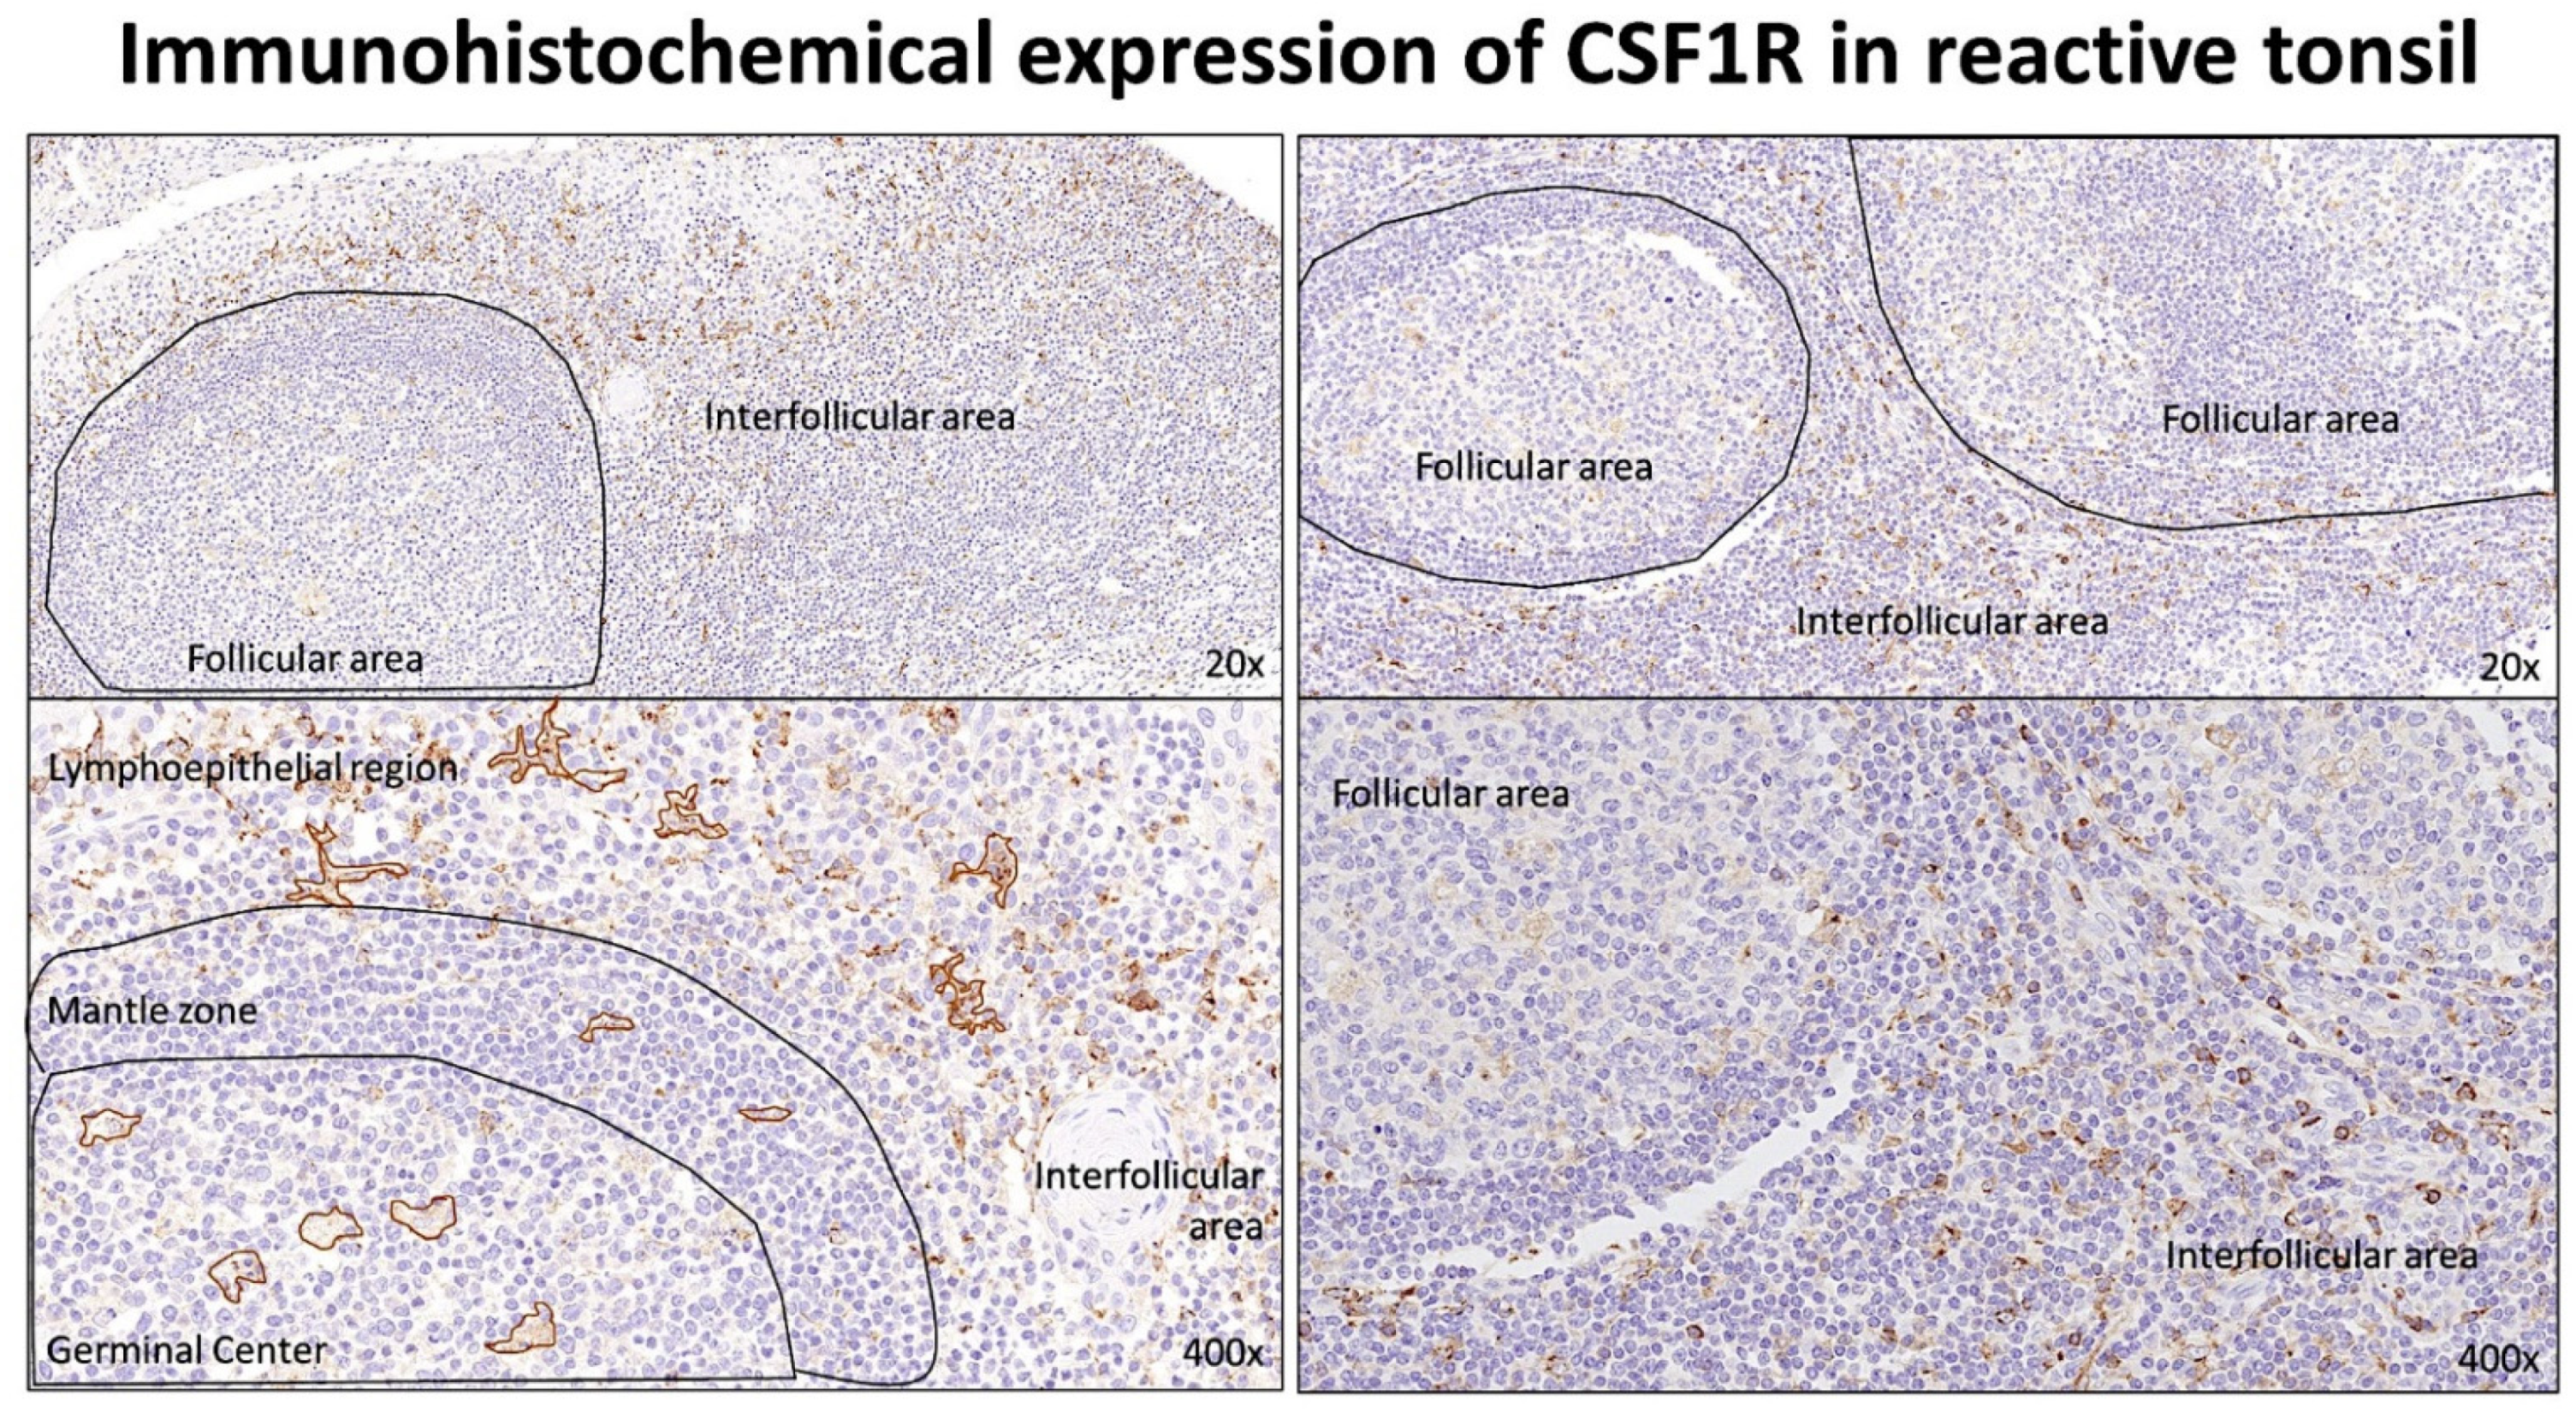
3.1. Immunohistochemical Expression of CSF1R in Reactive Tonsils

The staining for CSF1R was performed in 10 reactive tonsils using an autostainer and, under the microscope, the slides showed that the CSF1R-positive cells had a morphology macrophage. CSF1R-positive cells were distributed both in the follicular and in the interfollicular compartments. In the germinal centers, the CSF1R-positive cells had a morphology compatible with tangible body macrophages. In the interfollicular area, the CSF1R-positive cells had a morphology compatible with macrophages/dendritic cells (Figure 1).

3.2. Correlation between the Immunohistochemical Expression of CSF1R and Prognosis of the Patients in the Tokai DLBCL Series

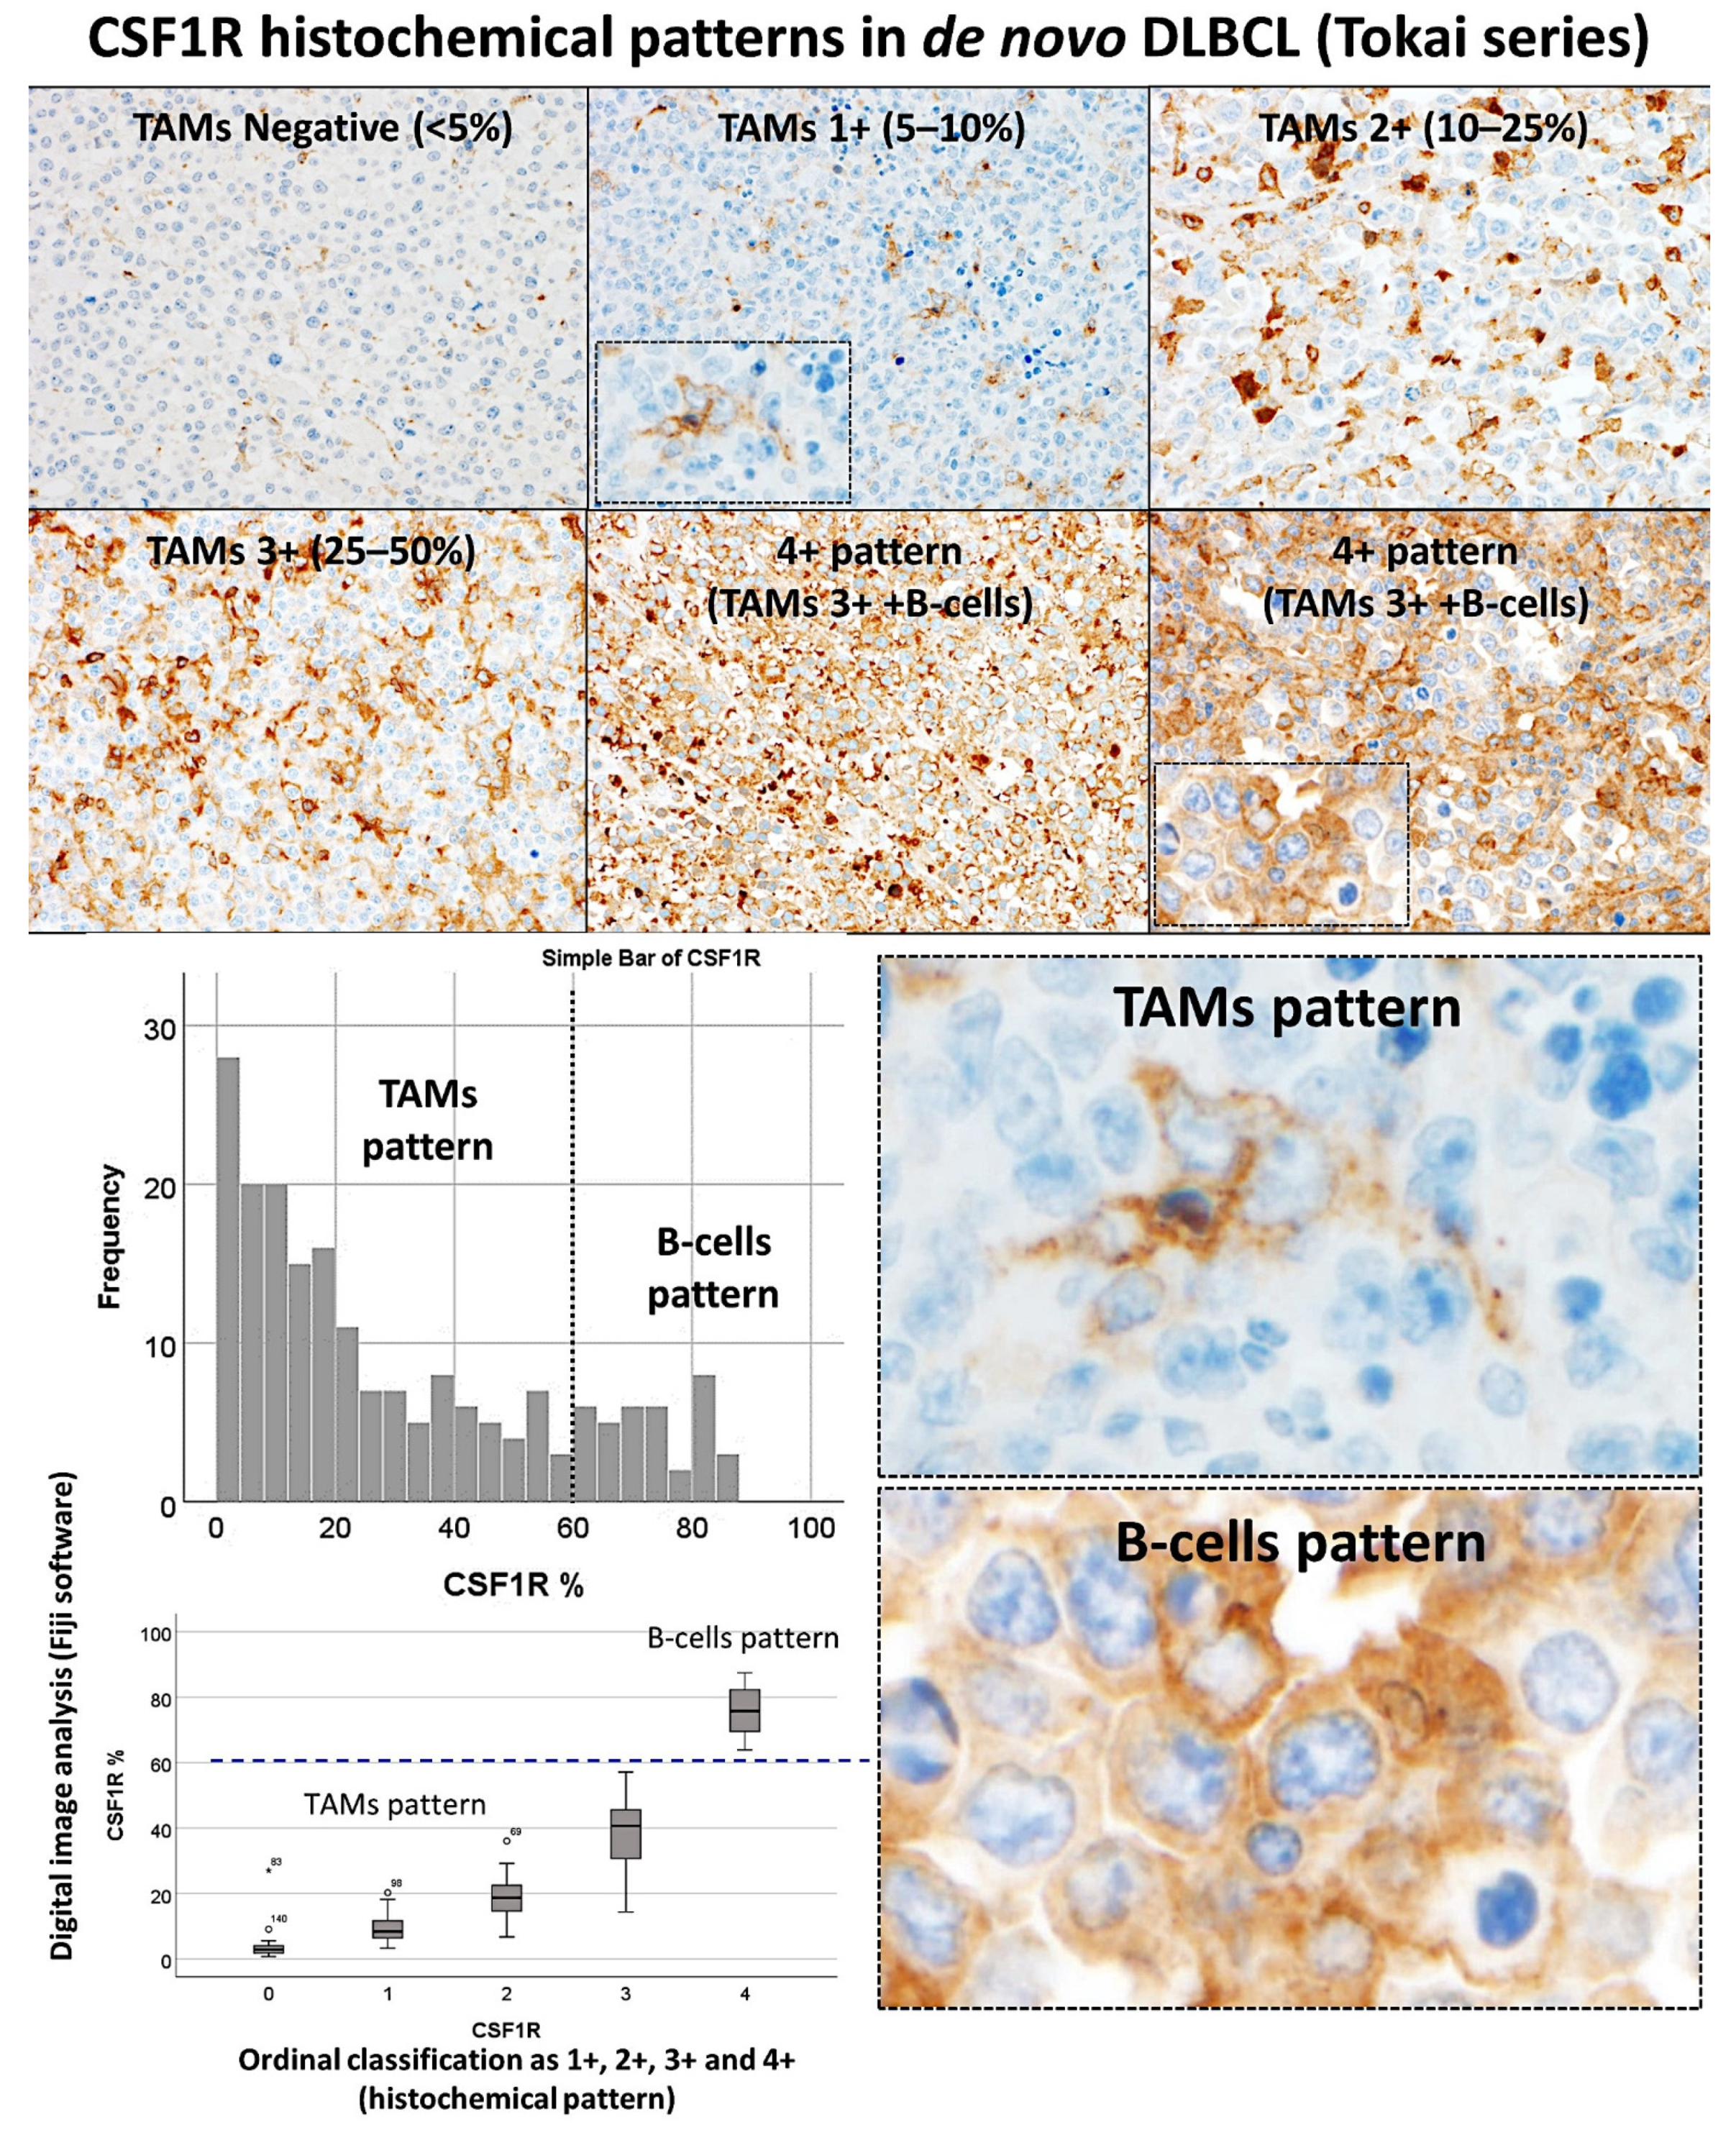
The CSF1R staining was performed in a series of 198 cases of DLBCL. The CSF1R-positive cells had a morphology of tumor-associated macrophages (TAMs). In addition, in some cases, the staining was diffuse (B-cell pattern).
The cases were initially evaluated as an ordinal variable as 0 (no staining, <5%), 1+ (an estimated 5–10% of CSF1R + TAMs), 2+ (10–15%), 3+ (25–50%), and 4+ (diffuse pattern/B-cell pattern). The CSF1R staining in TAMs was of macrophages with dendritiform-like elongations. Conversely, the B-cell pattern showed a diffuse staining of the B-lymphocytes of the DLBCL. After that, the slides were digitalized and a representative area for each case was kept for digital image quantification using Fiji software. The CSF1R expression ranged from 0.37% to 87.45%, with a median of 19.9% and a mean of 29.4% ± 25.6%. The relationship between the ordinal evaluation and the digital image quantification is shown in Figure 2. At 60% cut-off, the TAMs vs. the B-cell pattern could be differentiated [a receiver operating characteristic (ROC) analysis was not performed in this case].
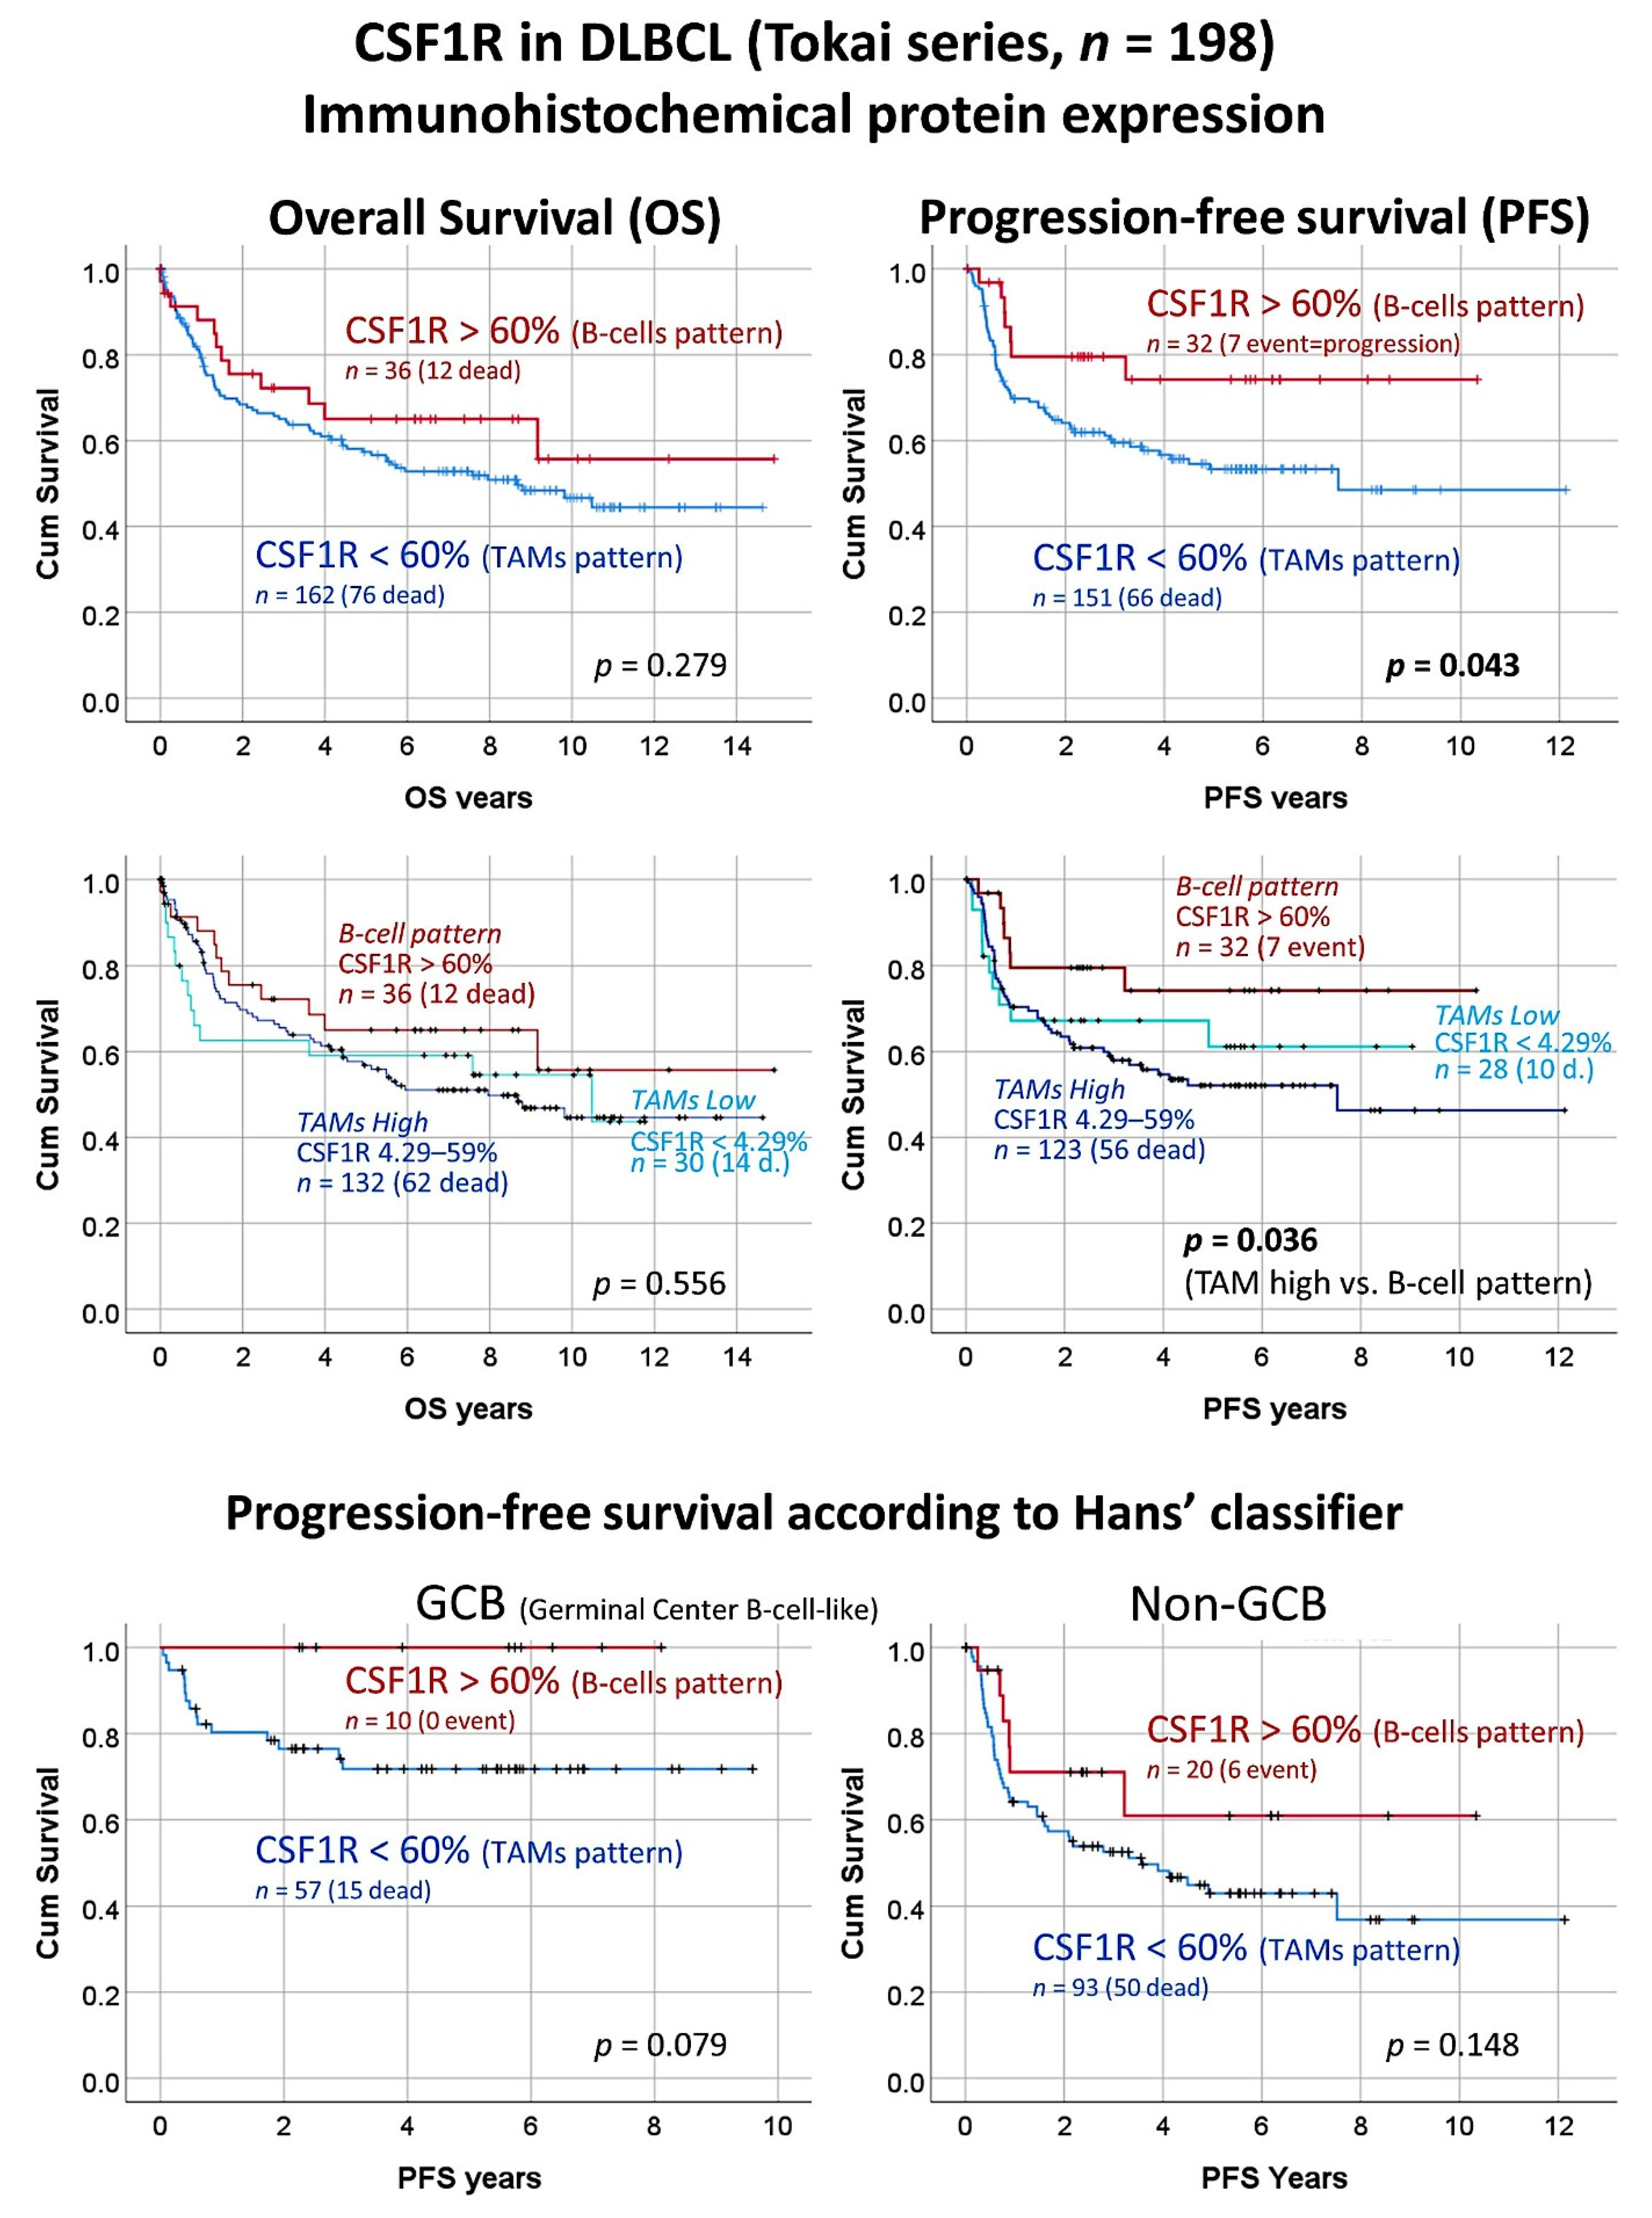
The expression of CSF1R was correlated with several clinicopathological characteristics of the patients from the Tokai series of DLBCL. Using the cut-off of 60% that differentiate the TAMs with the B-cells patterns, two groups of patients with different progression-free survival could be identified. The patients with CSF1R B-cells pattern were characterized with a more favorable progression-free survival (Cox regression, Hazard Risk (HR) = 0.5, 95% confidence interval (CI) for HR 0.2–0.9, p = 0.049). Conversely, a CSF1R TAMs pattern was associated with an unfavorable progression-free survival (HR = 2.2, 95% CI for HR 1.0–4.8, p = 0.049) (Figure 3). Of note, when the group of TAMs pattern was divided into two subgroups, high vs. low, the low CSF1R + TAMs subgroup had a trend of more favorable progression-free survival than the group of high CSF1R + TAMs. When a multivariate Cox regression analysis was performed including the histological pattern of CSF1R (TAMs vs. B-cells patterns) and the IPI (low + low-intermediate vs. high-intermediate + high), only the IPI kept the prognostic relevance for the progression-free survival.
The survival analysis was repeated by stratifying the cases according to the cell-of-origin molecular subtypes based on the Hans’ classifier both for the overall survival and progression-free survival. In case of the overall survival, the CSF1R expression patterns did not correlated with the outcome. Conversely, the progression-free survival tended to keep the prognostic relevance for both the GCB and non-GCB, but this difference was not statistically significant (p = 0.079 and 0.148, respectively). Of note, our interpretation is that, in a larger series, if the proportion is kept, the difference would be significant because the groups are well separated in the graphs (Figure 3).
The CSF1R with the 60% cut-off was also correlated with the rest of clinicopathological characteristics of the patients and the samples (Table 3, Table 4, Table 5, Table 6 and Table 7). High CSF1R expression (i.e., >60%, B-cells pattern) was associated with a lower MYC proto-oncogene immunohistochemical expression (p = 0.038), higher MDM2 immunohistochemical expression (p = 0.051), lower DNA-binding protein IKAROS immunohistochemical expression (p = 0.042), an absence of BCL2 translocation (p = 0.026), an absence of mutation of MYD88 L265P (p = 0.028), and lower disease progression (p = 0.028). No other correlations were found with the other variables, including the cell-of-origin classification (Hans’ classifier).
The expression of CSF1R was correlated with other markers of the CSF1R-pathway including macrophage markers in each of the two histological patterns: The TAMs and the B-cell patterns. In the TAMs pattern group (n = 162), CSF1R positively correlated with STAT3, TNFAIP8, CD163, and CD68. In the B-cell pattern group (n = 36), CSF1R inversely correlated with TNFAIP8 and CD163 (Table 6).
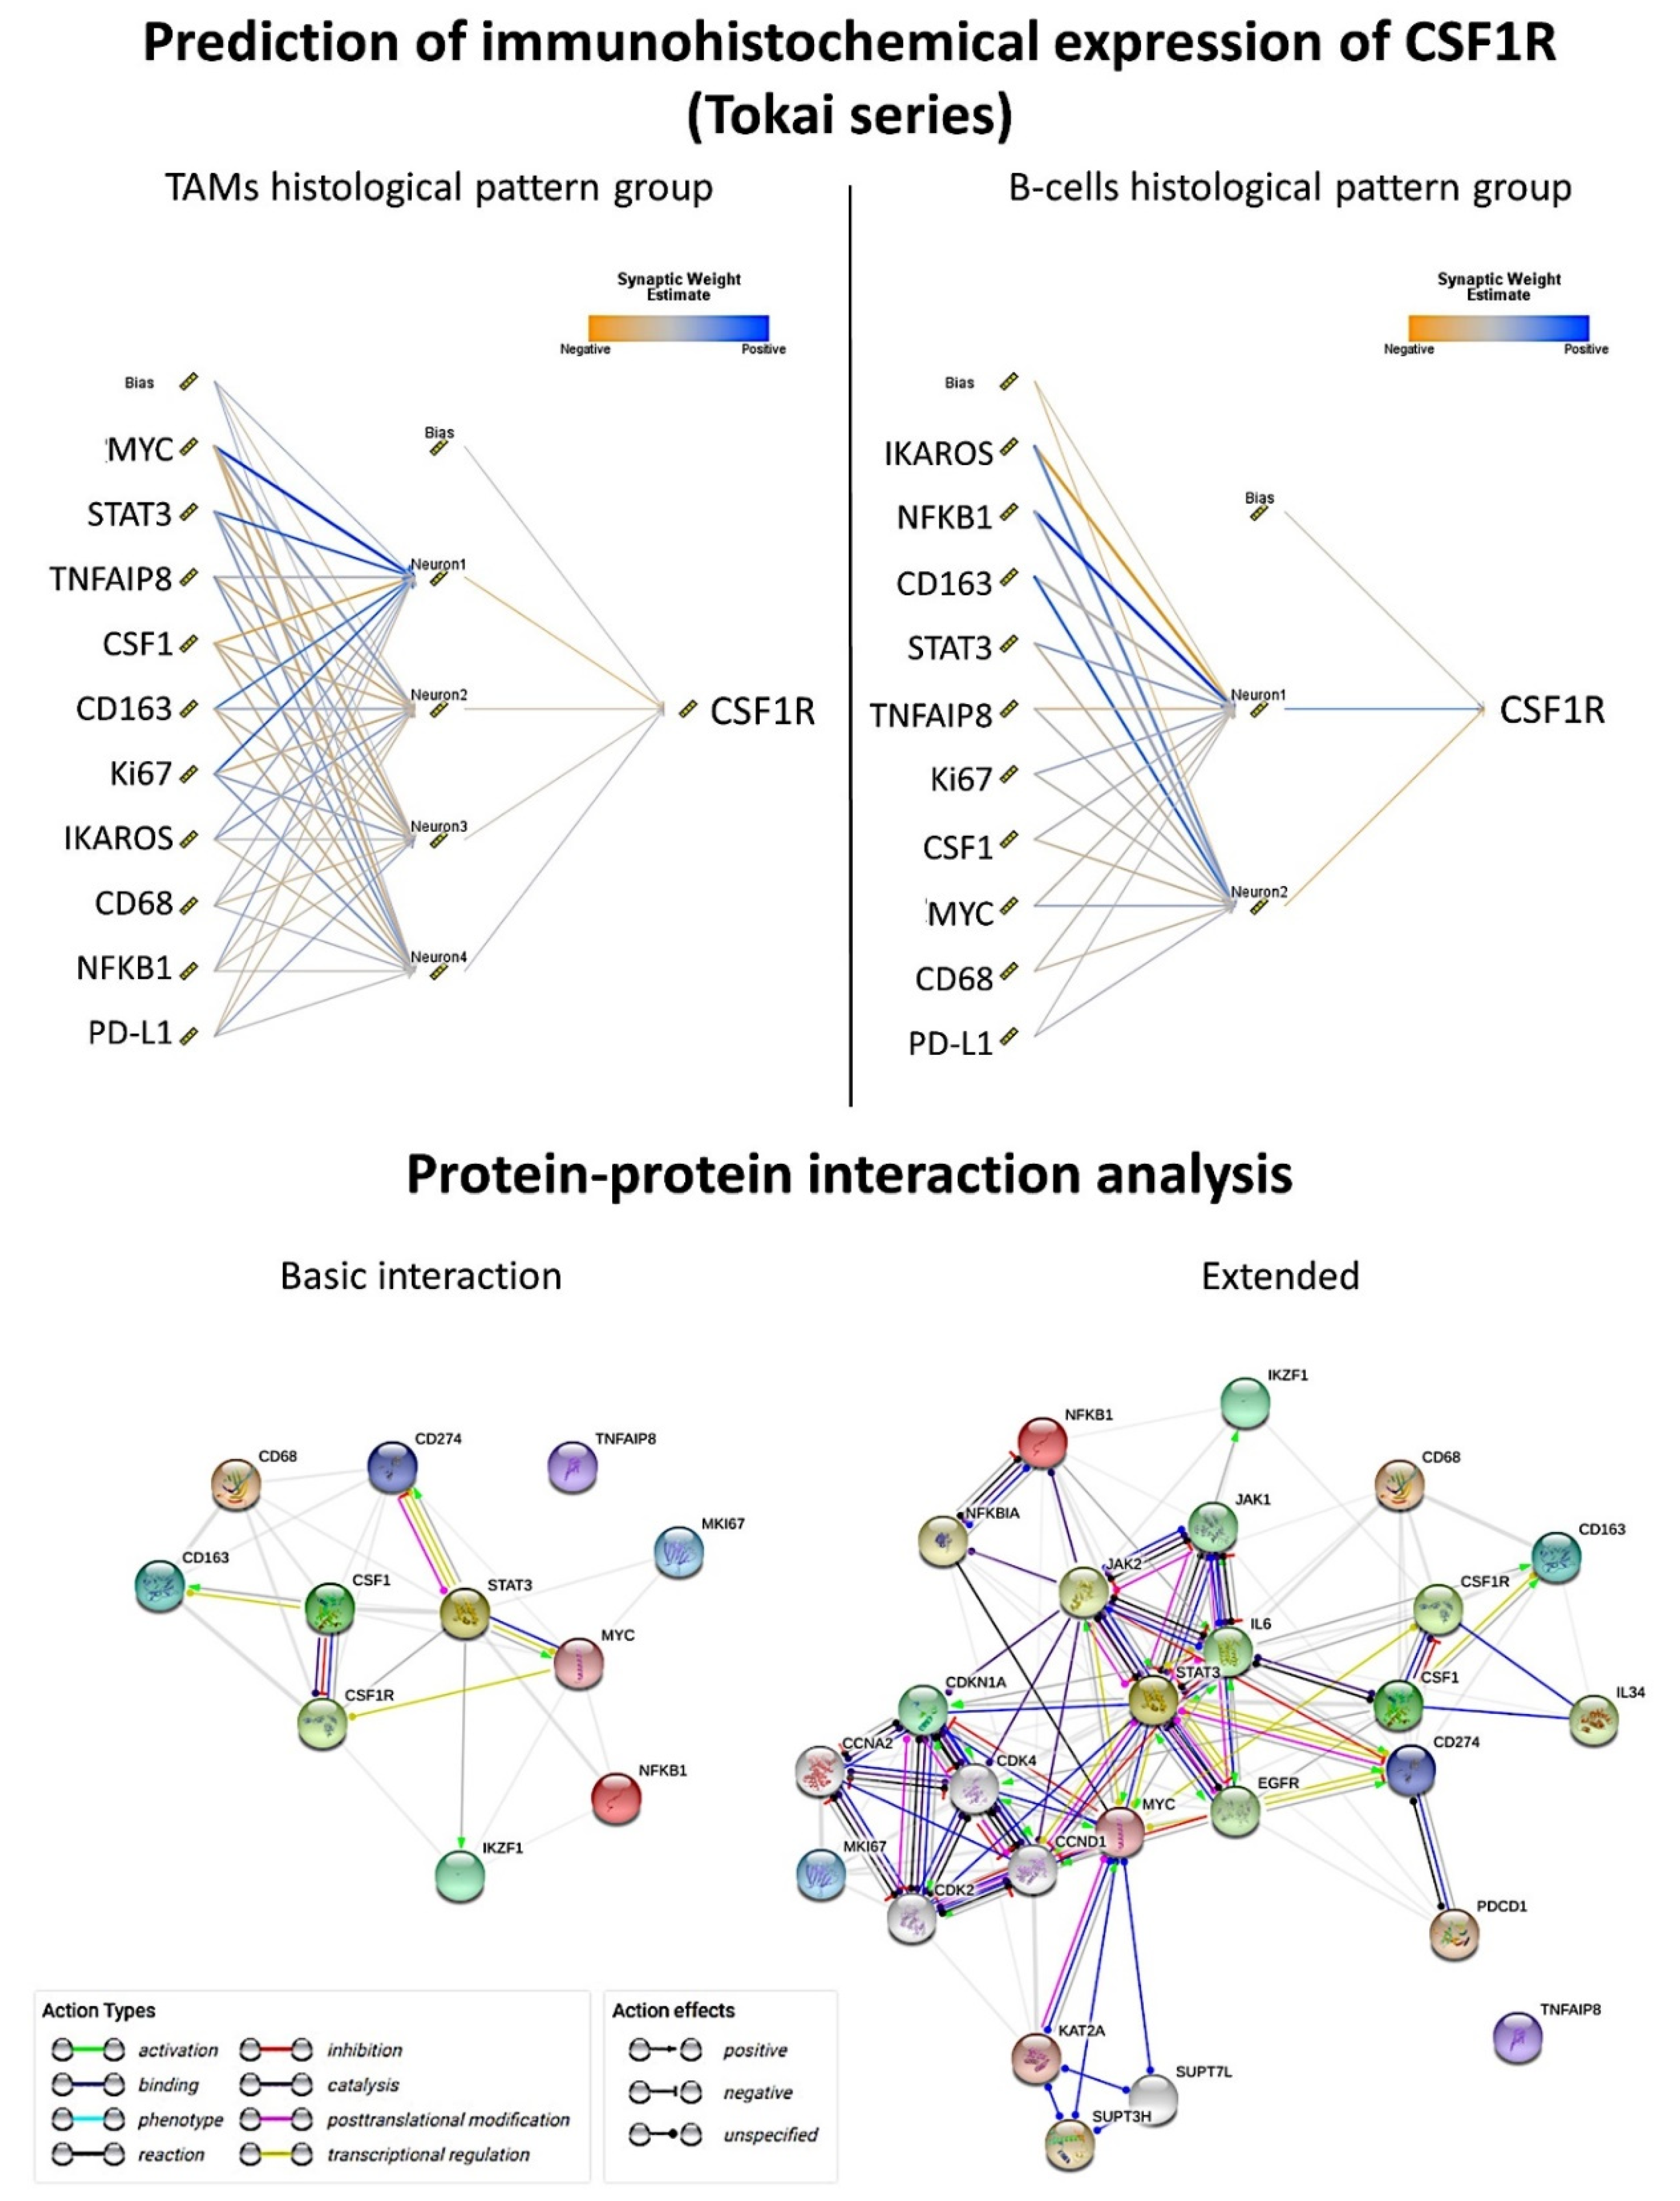
The same type of analysis was performed for each histological pattern using predictive analytics with 12 models including regression, generalized linear, KNN algorithm (nearest neighbor analysis, the number of nearest neighbors to examine is called k), linear-AS (namely, linear analytic server), LSVM (linear support vector machine), random trees, SVM (support vector machine), tree-AS, linear, CHAID (Chi-squared automatic interaction detection), C&R tree (classification and regression tree), and a neural network (Figure 4 and 
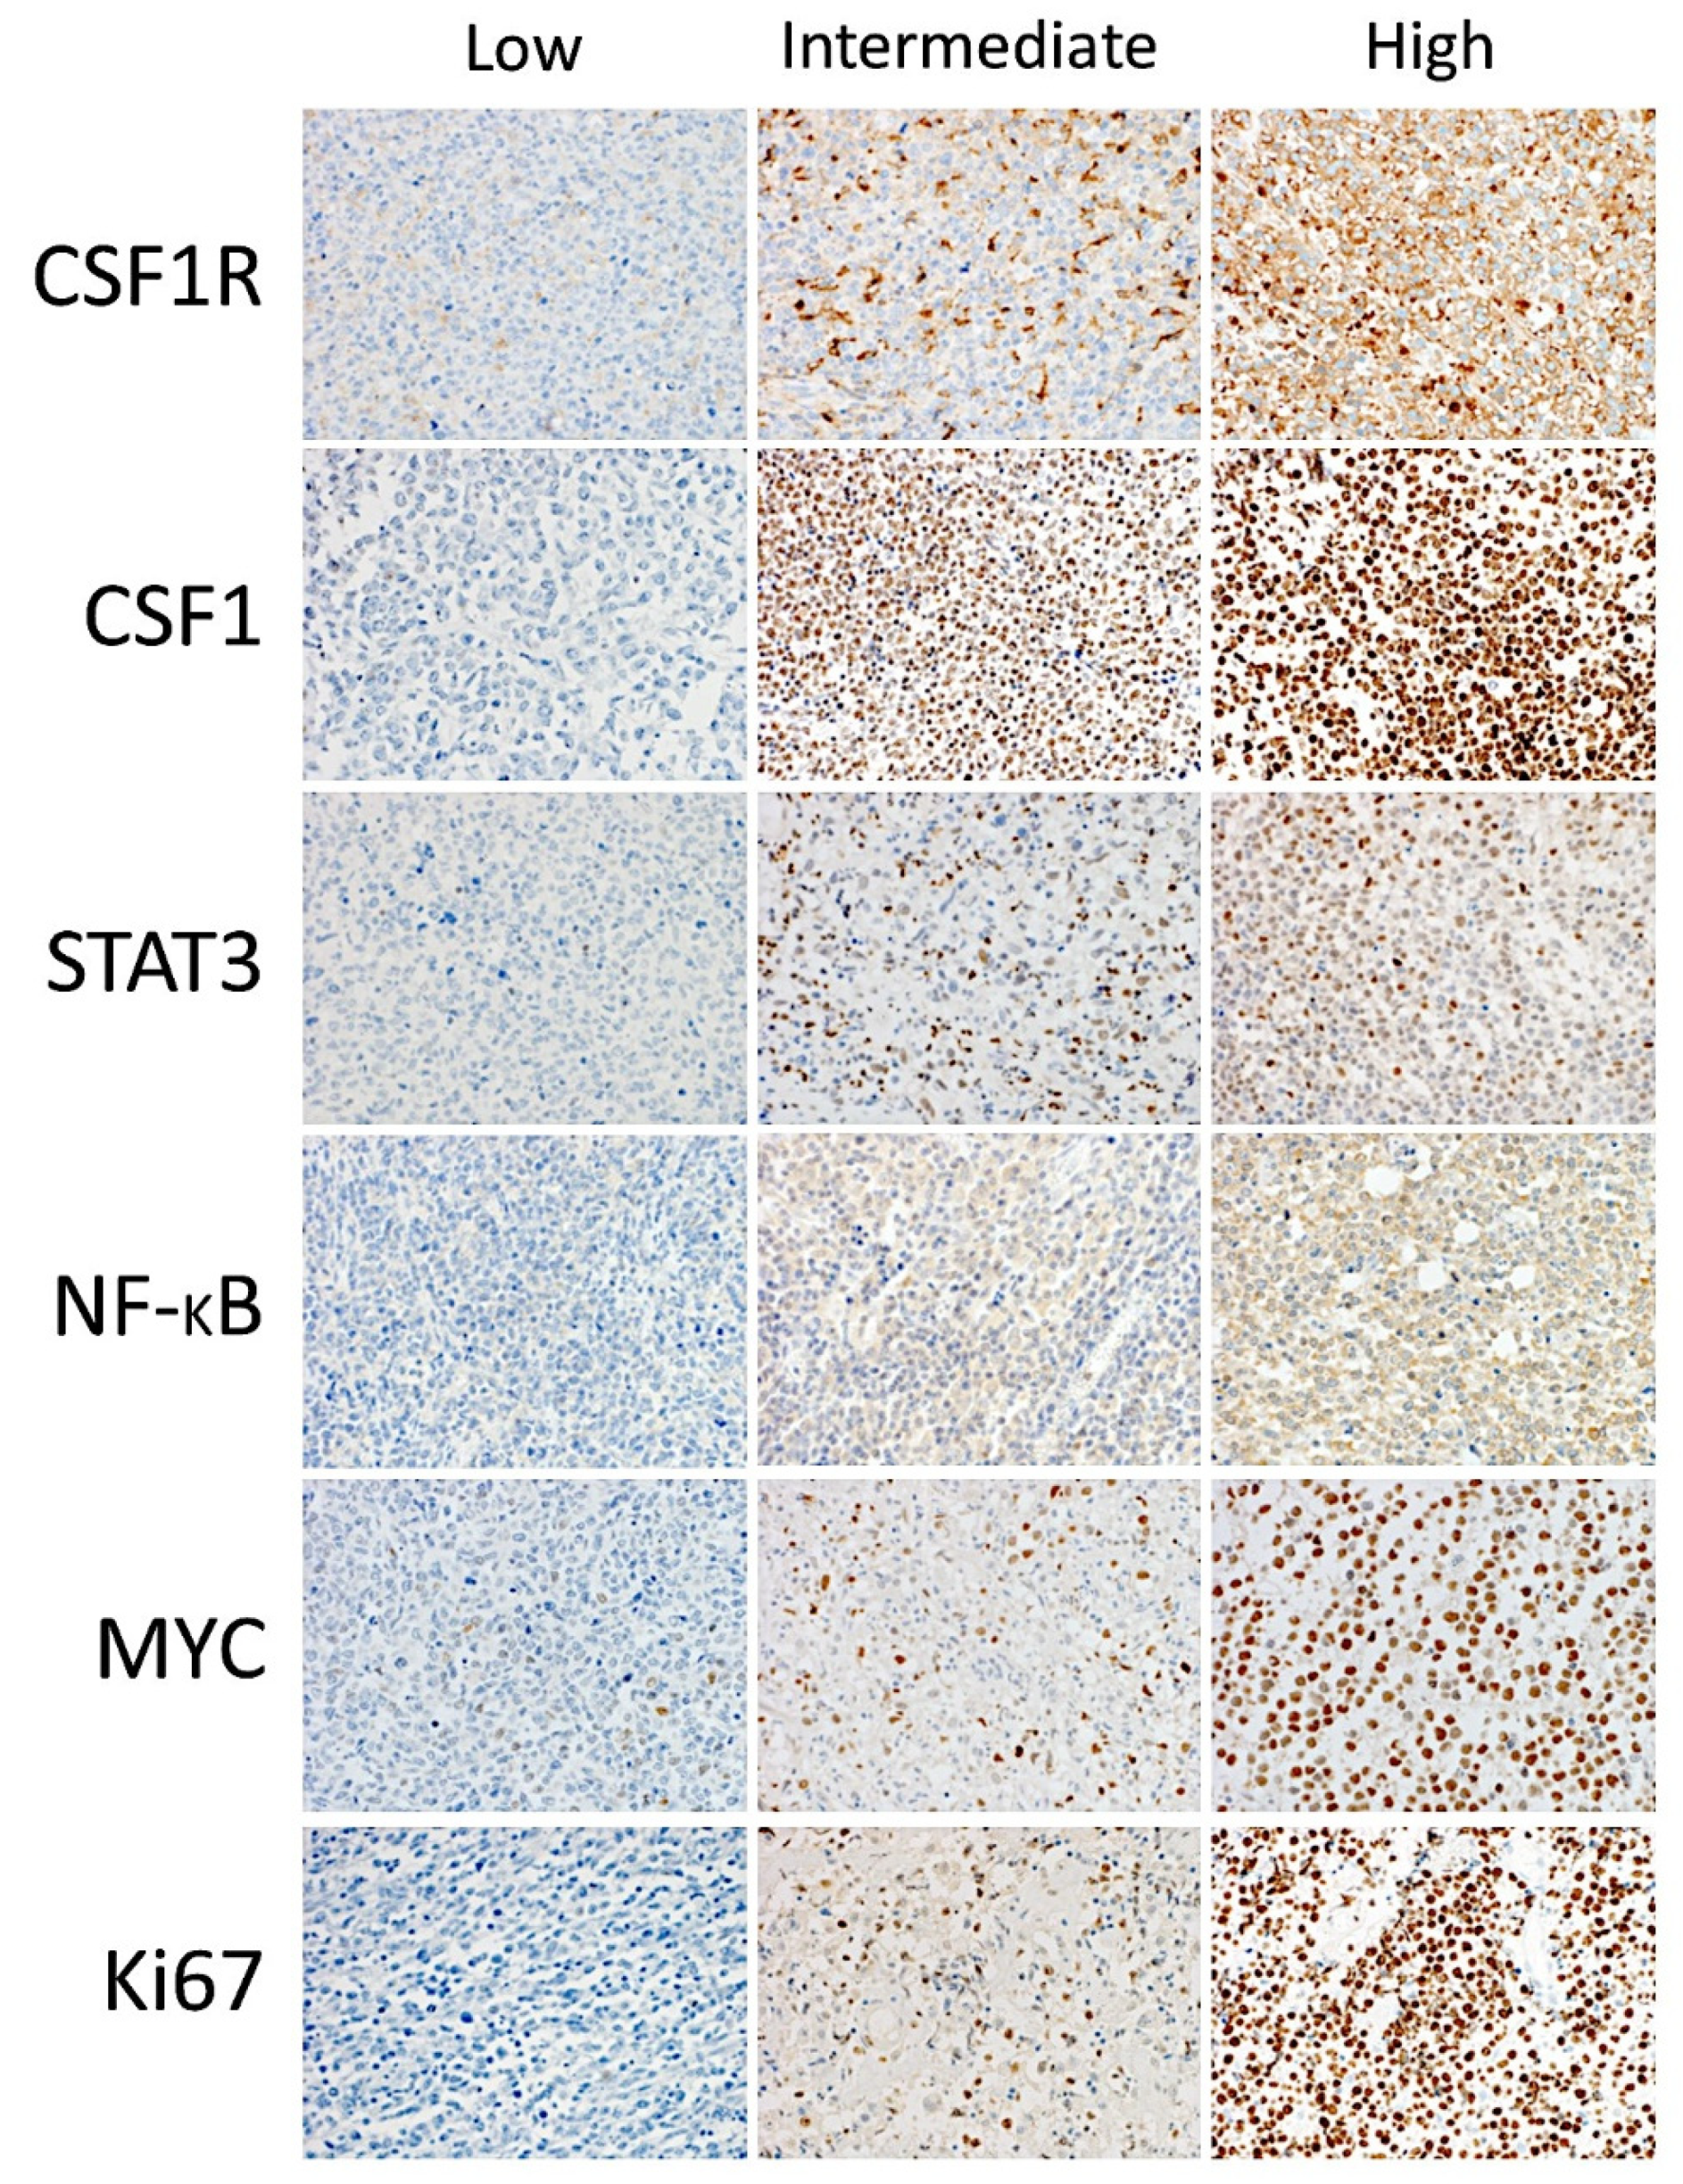
Figure 5). We aimed to predict the CSF1R expression as a quantitative variable by the previous 10 markers (CSF1, STAT3, NFKB1, Ki67, MYC, PD-L1, TNFAIP8, IKAROS, CD163, and CD68).
In the TAMs pattern group (n = 162), good correlation was found using the neural network (multilayer perceptron), regression, and generalized linear model (correlation accuracy >0.70). In the multilayer perceptron analysis, the target CSF1R was predicted by the 10 markers. From most important to least important, the markers were MYC, STAT3, TNFAIP8, CSF1, CD163, Ki67, IKAROS, CD68, NFKB1, and PDL1. The regression analysis showed that CSF1R expression could be calculated as TNFAIP8*0.3 + IKAROS*-3.7 + PD-L1*0.05 + CD163*-0.2 + Ki67*-0.1 + MYC*-0.4 + CSF1*0.04 + NFKB1*-0.1 + CD68*0.4 + STAT3*-0.3 + 35.9.
In the B-cells pattern group (n = 36), a good correlation was found using regression (accuracy 100), generalized linear (100), neural network (0.92), and SVM (0.73). The regression analysis showed that the CSF1R expression could be calculated as TNFAIP8*0.05 + IKAROS*-14.2 + PD-L1*-0.07 + Ki67*-0.3 + CSF1*0.5 + NFKB1*0.1 + CD68*-1.2 + STAT3*0.5 + 125.1. In the multilayer perceptron analysis, the target CSF1R was predicted by the 10 markers. From most important to least important, the markers were IKAROS, NFKB1, CD163, STAT3, TNFAIP8, Ki67, CSF1, MYC, CD68, and PD-L1.

3.3. Identification of the Genes Associated with CSF1R Expression Levels in the LLMPP DLBCL Series

The series of 414 cases was divided into two groups, according to the CSF1R expression: ≤11.62 (n = 309, 64.7%), and ≥11.63 (
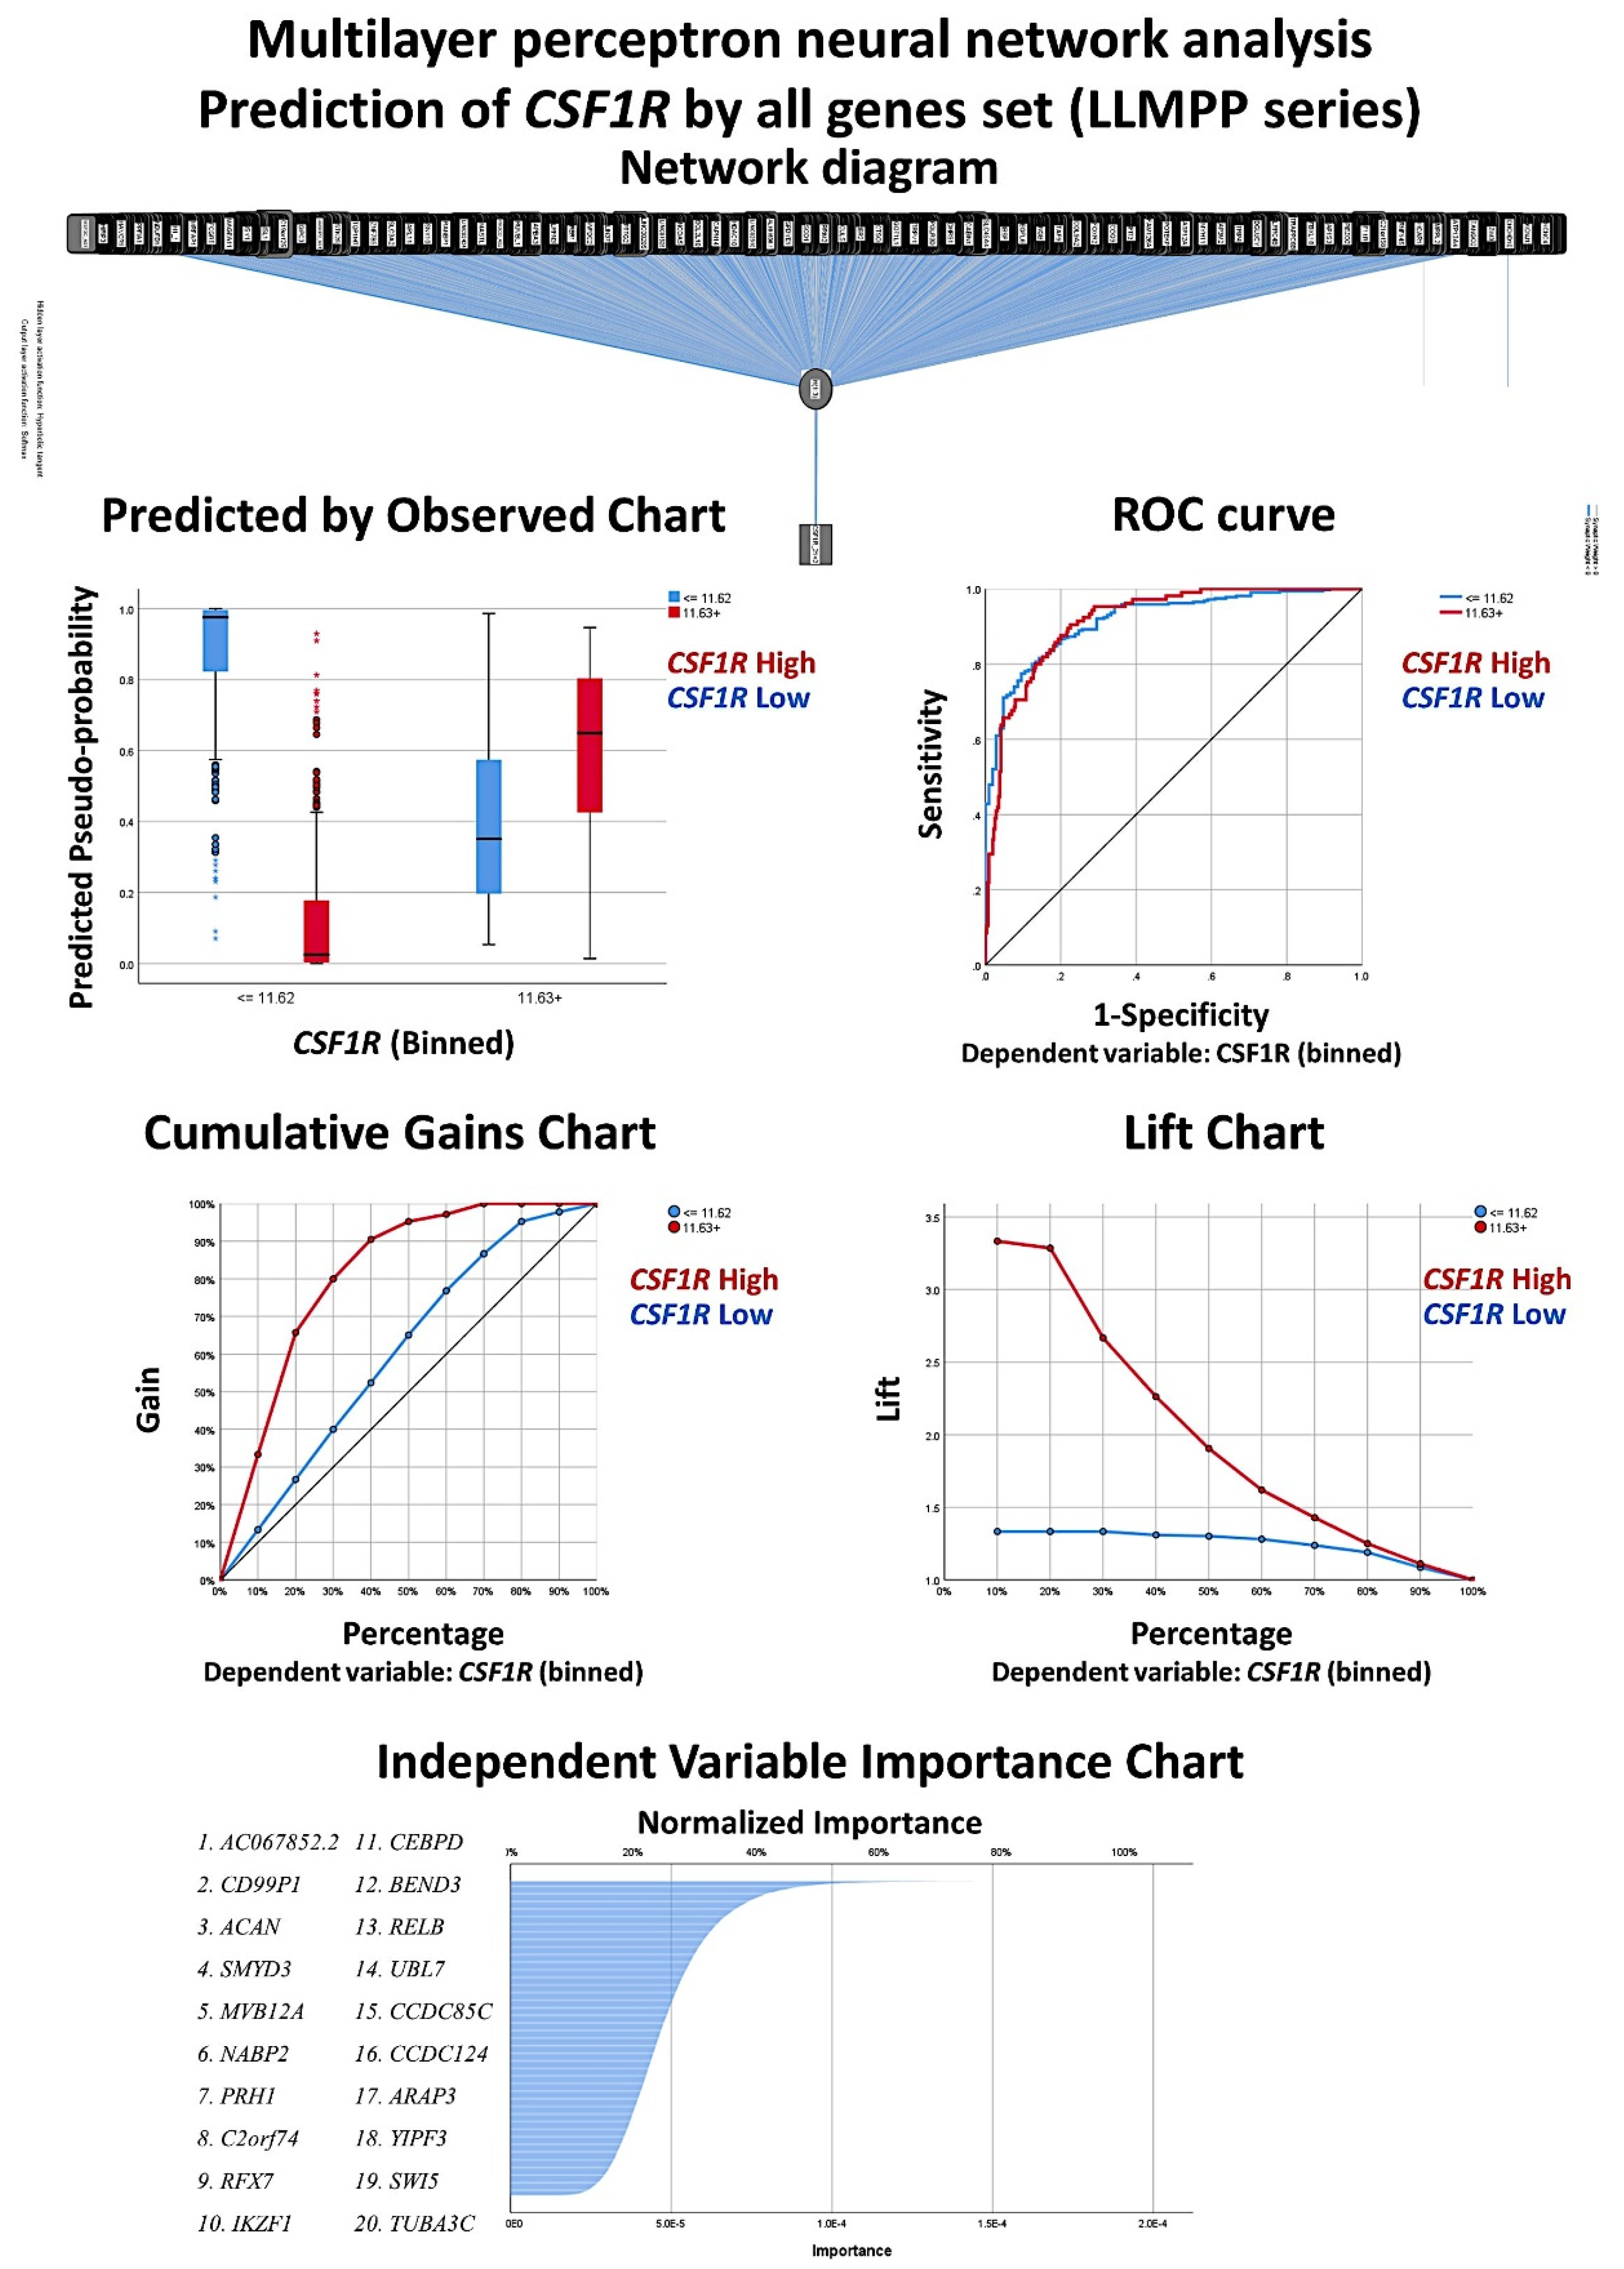
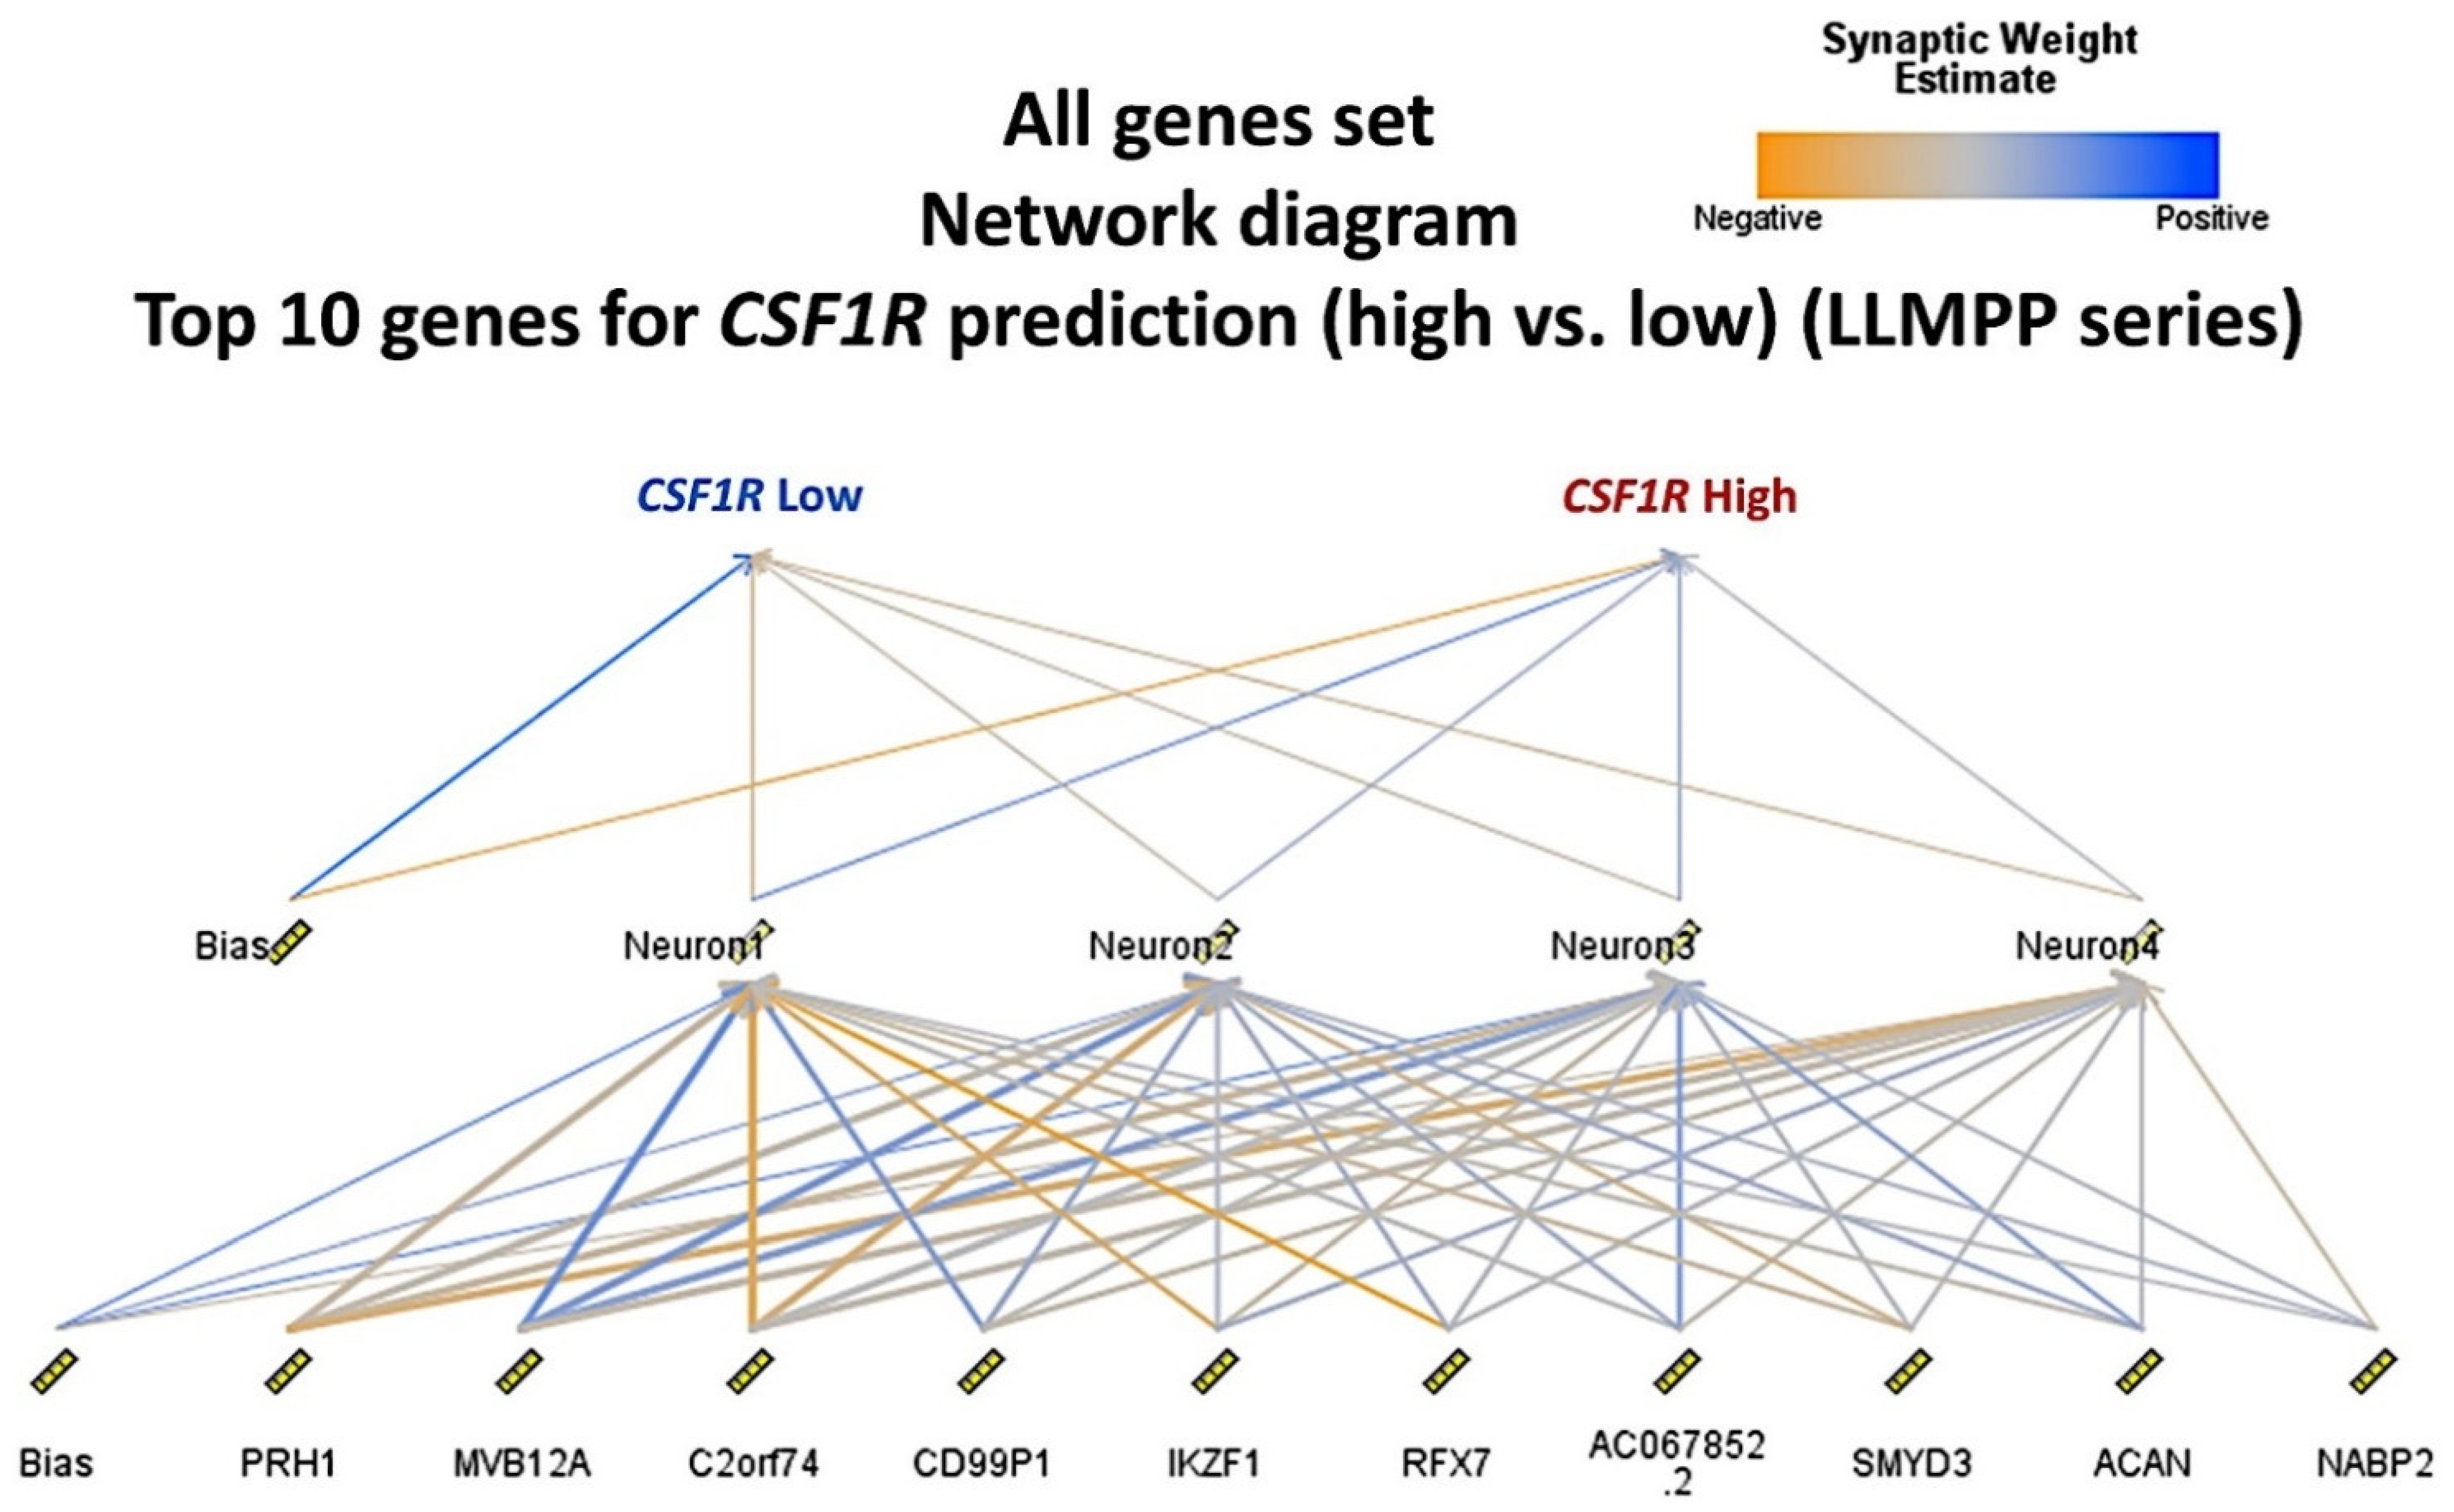
n = 105, 46.7%). The cut-off was found using the “transform variable“ and the “visual binding“ function of the SPSS software (version 26). When making the cutpoints, equal percentiles were used based on the scanned cases, and the intervals corresponded to the number of desired cutpoints. As a start, 3 cutpoints were set (25% for each interval). Then, the binned variable was subjected to overall survival analysis and a compromise between the statistical significance and a balanced distribution of the samples was found. A multilayer perceptron neural network analysis was performed to identify the most relevant genes associated with the CSF1R expression (Figure 6 and Figure 7). Using this technique, all the genes of the array (n = 20,683) were ranked according to their normalized importance for predicting the CSF1R expression as a dichotomic variable (high vs. low, using the cut-off value of 11.63). The neural network performance was good, with an area under the curve of 0.92 and a model with only a 12.2% of incorrect predictions in the training and a 14.9% in the testing set. In this model, the most relevant genes (with a normalized importance >70%) were as follows: AC067852.2, CD99P1, ACAN, SMYD3, MVB12A, NABP2, PRH1, C2orf74, RFX7, IKZF1, and CEBPD.
A logistic regression was performed to ascertain the effects of the most relevant genes, that were previously identified in the multilayer perceptron neural network analyses, on the likelihood that the patients have a high CSF1R expression. The genes with a normalized importance >70% were selected and the analysis included univariate and multivariate (backward conditional) tests.
In the multivariate analysis, increasing expression of CD99P1, MVB12A, IKZF1, and CEBPD was associated with an increased likelihood of exhibiting high CSF1R expression, but increasing PRH1 and C2orf74 was associated with a reduction in the likelihood of exhibiting high CSF1R expression (Table 7).

3.4. Identification of the Genes of the Cancer Transcriptome Atlas Panel Associated with CSF1R Levels of the LLMPP DLBCL Series

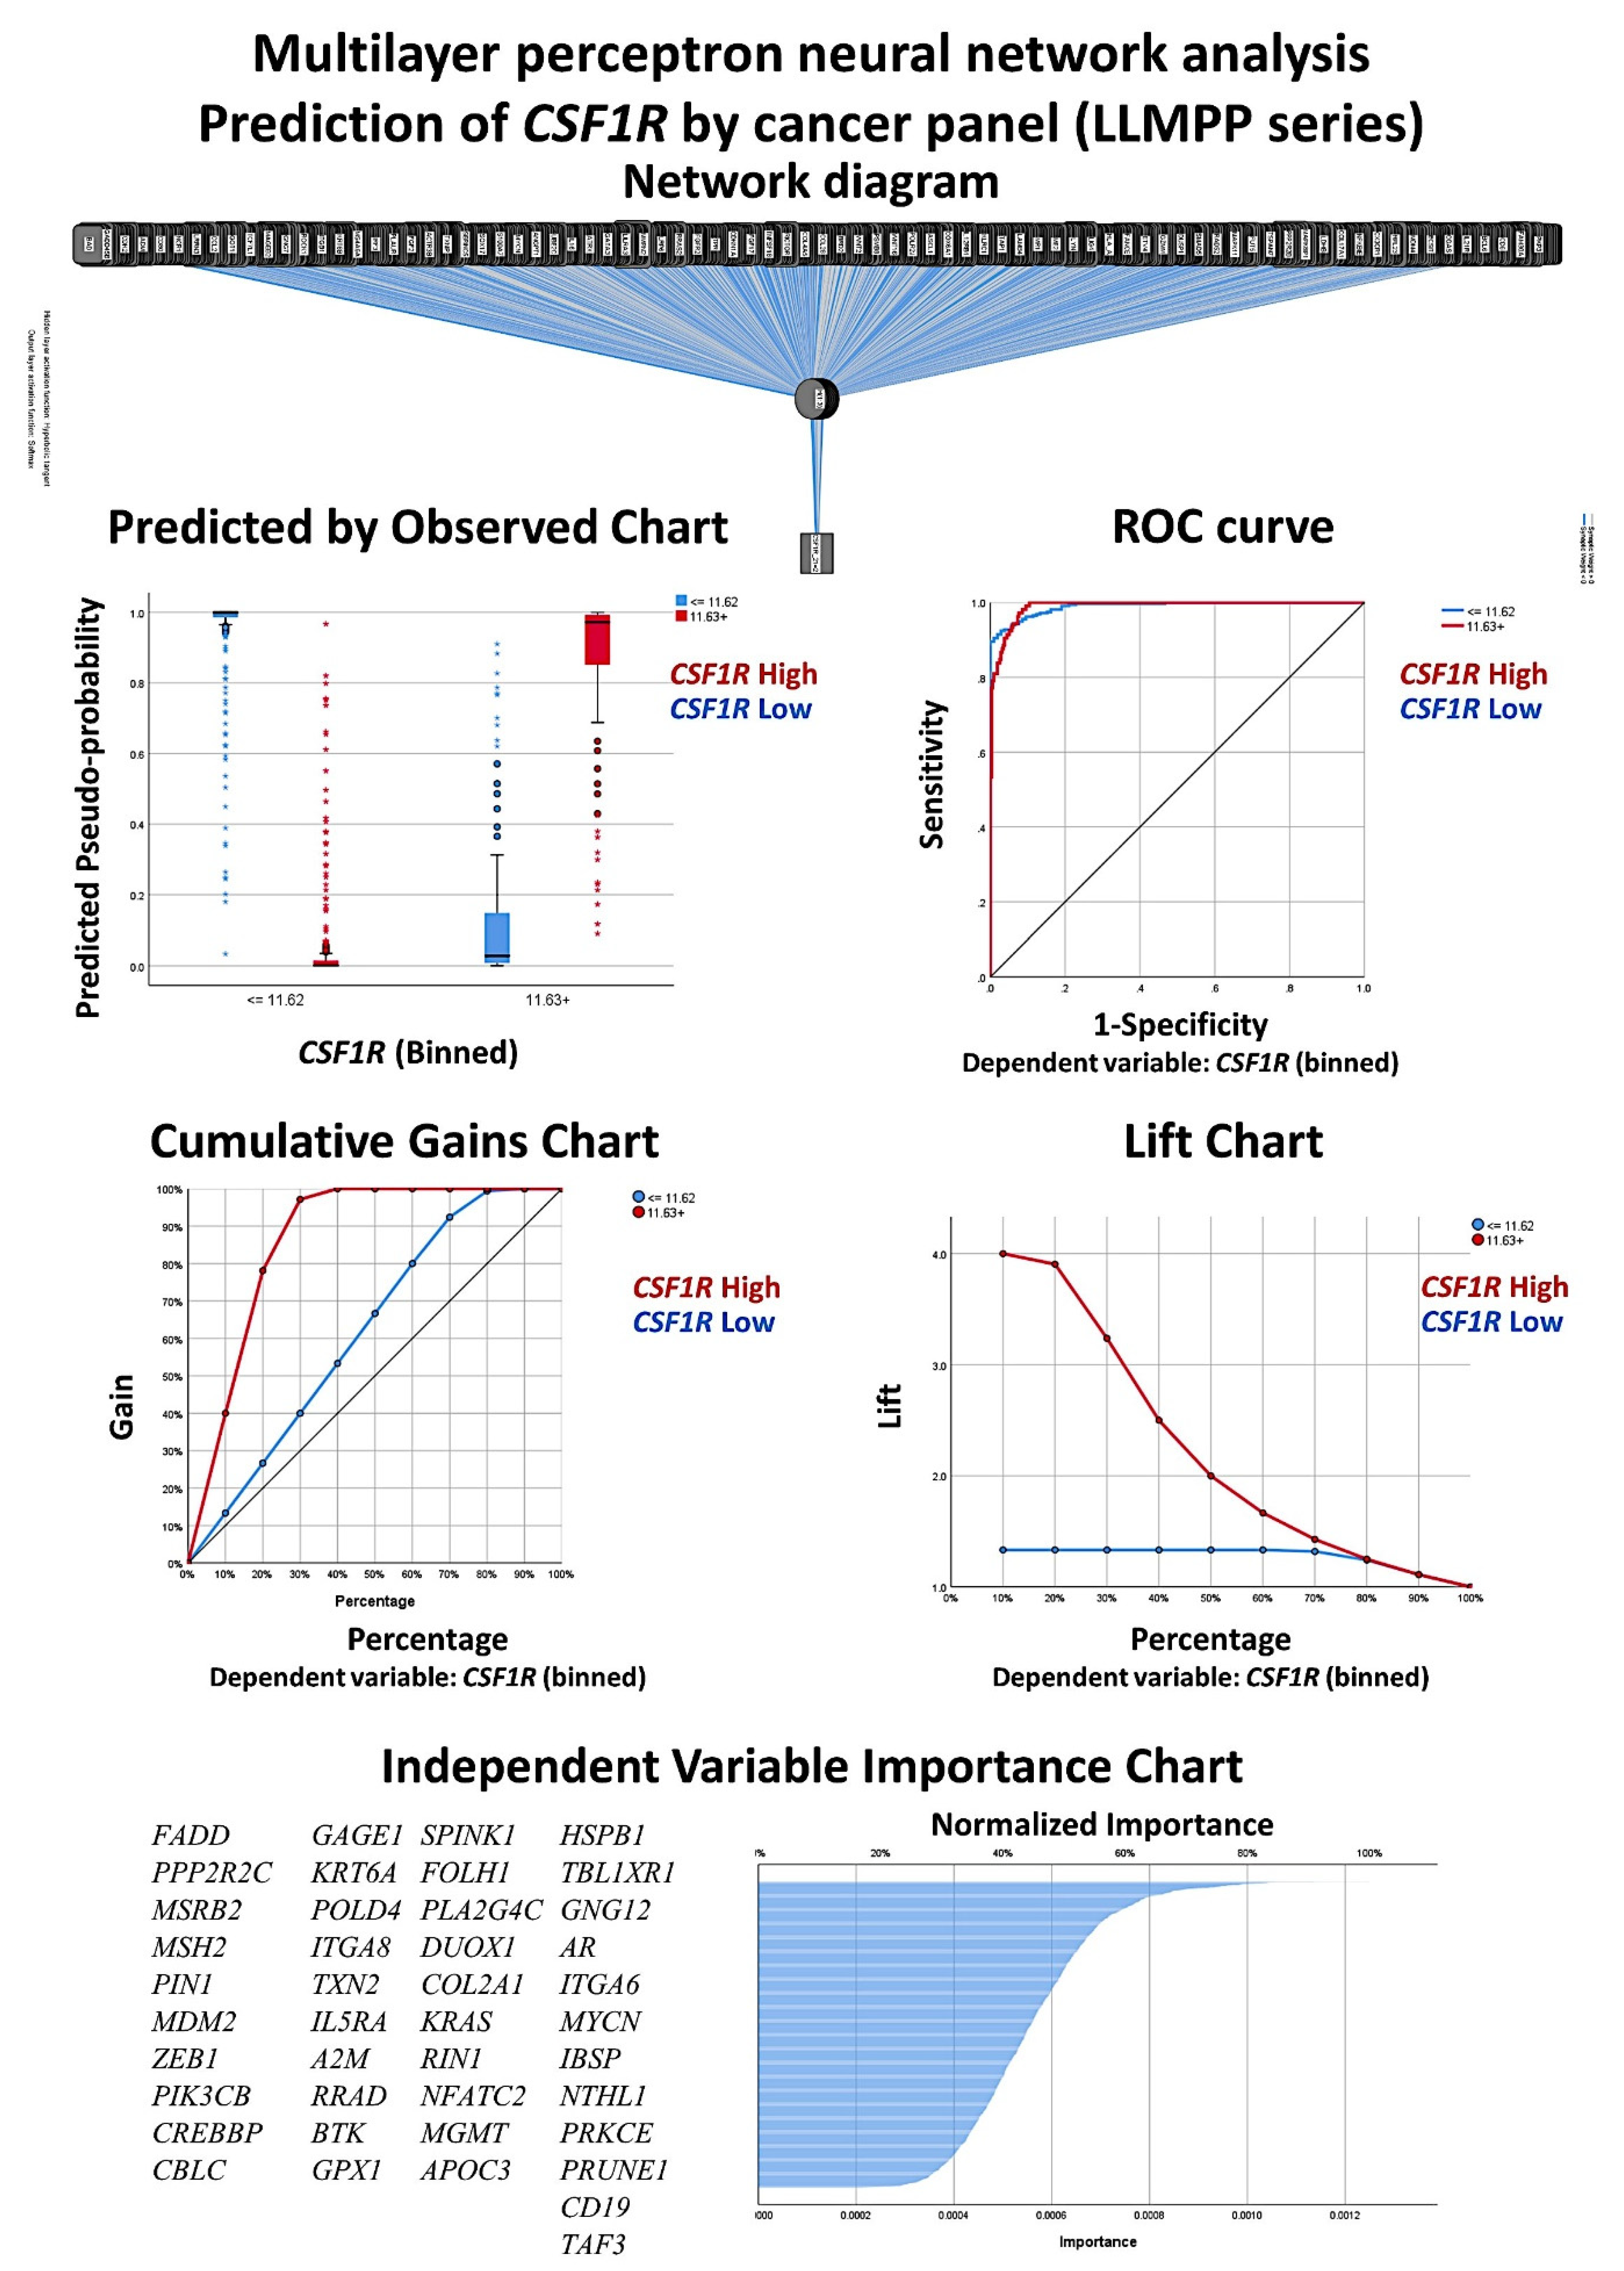
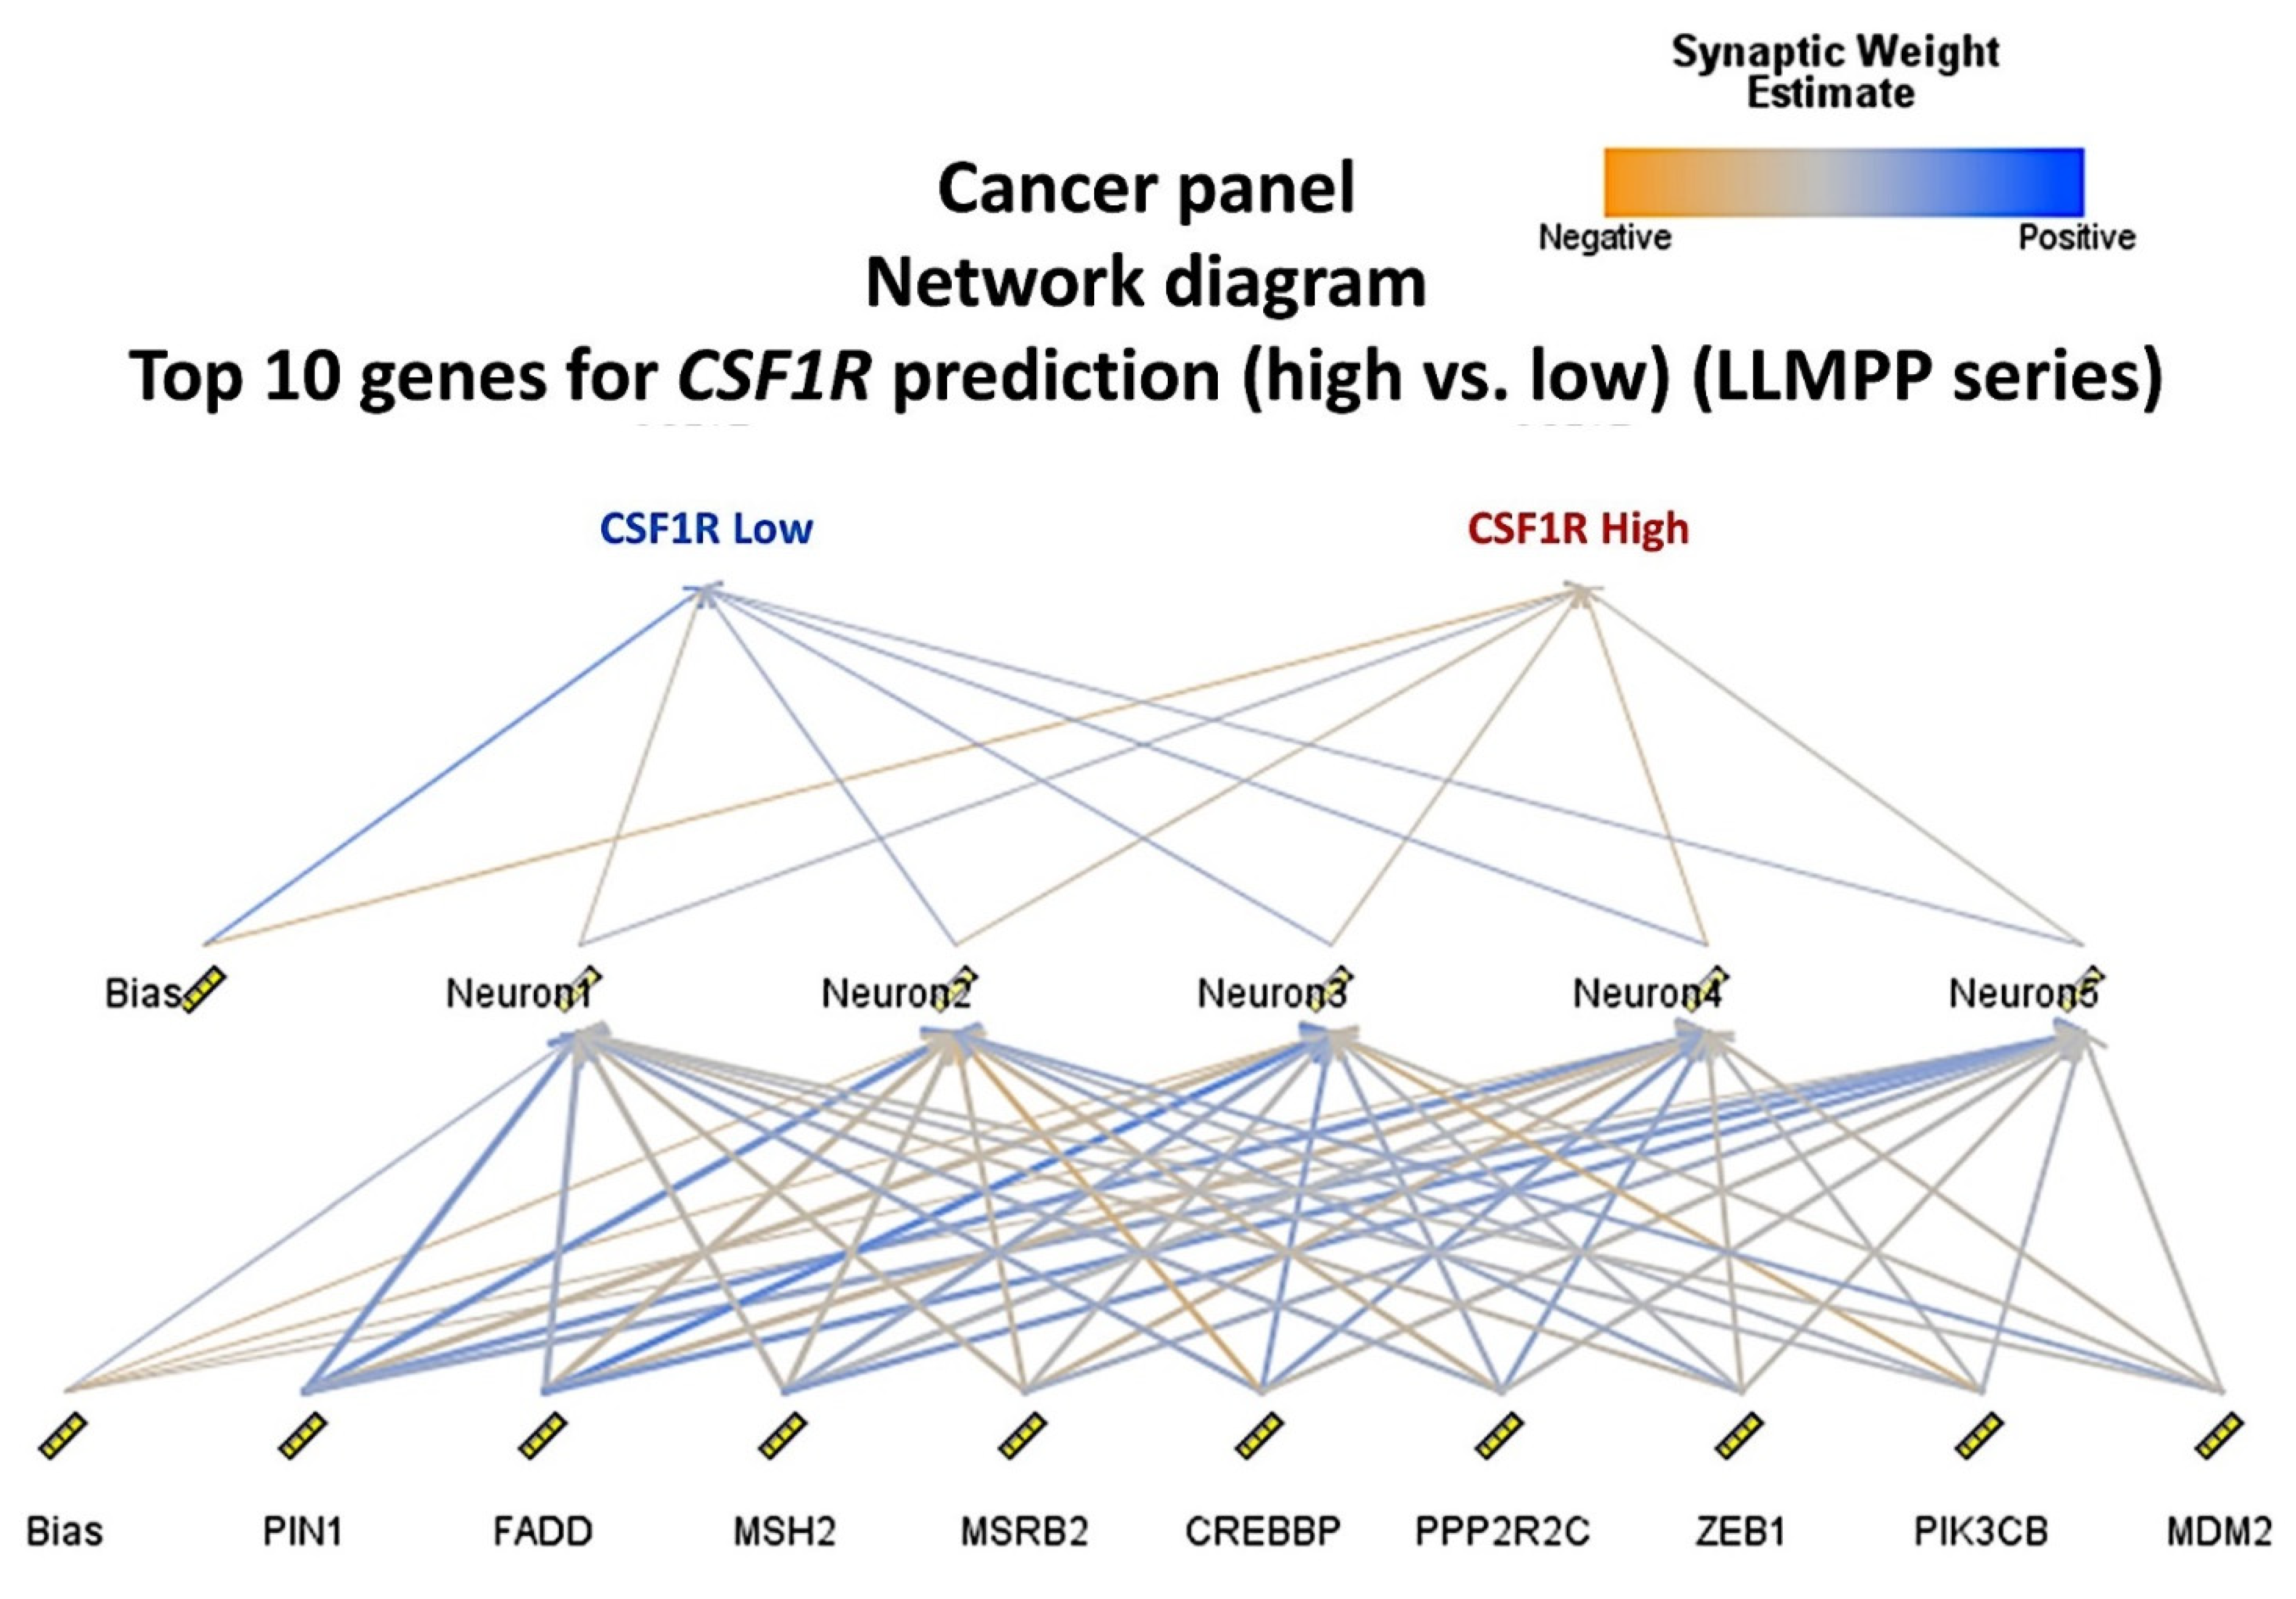
A multilayer perceptron neural network analysis was performed to identify the most relevant genes of the transcriptome atlas panel associated with the CSF1R expression (Figure 8 and Figure 9). Using this technique, all the genes of the array (n = 1790) were ranked according to their normalized importance for predicting the CSF1R expression as a dichotomic variable (high vs. low, using the cut-off value of 11.63). The neural network performance was good, with an area under the curve of 0.99 and a model with only a 3.3% of incorrect predictions in the training and an 11.2% in the testing set. In this model, the most relevant genes (normalized importance >70%) were 42. In order from most to least important were as follows: FADD (normalized importance 100%), PPP2R2C (91%), MSRB2 (85%), MSH2, PIN1, MDM2, ZEB1, PIK3CB, CREBBP, CBLC, GAGE1, KRT6A, POLD4, ITGA8, TXN2, IL5RA, A2M, RRAD, BTK, GPX1, SPINK1, FOLH1, PLA2G4C, DUOX1, COL2A1, KRAS, RIN1, NFATC2, MGMT, APOC3, HSPB1, TBL1XR1, GNG12, AR, ITGA6, MYCN, IBSP, NTHL1, PRKCE, PRUNE1, CD19, and TAF3 (70%).
A logistic regression was performed to ascertain the effects of the most relevant genes of the cancer panel, which were previously highlighted in the multilayer perceptron neural network analyses, on the likelihood that the patients have a high CSF1R expression. The genes with a normalized importance >70% were selected and the analysis included univariate and multivariate (backward conditional) tests.
In the multivariate analysis, increasing expression of PLA2G4C, RIN1, NFATC2, and HSPB1 was associated with an increased likelihood of exhibiting high CSF1R expression, but increasing PIN1, TXN2, IL5RA, SPINK1, FOLH1, KRAS, ITGA6, PRKCE, and TAF3 was associated with a reduction in the likelihood of exhibiting high CSF1R expression (Table 8).

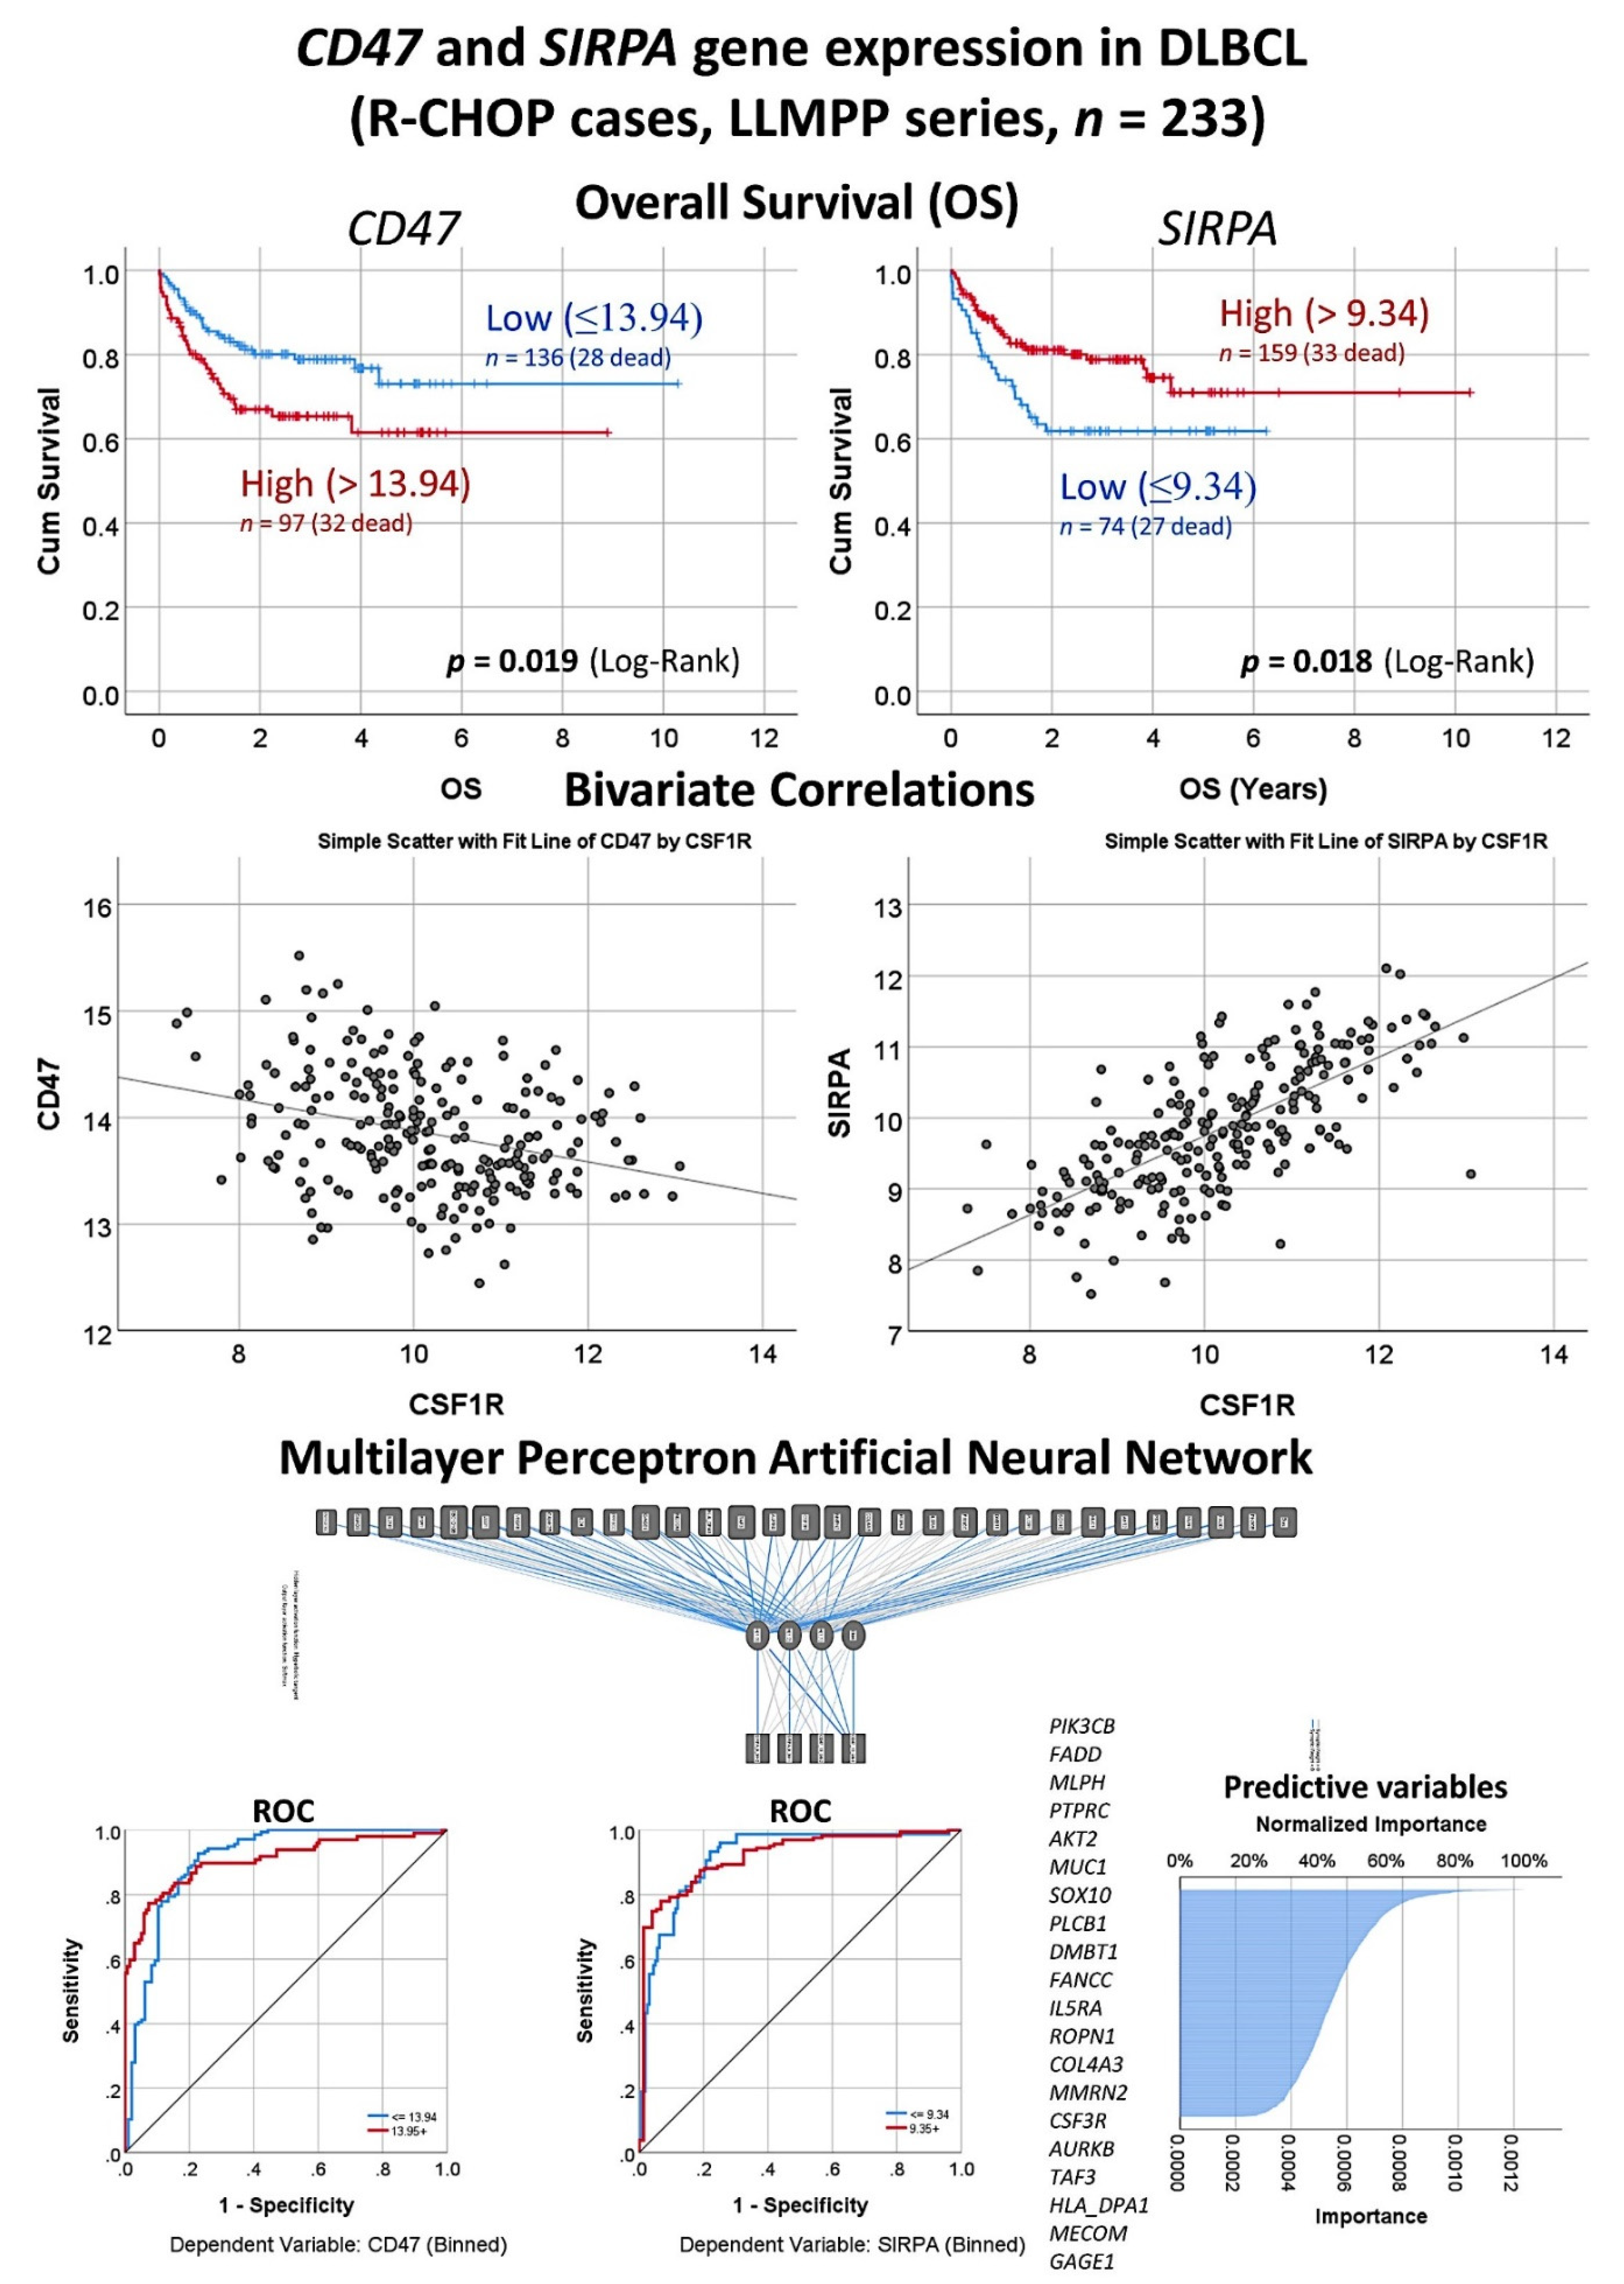
3.5. Correlation between Expression Levels of CSF1R and CD47 in the LLMPP DLBCL Series

The CD47 was one of the genes present in the transcriptome atlas panel set that belongs to the immune checkpoint pathway. It is related to the macrophages’ pathway and it is associated with the prognosis of DLBCL [31,32,33,34]. An immunohistochemical study showed that CD47 was expressed by the B-lymphocytes of DLBCL, while its receptor SIRPA (namely Tyrosine-protein phosphatase non-receptor type substrate 1) was expressed by the tumor-associated macrophages (TAMs) [34]. SIRPA (is a relevant immune checkpoint marker because it mediates negative regulation of phagocytosis [13].
In the 233 DLBCL cases of the LLMPP series with R-CHOP treatment, high gene expression of CD47 correlated with an unfavorable overall survival of the patients (cut-off value = 13.94, Hazard Risk = 1.82, p = 0.021) (Figure 10). Conversely, high expression of SIRPA correlated with a favorable overall survival (cut-off value = 9.34, Hazard Risk = 0.55, p = 0.02). Of note, CD47 and SIRPA gene expression levels inversely correlated between them (Pearson Correlation = −0.3, p < 0.001). Both markers were correlated with the CSF1R expression (Figure 10). CSF1R inversely correlated with CD47 (Pearson Correlation = −0.31, p < 0.001). Conversely, CSF1R strongly correlated positively with SIRPA (Pearson Correlation = 0.71, p < 0.001). Finally, in order to identify which genes of the transcriptome atlas panel were more associated with the expression of both CD47 and SIRPA, a multilayer perceptron artificial neural network analysis was performed (Figure 10). The most relevant markers were the following: PIK3CB, FADD, MLPH, PTPRC, AKT2, MUC1, SOX10, PLCB1, DMBT1, and FANCC. Of note, the predictive modeling by the neural network had a high efficiency with an area under the curve (ROC) of 0.91 for both markers.

4. Discussion

Colony stimulating factor 1 receptor (CSF1R), also known as macrophage colony-stimulating factor receptor (M-CSFR) and CD115, is a cell surface protein that functions as a receptor for colony stimulating factor 1 (CSF1) and the Interleukin-34 (IL-34). CSF1R has a role in regulating the homeostatic survival of the tumor-associated macrophages (TAMs). TAMs are relevant because they promote tumorigenesis of many types of cancer, including non-Hodgkin lymphomas [23,35,36,37,38]. Therefore, CSF1R is a potentially relevant oncological target.
CSF1R expression was initially thought to be characteristic of myeloid cells, but recent research has shown that non-myeloid cells can also express CSF1R, including malignant B-lymphocytes and classical Hodgkin Lymphoma [23,35,36,37]. In this research about DLBCL, we have found that the immunohistochemical expression of CSF1R was variable. The most characteristic pattern was of TAMs, present in 82% of the cases. These CSF1R-positive TAMs had a morphology that was like the one seen in M2-like TAMs, with a higher shape and dendritiform elongations, especially when the concentration was high in the tumor immune microenvironment. In addition, a CSF1R-positive B-cells pattern was seen in 18% of the cases. This CSF1R pattern affected the B-lymphocytes of DLBCL and the expression was diffuse. The CSF1R pattern correlated with the prognosis of the patients. The CSF1R-positive TAMs pattern was associated with a poor progression-free survival. Conversely, the B-cells pattern correlated with a favorable progression-free survival. Interestingly, although not statistically significant, the pattern of low CSF1R-positive TAMs had a better survival than the cases with high CSF1R-positive TAMs.
The start point of this research was to check if the gene expression of CSF1R correlated with the prognosis of the patients with DLBCL. We used the LLMPP series that is comprised of 414 DLBCL cases. This series from western countries is robust and very well annotated. Using a cut-off, two groups with different overall survival could be found. The group with low CSF1R expression, ≤11.62 (n = 309, 64.7%), was associated with favorable survival. Conversely, the group with high CSF1R expression, ≥11.63 (n = 105, 46.7%), was associated with a poor outcome. We also correlated the CSF1R with other markers, including CD163 and PD-L1 that are markers of M2-like TAMs. The correlation was moderate and positive. Therefore, the hypothesis was that CSF1R in DLBCL identified only TAMs. In DLBCL, high CD163-positive TAMs have been associated with poor prognosis of the patients [9,10,12], which is the same result seen by gene expression in the LLMPP series. Nevertheless, the presence of a B-cell pattern was not expected. This B-cell pattern was a new finding in the Tokai University Hospital series. Of note, in the reactive tonsils, CSF1R-positive B-cells were not identified. Therefore, this B-cells pattern in DLBCL may be pathological, as seen in Hodgkin Lymphoma.
In the Tokai series, a correlation between the two CSF1R patterns was made with several clinicopathological characteristics of the series. Initially, not many associations were found, but the B-cells pattern was associated with a lower MYC immunohistochemical expression, absence of BCL2 translocation, absence of mutation of MYD88 L265P, and higher MDM2 immunohistochemical expression. These characteristics point to a lower pathological background in this group of patients. Correlation with the clinical features of the patients also showed that the CSF1R + TAMs pattern was associated with a poor progression-free survival of the patients, disease progression, higher MYC expression, lower MDM2 expression, BCL2 translocation, and MYD88 L265P mutation. In addition, the histological expression of CSF1R was also correlated with 10 CSF1R-related markers including CSF1, STAT3, NF-KB, Ki67, MYC, PD-L1, TNFAIP8, IKAROS, CD163, and CD68, and predictive modeling with high accuracy for CSF1R was found using regression, generalized linear, an artificial intelligence neural network (multilayer perceptron), and SVM. Of note, CSF1R moderately correlated with STAT3, TNFAIP8, CD163, and CD68. Therefore, our results agree with groups that showed that, in DLBCL, high CD163-positive TAMs were associated with poor prognosis of the patients [9,10,12].
Finally, we used artificial intelligence analysis to identify the genes that predicted the CSF1R expression in the LLMPP series. Many data mining applications use neural networks because of their power, flexibility, and ease of use in situations where the underlying process is complex [26]. Among them, the multilayer perceptron analysis predicts one or more target variables based on the values of several predictors [26]. In this research, we performed two types of analysis. First, we used all the genes of the array and the result ranked the genes according to their importance to predict the CSF1R expression (high vs. low). This analysis was technically successful, as shown by the low percentage of incorrect predictions and the high area under the curve. Second, we used an immune-oncology cancer panel and the multilayer perceptron managed to predict the CSF1R expression with even better performance. Therefore, it is expected that those genes are not only related to the CSF1R expression mechanisms but also related to the prognosis of DLBCL.
If the gene CSF1R is checked in the cBioPortal webpage for cancer genomics and a combined study for DLBCL with 1295 samples is performed, the result shows that there are no alterations in this gene. We think that CSF1R is not relevant in DLBCL for the mutational status or other genomic changes, but it is relevant for their association to macrophage signature. Of note, the relevance of CD163 in DLBCL is well established as a marker for an inferior prognosis [9,10].
CSF1R may be relevant in other subtypes of cancer. According to the Human Protein Atlas (http://www.proteinatlas.org; accessed on 9 April 2021) [39] that used the TCGA dataset, the RNA expression of CSF1R shows low cancer specificity. Among the different types of tumors that are being tested, glioma is the subtype that shows more CSF1R expression. High CSF1R expression correlated with a poor prognosis of renal and testis cancer. Nevertheless, no information is provided regarding lymphoma and CSF1R in the Human Protein Atlas. According to the Kaplan-Meier Plotter (http://kmplot.com/analysis/index.php?p=background; accessed on 9 April 2021) [40], high expression of CSF1R is associated with favorable overall survival of breast cancer and unfavorable overall survival of ovarian, lung, and gastric cancer. Therefore, CSF1R seems to be relevant in the pathogenesis of other subtypes of cancer as well. Due to the importance of the CSF1R in cancer, several groups have used CSF1/CSF1R inhibitors as monotherapy in clinical development. For example, small molecules have been used in melanoma, prostate cancer with metastasis, glioblastoma multiforme, solid tumors, relapse or refractory acute myeloid leukemia, and breast cancer. A review manuscript describing the use of CSF1R inhibitors in cancer therapy has recently been written by Cannarile MA et al. [41]
There are new discriminators in the literature that are worth mentioning. For example, CD47 is a marker of the immune checkpoint that is a potential negative regulator of the DLBCL treatment outcome (“don’t eat me”). In a report by Bouwstra et al., CD47-positive DLBCL is characterized by worse overall survival when treated by R-CHOP [33]. Therefore, DLBCL patients of the non-GCB cell-of-origin subtype may benefit from CD47-targeted therapy in addition to rituximab and possibly in addition to macrophage-targeted therapy. In the last section of our research, we analyzed the CD47 and SIRPA expression in the LLMPP database. We found that high CD47 correlated with a poor overall survival of the patients, and that high SIRPA (the receptor for CD47) correlated with good survival and with CSF1R (Figure 10). In addition, we also highlighted the genes of the cancer panel associated with the expression of these two markers. Therefore, CD47 is an interesting marker with complex relationships and will require further analysis. TAMs in DLBCL can also be targeted using a legumain inhibitor, which suppressed the tumor progression in an OCI-Ly3 xenograft mouse model of DLBCL [42]. Wu ZL et al. reported that high nuclear expression of STAT3 associated with an unfavorable prognosis of DLBCL [43]. In our research, we found that, in the CSF1R histological pattern of TAMs, which was associated with a worse progression-free survival, the CSF1R marker correlated with the STAT3 expression. Finally, high expression of PD-L1 was associated with poor prognosis in DLBCL [44]. This result was also recently confirmed by our group [45], but, in this research, the CSF1R did not correlate with the PD-L1 expression. Another marker that we have recently described is the apoptosis inhibitor TNFAIP8, which is associated with a poor prognosis of the patients [28]. In this research, we found that, in the TAMs histological pattern, CSF1R correlated with TNFAIP8.

5. Conclusions

In DLBCL, the expression of DLBCL shows two histological patterns with correlation to the progression-free survival of the patients. A pattern of CSF1R-positive TAMs correlates with poor progression-free survival. Conversely, a pattern of CSF1R-positive B-cells correlate with a favorable progression-free survival. Using multilayer perceptron artificial neural network analysis, the genes connect with the CSF1R expression that could be highlighted. Therefore, CSF1R is a relevant marker in the pathogenesis of DLBCL.

Author Contributions

Conceptualization, J.C. Methodology, J.C. Software, J.C. Validation, R.H. Formal analysis, J.C. Investigation, G.R., J.F.G., Y.Y.K., M.M., S.H., S.T., H.I., Y.K. (Yusuke Kondo), Y.K. (Yoshihiro Komohara) and A.I. Resources, N.N. Writing—original draft preparation, J.C. Writing—review and editing, J.C. Supervision, N.N. Project administration, J.C. Funding acquisition, J.C. and R.H. All authors have read and agreed to the published version of the manuscript.

Funding

This research was funded by grant KAKEN 18K15100 to Joaquim Carreras, Grant-in-Aid for Early-Career Scientists from the Japanese Society for the Promotion of Science (JSPS) of the Ministry of Education, Culture, Sports, Science, and Technology-Japan (MEXT). R.H. was funded by Al-Jalila Foundation (AJF201741), the Sharjah Research Academy (Grant code: MED001), and University of Sharjah (Grant code: 1901090258).

Institutional Review Board Statement

The study was conducted according to the guidelines of the Declaration of Helsinki and approved by the Institutional Review Board and the Ethics Committee of Tokai University, School of Medicine (protocol code IRB14R-080 and IRB-156).

Informed Consent Statement

Informed consent was obtained from all subjects involved in the study.

Data Availability Statement

Publicly available datasets were analyzed in this study [24,25]. This data can be found here: https://0-www-ncbi-nlm-nih-gov.brum.beds.ac.uk/geo/; accessed on 9 April 2021.

Acknowledgments

We would like to thank all the members of the Lymphoma/Leukemia Molecular Profiling Project (LLMPP) including LM Staudt, E Campo, WC Chan, WH Wilson, TA Lister, RD Gascoyne, JM Conners, G Wright, SS Dave, LM Rimsza, A Ronsenwald, and ES Jaffe (among others) for creating and sharing publicly the GSE10846 dataset.

Conflicts of Interest

The authors declare no conflict of interest.

References

  1. Freedman, A.S.; Aster, J.C.; Lister, A.; Rosmarin, A.G. Prognosis of Diffuse Large B Cell Lymphoma. UpToDate. Available online: https://www.uptodate.com/contents/prognosis-of-diffuse-large-b-cell-lymphoma?search=Prognosis%20of%20diffuse%20large%20B%20cell%20lymphoma&source=search_result&selectedTitle=1~150&usage_type=default&display_rank=1 (accessed on 9 April 2020).
  2. Swerdlow, S.H.; Campo, E.; Pileri, S.A.; Harris, N.L.; Stein, H.; Siebert, R.; Advani, R.; Ghielmini, M.; Salles, G.A.; Zelenetz, A.D.; et al. The 2016 revision of the World Health Organization classification of lymphoid neoplasms. Blood 2016, 127, 2375–2390. [Google Scholar] [CrossRef] [PubMed] [Green Version]
  3. Zhou, Z.; Sehn, L.H.; Rademaker, A.W.; Gordon, L.I.; Lacasce, A.S.; Crosby-Thompson, A.; Vanderplas, A.; Zelenetz, A.D.; Abel, G.A.; Rodriguez, M.A.; et al. An enhanced International Prognostic Index (NCCN-IPI) for patients with diffuse large B-cell lymphoma treated in the rituximab era. Blood 2014, 123, 837–842. [Google Scholar] [CrossRef]
  4. Alizadeh, A.A.; Eisen, M.B.; Davis, R.E.; Ma, C.; Lossos, I.S.; Rosenwald, A.; Boldrick, J.C.; Sabet, H.; Tran, T.; Yu, X.; et al. Distinct types of diffuse large B-cell lymphoma identified by gene expression profiling. Nature 2000, 403, 503–511. [Google Scholar] [CrossRef]
  5. Fu, K.; Weisenburger, D.D.; Choi, W.W.; Perry, K.D.; Smith, L.M.; Shi, X.; Hans, C.P.; Greiner, T.C.; Bierman, P.J.; Bociek, R.G.; et al. Addition of rituximab to standard chemotherapy improves the survival of both the germinal center B-cell-like and non-germinal center B-cell-like subtypes of diffuse large B-cell lymphoma. J. Clin. Oncol. 2008, 26, 4587–4594. [Google Scholar] [CrossRef]
  6. Rosenwald, A.; Wright, G.; Chan, W.C.; Connors, J.M.; Campo, E.; Fisher, R.I.; Gascoyne, R.D.; Muller-Hermelink, H.K.; Smeland, E.B.; Giltnane, J.M.; et al. The use of molecular profiling to predict survival after chemotherapy for diffuse large-B-cell lymphoma. N. Engl. J. Med. 2002, 346, 1937–1947. [Google Scholar] [CrossRef]
  7. Alizadeh, A.A.; Gentles, A.J.; Alencar, A.J.; Liu, C.L.; Kohrt, H.E.; Houot, R.; Goldstein, M.J.; Zhao, S.; Natkunam, Y.; Advani, R.H.; et al. Prediction of survival in diffuse large B-cell lymphoma based on the expression of 2 genes reflecting tumor and microenvironment. Blood 2011, 118, 1350–1358. [Google Scholar] [CrossRef]
  8. Shoushtari, A.N.; Hellman, M.; Atkins, M.B.; Sonali, S. Principles of cancer immunotherapy. UpToDate. Available online: https://www.uptodate.com/contents/principles-of-cancer-immunotherapy?search=Principles%20of%20cancer%20immunotherapy&source=search_result&selectedTitle=1~150&usage_type=default&display_rank=1 (accessed on 9 April 2020).
  9. Li, Y.L.; Shi, Z.H.; Wang, X.; Gu, K.S.; Zhai, Z.M. Tumor-associated macrophages predict prognosis in diffuse large B-cell lymphoma and correlation with peripheral absolute monocyte count. BMC Cancer 2019, 19, 1049. [Google Scholar] [CrossRef]
  10. Komohara, Y.; Niino, D.; Ohnishi, K.; Ohshima, K.; Takeya, M. Role of tumor-associated macrophages in hematological malignancies. Pathol. Int. 2015, 65, 170–176. [Google Scholar] [CrossRef]
  11. Yang, M.; McKay, D.; Pollard, J.W.; Lewis, C.E. Diverse Functions of Macrophages in Different Tumor Microenvironments. Cancer Res. 2018, 78, 5492–5503. [Google Scholar] [CrossRef] [PubMed] [Green Version]
  12. Noyori, O.; Komohara, Y.; Nasser, H.; Hiyoshi, M.; Ma, C.; Pan, C.; Carreras, J.; Nakamura, N.; Sato, A.; Ando, K.; et al. Expression of IL-34 correlates with macrophage infiltration and prognosis of diffuse large B-cell lymphoma. Clin. Transl. Immunol. 2019, 8, e1074. [Google Scholar] [CrossRef] [PubMed] [Green Version]
  13. UniProt, C. UniProt: A worldwide hub of protein knowledge. Nucleic Acids Res. 2019, 47, D506–D515. [Google Scholar] [CrossRef] [Green Version]
  14. Denny, W.A.; Flanagan, J.U. Small-molecule CSF1R kinase inhibitors; review of patents 2015-present. Expert Opin. Ther. Pat. 2020, 31, 107–111. [Google Scholar] [CrossRef] [PubMed]
  15. Xun, Q.; Wang, Z.; Hu, X.; Ding, K.; Lu, X. Small-Molecule CSF1R Inhibitors as Anticancer Agents. Curr. Med. Chem. 2020, 27, 3944–3966. [Google Scholar] [CrossRef]
  16. Moskowitz, C.H.; Younes, A.; de Vos, S.; Bociek, R.G.; Gordon, L.I.; Witzig, T.E.; Gascoyne, R.D.; West, B.; Nolop, K.; Steidl, C. Abstract 1638: CSF1R Inhibition by PLX3397 in Patients with Relapsed or Refractory Hodgkin Lymphoma: Results From a Phase 2 Single Agent Clinical Trial. ASH Pulbications 2012, 120, 1638. [Google Scholar] [CrossRef]
  17. Carreras, J.; Kikuti, Y.Y.; Bea, S.; Miyaoka, M.; Hiraiwa, S.; Ikoma, H.; Nagao, R.; Tomita, S.; Martin-Garcia, D.; Salaverria, I.; et al. Clinicopathological characteristics and genomic profile of primary sinonasal tract diffuse large B cell lymphoma (DLBCL) reveals gain at 1q31 and RGS1 encoding protein; high RGS1 immunohistochemical expression associates with poor overall survival in DLBCL not otherwise specified (NOS). Histopathology 2017, 70, 595–621. [Google Scholar] [CrossRef]
  18. Carreras, J.; Lopez-Guillermo, A.; Fox, B.C.; Colomo, L.; Martinez, A.; Roncador, G.; Montserrat, E.; Campo, E.; Banham, A.H. High numbers of tumor-infiltrating FOXP3-positive regulatory T cells are associated with improved overall survival in follicular lymphoma. Blood 2006, 108, 2957–2964. [Google Scholar] [CrossRef] [PubMed]
  19. Carreras, J.; Lopez-Guillermo, A.; Kikuti, Y.Y.; Itoh, J.; Masashi, M.; Ikoma, H.; Tomita, S.; Hiraiwa, S.; Hamoudi, R.; Rosenwald, A.; et al. High TNFRSF14 and low BTLA are associated with poor prognosis in Follicular Lymphoma and in Diffuse Large B-cell Lymphoma transformation. J. Clin. Exp. Hematop. 2019, 59, 1–16. [Google Scholar] [CrossRef] [Green Version]
  20. Carreras, J.; Lopez-Guillermo, A.; Roncador, G.; Villamor, N.; Colomo, L.; Martinez, A.; Hamoudi, R.; Howat, W.J.; Montserrat, E.; Campo, E. High numbers of tumor-infiltrating programmed cell death 1-positive regulatory lymphocytes are associated with improved overall survival in follicular lymphoma. J. Clin. Oncol. 2009, 27, 1470–1476. [Google Scholar] [CrossRef] [PubMed]
  21. Carreras, J.; Yukie Kikuti, Y.; Miyaoka, M.; Hiraiwa, S.; Tomita, S.; Ikoma, H.; Kondo, Y.; Shiraiwa, S.; Ando, K.; Sato, S.; et al. Genomic Profile and Pathologic Features of Diffuse Large B-Cell Lymphoma Subtype of Methotrexate-associated Lymphoproliferative Disorder in Rheumatoid Arthritis Patients. Am. J. Surg. Pathol. 2018, 42, 936–950. [Google Scholar] [CrossRef]
  22. Ogura, G.; Kikuti, Y.Y.; Kikuchi, T.; Carreras, J.; Sato, T.; Nakamura, N. MYD88 (L265P) Mutation in Malignant Lymphoma Using Formalin-Fixed Paraffin-Embedded Section. J. Clin. Exp. Hematop. 2013, 53, 175–177. [Google Scholar] [CrossRef] [Green Version]
  23. Martin-Moreno, A.M.; Roncador, G.; Maestre, L.; Mata, E.; Jimenez, S.; Martinez-Torrecuadrada, J.L.; Reyes-Garcia, A.I.; Rubio, C.; Tomas, J.F.; Estevez, M.; et al. CSF1R Protein Expression in Reactive Lymphoid Tissues and Lymphoma: Its Relevance in Classical Hodgkin Lymphoma. PLoS ONE 2015, 10, e0125203. [Google Scholar] [CrossRef]
  24. Cardesa-Salzmann, T.M.; Colomo, L.; Gutierrez, G.; Chan, W.C.; Weisenburger, D.; Climent, F.; Gonzalez-Barca, E.; Mercadal, S.; Arenillas, L.; Serrano, S.; et al. High microvessel density determines a poor outcome in patients with diffuse large B-cell lymphoma treated with rituximab plus chemotherapy. Haematologica 2011, 96, 996–1001. [Google Scholar] [CrossRef] [Green Version]
  25. Lenz, G.; Wright, G.; Dave, S.S.; Xiao, W.; Powell, J.; Zhao, H.; Xu, W.; Tan, B.; Goldschmidt, N.; Iqbal, J.; et al. Stromal gene signatures in large-B-cell lymphomas. N Engl. J. Med. 2008, 359, 2313–2323. [Google Scholar] [CrossRef] [Green Version]
  26. Carreras, J.; Hamoudi, R.; Nakamura, N. Artificial Intelligence Analysis of Gene Expression Data Predicted the Prognosis of Patients with Diffuse Large B-Cell Lymphoma. Tokai J. Exp. Clin. Med. 2020, 45, 37–48. [Google Scholar]
  27. Carreras, J.; Kikuti, Y.Y.; Miyaoka, M.; Hiraiwa, S.; Tomita, S.; Ikoma, H.; Kondo, Y.; Ito, A.; Nakamura, N.; Hamoudi, R. Artificial Intelligence Analysis of the Gene Expression of Follicular Lymphoma Predicted the Overall Survival and Correlated with the Immune Microenvironment Response Signatures. Mach. Learn. Knowl. Extr. 2020, 2, 647–671. [Google Scholar] [CrossRef]
  28. Carreras, J.; Kikuti, Y.Y.; Miyaoka, M.; Hiraiwa, S.; Tomita, S.; Ikoma, H.; Kondo, Y.; Ito, A.; Shiraiwa, S.; Hamoudi, R.J.A. A Single Gene Expression Set Derived from Artificial Intelligence Predicted the Prognosis of Several Lymphoma Subtypes; and High Immunohistochemical Expression of TNFAIP8 Associated with Poor Prognosis in Diffuse Large B-Cell Lymphoma. AI 2020, 1, 342–360. [Google Scholar] [CrossRef]
  29. Cheson, B.D.; Pfistner, B.; Juweid, M.E.; Gascoyne, R.D.; Specht, L.; Horning, S.J.; Coiffier, B.; Fisher, R.I.; Hagenbeek, A.; Zucca, E.; et al. Revised response criteria for malignant lymphoma. J. Clin. Oncol. 2007, 25, 579–586. [Google Scholar] [CrossRef] [PubMed]
  30. Driscoll, J.J.; Rixe, O. Overall survival: Still the gold standard: Why overall survival remains the definitive end point in cancer clinical trials. Cancer J. 2009, 15, 401–405. [Google Scholar] [CrossRef] [PubMed]
  31. Feng, R.; Zhao, H.; Xu, J.; Shen, C. CD47: The next checkpoint target for cancer immunotherapy. Crit. Rev. Oncol. Hematol. 2020, 152, 103014. [Google Scholar] [CrossRef]
  32. Jalil, A.R.; Andrechak, J.C.; Discher, D.E. Macrophage checkpoint blockade: Results from initial clinical trials, binding analyses, and CD47-SIRPalpha structure-function. Antib. Ther. 2020, 3, 80–94. [Google Scholar] [CrossRef] [Green Version]
  33. Bouwstra, R.; He, Y.; de Boer, J.; Kooistra, H.; Cendrowicz, E.; Fehrmann, R.S.N.; Ammatuna, E.; Zu Eulenburg, C.; Nijland, M.; Huls, G.; et al. CD47 Expression Defines Efficacy of Rituximab with CHOP in Non-Germinal Center B-cell (Non-GCB) Diffuse Large B-cell Lymphoma Patients (DLBCL), but Not in GCB DLBCL. Cancer Immunol. Res. 2019, 7, 1663–1671. [Google Scholar] [CrossRef] [PubMed]
  34. Kazama, R.; Miyoshi, H.; Takeuchi, M.; Miyawaki, K.; Nakashima, K.; Yoshida, N.; Kawamoto, K.; Yanagida, E.; Yamada, K.; Umeno, T.; et al. Combination of CD47 and signal-regulatory protein-alpha constituting the “don’t eat me signal” is a prognostic factor in diffuse large B-cell lymphoma. Cancer Sci. 2020, 111, 2608–2619. [Google Scholar] [CrossRef] [PubMed]
  35. Edwards, V.D.; Sweeney, D.T.; Ho, H.; Eide, C.A.; Rofelty, A.; Agarwal, A.; Liu, S.Q.; Danilov, A.V.; Lee, P.; Chantry, D.; et al. Targeting of colony-stimulating factor 1 receptor (CSF1R) in the CLL microenvironment yields antineoplastic activity in primary patient samples. Oncotarget 2018, 9, 24576–24589. [Google Scholar] [CrossRef] [PubMed] [Green Version]
  36. Murga-Zamalloa, C.; Rolland, D.C.M.; Polk, A.; Wolfe, A.; Dewar, H.; Chowdhury, P.; Onder, O.; Dewar, R.; Brown, N.A.; Bailey, N.G.; et al. Colony-Stimulating Factor 1 Receptor (CSF1R) Activates AKT/mTOR Signaling and Promotes T-Cell Lymphoma Viability. Clin. Cancer Res. 2020, 26, 690–703. [Google Scholar] [CrossRef] [PubMed] [Green Version]
  37. Polk, A.; Lu, Y.; Wang, T.; Seymour, E.; Bailey, N.G.; Singer, J.W.; Boonstra, P.S.; Lim, M.S.; Malek, S.; Wilcox, R.A. Colony-Stimulating Factor-1 Receptor Is Required for Nurse-like Cell Survival in Chronic Lymphocytic Leukemia. Clin. Cancer Res. 2016, 22, 6118–6128. [Google Scholar] [CrossRef] [Green Version]
  38. Wilcox, R.A. A three-signal model of T-cell lymphoma pathogenesis. Am. J. Hematol. 2016, 91, 113–122. [Google Scholar] [CrossRef] [Green Version]
  39. Uhlen, M.; Zhang, C.; Lee, S.; Sjostedt, E.; Fagerberg, L.; Bidkhori, G.; Benfeitas, R.; Arif, M.; Liu, Z.; Edfors, F.; et al. A pathology atlas of the human cancer transcriptome. Science 2017, 357, eaan2507. [Google Scholar] [CrossRef] [Green Version]
  40. Nagy, A.; Lanczky, A.; Menyhart, O.; Gyorffy, B. Validation of miRNA prognostic power in hepatocellular carcinoma using expression data of independent datasets. Sci. Rep. 2018, 8, 9227. [Google Scholar] [CrossRef]
  41. Cannarile, M.A.; Weisser, M.; Jacob, W.; Jegg, A.M.; Ries, C.H.; Ruttinger, D. Colony-stimulating factor 1 receptor (CSF1R) inhibitors in cancer therapy. J. Immunother. Cancer 2017, 5, 53. [Google Scholar] [CrossRef]
  42. Shen, L.; Li, H.; Shi, Y.; Wang, D.; Gong, J.; Xun, J.; Zhou, S.; Xiang, R.; Tan, X. M2 tumour-associated macrophages contribute to tumour progression via legumain remodelling the extracellular matrix in diffuse large B cell lymphoma. Sci. Rep. 2016, 6, 30347. [Google Scholar] [CrossRef]
  43. Wu, Z.L.; Song, Y.Q.; Shi, Y.F.; Zhu, J. High nuclear expression of STAT3 is associated with unfavorable prognosis in diffuse large B-cell lymphoma. J. Hematol. Oncol. 2011, 4, 31. [Google Scholar] [CrossRef] [PubMed] [Green Version]
  44. Hu, L.Y.; Xu, X.L.; Rao, H.L.; Chen, J.; Lai, R.C.; Huang, H.Q.; Jiang, W.Q.; Lin, T.Y.; Xia, Z.J.; Cai, Q.Q. Expression and clinical value of programmed cell death-ligand 1 (PD-L1) in diffuse large B cell lymphoma: A retrospective study. Chin. J. Cancer 2017, 36, 94. [Google Scholar] [CrossRef] [PubMed]
  45. Carreras, J.; Kikuti, Y.Y.; Miyaoka, M.; Hiraiwa, S.; Tomita, S.; Ikoma, H.; Kondo, Y.; Ito, A.; Nakamura, N.; Hamoudi, R. Combination of Multilayer Perceptron, Radial Basis Function Artificial Neural Networks and Machine Learning Image Segmentation for the Dimension Reduction and the Prognosis Assessment of Diffuse Large B-Cell Lymphoma. AI 2021, 2, 106–134. [Google Scholar] [CrossRef]
Figure 1. Immunohistochemical expression of CSF1R in reactive tonsils. The CSF1R expression was characteristic of macrophages. Their distribution was mainly interfollicular. In the germinal centers, a weak expression could be found in the tangible body macrophages. The B-lymphocytes were negative for CSF1R.
Hemato 02 00011 g001
Figure 2. Quantification of Macrophage colony-stimulating factor 1 receptor (CSF1R) in the samples of Tokai University. In diffuse large B-cell lymphoma (DLBCL), the CSF1R expression was characteristic of tumor-associated macrophages (TAMs). In addition, a CSF1R-positive B-cells pattern was also found.
Hemato 02 00011 g002
Figure 3. Correlation between CSF1R protein levels and survival of the patients (Tokai series). A correlation with the progression-free survival was found according to the CSF1R expression. Correlation between the CSF1R protein levels and the progression-free survival according to the cell-of-origin molecular classification (Hans‘ classifier) was also performed. Despite that, the curves are separated. No statistically significant correlation with the progression-free survival was found. OS, overall survival; PFS, progression-free survival; GCB, germinal center B-cell-like.
Hemato 02 00011 g003
Figure 4. Prediction of the immunohistochemical expression of CSF1R in each of the histological expression groups by a set of 10 markers using Artificial Neural Network (Tokai series). In each of the CSF1R histological expression groups, the expression of CSF1R could be predicted by modeling using a multilayer perceptron analysis. According to their importance, the markers are ranked as the most important in the model on the top, MYC proto-oncogene and IKAROS (DNA-binding protein Ikaros), and less important on the bottom (PD-L1, Programmed cell death 1 ligand 1). In order to understand how the different markers interact between them, a protein-protein interaction analysis was also perfomed, using a basic (left) or an extended network (right).
Hemato 02 00011 g004
Figure 5. Immunohistochemical expression of CSF1R and some of the CSF1R-related markers.
Hemato 02 00011 g005
Figure 6. Identification of the genes associated with CSF1R expression levels (LLMPP data, all genes set). The use of artificial intelligence analysis, based on the multilayer perceptron analysis allowed to predict the genes associated with the CSF1R expression (high vs. Low). The 20,683 genes of the array were ranked according to their normalized importance for predicting the CSF1R expression. The neural network performance was good, with an area under the curve of 0.92. CSF1R High, red color. CSF1R Low, blue color.
Hemato 02 00011 g006
Figure 7. Multilayer perceptron between the top 10 genes and CSF1R expression levels (LLMPP data, all genes set). This figure shows the neural network diagram for the top 10 most relevant genes that predict the CSF1R expression.
Hemato 02 00011 g007
Figure 8. Identification of the genes of the cancer panel associated with CSF1R expression levels (LLMPP data). The multilayer perceptron neural network analysis was also performed using an immuno-oncology cancer panel of 1790 genes. In this analysis, the Receiver Operating Characteristic (ROC) area under the curve was 0.99. Therefore, these genes are highly associated and are capable of predicting the CSF1R expression with high accuracy.
Hemato 02 00011 g008
Figure 9. Multilayer perceptron between the top 10 genes of the cancer panel and CSF1R expression levels (LLMPP data). This figure shows the neural network diagram for the top 10 most relevant genes of the immuno-oncology cancer panel that predict the CSF1R expression.
Hemato 02 00011 g009
Figure 10. Gene expression analysis with CD47 and SIRPA in the LLMPP DLBCL series. The series of DLBCL of the LLMPP was used to analyze the gene expression of CD47 and SIRPA, and to correlate with CSF1R. In this analysis, only the cases treated with R-CHOP were selected (n = 233). These two markers belong to the immune checkpoint pathway, and mediate a negative regulation of phagocytosis. In DLBCL, CD47 is expressed by the B-lymphocytes and SIRPA is expressed by the tumor-associated macrphages (TAMs) [31,32,33,34]. We found that high CD47 expression was associated with a poor overall survival of the DLBCL patients. Conversely, high SIRPA is associated with a favorable overall survival. Of note, these two markers inversely correlated between them. When correlated with CSF1R, SIRPA positively correlated with CSF1R, and inversely with CD47. CSF1R moderately correlated with CD163 as well. Finally, the expression of both CD47 and SIRPA were predicted using a multilayer perceptron artificial neural network and the transcriptome atlas cancer panel set as predictive variables. A simplified visualization of the neural network with this top 20 genes is shown. This model predicted the two genes with high efficiency as shown in the ROC curve, with an area under the curves of 0.91. The top 20 most relevant genes are shown in the normalized importance figure. ROC, Receiver Operating Characteristic; R-CHOP, Rituximab, cyclophosphamide, doxorubicin, vincristine, and prednisone.
Hemato 02 00011 g010
Table 1. Clinicopathological characteristics of the DLBCL series of the Tokai University Hospital (Japan).
Variables and FrequenciesUnivariate Cox Overall Survival Analysis
VariableNum.%p-ValueHazard Risk95.0% CI for HR
LowerUpper
Sex Male114/19857.60.9771.00.71.5
Age > 60141/19871.20.0022.31.44.0
LDH high (>219)123/19563.10.0000083.41.95.7
sIL2R high (>530)155/18683.30.0015.21.914.2
ECOG Performance Status ≥ 226/14318.20.0000343.31.95.7
Clinical stage III or IV85/18246.70.0031.91.33.1
Extranodal disease site > 138/12630.20.0000033.72.16.4
B symptoms39/15924.50.0371.71.02.9
IPI
Low risk56/16334.4Reference---
Low-intermediate risk49/16330.10.0042.91.45.9
High-intermediate risk31/16319.00.0000225.12.410.8
High risk27/16316.60.0000185.52.511.8
Location
Nodal (+spleen)85/19842.9Reference---
Waldeyer’s ring25/19812.60.2770.70.31.4
Gastrointestinal25/19812.60.0740.50.21.1
Other extranodal63/19831.80.4491.20.81.9
Treatment
R-CHOP138/18574.6Reference---
R-CHOP-like39/18521.10.0441.71.02.7
Others8/1854.30.0422.61.06.5
Response to treatment
CR131/17475.3Reference---
PR + PD + SD + NC43/17424.71.5 × 10−167.54.612.1
Immune phenotype
CD3 positive0/1950----
CD5 positive31/19416.00.7831.10.61.9
CD20 positive193/19798.0----
CD10 positive59/19530.30.010.50.30.9
MUM1 (IRF4) positive145/19574.40.0271.81.13.1
BCL2 positive145/19574.40.0004403.01.65.6
BCL6 positive134/19568.70.6120.90.61.4
Ki67 high (>44%)23/11719.70.0012.61.54.7
MYC high (>22%)62/11960.10.2451.40.82.3
Cell-of-origin Molecular Subtype
Germinal center B-cell (GCB)69/19435.6Reference---
Non-GCB125/19464.40.0032.11.33.4
Epstein-Barr virus, (EBER) positive17/1908.90.0072.51.34.8
RGS1 high83/16650.00.0391.71.02.7
BCL2 split positive (FISH)13/12210.70.8790.90.42.2
MYC split positive (FISH)18/12914.00.7761.10.62.3
BCL2 MYC double hit (FISH)2/1201.7----
MYD88 L265P mutation12/1219.90.9151.00.52.3
CI, confidence interval; HR, hazard risk; LDH, lactate dehydrogenase; IPI, International Prognostic Index; R-CHOP, rituximab, cyclophosphamide, doxorubicin hydrochloride, vincristine, and prednisolone; CR, complete response; PR, partial response; PD, progressive disease; SD, stable disease, NC, no change.
Table 2. Clinicopathological characteristics of the diffuse large B-cell lymphoma (DLBCL) series of the GEO GSE10846 dataset of the lymphoma/leukemia molecular profiling project (LLMPP).
Variables and FrequenciesUnivariate Cox Overall Survival Analysis
VariableNum.%p-ValueHazard Risk95.0% CI for HR
LowerUpper
Sex Male224/41454.60.91.00.71.4
Age > 60226/41454.60.0000022.21.63.1
LDH ratio > 1182/35151.95.1 × 10−82.71.93.9
LDH ratio > 332/3519.12.9 × 10−83.72.35.8
ECOG Performance Status ≥ 293/38923.93.1 × 10−102.82.13.9
Clinical stage III or IV218/40653.70.0002451.81.32.5
Extranodal disease site > 130/3837.80.0137021.91.13.3
NCCN IPI
Low risk54/32116.85.2 × 10−8---
Low-intermediate risk152/32147.40.00045.22.113.0
High-intermediate risk98/32130.50.0000048.73.521.9
High risk17/3215.36.9 × 10−817.86.250.5
Cell-of-origin molecular subtype
Germinal center B-cell (GCB)183/41444.22.8 × 10−8---
Activated B-cell (ABC)167/41440.31.1 × 10−82.81.93.9
Unclassified64/41415.50.21.40.82.3
Treatment
RCHOP-like233/41456.30.000080.50.40.7
CHOP-like181/41443.7----
Note: The GSE10846 dataset represents previously published data of the LLMPP [24,25], which is not the authors’ own work. This dataset is publicly available as the Gene Expression Omnibus data repository of the National Center for Biotechnology Information (NCBI). NCCN, National Comprehensive Cancer Network.
Table 3. Correlation between the histological patterns of CSF1R and the clinical characteristics of the patients (Tokai series).
VariableCSF1R + TAMs PatternCSF1R + B-Cells Patternp-Value
Sex Male90/162 (56%)24/36 (67%)0.265
Age > 60115/162 (71%)26/36 (72%)1.000
LDH high (>219)101/159 (64%)22/36 (61%)0.849
sIL2R high (>530)125/152 (82%)30/34 (88%)0.610
ECOG Performance Status ≥ 223/121 (19%)3/22 (14%)0.766
Clinical stage III or IV69/150 (46%)16/32 (50%)0.701
Extranodal disease site > 133/105 (31.4%)5/21 (24%)0.607
B symptoms30/133 (22.6%)9/26 (35%)0.215
IPI High/High-intermediate49/135 (36%)9/28 (32%)0.829
Location, extranodal73/162 (45%)15/36 (41%)0.333
Dead outcome76/162 (47%)12/36 (33%)0.194
Disease progression66/151 (43.7%)7/32 (21.9%)0.028
LDH, lactate dehydrogenase; ECOG, Eastern Cooperative Oncology Group; IPI, International Prognostic Index.
Table 4. Correlation between the histological patterns of CSF1R and the pathological characteristics of the samples (Tokai series).
VariableCSF1R + TAMs PatternCSF1R + B-Cells Patternp Value
CD5 positive28/161 (17%)3/33 (9.1%)0.304
CD10 positive50/162 (31%)9/33 (27%)0.836
MUM1 positive121/161 (75%)24/34 (71%)0.666
BCL2 positive121/161 (75%)24/34 (71%)0.666
BCL6 positive114/161 (71%)20/34 (59%)0.221
Ki67 high (>44%)20/97 (21%)3/20 (15%)0.760
MYC high (>10%)18/75 (24%)1/23 (4%)0.038
Non-GCB (Hans)103/161 (64%)22/33 (67%)0.844
EBER+11/157 (7%)6/33 (18.2%)0.085
RGS1 high63/134 (47%)20/32 (63%)0.168
MDM2 high57/71 (80.3%)22/23 (96%)0.051
BCL2 split positive (FISH)13/102 (13%)0/20 (0%)0.026
MYC split positive (FISH)15/108 (14%)3/21 (14%)1.000
BCL2 MYC double hit (FISH)2/100 (2%)0/20 (0%)1.000
MYD88 L265P mutation12/100 (12%)0/21 (0%)0.028
TAMs, tumor-associated macrophages; MYC, Myc proto-oncogene protein.
Table 5. Correlation between the histological patterns of CSF1R and the markers of the CSF1R-pathway of the samples (Tokai series).
VariableCSF1R + TAMs PatternCSF1R + B-Cells Patternp Value
CSF1 high50/101 (50%)7/22 (32%)0.160
STAT3 high29/102 (28%)8/22 (36%)0.453
NFKB1 high46/92 (50%)12/21 (57%)0.632
Ki67 high20/97 (21%)3/20 (15%)0.760
MYC high18/75 (24%)1/23 (4%)0.038
PD-L1 high23/84 (27%)8/23 (35%)0.604
TNFAIP8 high55/73 (75.3%)19/23 (82.6%)0.577
IKAROS high21/73 (29%)2/22 (9.1%)0.042
IKAROS, DNA-binding protein Ikaros (IKZF1).
Table 6. Correlation between CSF1R and the markers of the CSF1R-pathway for each of the histological pattern (Tokai series).
MarkerCSF1R + TAMs PatternCSF1R + B-Cells Pattern
n = 162n = 36
Coefficientp ValueCoefficientp Value
CSF10.0150.8850.2920.187
STAT30.2000.044−0.1510.502
NFKB10.1050.320−0.2520.271
Ki670.0170.866−0.1960.394
MYC−0.1000.312−0.0780.728
PD-L10.1320.2300.0890.687
TNFAIP80.2260.054−0.4940.017
IKAROS0.1970.099−0.2240.303
CD1630.1710.032−0.2910.051
CD680.2120.0270.0470.836
Table 7. Correlation between the gene expression of the top genes of the multilayer perceptron (MLP) with CSF1R (high vs. low).
MLP NIGeneBSEWalddfp ValueOdds Ratio95% CI for OR
LowerUpper
0.83CD99P10.6780.2268.96910.0032.01.33.1
0.75MVB12A0.5810.2624.90710.0271.81.13.0
0.72PRH1−0.7680.18616.98710.0000380.50.30.7
0.72C2orf74−0.610.2237.50510.0060.50.40.8
0.71IKZF10.5140.2494.24310.0391.71.02.7
0.71CEBPD1.5130.20156.39715.92 × 10−144.53.16.7
Multivariate binary logistic regression (backward conditional). MLP, multilayer perceptron; NI, normalized importance; B, beta; SE, standard error; df, degrees of freedom; CI, confidence interval; OS, Odds Ratio.
Table 8. Correlation between the gene expression of the top cancer panel genes of the multilayer perceptron (MLP) with CSF1R (high vs. low).
MLP NIGeneBSEWalddfp ValueOdds Ratio95% CI for OR
LowerUpper
0.83PIN1−0.9290.347.44310.0060.40.20.8
0.79TXN2−0.9520.415.40210.020.40.20.9
0.79IL5RA−0.3340.1753.65910.0560.70.51.0
0.77SPINK1−0.2330.1084.6310.0310.80.61.0
0.77FOLH1−0.640.2526.44810.0110.50.30.9
0.77PLA2G4C0.6220.2386.8210.0091.91.23.0
0.76KRAS−0.8610.3755.28610.0210.40.20.9
0.75RIN10.8860.3257.45410.0062.41.34.6
0.75NFATC20.6560.2447.21110.0071.91.23.1
0.75HSPB11.1810.22228.311.04 × 10−73.32.15.0
0.74ITGA6−0.3510.1773.92210.0480.70.51.0
0.71PRKCE−0.3750.1764.55610.0330.70.51.0
0.70TAF3−1.120.31112.94610.0003210.30.20.6
Multivariate binary logistic regression (backward conditional). NI, normalized importance.
Publisher’s Note: MDPI stays neutral with regard to jurisdictional claims in published maps and institutional affiliations.

