
The Effect of BCR-ABL Specific Tyrosine Kinase Inhibitors on the Thioredoxin System in Chronic Myeloid Leukemia


1
School of Environment and Science, Griffith University, Nathan, QLD 4111, Australia
2
Griffith Institute for Drug Discovery, Griffith University, Nathan, QLD 4111, Australia
*
Authors to whom correspondence should be addressed.
Hemato 2021, 2(2), 237-254; https://0-doi-org.brum.beds.ac.uk/10.3390/hemato2020014
Submission received: 4 March 2021
/
Revised: 8 April 2021
/
Accepted: 30 April 2021
/
Published: 4 May 2021
(This article belongs to the Section Chronic Myeloid Disease)
Abstract
:Chronic myeloid leukemia (CML) is a myeloproliferative disorder that is caused by the formation of a fusion onco-protein, BCR-ABL. Since BCR-ABL plays a role in the progression of CML, the most common treatments of CML are tyrosine kinase inhibitors (TKIs) that specifically target BCR-ABL. However, resistance to TKIs is a major problem in CML treatment. A promising target in overcoming drug resistance in other cancers is the thioredoxin (TRX) system, an antioxidant system that maintains cellular redox homeostasis. The TRX system is upregulated in many cancers and this is associated with a poor prognosis. Analysis of a patient database showed that the expression of the TRX system was upregulated in CML patients compared to healthy donors. Our experiments revealed a significant link between the TRX and BCR-ABL systems since inhibition of BCR-ABL with chemical inhibitors and siRNA resulted in a decrease in the activity and expression of the TRX system in CML cells. This is notable as it shows that the TRX system may be a viable target in the treatment of CML.
1. Introduction
Chronic myeloid leukemia (CML) is a cancer of myeloid cells that is caused by a reciprocal chromosomal translocation between chromosomes 9 and 22. This mutation results in the formation of BCR-ABL, which is a constitutively active non-receptor tyrosine kinase. BCR-ABL is responsible for the majority of the clinical manifestations of CML. This is because BCR-ABL activates various cell survival pathways, including the JAK/STAT, AKT and PKC pathways, which induce downstream signaling that leads to increased cell proliferation and survival and lower levels of apoptosis [1,2,3]. Due to the intimate involvement of BCR-ABL in the progression of CML, most treatments are BCR-ABL specific inhibitors; despite being initially very effective, TKI resistance almost inevitably occurs. In fact, it has been hypothesized that more than 20% of CML patients will become unresponsive to imatinib, the gold standard CML treatment, during the course of their treatment [4]. Since most CML treatments are BCR-ABL specific, this results in high levels of acquired drug resistance, due primarily to mutations within BCR-ABL [5,6,7].
To overcome imatinib resistance, second and third generation TKIs have been developed. One commonly used second generation TKI is dasatinib, which is a pan tyrosine kinase inhibitor, and is very potent but also is known to have more severe side effects than imatinib [8,9]. Ponatinib is a third generation TKI and was specifically developed to overcome resistance due to some specific BCR-ABL mutations; however, it also has severe side effects, and cannot be taken by patients that have pre-existing heart conditions [10]. Imatinib, ponatinib and dasatinib all target the kinase domain of BCR-ABL, and thus are usually all susceptible to the same forms of acquired drug resistance. However, more modern BCR-ABL inhibitors target different regions of the protein, such as the myristoylation site, in the case of GNF-5 [11]. While this reduces instances of BCR-ABL-dependent drug resistance, due to the highly mutagenic nature of the protein, BCR-ABL-independent treatments should also be established.
A new approach to overcome drug resistance in cancer that is currently being evaluated is to target the thioredoxin (TRX) system [12]. The TRX system is made up of TRX, thioredoxin reductase (TRXR) and NADPH. This system is responsible for maintaining redox homeostasis in the cell, as the TRX protein functions as a reducing agent. Under periods of oxidative stress, the expression and thus activity of the TRX system is upregulated to counteract the imbalance in ROS levels. The transcription of the TRX system genes is controlled by the transcription factor, NRF2, which is also activated in cells undergoing oxidative stress. NRF2 activity is also influenced by PKC. PKC phosphorylates a serine residue within the Neh2 domain of NRF2, which disassociates the KEAP1/CUL3 complex from NRF2, and this activates the protein [13]. The TRX system is also regulated by thioredoxin interacting protein (TXNIP), which inhibits the activity of TRX via two main mechanisms. Firstly, TXNIP is able to directly bind to the active site of TRX and prevent it from functioning [14]. TXNIP is also able to inhibit the TRX system by increasing glucose levels in the cell, which has been shown to reduce the activity of TRXR [15].
The TRX system is closely linked with drug resistance in cancer because it is upregulated in many cancers, and this is associated with a poor prognosis [16,17]. This is caused by the TRX system maintaining redox homeostasis as well as activating various cell survival and anti-apoptosis pathways, including the ASK1 and NK-κB pathways [18,19,20,21]. Therefore, the TRX system is also a promising target and is the focus for developing many new cancer therapies [22]. One particularly notable example is the TRXR inhibitor, auranofin, which is an FDA approved drug [23,24]. This study aims to determine if there is a link between the activity of BCR-ABL and the expression of the TRX system.
2. Materials and Methods
2.1. Cell Lines and Reagents
K562, KU812 and KCL22 CML cell lines were used in this project [25,26,27] and were originally isolated from patients in blast crisis. The K562 cells (ATCC® Number: CRL-3343) were a gift from Dr. Chris Slape (Translational Research Institute, QLD, Australia), and the KU812 (cat. no 90071807) and KCL22 (cat. no JCRB1317) cell lines were purchased from Cell Bank Australia (Sydney, NSW, Australia). Cell lines were cultured in RPMI-1640 media (Gibco, Gaithersburg, MD, USA) containing 10% fetal bovine serum (FBS) of French origin (Bovagen, Melbourne, Australia), 200 mM L-glutamate, and 100 U/mL penicillin and 100 μg/mL streptomycin (Gibco, Gaithersburg, MD, USA). Both cell lines were authenticated by the Griffith University DNA sequencing facility using the STR profiling method (GenePrint 10 system, Promega, Madison, WI, USA). All oligonucleotides used in RT-qPCR were obtained from Integrated DNA Technologies (IDT, Singapore, Singapore). The β-Tubulin polyclonal antibody (cat no. ab6046) was purchased from Abcam (Cambridge, UK). The vinculin antibody (cat no. 13901) was purchased from Cell Signalling Technology (Davers, MA, USA). All other antibodies were purchased from Santa Cruz Biotechnology (Santa Cruz, CA, USA) (C-ABL, sc-23; TRXR1, sc-58444). Imatinib (cat. no 220127-57-1), dasatinib (cat. no 302962-49-8), ponatinib (cat. no 943319-70-8) and GNF-5 (cat. no 778277-15-9) were purchased from Cayman Chemicals (Ann Arbor, MI, USA) All TKIs were prepared in 100% DMSO at a concentration of 10 mM and were diluted in 1× phosphate buffered saline (PBS). All other chemicals were purchased from Sigma-Aldrich (Sydney, NSW, Australia) unless otherwise stated.
2.2. Cell Viability Assay
Cell viability was measured using the Trypan Blue exclusion method, as detailed by Raninga et al. [28]. Briefly, 10 µL of cell culture was mixed with 10 µL of 0.4% Trypan Blue solution. Viable cells were then counted using the Neubauer hemocytometer and an inverted light microscope. The viability of siRNA-transfected cells is presented as a percentage of the number of viable untransfected cells.
2.3. Transient Transfections
K562 cells (2 × 10⁶) were collected and resuspended in pre-transfection media (RPMI-1640 media without FBS or antibiotics) and 100 µL was transferred into transfection cuvettes. Then, 50 nM of BCR-ABL1 siRNA molecules or control siRNA (IDT, Singapore, Singapore) were added to separate cuvettes and incubated for 5 min at room temperature. Cells were transfected using the Amaxa Nucleofector (T-016 program) (Lonza, Basel, Switzerland) and then left to incubate for a further 5 min at room temperature. Cells were then transferred to a 24-well plate in post-transfection media (RPMI-1640 media with 10% FBS and no antibiotics) and incubated for 5 days prior to further testing.
2.4. MTT Cell Proliferation Assay
MTT proliferation assays were performed using the K562, KU812 and KCL22 cell lines treated with either imatinib, dasatinib, ponatinib or GNF-5 for 24 and 48 h. MTT cell proliferation assays were then performed as previously described [12].
2.5. Caspase-3 Activity Assay
Caspase-3 activity was measured using the protocol described by Cox et al. [29]. K562, KU812 and KCL22 cells were transferred to a 24-well plate (1 × 10⁶ cells/well) and treated with TKIs. The plate was then incubated for 24 h at 37 °C and then cells were washed with 1× PBS once and resuspended in 15 μL of 1× PBS. This cell suspension was then transferred to a black-walled, clear-bottomed 96-well plate and 85 μL of caspase-3 buffer (5 mM DTT; 100 mM HEPES, pH 7.5; 10% (w/v) Sucrose; 0.1% Nonidet P-40; 50 μM Ac-DEVD-AMC (Cayman Chemicals, Ann Arbor, MI, USA) was added. The plate was then immediately shaken for 1 min in the FLUOstar Omega plate reader (BMG Labtech, Ortenberg, Germany) and then incubated in this plate reader for 15 min at 37 °C. Fluorescence was measured at Ex370/Em445.
2.6. Thioredoxin Reductase Activity Assay
K562, KU812 and KCL22 CML cells were seeded into 6-well plates (1.5 × 10⁶ cells/well) and were treated with TKIs for 72 h. Following this, cells were lysed in cell lysis buffer (150 mM NaCl, 50 mM Tris-Cl, pH 8; 0.5% Nonidet P-40, 0.5 mM EDTA, 2 mM PMSF, 1 μL/mL protease inhibitor cocktail VI (Astral Scientific, Sydney, NSW, Australia)) as described by Sze et al. [30]. TRXR activity was then measured as described previously [30,31,32]. Units of TRXR activity were calculated using the extinction coefficient of TNB (the reduced form of DTNB) at 412 nm (13.6 × 10³ M−1cm−1). The specific TRXR activity (U/mg protein) was calculated by normalizing the units of TRXR activity with the quantity of protein in each sample (as determined using the BioRad DC protein assay reagent (BioRad, Hercules, CA, USA) as per the manufacturer’s instructions).
2.7. ROS Levels
Intracellular ROS levels were measured using a H2DCFDA-based assay, as detailed by Rushworth et al. [33]. CML cells were transferred to a 24-well plate (1 × 10⁶ cells/well) and treated with TKIs for 24, 48 or 72 h. After this time, 5 µM of H2DCFDA was added to each well and the plate was incubated in the dark at 37 °C for a further 30 min. Cells were then washed with 1× PBS and resuspended in 200 µL of 1× PBS. Then, 100 µL of the suspension was added to a black-walled 96-well plate in duplicate. The fluorescence was read at Em495/Ex515 in the FLUOstar Omega plate reader (BMG Labtech, Ortenberg, Germany). The total cellular ROS level was calculated relative to the cell number in each well. Cell number was calculated using the Trypan Blue cell viability method (2.2).
2.8. Reverse Transcriptase Quantitative PCR (RT-qPCR)
CML cells were seeded into a 24-well plate (0.5 × 10⁶ cells/well) and treated for 24 h. Following this time, RNA was extracted using TriSure (Bioline, Sydney, NSW, Australia) according to the manufacturer’s instructions. Then, cDNA was prepared (500 ng/sample) using the GoScript cDNA synthesis kit following the manufacturer’s instructions (Promega, Madison, WI, USA). RT-qPCR was performed using approximately 150 ng of cDNA, 200 nM of forward and reverse primers and 4.5 µL of the SensiFAST SYBR mix (Bioline, Sydney, NSW, Australia) and made up to 10 µL with PCR grade water. RT-qPCR reactions were run on the CFX96 Touch Real-Time PCR Detection System (BioRad, Hercules, CA, USA) using the following cycling parameters: 95 °C for 2 min and 40 cycles of 95 °C for 10 s, 60 °C for 15 s and 72 °C for 20 s. The primers used were: RPL32 forward: 5′ CAG GGT TCG TAG AAG ATT CAA GGG, RPL32 reverse: 5′ CTT GGA GGA AAA CAT TGT GAG CGA TC; NRF2 forward: 5′ ATT CAG CCA GCC CAG CAC, NRF2 reverse: 5′ CGA AGA AAC CTC ATT GTC ATC; TRX1 forward: 5′ GCC AGT TTA TAA AGG GAG AGA GCA, TRX1 reverse: 5′ TGA TCA TTT TGC AAG GCC CA; TRXR1 forward: 5′ GGA ATC CAC CCT GTC TCT GC, TRXR1 reverse: 5′ ACG AGC CAG TGG TTT GCA GT; TXNIP forward: 5′ GGC ACC TGT GTC TGC TAA AA, TXNIP reverse: 5′ CGG GAA CAT GTA TTC TCA AA; BCR-ABL1 forward: 5′ CAT TCC GCT GAC CAT CAA TAA G, BCR-ABL1 reverse: 5′ GAT GCT ACT GGC CGC TGA AG. Results were analyzed using the ΔΔCq method, and samples were normalized against the housekeeping gene RPL32.
2.9. Western Blotting
Western blotting was performed as described by Karlenius et al. [34]. Cells were seeded into a 6-well plate (1.5 × 10⁶ cells/well) and incubated with or without TKIs for 72 h. Whole cell lysates were prepared using the NP-40 lysis buffer as described in Section 2.6. Then, 80 µg of cell lysate was loaded and run on SDS polyacrylamide gels of an appropriate percentage for each protein: 8% (BCR-ABL), 15% (TRX1) or 10% (TRXR1). Proteins on the gel were then transferred to a PVDF membrane using the Bio-Rad TransBlot Turbo apparatus, as per the manufacturer’s instructions. Blots were blocked in 5% blotto and incubated overnight with the relevant primary antibody at 4 °C. Blots were then incubated in the corresponding horseradish peroxidase (HRP) conjugated secondary antibody (BioRad, Hercules, CA, USA) for two hours at room temperature. Blots were imaged using the GE healthcare enhanced chemiluminescence (ECL) detection kit with the FujiFilm LAS300 (FujiFilm, Minato City, Tokyo, Japan). Densitometry analysis was performed using Image Gauge software (FujiFilm, Minato City, Tokyo, Japan).
2.10. Bioinformatics
Array data were acquired from the GEO database. The GSE100026 dataset [35] was used for this study. This dataset utilized the Illumina NextSeq 500 platform. There were three sample groups in this dataset: healthy donors, chronic phase CML patients and blast crisis CML patients. The mRNA expression levels for TRX1 and TXNIP were determined and the fold change between the healthy donors and the two groups of CML patients. Results were graphed using GraphPad Prism 8.
2.11. Statistical Analysis
All data in this paper were analyzed using the GraphPad Prism 8 software. A p value < 0.05 using the appropriate statistical test was considered significant. All graphs are displayed as mean ± SEM.
3. Results
3.1. The TRX System Is Upregulated in Chronic Myeloid Leukemia
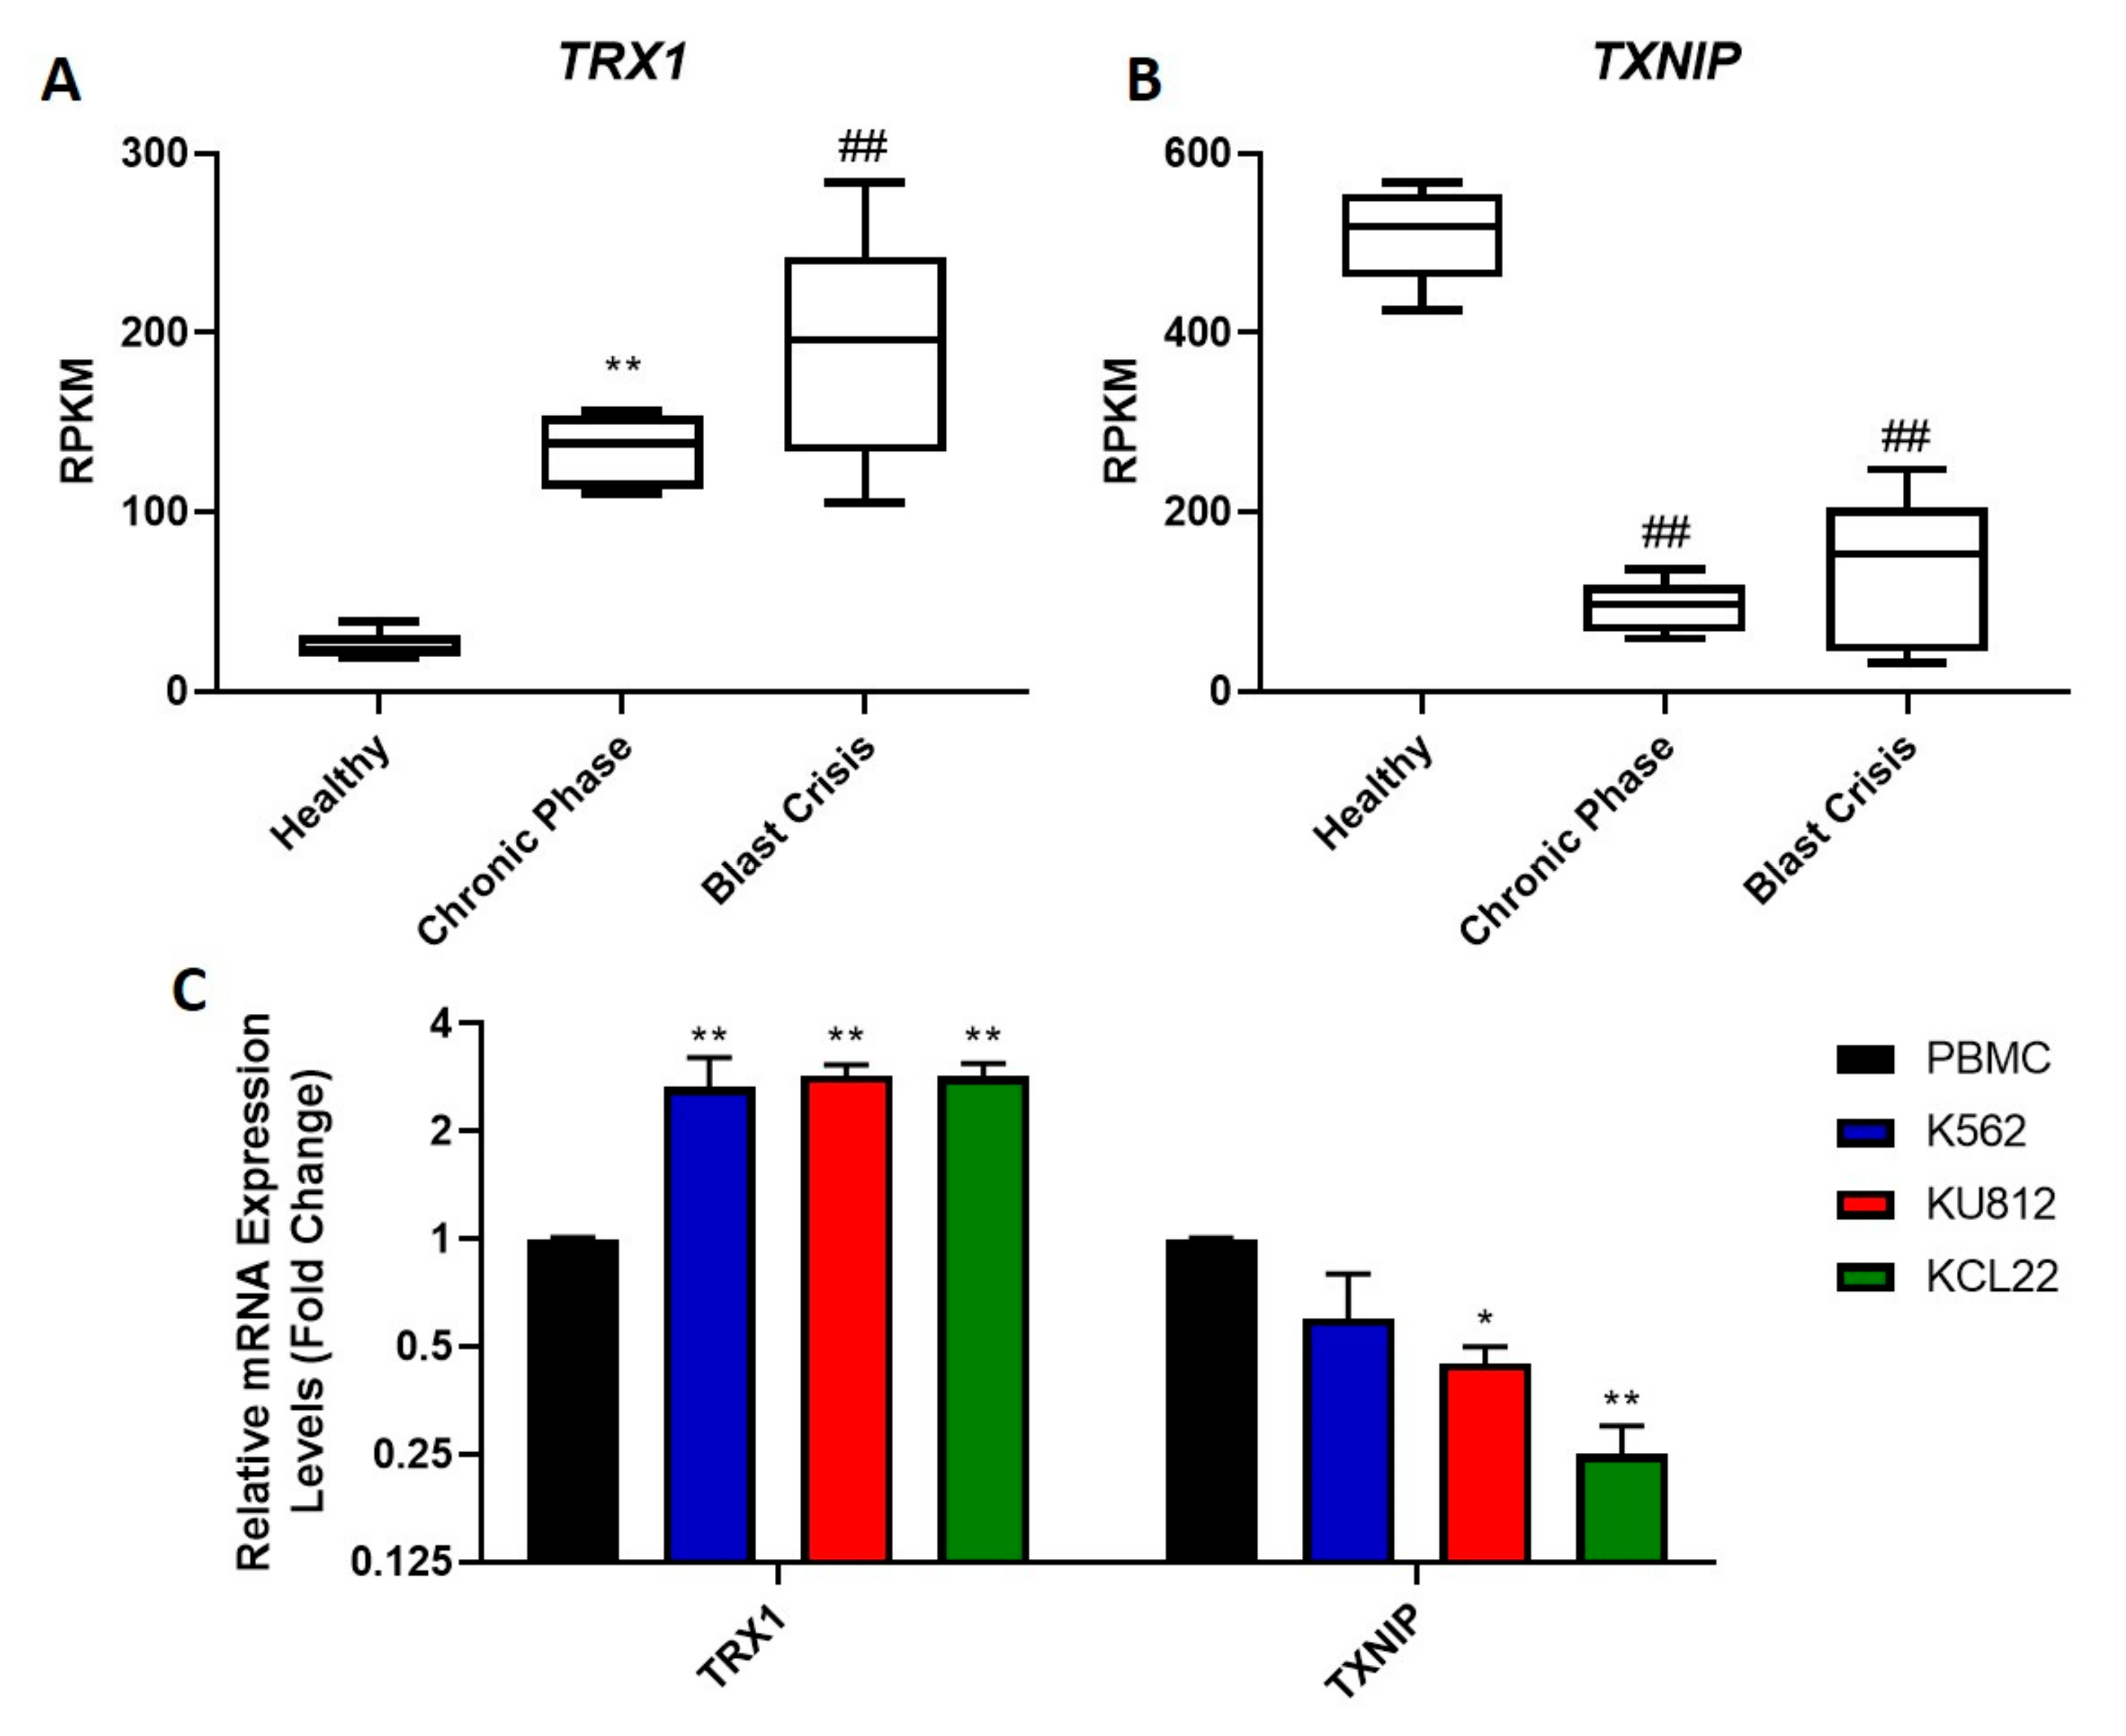
The upregulation of the TRX system in various cancers has been linked to drug resistance and a poor prognosis [17,36]. Therefore, we examined whether this system is also upregulated in CML, as no such studies have been performed previously. RNAseq was used to examine levels of the TRX system in CML cells compared to healthy cells. A database (GSE100026) that displayed the gene expression profile of CML patients in the chronic and blast crisis phases of the disease, as well as that of healthy donors was analyzed in this study. The expression levels of TRX1 (Figure 1A) and TXNIP (Figure 1B) were analyzed. It was found that the expression levels of TRX1 were significantly higher in both chronic phase and blast crisis CML patients compared to the healthy donors. It was also observed that the expression levels of TRX1 in blast crisis patients were significantly higher than that of chronic phase patients. The expression of TXNIP was observed to be the inverse of TRX1; there was significantly less TXNIP in patients with chronic phase and blast crisis CML compared to the healthy donors. Levels of TXNIP expression were similar between the chronic phase and blast crisis patients.
To confirm these results in our in vitro cell model systems, RT-qPCR was used to assess TRX1 and TXNIP mRNA expression levels in CML cells and peripheral blood mononuclear cells (PBMCs) isolated from healthy individuals (Figure 1C). The mRNA levels of TRX1 in the three CML cell lines were significantly higher than levels of TRX1 expression in healthy PBMCs. The TRX1 mRNA expression levels showed a consistent three-fold increase in all three CML cell lines tested, compared to the PBMCs. The mRNA expression of the TRX inhibitor, TXNIP, was observed to be decreased in all three CML cell lines compared to the PBMCs, although the decrease in the K562 cell line was not statistically significant. For the KU812 and KCL22 cell lines, there was a two-fold and four-fold decrease in TXNIP mRNA levels, respectively, compared to the PBMCs. Overall, the RNAseq data corresponded to the RT-qPCR data, as TRX1 mRNA levels were increased and TXNIP mRNA levels were decreased in CML cells compared to the control cells. In other cancers, an upregulation in TRX1 expression is associated with a poor prognosis [37], so the observed upregulation in blast crisis CML may play a role in the severity of the disease. Conversely, TXNIP is a tumor suppressor; therefore, its upregulation is associated with a positive prognosis [38]; however, a downregulation in this gene may contribute to the progression of the cancer.
3.2. The Efficacy of TKIs on CML Cell Proliferation
CML is primarily treated with various BCR-ABL-specific TKIs, with the gold standard of these treatments being imatinib. We aimed to determine the efficacy of four TKIs: imatinib, dasatinib, ponatinib and GNF-5 in the K562, KU812 and KCL22 CML cell lines by treating cells with increasing concentrations of each drug for either 24 or 48 h, followed by MTT cell proliferation assays. These MTT results were used to calculate the IC50 values of each drug in each cell line (Table 1). Imatinib (Supplementary Figure S1A–C) was far more effective after 48 h treatment, with an observed IC50 of approximately 0.3 µM in all three cell lines. Out of the three classical TKIs (imatinib, dasatinib and ponatinib), it appeared to be the least potent. Dasatinib (Supplementary Figure S1D–F) was the most potent of the TKIs tested, with an IC50 of 1 nM after 48 h in KU812 cells. However, the other two cell lines were slightly less responsive to this drug, with IC50 values of approximately 7.5 nM after 48 h. Similar to imatinib, dasatinib was significantly more effective after 48 h. The efficacy of ponatinib (Supplementary Figure S2A–C) was in between that of imatinib and dasatinib; however, its potency varied quite notably between cell lines. K562 cells were the least sensitive to this drug, with an IC50 of approximately 30 nM after 48 h. Similarly, KCL22 cells had an IC50 value of 20 nM after 48 h. KU812 cells were the most sensitive to ponatinib, with an IC50 of 5 nM after 48 h, which is six times lower than that obtained for the K562 cells. Lastly, GNF-5 was tested (Supplementary Figure S2D–F) and was found to be the least effective of all four TKIs but, as with ponatinib, the effectiveness also varied between cell lines. In K562 cells, its IC50 was approximately 1.5 µM; in KU812 cells it was 1 µM and in KCL22 cells it was 0.5 µM after 48 h. Overall, it was shown that each TKI was effective in the low micromolar or nanomolar range, and in the K562 cell line, imatinib, dasatinib and ponatinib were significantly more effective after 48 h compared to 24 h treatment. It was also observed that dasatinib was the most effective, and GNF-5 was the least effective against all three cell lines.
3.3. TKIS Induce Apoptosis in CML Cells
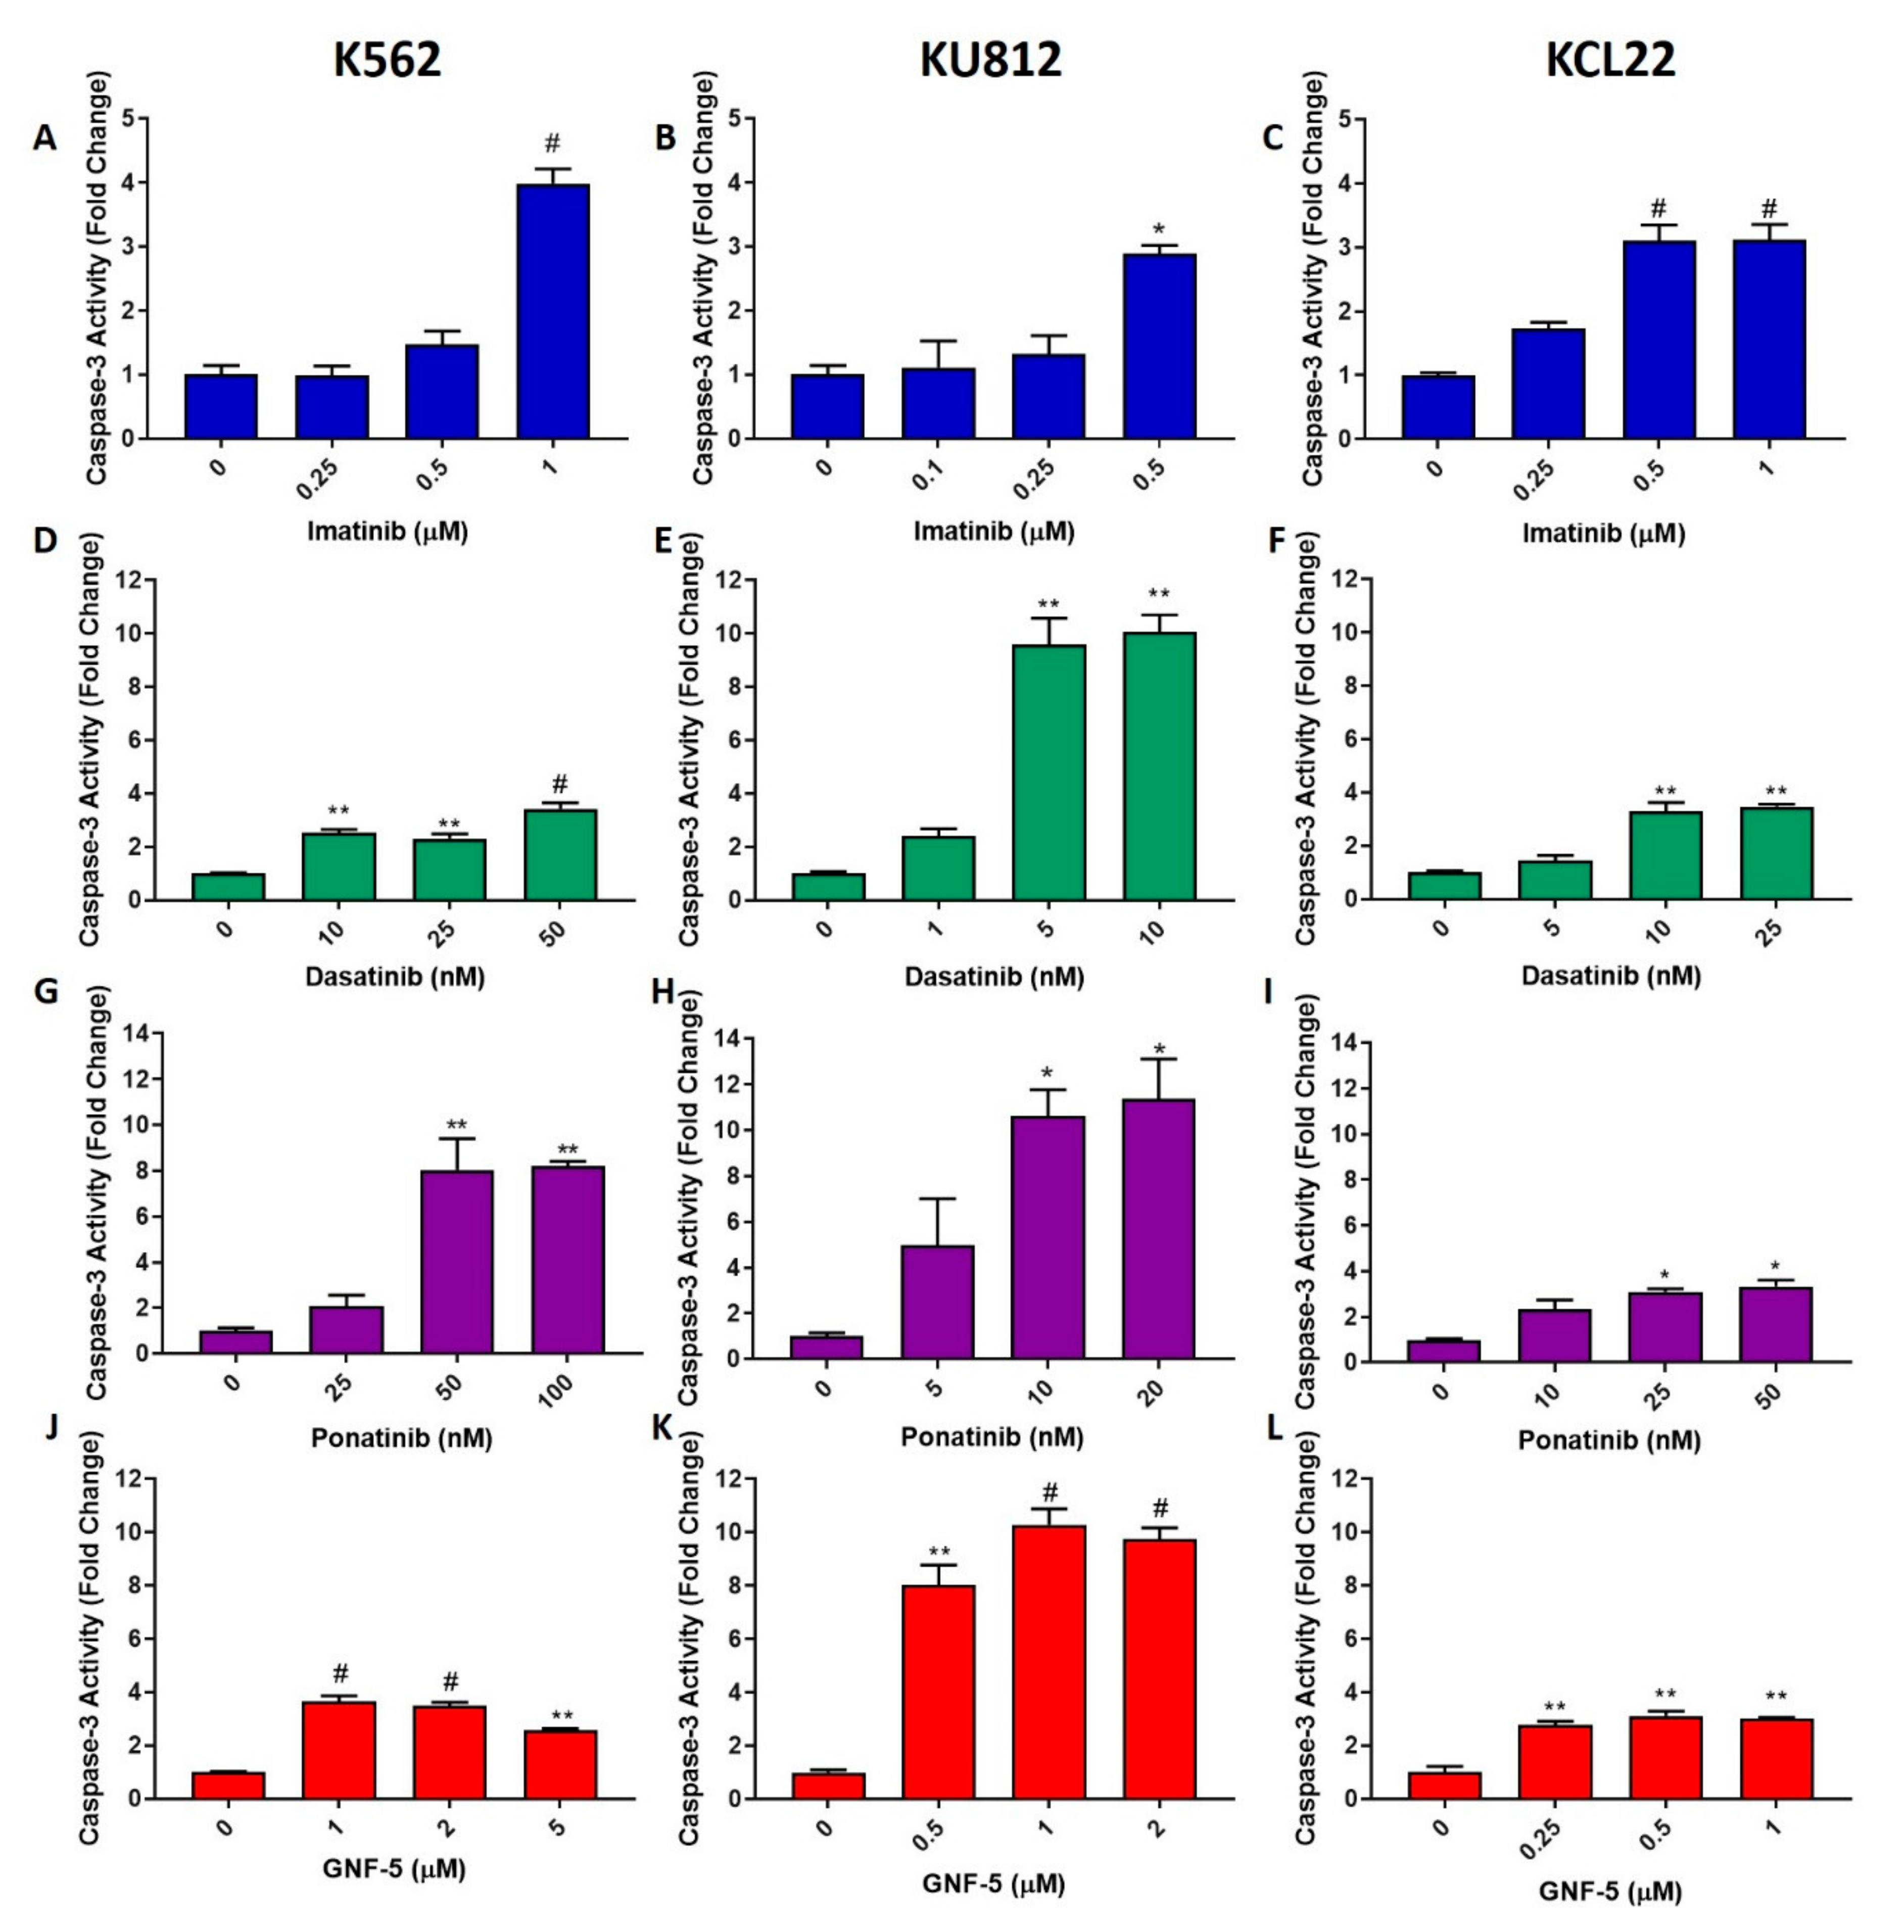
One of the most common mechanisms of drug-induced cell death is apoptosis; therefore, apoptosis levels were measured using caspase-3 activity assays, wherein higher caspase-3 levels indicate higher apoptosis levels. K562, KU812 and KCL22 cells were treated with either imatinib, dasatinib or ponatinib for 24 h or GNF-5 for 48 h. Chosen concentrations were able to induce apoptosis but did not generate high levels of cell death; this was based on the MTT proliferation assay results (Supplementary Figures S1 and S2). Caspase-3 activity was then measured (Figure 2). It was observed that each of the TKIs elicited a significant increase in apoptosis in each cell line. Imatinib behaved in a similar manner in all three cell lines, showing a maximum of a three to four-fold increase in caspase-3 activity in imatinib-treated cells compared to the control. Dasatinib had the greatest effect on the KU812 cell line, as it induced caspase-3 levels three times higher than that of the other two cell lines. There was a 10-fold increase with 5 nM of the compound; however, treatment of the other two cell lines with 10 nM dasatinib only caused an approximate three-fold increase in caspase-3 activity. Ponatinib elicited an 8–10-fold increase in both the K562 and KU812 cell lines treated with 50 nM and 10 nM, respectively; however, only a three-fold increase was observed in the KCL22 cells. Lastly, the effect of GNF-5 on caspase-3 activity was evaluated. GNF-5 was quite effective in inducing apoptosis in all CML cell lines, with 1µM of GNF-5 sufficient to induce a three-fold increase in caspase-3 activity after 48 h in both the K562 and KCL22 cells. This drug was three times more effective in the KU812 cells, inducing a 10-fold increase in caspase-3 activity after 48 h treatment with the same concentration. Overall, it was observed that the TKIs elicited a lower level of apoptosis in the KCL22 cell line compared with both the K562 and KU812 cell lines. Despite this, each TKI induced an increase in caspase-3 activity in each CML cell line, indicating that these TKIs can cause cell death via apoptosis.
3.4. TKIs Induce Increased ROS Levels in CML Cells
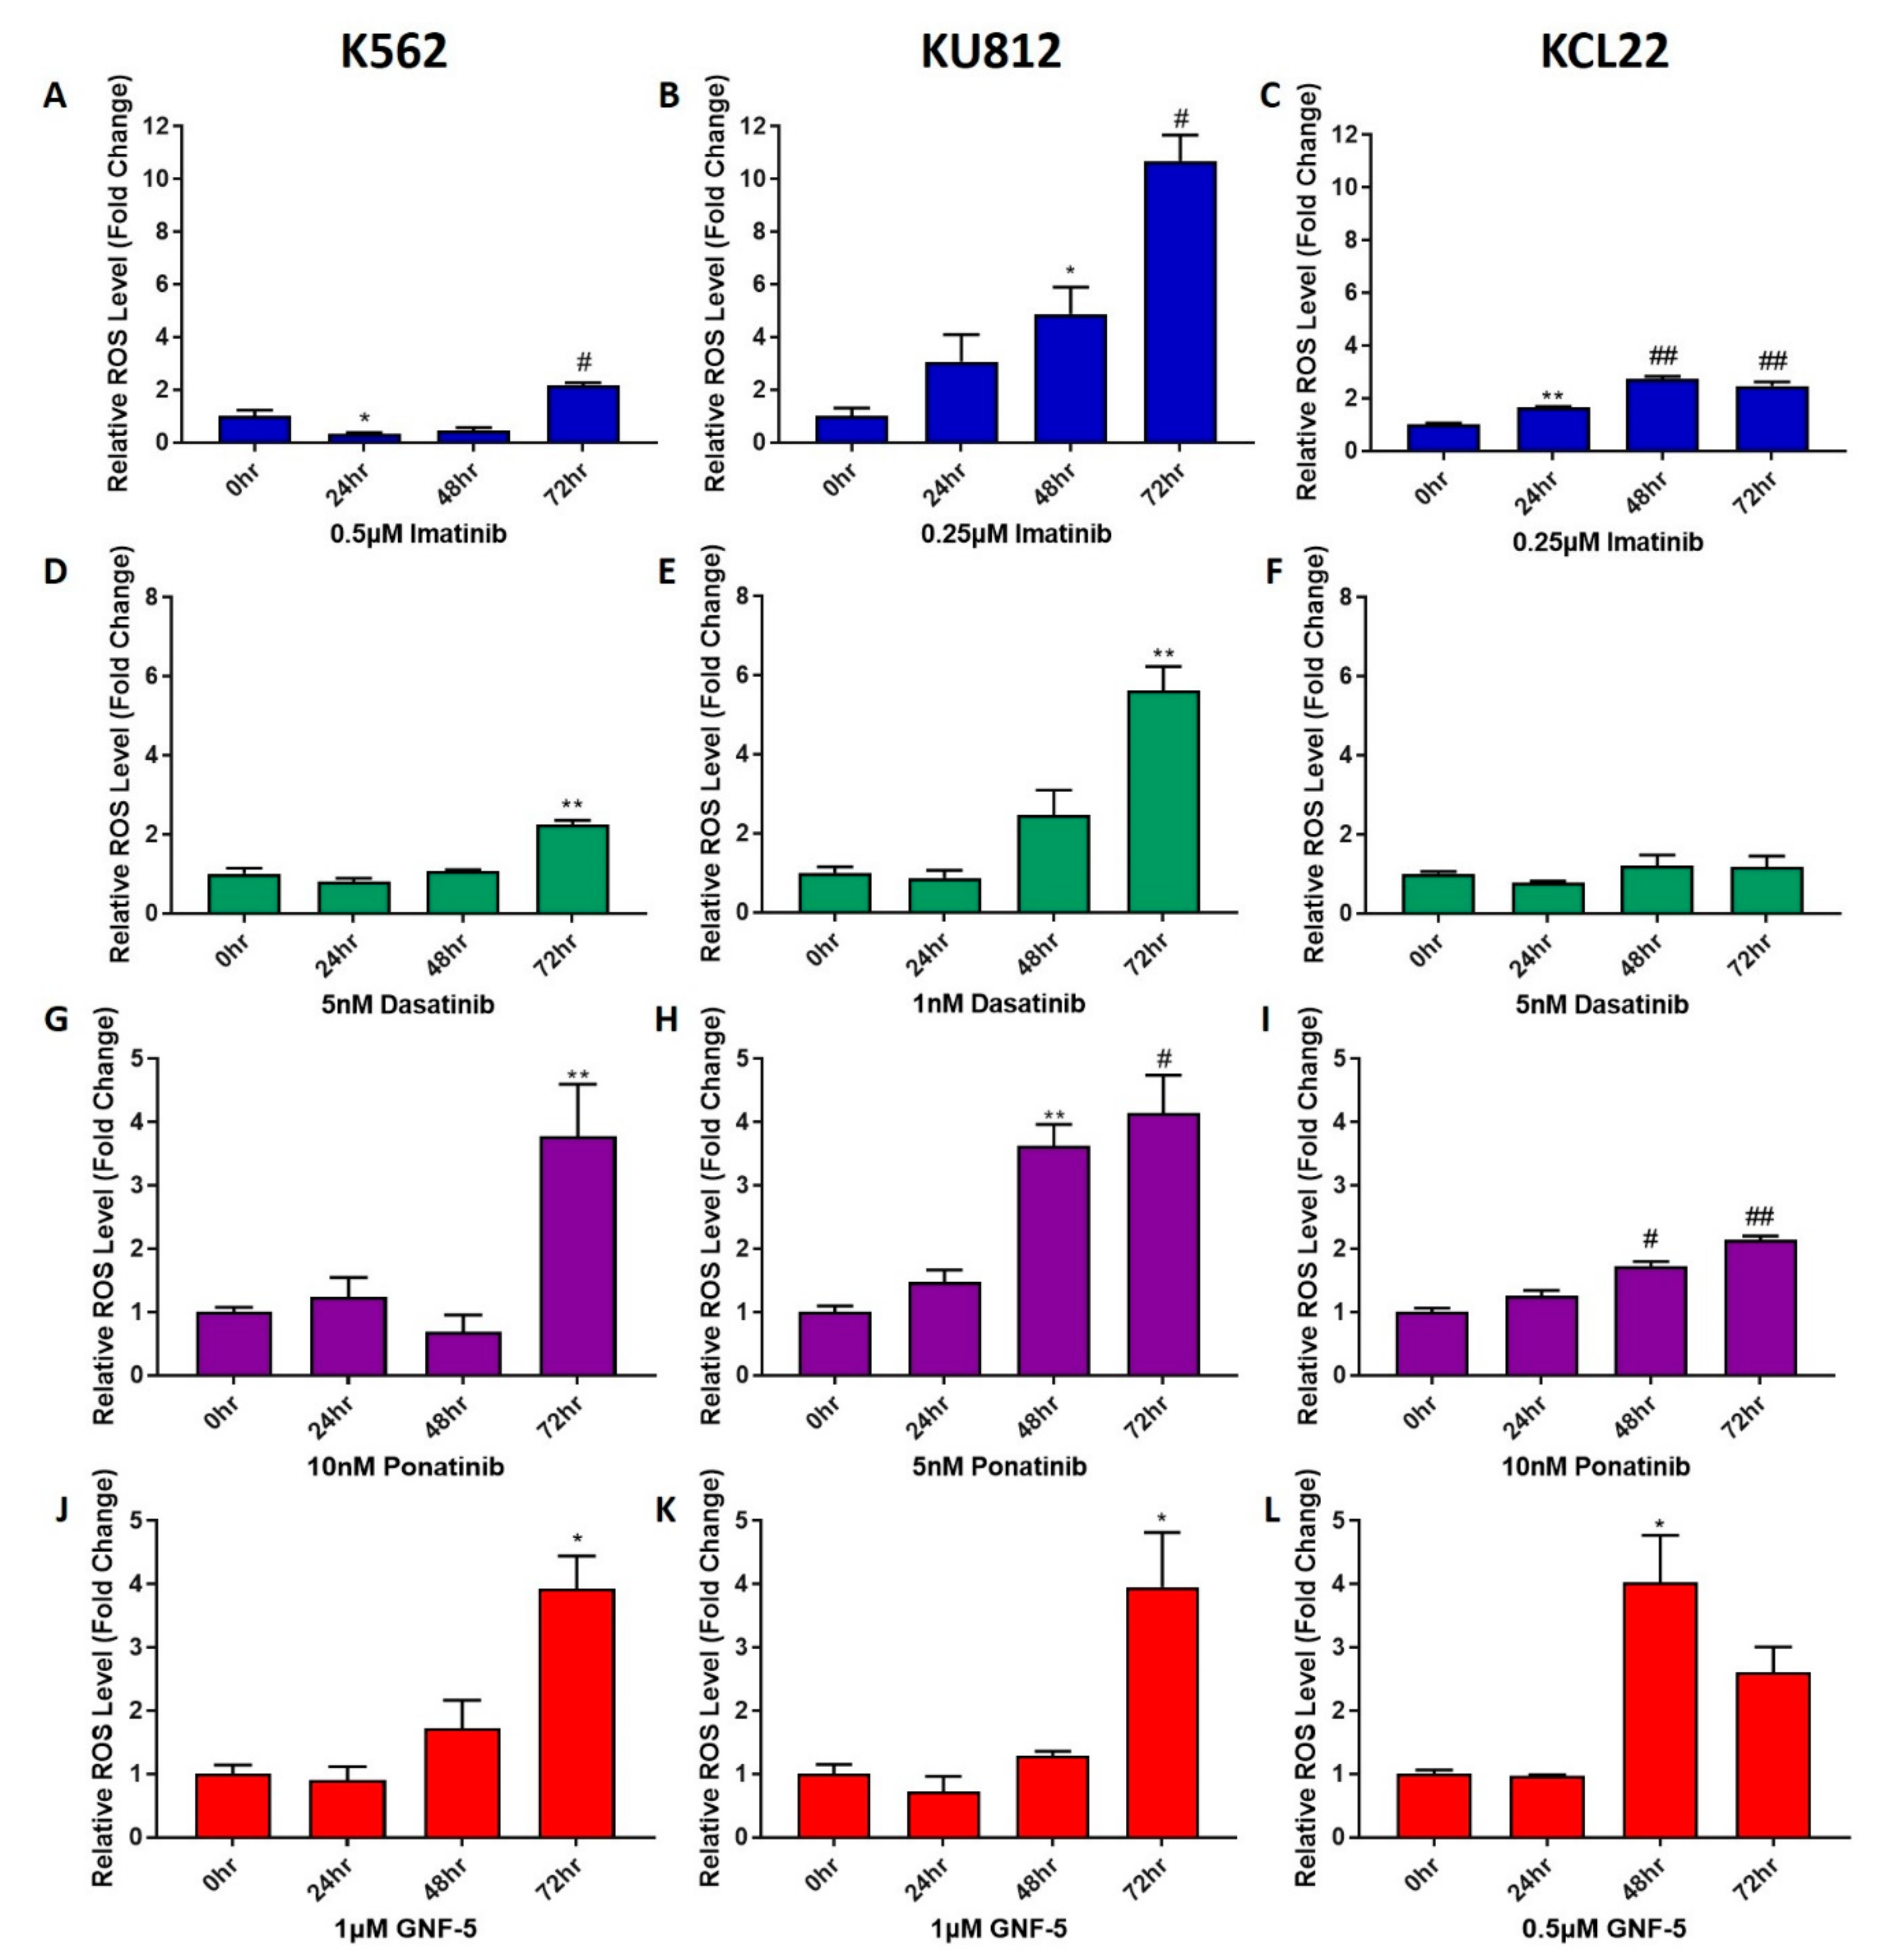
To further investigate the effect that TKIs have on CML cells, their effect on reactive oxygen species (ROS) levels in cells was measured (Figure 3). K562, KU812 and KCL22 cells were treated with the concentrations of TKIs specified in Figure 3 for either 24, 48 or 72 h. Each concentration was either equal to, or lower than the IC50 of each compound to ensure there was sufficient living cells to analyze. Furthermore, cell viability assays were used to verify that there were at least 25% viable cells after each treatment (Supplementary Figure S3A–C). There was an increase in ROS levels observed following treatment with all four TKIs, although the time point at which this increase occurred varied between treatments and cell lines. Imatinib induced a significant increase in ROS after 72 h treatment in the K562 and KU812 cell lines, and after 24 h in the KCL22 cell line. In both K562 and KCL22 cells, the increase in ROS following imatinib treatment was approximately two to three- fold higher than that of the untreated control; however, in the KU812 cells there was a 10-fold increase in ROS levels. Dasatinib was observed to induce a significantly higher level of ROS compared to untreated control cells after 72 h treatment in the K562 and KU812 cells with two-fold and six-fold increases observed, respectively. Dasatinib did not induce a notable change in ROS in the KCL22 cells. The results for ponatinib remained consistent between the three cell lines, with the K562 and KU812 cells experiencing a four-fold increase upon ponatinib treatment, while there was a two-fold increase in the KCL22 cells. In KU812 and KCL22 cell lines, there was a significant increase in ROS levels after 48 h of ponatinib treatment; however, the K562 cells only displayed an increase in ROS after 72 h. Lastly, GNF-5 induced a four-fold increase in ROS after 72 h in the K562 and KU812 cells and after 48 h in the KCL22 cells. Overall, it was observed that all four tested TKIs induced higher ROS levels in CML cells, with the KU812 cells showing the most susceptibility to this increase in ROS levels.
3.5. TKIs Decrease TRXR Activity
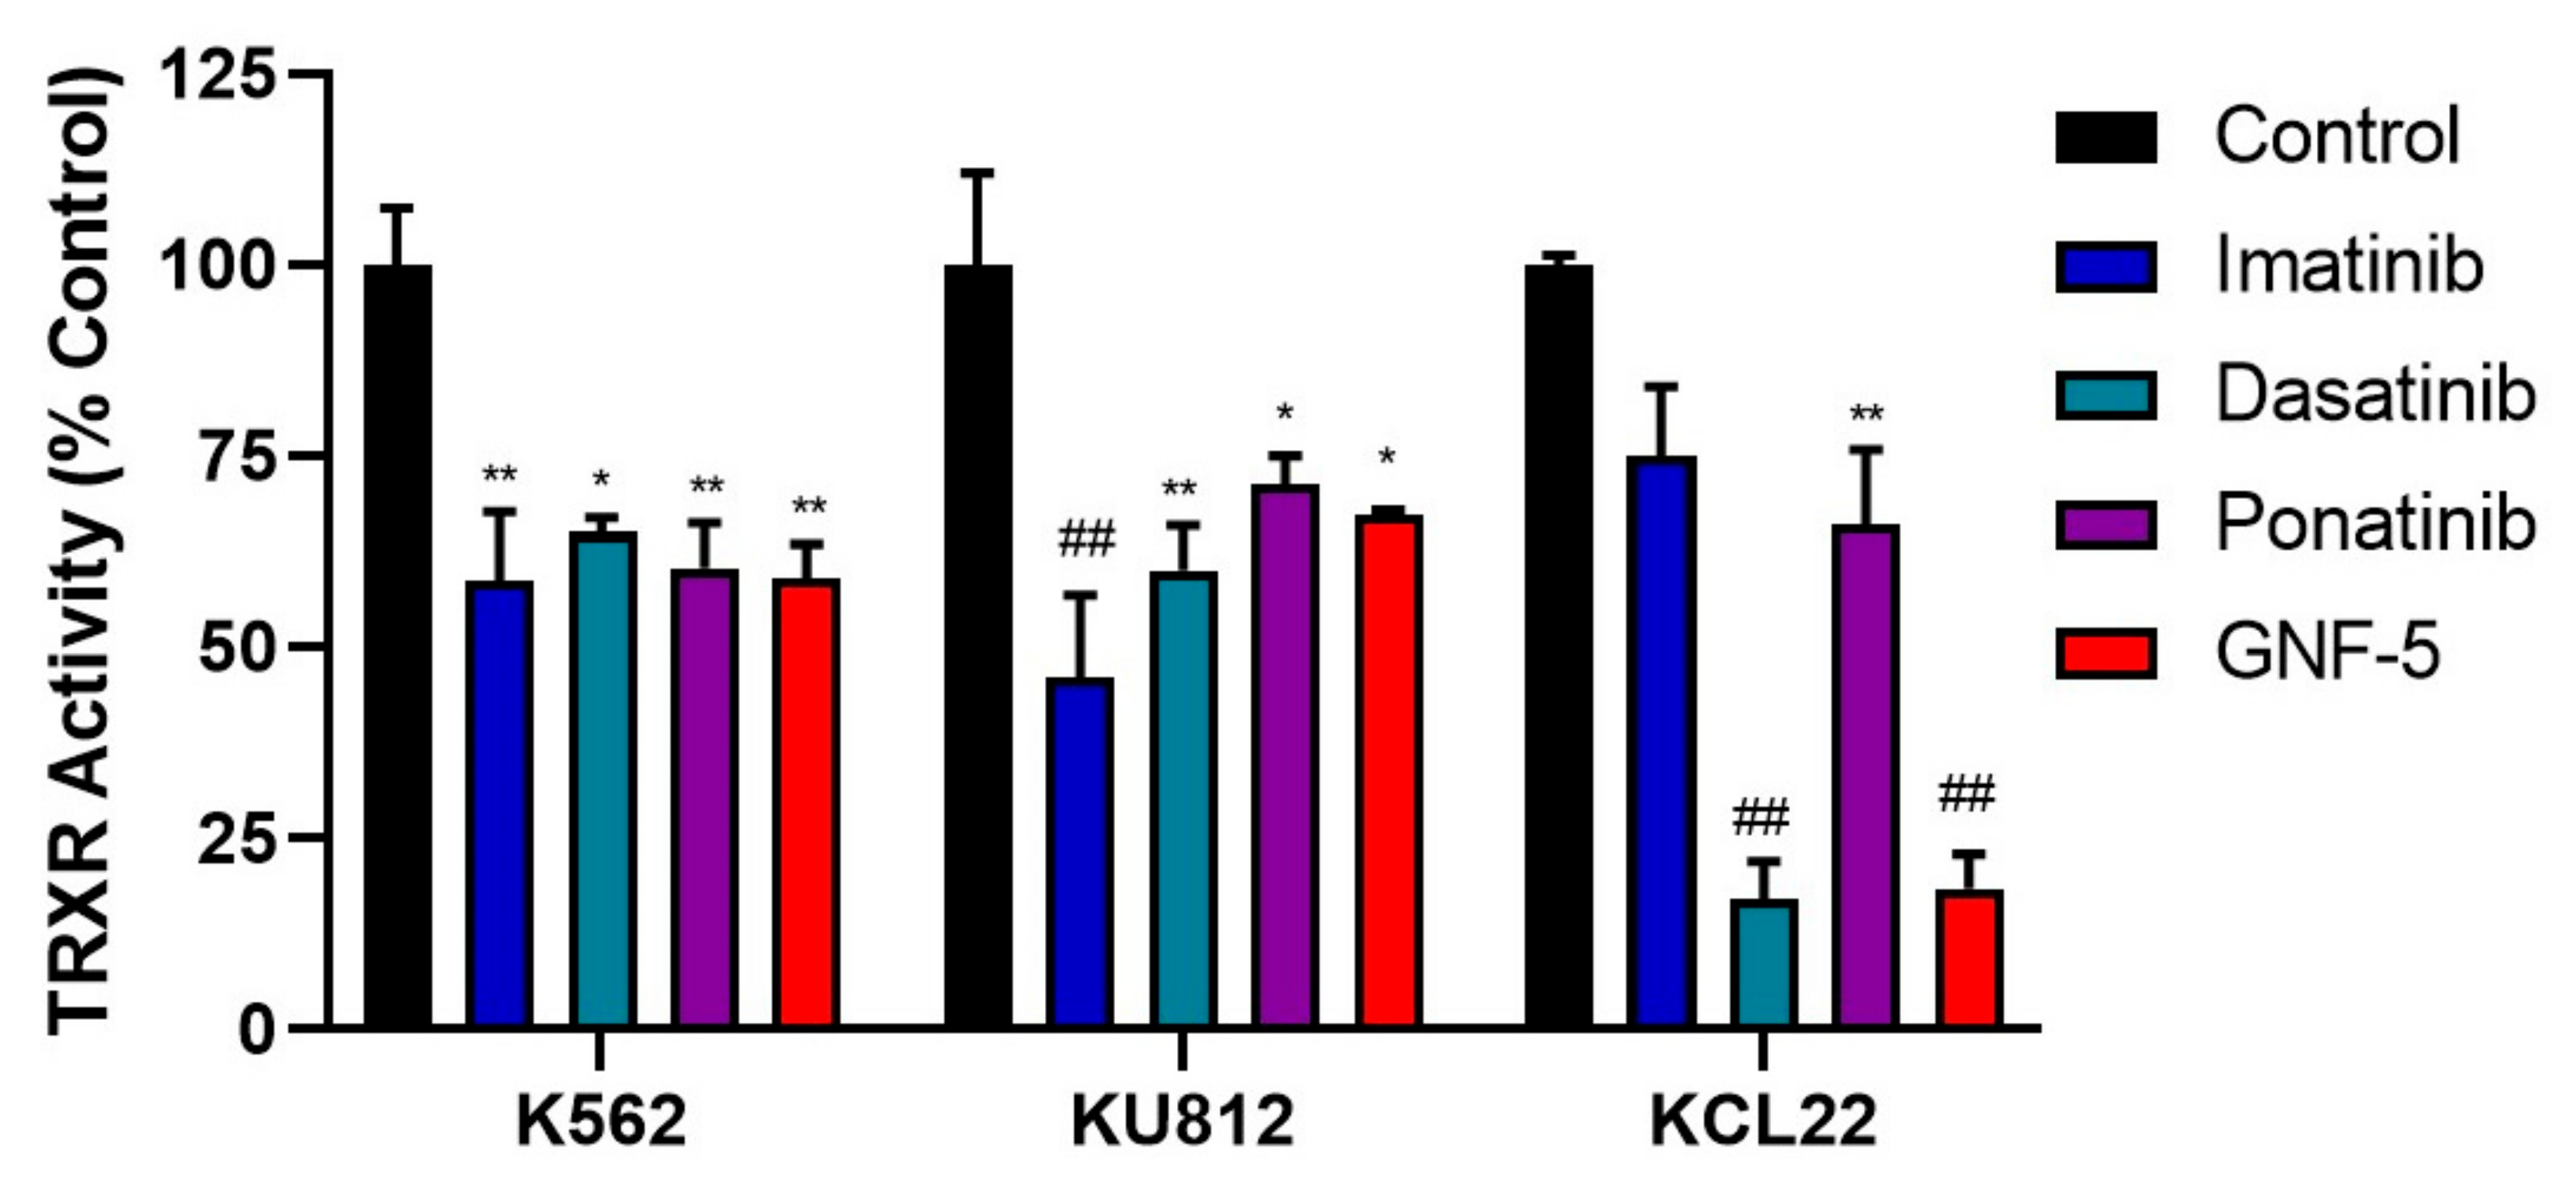
Since TKIs were able to induce increased ROS levels in CML cells, it is plausible that they could affect the activity of the TRX system. TRXR activity levels were measured following treatment with each TKI for 72 h (Figure 4). A period of 72 h was determined to be the optimal time point for TRXR activity assays, as earlier time points (24 h and 48 h) did not show significant downregulation in TRXR activity. The concentrations of each TKI used were the same as those used in Figure 5 to aid comparison between ROS levels and decreased TRXR activity. It was observed that treatment of K562 cells with each of the TKIs significantly decreased TRXR activity by approximately 40%. Similarly, KU812 cell treatment with each TKI significantly decreased TRXR activity, with a slightly lower decrease of about 30% in TRXR activity, except for imatinib, which had a 50% decrease. Lastly, the KCL22 cells displayed more varied results compared to the other two cell lines. Imatinib and ponatinib decreased TRXR activity by approximately 30%, while dasatinib and GNF-5 decreased TRXR activity by about 80%. Overall, it can be inferred that inhibition of BCR-ABL activity (including the highly specific BCR-ABL inhibitor, GNF-5) resulted in a decrease in TRXR activity, and likely activity of the entire TRX system, which may account for the increased ROS levels observed previously.
3.6. TKIs Decrease mRNA Levels of the TRX System Genes
We next assessed if the lower TRXR activity following TKI treatment was due to a decrease in the expression of the TRX system genes. We first used RT-qPCR to measure the mRNA levels of NRF2, TRX1, TRXR1 and TXNIP following treatment with imatinib (Figure 5A–C), ponatinib (Figure 5D–F) or GNF-5 (Figure 5G–I) in all three CML cell lines. In the K562 cells, it was observed that with almost every TKI treatment, the mRNA expression of NRF2, TRX1 and TRXR1 was significantly decreased, while TXNIP levels were significantly increased. Overall, a similar result was observed in the KU812 cells. Following treatment with each of the three TKIs, NRF2, TRX1 and TRXR1 mRNA expression was significantly reduced. Furthermore, TXNIP expression was significantly increased after 3 h; however, a notable but not significant decrease was observed after 24 h and 48 h of imatinib treatment. The TKIs appeared to have a greater effect on the mRNA expression of the TRX system in the KU812 cells compared to the K562 cells, as mRNA levels for NRF2, TRX1 and TRXR1 were reduced by 50–60% in this cell line, whereas in the K562 cells, it was only by 30–40%. TXNIP expression in both cell lines was increased by approximately four-fold after TKI treatment in both cell lines. Lastly, in the KCL22 cell line, all three TKIs were able to significantly reduce the mRNA expression levels of TRX1 and TRXR1, but only ponatinib and GNF-5 significantly decreased NRF2 mRNA expression levels. Imatinib and ponatinib were able to significantly increase the TXNIP mRNA levels, while there was no noticeable difference following GNF-5 treatment. Overall, these RT-qPCR results show that TKI treatment of CML cells results in decreased levels of NRF2, TRX1 and TRXR1 mRNA, while increasing the expression levels of TXNIP.
3.7. TKIs Decrease Protein Levels of TRX1 and TRXR1
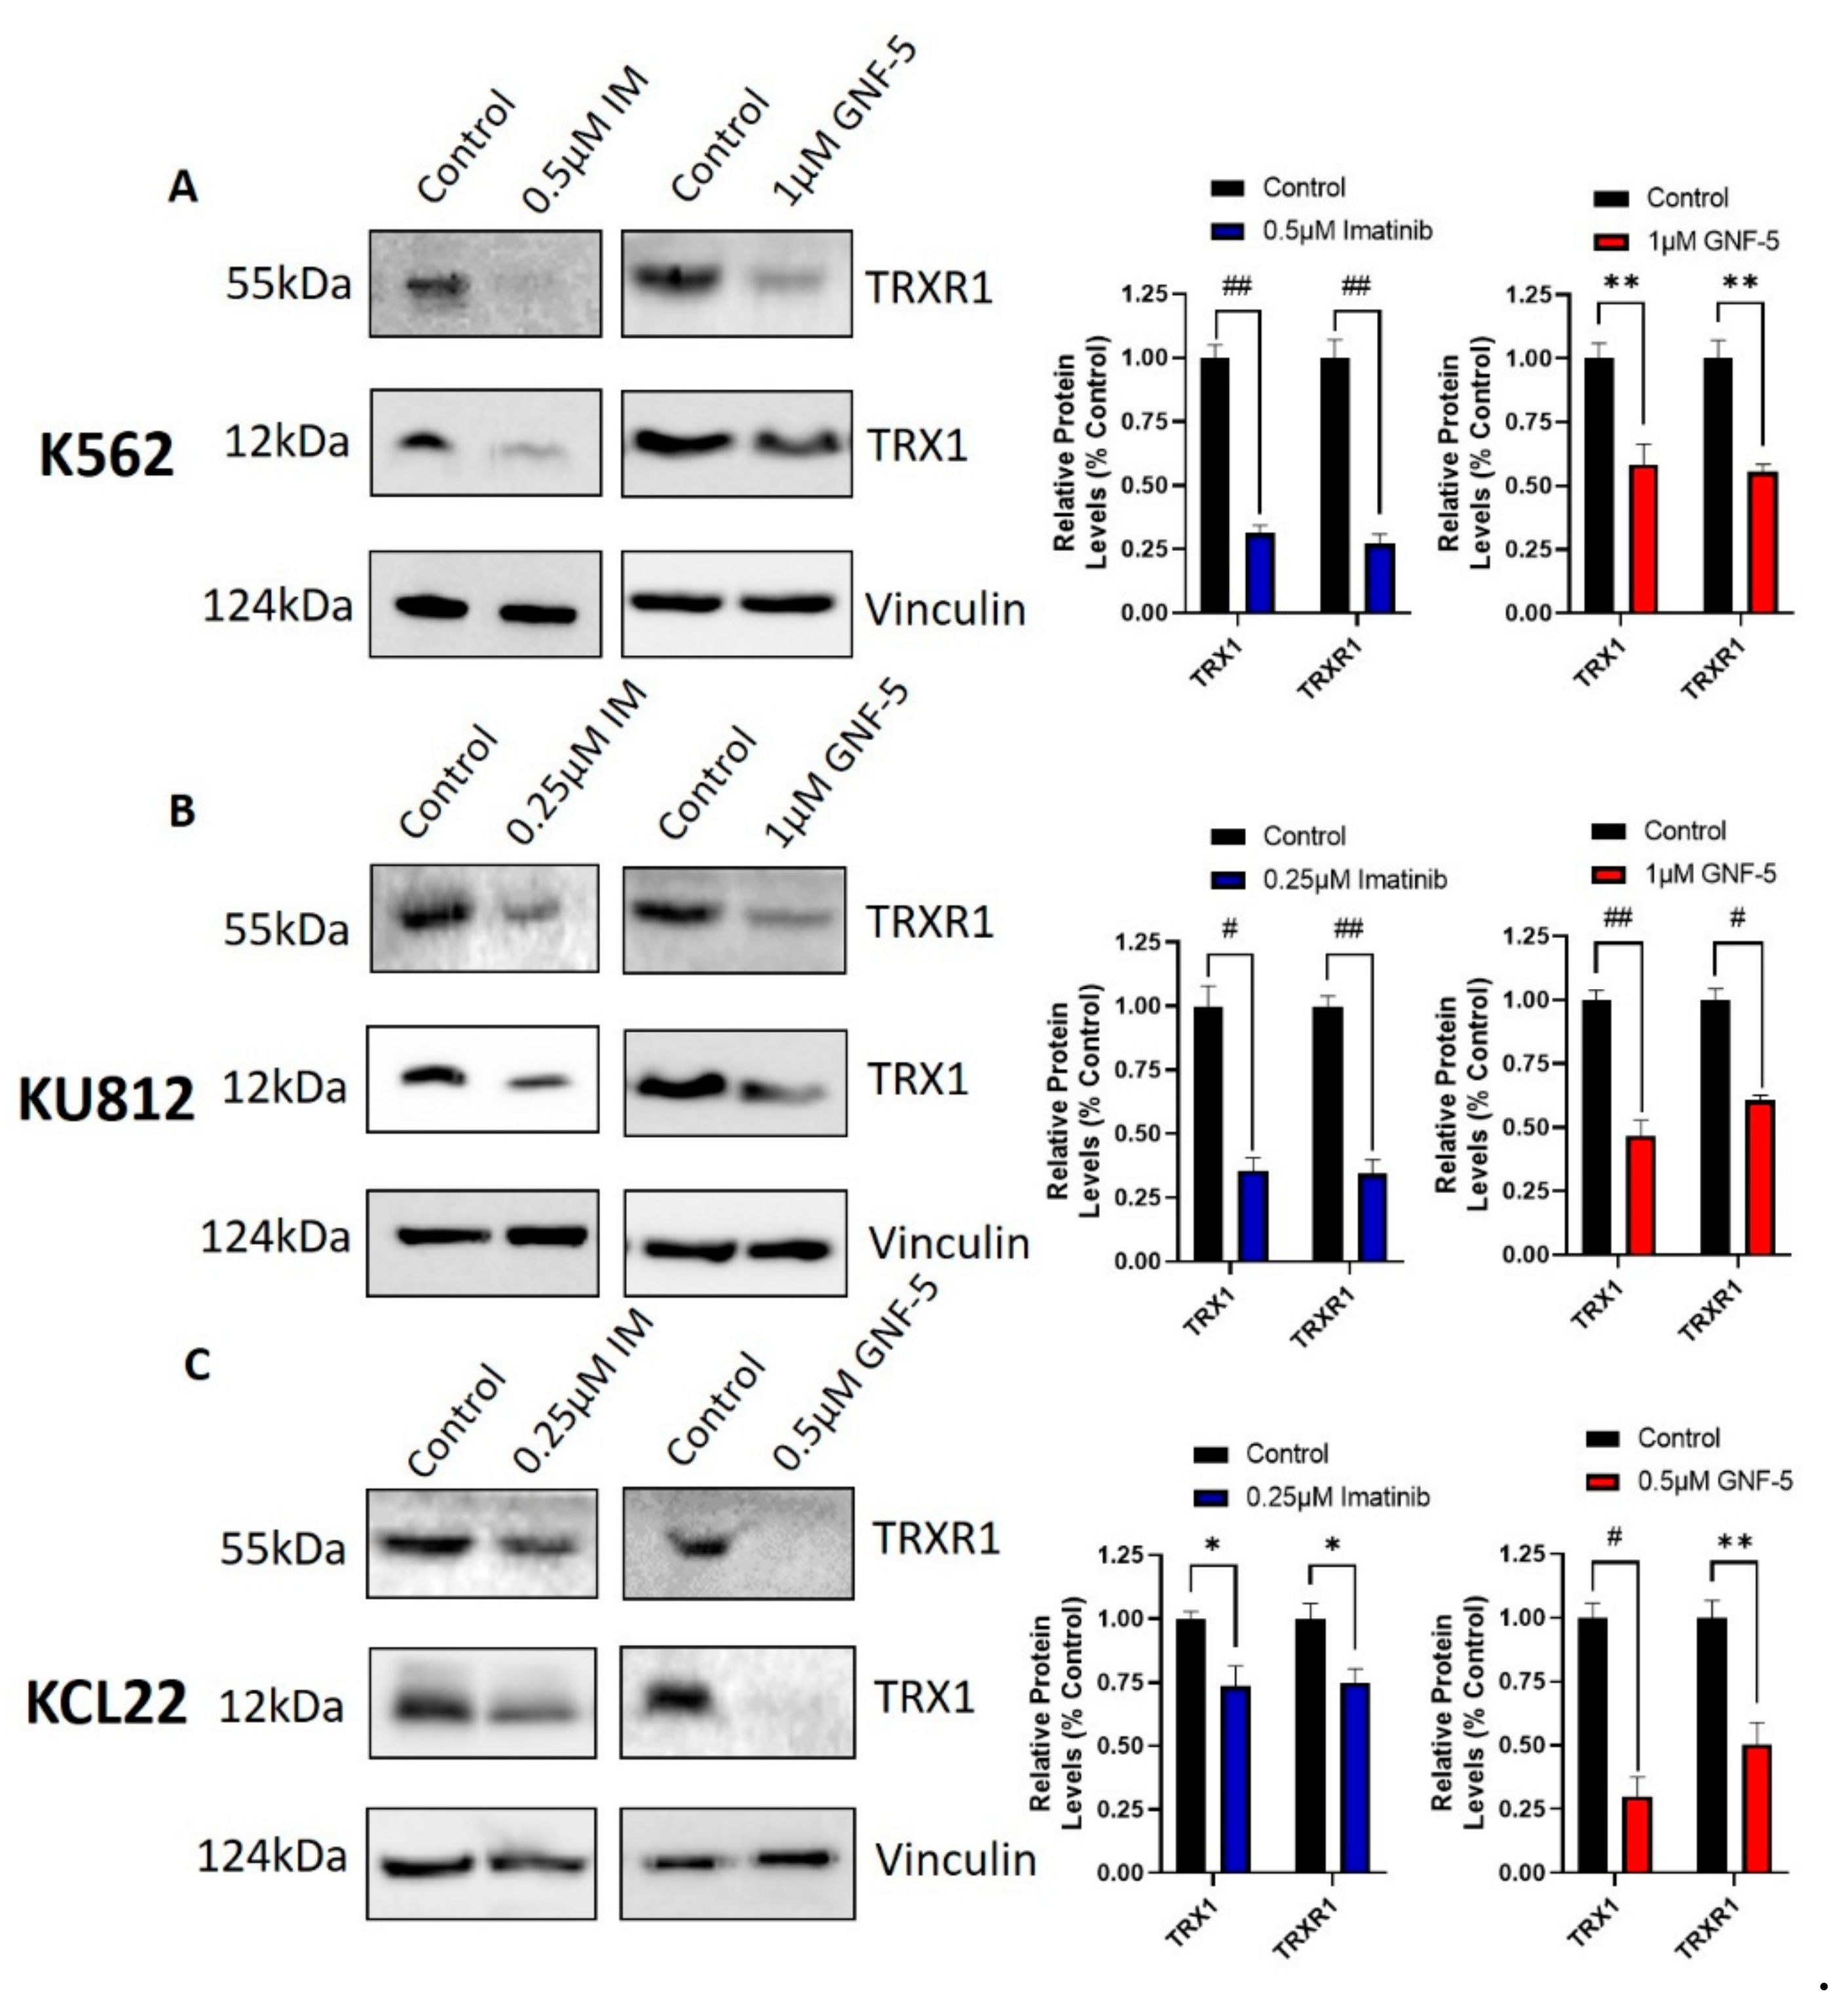
Western blotting was used to examine the effects of imatinib and GNF-5 on the protein levels of TRX1 and TRXR1 in K562, KU812 and KCL22 cells after treatment for 72 h (Figure 6). Other time points (24 h and 48 h) were also tested (data not shown); however, the 72-h treatment showed results that were aligned with those reported from the TRXR activity assays. Values close to the IC50 value of each drug was used to ensure sufficient protein levels for Western blotting. It can be observed that treatment with these TKIs was able to decrease the protein levels of both TRX1 and TRXR1 in all three cell lines. However, imatinib was almost twice as effective as GNF-5 in the K562 cell line, while in the KU812 and KCL22 cell lines, GNF-5 was more effective than imatinib. Since GNF-5 is a BCR-ABL specific TKI, it is likely that BCR-ABL inhibition is responsible for the decrease in TRX1 and TRXR1 protein levels. These results correlate with the mRNA expression results, since it was shown that imatinib and GNF-5 also decreased TRX1 and TRXR1 mRNA levels.
3.8. Specific Knockdown of BCR-ABL Results in Suppression of the TRX System
To confirm that the inhibition of the TRX system via TKIs is due to BCR-ABL inhibition, BCR-ABL1-specific siRNA was transfected into K562 CML cells to knockdown this protein with a high degree of specificity. To make this siRNA specific to BCR-ABL1 only (and not the native forms of BCR and ABL1), it had to be designed over the junction of BCR-ABL1. This means that only one possible siRNA sequence exists for BCR-ABL1, so instead of using three independent siRNAs, only one set was used for BCR-ABL1 knockdown. The BCR-ABL1 siRNA that was used in this project was designed and validated by Gavrilov et al. [39]. Western blotting was used to determine the efficacy of the BCR-ABL1 knockdown following 5 days of incubation after BCR-ABL1 siRNA transfection (Figure 7A). BCR-ABL protein levels were visibly decreased in the K562 cells transfected with BCR-ABL1 siRNA, compared to those transfected with scrambled siRNA. These results show that this BCR-ABL1 siRNA was effective in decreasing BCR-ABL protein expression.
Next, TRXR activity was measured in K562 cells transfected with scrambled and BCR-ABL1 siRNA (Figure 7B). There was a significant decrease in TRXR activity in BCR-ABL1 siRNA-transfected cells compared to the scrambled siRNA control. This result was corroborated by RT-qPCR data that measured the mRNA levels of BCR-ABL1, NRF2, TRX1, TRXR1 and TXNIP in both BCR-ABL1 and scrambled siRNA-transfected CML cells incubated for 3 days following their transfection (Figure 7C). These data showed that BCR-ABL1 mRNA expression was significantly decreased in the BCR-ABL1 siRNA transfected cells compared to those transfected with scrambled siRNA, correlating with the decreased BCR-ABL protein levels (Figure 7A). The RT-qPCR data also showed a significant decrease in the mRNA expression levels of NRF2 and TRX1 when cells were transfected with BCR-ABL1 siRNA. There was also a visible decrease in TRXR1 expression and an increase in TXNIP mRNA expression. Overall, the RT-qPCR data showed that BCR-ABL1 siRNA transfection resulted in decreased expression of the TRX system, as well as a decreased TRXR activity. This matches the results observed when CML cells were treated with TKIs, but due to the specificity of siRNA knockdown, this result shows that it is highly likely that the observed inhibition of the TRX system is BCR-ABL-dependent.
4. Discussion
BCR-ABL-specific TKIs are by far the most common treatment of CML. Their effects on BCR-ABL and CML cell death have been thoroughly documented; however, the degree of drug resistance that is associated with them is also well known [40,41,42]. It has previously been shown that the inhibition of the TRX system downregulates the activity of BCR-ABL and thus induces apoptosis in CML cells; however, the inhibition of the TRX system in itself also results in apoptosis [43,44]. Therefore, we wanted to investigate whether this interaction functions both ways and if the inhibition of BCR-ABL would lead to a decrease in the activity of the TRX system and thus cause apoptosis via this mechanism. It has been reported in many cancers, such as breast and gastric cancers, that TRX1 expression levels are upregulated, and this has been associated with a poor prognosis [17,45,46]. This current study has shown that TRX1 is also upregulated in both CML cell lines and in patient samples, particularly in the terminal and most severe stage of CML, blast crisis. Furthermore, this study has shown that the inhibitor of the TRX system, TXNIP, is downregulated in CML cells and in CML patients. This is a notable observation as TXNIP is a known tumor suppressor, and low levels of this protein are associated with a poor prognosis [47,48]. The reliability of this RNAseq analysis was verified using RT-qPCR, which also showed an increase in TRX1 mRNA expression and a decrease in TXNIP expression in blast crisis CML compared to healthy cells. Overall, it was seen that the expression levels of the TRX system were aligned with a poor prognosis in CML, but the upregulation of this system in cancer presents it as a possible target for treatment of this disease.
The toxicity of four TKIs were assessed in CML cells. The TKIs chosen were imatinib, dasatinib, ponatinib and GNF-5 which are first, second, third and fourth generation BCR-ABL inhibitors, respectively. Dasatinib was the most potent of all TKIs tested, as the IC50 of this drug after 48 h ranged from 1–10 nM in all cell lines. These results align with the work of Veach et al. [49], as they found that dasatinib had an IC50 value of 1 nM in K562 cells after 72 h. Ponatinib was slightly less potent, with an IC50 value after 48 h of approximately 5–50 nM. It was found by Lu et al. [50] that ponatinib had an IC50 value of about 50 nM in K562 cells. Imatinib was the least effective out of all the three classical TKIs: despite being the most commonly used, its IC50 value after 48 h treatment was about 0.5 µM in all three cell lines, making it at least 10 times less effective than ponatinib and 50 times less effective than dasatinib. Xu et al. [51] also found that imatinib had an IC50 value of 0.5 µM in K562 cells. GNF-5 was the least effective of all TKIs tested, with an IC50 value of about 1 µM in all cell lines after 48 h. Similar results were also reported for the BaF3 cell line, which is a BCR-ABL-positive cell line [11]. Overall, each TKI tested was relatively effective in inhibiting cell proliferation in three commonly utilized CML cell lines [52].
It was found using caspase-3 activity assays that the cell death elicited by the TKIs was mediated by apoptosis in all cases, which has been observed by other researchers in CML and other cancer cell lines [53,54,55,56]. Apoptosis can be induced by many cellular processes; however, one of the most common initiators of this process is oxidative stress [57,58,59]. Each of the four tested TKIs were shown to induce significantly increased intracellular ROS levels, which may be at least partly responsible for the apoptosis observed. High ROS levels induce apoptosis by a variety of different mechanisms, including causing direct damage to DNA, lipids and proteins, but also by activating various apoptosis pathways. It has been observed by Sattler et al. [60] that CML cells have an intrinsically higher level of ROS due to the activity of BCR-ABL; therefore, it stands to reason that an inhibition of BCR-ABL would result in lowered ROS levels. In some instances, this was shown after short incubation with TKIs (24 h). However, in most cases, especially after extended periods of time (48–72 h), TKIs were observed to increase ROS levels. This may be attributed to the decrease in the expression and activity of the TRX system, which was observed following treatment with TKIs. One of the primary functions of the TRX system is to maintain healthy ROS levels; therefore, the inhibition of this system by TKIs is likely responsible for the increase in ROS levels that was observed. The decrease in the activity of the TRX system may also induce apoptosis via a range of different mechanisms, one of the most prominent being the JNK apoptosis pathway, which is activated by ASK1, a protein that is typically suppressed by TRX1; however, in the absence of active TRX1, this pathway is activated and apoptosis is initiated [20]. Therefore, it is likely that this may be one of the causes of TKI-induced apoptosis in CML.
Another major finding of this study was the effect of BCR-ABL inhibition on the activity and expression of the TRX system. It was found that when CML cells were treated with any of the four TKIs, or with BCR-ABL1 specific siRNA, that TRXR activity levels were significantly decreased. Furthermore, these TKIs and BCR-ABL1 specific siRNA were able to reduce the mRNA and protein expression of NRF2, TRX1 and TRXR1, whilst upregulating the expression of TXNIP, the inhibitor of the TRX system. Although, it can be noted in the KU812 cell line there was a decrease in TXNIP mRNA expression after 24 and 48 h imatinib treatment, and after 48 h in the KCL22 cell line. TXNIP is involved in glucose metabolism and has been shown to be upregulated when glucose levels are high, in order to ensure glucose is metabolized correctly [61]. However, Gomez-Samano et al. [62] has shown that imatinib reduces levels of plasma glucose, which in turn could explain why TXNIP is downregulated following imatinib treatment.
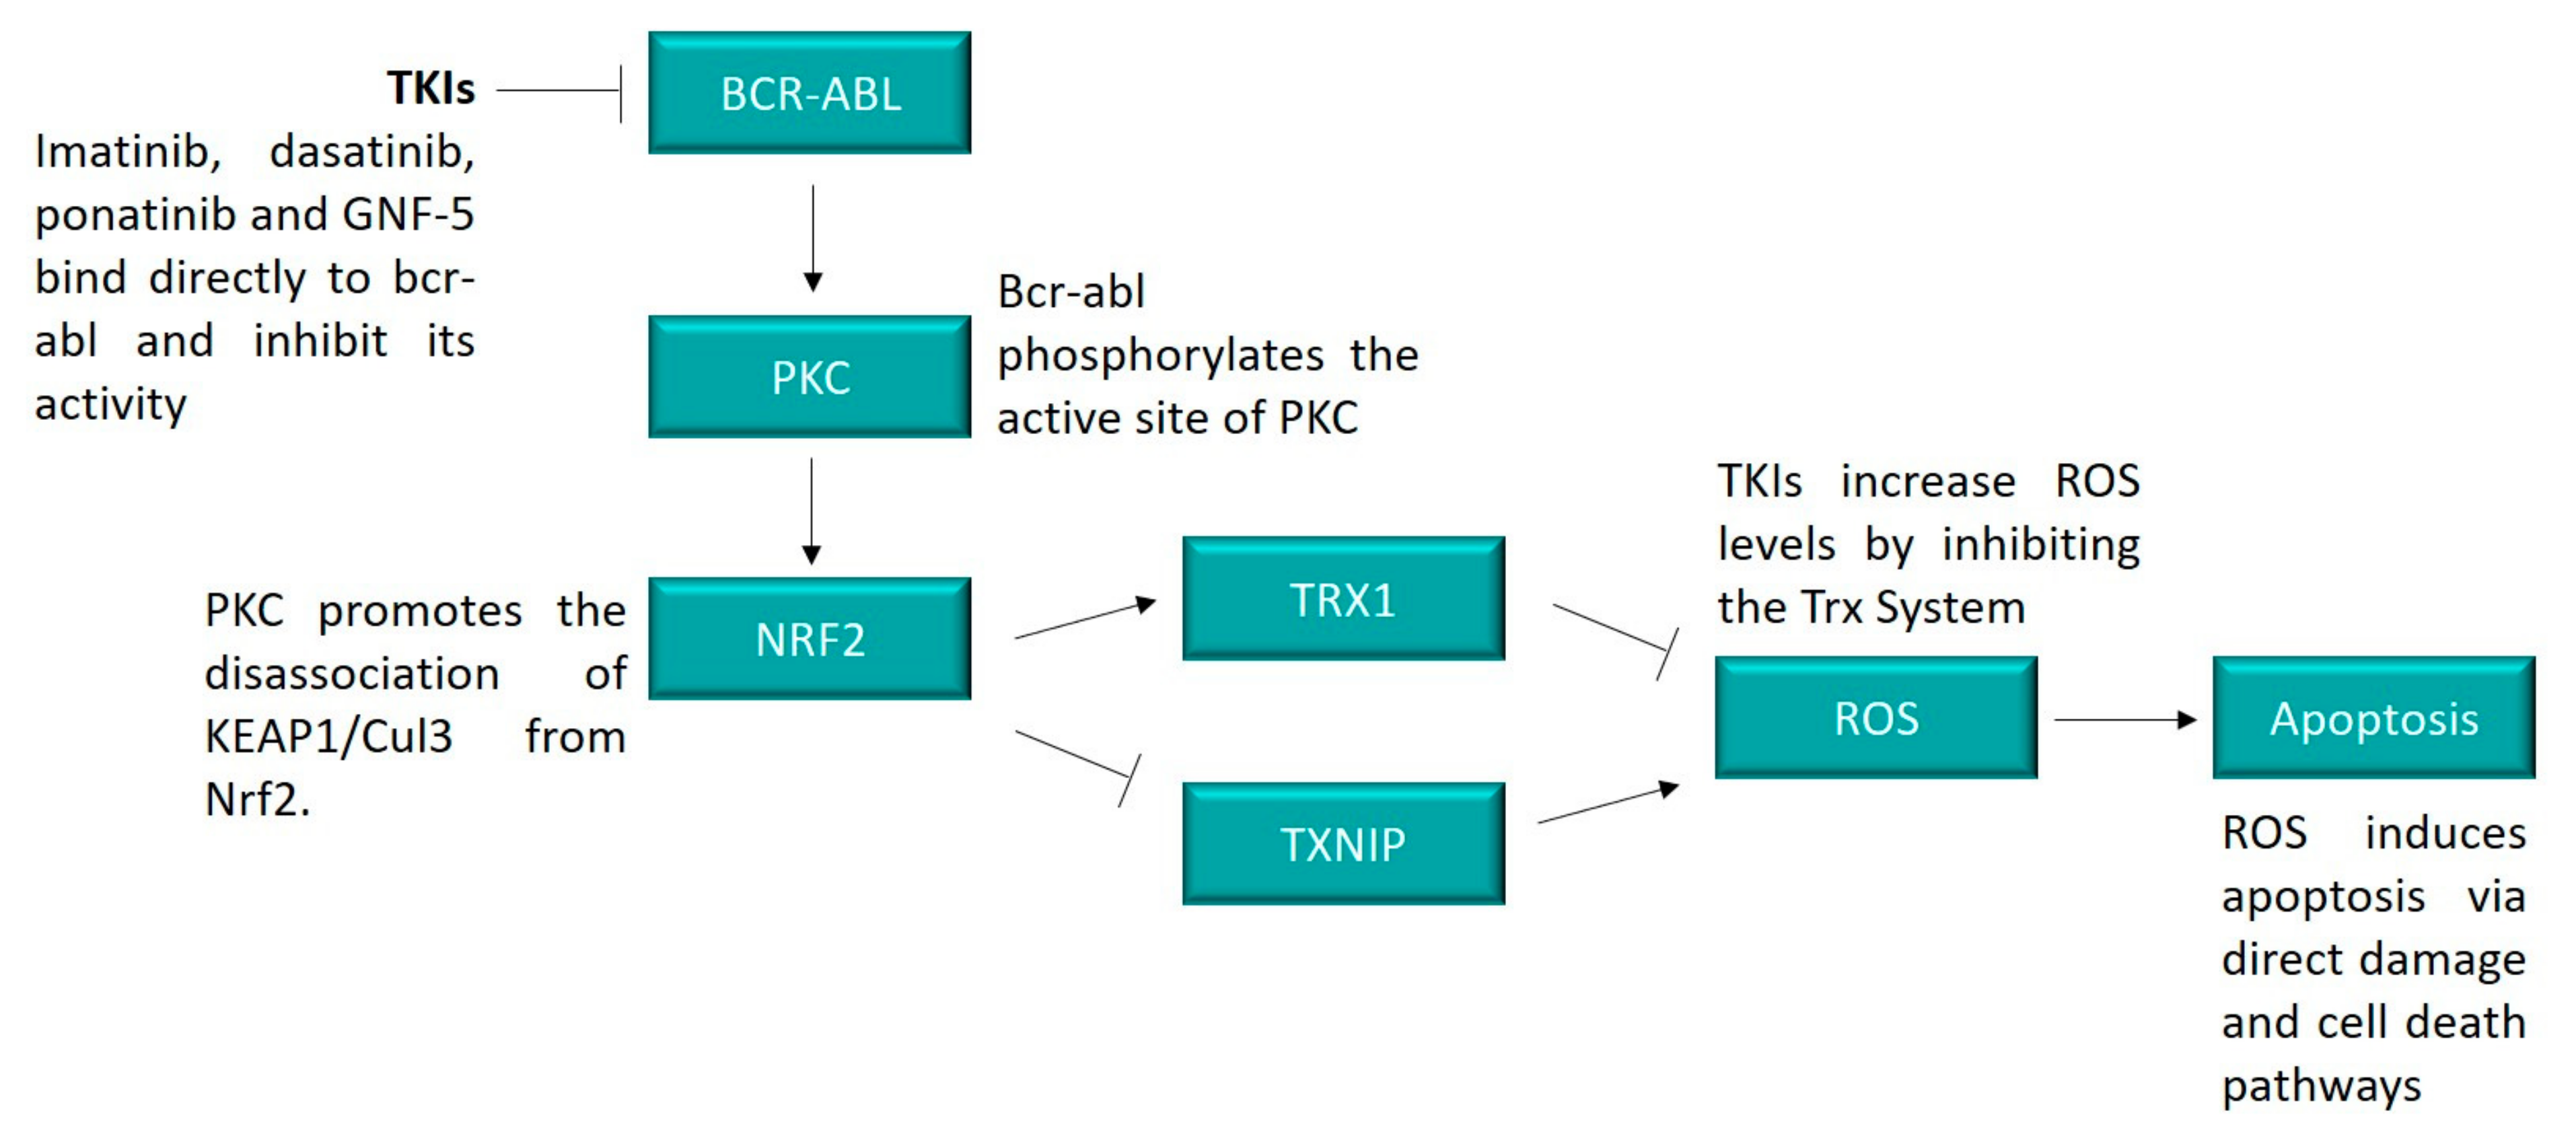
Despite this, it can be concluded that BCR-ABL inhibition downregulates the expression and activity of the TRX system. The mechanism responsible is unknown, although it is possible that it may be through the activity of the protein kinase C (PKC) pathway. The PKC family of proteins functions as serine and threonine kinases and are involved in the regulation of a large array of cell survival and proliferation pathways [63]. One of the pathways that PKC is known to regulate is the NRF2 pathway through the phosphorylation of the serine site on the NRF2 protein. Consequently, the dissociation of the KEAP1/CUL3 complex from NRF2 occurs, thus inducing NRF2 activity and subsequently upregulating expression of TRX and other antioxidant genes [64]. PKC could potentially be the link between the BCR-ABL and NRF2 pathways since it has been observed that BCR-ABL is responsible for inducing the phosphorylation, and thus activation of PKC [65,66]. The link between these two pathways is displayed in Figure 8.
Overall, it was found that the inhibition of BCR-ABL by TKIs induced cell death via apoptosis in CML cells. It is likely that this apoptosis was at least partly caused by the downregulation of the TRX system, and subsequent increase in intracellular ROS levels. Since TKIs are the primary treatment for CML, the understanding of their ability to influence the activity of the TRX system is particularly important. Not only could the results in this paper shed light on mechanisms of drug resistance in CML, but they also highlight new targets to overcome such drug resistance. Since the main source of drug resistance in CML treatment is mutations within BCR-ABL, directly targeting other pathways, such as the TRX system, offers an alternative therapeutic approach. It has already been observed that TRXR inhibitors are effective in inducing cell death in imatinib resistant CML cells [12]; therefore, this may be a promising avenue to overcome BCR-ABL-dependent drug resistance.
Supplementary Materials
The following are available online at https://0-www-mdpi-com.brum.beds.ac.uk/article/10.3390/hemato2020014/s1, Figure S1: Cell viability in CML cells following TKI treatment. Figure S2: TKIs decrease cell proliferation in CML cells. Figure S3: Cell viability in CML cells following TKI treatment.
Author Contributions
E.C. carried out the overall project design experimental work, analyzed the results and wrote the manuscript. G.D.T. and K.F.T. both supervised the design and conduct of the project and were involved in the editing and reviewing of the manuscript. All authors have read and agreed to the published version of the manuscript.
Funding
E.C. is a recipient of the Australian Government Research Training Program scholarship. Funding for the research was provided by Griffith University.
Data Availability Statement
Data is available from authors on request.
Acknowledgments
We would like to thank Chris Slape (Translational Research Institute, QLD, Australia) for the K5 62 cell line.
Conflicts of Interest
The authors declare no conflict of interest.
References
- Ma, L.; Shan, Y.; Bai, R.; Xue, L.; Eide, C.A.; Ou, J.; Zhu, L.J.; Hutchinson, L.; Cerny, J.; Khoury, H.J.; et al. A therapeutically targetable mechanism of BCR-ABL-independent imatinib resistance in chronic myeloid leukemia. Sci. Transl. Med. 2014, 6, 252ra121. [Google Scholar] [CrossRef] [PubMed] [Green Version]
- Zhang, P.; Wang, Y.; Qin, M.; Li, D.; Odhiambo, W.O.; Yuan, M.; Lv, Z.; Liu, C.; Ma, Y.; Dong, Y.; et al. Involvement of Blnk and Foxo1 in tumor suppression in BCR-ABL1-transformed pro-B cells. Oncol. Rep. 2020, 45, 693–705. [Google Scholar] [CrossRef]
- Singh, P.; Kumar, V.; Gupta, S.K.; Kumari, G.; Verma, M. Combating TKI resistance in CML by inhibiting the PI3K/Akt/mTOR pathway in combination with TKIs: A review. Med. Oncol. 2021, 38, 10. [Google Scholar] [CrossRef]
- Jabbour, E.J.; Cortes, J.E.; Kantarjian, H.M. Resistance to tyrosine kinase inhibition therapy for chronic myelogenous leukemia: A clinical perspective and emerging treatment options. Clin. Lymphoma Myeloma Leuk. 2013, 13, 515–529. [Google Scholar] [CrossRef] [PubMed] [Green Version]
- Apperley, J.F. Chronic myeloid leukemia. Lancet 2015, 385, 1447–1459. [Google Scholar] [CrossRef]
- Geelen, I.G.P.; Thielen, N.; Janssen, J.; Hoogendoorn, M.; Roosma, T.J.A.; Willemsen, S.P.; Visser, O.; Cornelissen, J.J.; Westerweel, P.E. Treatment outcome in a population-based, ’real-world’ cohort of patients with chronic myeloid leukemia. Haematologica 2017, 102, 1842–1849. [Google Scholar] [CrossRef] [PubMed]
- Gorre, M.E.; Mohammed, M.; Ellwood, K.; Hsu, N.; Paquette, R.; Rao, P.N.; Sawyers, C.L. Clinical resistance to STI-571 cancer therapy caused by BCR-ABL gene mutation or amplification. Science 2001, 293, 876–880. [Google Scholar] [CrossRef] [PubMed] [Green Version]
- Hochhaus, A.; Baccarani, M.; Silver, R.T.; Schiffer, C.; Apperley, J.F.; Cervantes, F.; Clark, R.E.; Cortes, J.E.; Deininger, M.W.; Guilhot, F.; et al. European LeukemiaNet 2020 recommendations for treating chronic myeloid leukemia. Leukemia 2020, 34, 966–984. [Google Scholar] [CrossRef] [Green Version]
- Ozgur Yurttas, N.; Eskazan, A.E. Dasatinib-induced pulmonary arterial hypertension. Br. J. Clin. Pharmacol. 2018, 84, 835–845. [Google Scholar] [CrossRef]
- Massaro, F.; Molica, M.; Breccia, M. Ponatinib: A review of efficacy and safety. Curr. Cancer Drug Targets 2018, 18, 847–856. [Google Scholar] [CrossRef] [PubMed]
- Zhang, J.; Adrian, F.J.; Jahnke, W.; Cowan-Jacob, S.W.; Li, A.G.; Iacob, R.E.; Sim, T.; Powers, J.; Dierks, C.; Sun, F.; et al. Targeting Bcr-Abl by combining allosteric with ATP-binding-site inhibitors. Nature 2010, 463, 501–506. [Google Scholar] [CrossRef] [PubMed] [Green Version]
- Clapper, E.; Wang, S.; Raninga, P.V.; Di Trapani, G.; Tonissen, K.F. Cross-talk between Bcr-abl and the thioredoxin system in chronic myeloid leukemia: Implications for CML treatment. Antioxidants 2020, 9, 207. [Google Scholar] [CrossRef]
- Niture, S.K.; Jain, A.K.; Jaiswal, A.K. Antioxidant-induced modification of INRF2 cysteine 151 and PKC-delta-mediated phosphorylation of NRF2 serine 40 are both required for stabilization and nuclear translocation of NRF2 and increased drug resistance. J. Cell Sci. 2009, 122, 4452–4464. [Google Scholar] [CrossRef] [Green Version]
- Yamawaki, H.; Pan, S.; Lee, R.T.; Berk, B.C. Fluid shear stress inhibits vascular inflammation by decreasing thioredoxin-interacting protein in endothelial cells. J. Clin. Invest. 2005, 115, 733–738. [Google Scholar] [CrossRef] [Green Version]
- Zitman-Gal, T.; Green, J.; Pasmanik-Chor, M.; Oron-Karni, V.; Bernheim, J. Endothelial pro-atherosclerotic response to extracellular diabetic-like environment: Possible role of thioredoxin-interacting protein. Nephrol. Dial. Transplant. 2010, 25, 2141–2149. [Google Scholar] [CrossRef] [Green Version]
- Nagano, M.; Hatakeyama, K.; Kai, M.; Nakamura, H.; Yodoi, J.; Asada, Y.; Chijiiwa, K. Nuclear expression of thioredoxin-1 in the invasion front is associated with outcome in patients with gallbladder carcinoma. HPB 2012, 14, 573–582. [Google Scholar] [CrossRef] [PubMed] [Green Version]
- Shang, W.; Xie, Z.; Lu, F.; Fang, D.; Tang, T.; Bi, R.; Chen, L.; Jiang, L. Increased thioredoxin-1 expression promotes cancer progression and predicts poor prognosis in patients with gastric cancer. Oxid. Med. Cell. Longev. 2019, 2019, 9291683. [Google Scholar] [CrossRef] [PubMed]
- Heilman, J.M.; Burke, T.J.; McClain, C.J.; Watson, W.H. Transactivation of gene expression by NF-kappaB is dependent on thioredoxin reductase activity. Free Radic. Biol. Med. 2011, 51, 1533–1542. [Google Scholar] [CrossRef] [Green Version]
- Hsieh, C.C.; Papaconstantinou, J. Thioredoxin-ASK1 complex levels regulate ROS-mediated p38 MAPK pathway activity in livers of aged and long-lived Snell dwarf mice. FASEB J. 2006, 20, 259–268. [Google Scholar] [CrossRef] [Green Version]
- Liu, H.; Nishitoh, H.; Ichijo, H.; Kyriakis, J.M. Activation of apoptosis signal-regulating kinase 1 (ASK1) by tumor necrosis factor receptor-associated factor 2 requires prior dissociation of the ASK1 inhibitor thioredoxin. Mol. Cell. Biol. 2000, 20, 2198–2208. [Google Scholar] [CrossRef] [Green Version]
- Muri, J.; Thut, H.; Feng, Q.; Kopf, M. Thioredoxin-1 distinctly promotes NF-kB target DNA binding and NLRP3 inflammasome activation independently of Txnip. Elife 2020, 9. [Google Scholar] [CrossRef]
- Arner, E.S. Perspectives of TrxR1-based cancer therapies. In Oxidative Stress: Eustress and Distress; Academic Press: Cambridge, MA, USA, 2020; pp. 639–667. [Google Scholar]
- Raninga, P.V.; Lee, A.C.; Sinha, D.; Shih, Y.Y.; Mittal, D.; Makhale, A.; Bain, A.L.; Nanayakarra, D.; Tonissen, K.F.; Kalimutho, M.; et al. Therapeutic cooperation between auranofin, a thioredoxin reductase inhibitor and anti-PD-L1 antibody for treatment of triple-negative breast cancer. Int. J. Cancer 2020, 146, 123–136. [Google Scholar] [CrossRef]
- Fan, C.; Zheng, W.; Fu, X.; Li, X.; Wong, Y.S.; Chen, T. Enhancement of auranofin-induced lung cancer cell apoptosis by selenocystine, a natural inhibitor of TrxR1 in vitro and in vivo. Cell Death Dis. 2014, 5, e1191. [Google Scholar] [CrossRef] [PubMed] [Green Version]
- Lozzio, C.B.; Lozzio, B.B. Human chronic myelogenous leukemia cell-line with positive Philadelphia chromosome. Blood 1975, 45, 321–334. [Google Scholar] [CrossRef] [PubMed] [Green Version]
- Kishi, K. A new leukemia cell line with Philadelphia chromosome characterized as basophil precursors. Leuk. Res. 1985, 9, 381–390. [Google Scholar] [CrossRef]
- Kubonishi, I.; Miyoshi, I. Establishment of a Ph1 chromosome-positive cell line from chronic myelogenous leukemia in blast crisis. Int. J. Cell Cloning 1983, 1, 105–117. [Google Scholar] [CrossRef]
- Raninga, P.V.; Di Trapani, G.; Vuckovic, S.; Bhatia, M.; Tonissen, K.F. Inhibition of thioredoxin 1 leads to apoptosis in drug-resistant multiple myeloma. Oncotarget 2015, 6, 15410–15424. [Google Scholar] [CrossRef] [PubMed] [Green Version]
- Cox, A.G.; Brown, K.K.; Arner, E.S.; Hampton, M.B. The thioredoxin reductase inhibitor auranofin triggers apoptosis through a Bax/Bak-dependent process that involves peroxiredoxin 3 oxidation. Biochem. Pharmacol. 2008, 76, 1097–1109. [Google Scholar] [CrossRef] [PubMed]
- Sze, J.H.; Raninga, P.V.; Nakamura, K.; Casey, M.; Khanna, K.K.; Berners-Price, S.J.; Di Trapani, G.; Tonissen, K.F. Anticancer activity of a Gold(I) phosphine thioredoxin reductase inhibitor in multiple myeloma. Redox Biol. 2020, 28, 101310. [Google Scholar] [CrossRef]
- Raninga, P.V.; Di Trapani, G.; Vuckovic, S.; Tonissen, K.F. TrxR1 inhibition overcomes both hypoxia-induced and acquired bortezomib resistance in multiple myeloma through NF-kB Inhibition. Cell Cycle 2016, 15, 559–572. [Google Scholar] [CrossRef] [PubMed] [Green Version]
- Smith, A.D.; Levander, O.A. High-throughput 96-well microplate assays for determining specific activities of glutathione peroxidase and thioredoxin reductase. Methods Enzymol. 2002, 347, 113–121. [Google Scholar] [PubMed]
- Rushworth, S.A.; MacEwan, D.J.; O’Connell, M.A. Lipopolysaccharide-induced expression of NAD(P)H:quinone oxidoreductase 1 and heme oxygenase-1 protects against excessive inflammatory responses in human monocytes. J. Immunol. 2008, 181, 6730–6737. [Google Scholar] [CrossRef] [PubMed] [Green Version]
- Karlenius, T.C.; Shah, F.; Di Trapani, G.; Clarke, F.M.; Tonissen, K.F. Cycling hypoxia up-regulates thioredoxin levels in human MDA-MB-231 breast cancer cells. Biochem. Biophys. Res. Commun. 2012, 419, 350–355. [Google Scholar] [CrossRef] [Green Version]
- Li, S.Q.; Liu, J.; Zhang, J.; Wang, X.L.; Chen, D.; Wang, Y.; Xu, Y.M.; Huang, B.; Lin, J.; Li, J.; et al. Transcriptome profiling reveals the high incidence of hnRNPA1 exon 8 inclusion in chronic myeloid leukemia. J. Adv. Res. 2020, 24, 301–310. [Google Scholar] [CrossRef]
- Raffel, J.; Bhattacharyya, A.K.; Gallegos, A.; Cui, H.; Einspahr, J.G.; Alberts, D.S.; Powis, G. Increased expression of thioredoxin-1 in human colorectal cancer is associated with decreased patient survival. J. Lab. Clin. Med. 2003, 142, 46–51. [Google Scholar] [CrossRef]
- Yao, A.; Storr, S.J.; Al-Hadyan, K.; Rahman, R.; Smith, S.; Grundy, R.; Paine, S.; Martin, S.G. Thioredoxin system protein expression is associated with poor clinical outcome in adult and paediatric gliomas and medulloblastomas. Mol. Neurobiol. 2020, 57, 2889–2901. [Google Scholar] [CrossRef] [PubMed]
- Schroder, J.; Schumacher, U.; Bockelmann, L.C. Thioredoxin interacting protein (TXNIP) is differentially expressed in human tumor samples but is absent in human tumor cell line xenografts: Implications for its use as an immunosurveillance marker. Cancers 2020, 12, 3028. [Google Scholar] [CrossRef] [PubMed]
- Gavrilov, K.; Seo, Y.-E.; Tietjen, G.T.; Cui, J.; Cheng, C.J.; Saltzman, W.M. Enhancing potency of siRNA targeting fusion genes by optimization outside of target sequence. Proc. Natl. Acad. Sci. USA 2015, 112, E6597–E6605. [Google Scholar] [CrossRef] [PubMed] [Green Version]
- Cortes, J.E.; Kim, D.W.; Pinilla-Ibarz, J.; le Coutre, P.; Paquette, R.; Chuah, C.; Nicolini, F.E.; Apperley, J.F.; Khoury, H.J.; Talpaz, M.; et al. A phase 2 trial of ponatinib in Philadelphia chromosome-positive leukemias. N. Engl. J. Med. 2013, 369, 1783–1796. [Google Scholar] [CrossRef] [Green Version]
- Talati, C.; Pinilla-Ibarz, J. Resistance in chronic myeloid leukemia: Definitions and novel therapeutic agents. Curr. Opin. Hematol. 2018, 25, 154–161. [Google Scholar] [CrossRef]
- Patel, A.B.; O’Hare, T.; Deininger, M.W. Mechanisms of resistance to ABL kinase inhibition in chronic myeloid leukemia and the development of next generation ABL kinase inhibitors. Hematol. Oncol. Clin. North. Am. 2017, 31, 589–612. [Google Scholar] [CrossRef] [PubMed]
- Tonissen, K.F.; Di Trapani, G. Thioredoxin system inhibitors as mediators of apoptosis for cancer therapy. Mol. Nutr. Food Res. 2009, 53, 87–103. [Google Scholar] [CrossRef]
- Wang, S.; Lu, Y.; Woods, K.; Di Trapani, G.; Tonissen, K.F. Investigating the thioredoxin and glutathione systems’ response in lymphoma cells after treatment with [Au(d2pype)2]CL. Antioxidants 2021, 10, 104. [Google Scholar] [CrossRef]
- Bhatia, M.; McGrath, K.L.; Di Trapani, G.; Charoentong, P.; Shah, F.; King, M.M.; Clarke, F.M.; Tonissen, K.F. The thioredoxin system in breast cancer cell invasion and migration. Redox Biol. 2016, 8, 68–78. [Google Scholar] [CrossRef]
- Karlenius, T.C.; Tonissen, K.F. Thioredoxin and cancer: A role for thioredoxin in all states of tumor oxygenation. Cancers 2010, 2, 209–232. [Google Scholar] [CrossRef] [PubMed] [Green Version]
- Zhang, P.; Gao, J.; Wang, X.; Wen, W.; Yang, H.; Tian, Y.; Liu, N.; Wang, Z.; Liu, H.; Zhang, Y.; et al. A novel indication of thioredoxin-interacting protein as a tumor suppressor gene in malignant glioma. Oncol. Lett. 2017, 14, 2053–2058. [Google Scholar] [CrossRef] [Green Version]
- Morrison, J.A.; Pike, L.A.; Sams, S.B.; Sharma, V.; Zhou, Q.; Severson, J.J.; Tan, A.C.; Wood, W.M.; Haugen, B.R. Thioredoxin interacting protein (TXNIP) is a novel tumor suppressor in thyroid cancer. Mol. Cancer 2014, 13, 62. [Google Scholar] [CrossRef] [Green Version]
- Veach, D.R.; Namavari, M.; Pillarsetty, N.; Santos, E.B.; Beresten-Kochetkov, T.; Lambek, C.; Punzalan, B.J.; Antczak, C.; Smith-Jones, P.M.; Djaballah, H.; et al. Synthesis and biological evaluation of a fluorine-18 derivative of dasatinib. J. Med. Chem. 2007, 50, 5853–5857. [Google Scholar] [CrossRef]
- Lu, L.; Kok, C.H.; Saunders, V.A.; Wang, J.; McLean, J.A.; Hughes, T.P.; White, D.L. Modelling ponatinib resistance in tyrosine kinase inhibitor-naive and dasatinib resistant BCR-ABL1+ cell lines. Oncotarget 2018, 9, 34735–34747. [Google Scholar] [CrossRef] [PubMed] [Green Version]
- Xu, W.; Wei, W.; Yu, Q.; Wu, C.; Ye, C.; Wu, Y.; Yan, H. Arsenic trioxide and bortezomib interact synergistically to induce apoptosis in chronic myelogenous leukemia cells resistant to imatinib mesylate through Bcr/Abldependent mechanisms. Mol. Med. Rep. 2014, 10, 1519–1524. [Google Scholar] [CrossRef] [PubMed]
- Clarke, C.J.; Holyoake, T.L. Preclinical approaches in chronic myeloid leukemia: From cells to systems. Exp. Hematol. 2017, 47, 13–23. [Google Scholar] [CrossRef] [PubMed] [Green Version]
- Yandim, M.K.; Ceylan, C.; Elmas, E.; Baran, Y. A molecular and biophysical comparison of macromolecular changes in imatinib-sensitive and imatinib-resistant K562 cells exposed to ponatinib. Tumour Biol. 2016, 37, 2365–2378. [Google Scholar] [CrossRef] [PubMed] [Green Version]
- Gamas, P.; Marchetti, S.; Puissant, A.; Grosso, S.; Jacquel, A.; Colosetti, P.; Pasquet, J.M.; Mahon, F.X.; Cassuto, J.P.; Auberger, P. Inhibition of imatinib-mediated apoptosis by the caspase-cleaved form of the tyrosine kinase Lyn in chronic myelogenous leukemia cells. Leukemia 2009, 23, 1500–1506. [Google Scholar] [CrossRef]
- Kim, S.H.; Kim, M.O.; Kim, K.R. Anti-growth effects of Imatinib and GNF5 via regulation of Skp2 in human hepatocellular carcinoma cells. J. Cancer Prev. 2018, 23, 170–175. [Google Scholar] [CrossRef]
- Liu, J.; Zhang, Y.; Liu, A.; Wang, J.; Li, L.; Chen, X.; Gao, X.; Xue, Y.; Zhang, X.; Liu, Y. Distinct dasatinib-induced mechanisms of apoptotic response and exosome release in imatinib-resistant human chronic myeloid leukemia cells. Int. J. Mol. Sci. 2016, 17, 531. [Google Scholar] [CrossRef] [PubMed] [Green Version]
- Tan, S.N.; Sim, S.P.; Khoo, A.S. Potential role of oxidative stress-induced apoptosis in mediating chromosomal rearrangements in nasopharyngeal carcinoma. Cell Biosci. 2016, 6, 35. [Google Scholar] [CrossRef] [Green Version]
- Ryter, S.W.; Kim, H.P.; Hoetzel, A.; Park, J.W.; Nakahira, K.; Wang, X.; Choi, A.M. Mechanisms of cell death in oxidative stress. Antioxid. Redox Signal. 2007, 9, 49–89. [Google Scholar] [CrossRef]
- Redza-Dutordoir, M.; Averill-Bates, D.A. Activation of apoptosis signalling pathways by reactive oxygen species. Biochim. Biophys. Acta 2016, 1863, 2977–2992. [Google Scholar] [CrossRef] [PubMed]
- Sattler, M.; Verma, S.; Shrikhande, G.; Byrne, C.H.; Pride, Y.B.; Winkler, T.; Greenfield, E.A.; Salgia, R.; Griffin, J.D. The BCR/ABL tyrosine kinase induces production of reactive oxygen species in hematopoietic cells. J. Biol. Chem. 2000, 275, 24273–24278. [Google Scholar] [CrossRef] [Green Version]
- Alhawiti, N.M.; Al Mahri, S.; Aziz, M.A.; Malik, S.S.; Mohammad, S. TXNIP in metabolic regulation: Physiological role and therapeutic outlook. Curr. Drug Targets 2017, 18, 1095–1103. [Google Scholar] [CrossRef] [Green Version]
- Gomez-Samano, M.A.; Baquerizo-Burgos, J.E.; Coronel, M.F.C.; Wong-Campoverde, B.D.; Villanueva-Martinez, F.; Molina-Botello, D.; Avila-Rojo, J.A.; Palacios-Baez, L.; Cuevas-Ramos, D.; Gomez-Perez, F.J.; et al. Effect of imatinib on plasma glucose concentration in subjects with chronic myeloid leukemia and gastrointestinal stromal tumor. BMC Endocr. Disord. 2018, 18, 77. [Google Scholar] [CrossRef]
- Black, A.R.; Black, J.D. Protein kinase C signaling and cell cycle regulation. Front. Immunol. 2012, 3, 423. [Google Scholar] [CrossRef] [Green Version]
- Huang, H.C.; Nguyen, T.; Pickett, C.B. Phosphorylation of NRF2 at Ser-40 by protein kinase C regulates antioxidant response element-mediated transcription. J. Biol. Chem. 2002, 277, 42769–42774. [Google Scholar] [CrossRef] [Green Version]
- Roy, M.; Sarkar, R.; Mukherjee, A.; Mukherjee, S. Inhibition of crosstalk between Bcr-Abl and PKC signaling by PEITC, augments imatinib sensitivity in chronic myelogenous leukemia cells. Chem. Biol. Interact. 2015, 242, 195–201. [Google Scholar] [CrossRef] [PubMed]
- Hickey, F.B.; England, K.; Cotter, T.G. Bcr-Abl regulates osteopontin transcription via Ras, PI-3K, aPKC, Raf-1, and MEK. J. Leukoc. Biol. 2005, 78, 289–300. [Google Scholar] [CrossRef] [Green Version]
Figure 1.
The mRNA expression of the TRX system in cancerous and non-cancerous cells. RNAseq data from the GSE100026 database were used to measure expression levels of TRX1 (A) and TXNIP (B) in healthy, chronic phase and blast crisis patients. Gene expression is displayed as reads per kilobase of transcript per million mapped reads (RPKM). One-way ANOVAs were used to compare results between CML patients and healthy donors. Results are displayed as RPKM, N = 5. The mRNA expression levels of TRX1 and TXNIP were measured in PBMCs and in K562, KU812 and KCL22 CML cells using RT-qPCR (C). RPL32 was used to normalize mRNA levels. One-way ANOVAs with a Dunnett’s post hoc test were used to compare expression of each gene in the PBMCs to that of each of the three CML cell lines, N = 3. Values displayed as mean ± SEM. Significant results are denoted with an * (* = p < 0.05, ** = p < 0.01, ## = p < 0.0001).

Figure 2.
TKIs induce apoptosis in CML cells. K562, KU812 and KCL22 CML cells were treated with either imatinib (A–C), dasatinib (D–F) or ponatinib (G–I) for 24 h or GNF-5 (J–L) for 48 h. Following this, caspase-3 activity assays were performed and these data are displayed in the figure. Results were analyzed via one-way ANOVAs with a Dunnett’s post hoc test. Statistical tests compared results between the treated cells and the untreated control. * = p < 0.05, ** = p < 0.01, # = p < 0.001. n = 3. Values displayed as mean ± SEM.

Figure 3.
TKIs increase ROS levels in CML cells. K562, KU812 and KCL22 CML cells were treated with either imatinib (A–C), dasatinib (D–F), ponatinib (G–I) or GNF-5 (J–L) for 24, 48 or 72 h. Following this, ROS level assays were performed and these data are displayed in the figure. Results were analyzed via one-way ANOVAs with a Dunnett’s post hoc test. Statistical tests compared results between the treated cells and the untreated control. * = p < 0.05, ** = p < 0.01, # = p<0.001, ## = p < 0.0001. n = 3. Values displayed as mean ± SEM.

Figure 4.
TKIs decrease TRXR activity in CML cells. K562, KU812 and KCL22 CML cells were treated with either imatinib, dasatinib, ponatinib or GNF-5 for 72 h followed by TRXR activity assays. K562 cells were treated with 0.5 µM imatinib, 5 nM dasatinib, 10 nM ponatinib and 1 µM GNF-5. KU812 cells were treated with 0.25 µM imatinib, 1 nM dasatinib, 5 nM ponatinib and 1 µM GNF-5. KCL22 cells were treated with 0.25 µM imatinib, 5 nM dasatinib, 10 nM ponatinib and 0.5 µM GNF-5. Results were analyzed via one-way ANOVAs with a Dunnett’s post hoc test. Statistical tests compared results between the treated cells and the untreated control for each cell line. * = p < 0.05, ** = p < 0.01, ## = p < 0.0001. n = 3. Values displayed as mean ± SEM.

Figure 5.
TKIs affect the mRNA expression levels of components of the TRX system. K562, KU812 and KCL22 CML cells were treated with either imatinib (A–C), ponatinib (D–F) or GNF-5 (G–I) for 3, 24 or 48 h. Following this, RT-qPCR was performed and measured the mRNA expression of NRF2, TRX1, TRXR1 and TXNIP. RPL32 was used as a normalizer. Results were analyzed via one-way ANOVAs with a Dunnett’s post hoc test. Statistical tests compared results between the treated cells and the untreated control for each cell line. * = p < 0.05, ** = p < 0.01, # = p < 0.001, ## = p < 0.0001. n = 3. Values displayed as mean ± SEM.

Figure 6.
TKIs affect the protein expression levels of components of the TRX system. K562 (A), KU812 (B) and KCL22 (C) CML cells were treated with either imatinib or GNF-5 for 72 h. Following this, Western blotting was used to measure TRX1 and TRXR1 protein levels. Densitometry analysis of Western blots is displayed as mean ± SD and was statistically analyzed via paired t tests. Vinculin was used as a loading control. * = p < 0.05, ** = p < 0.01, # = p < 0.001, ## = p < 0.0001. n = 3.

Figure 7.
BCR-ABL knockdown results in a decrease in TRXR activity and mRNA expression. K562 CML cells were transfected with either BCR-ABL1 or scrambled siRNA and Western blotting (A) was performed after 5 days incubation following transfection to measure BCR-ABL protein levels. Densitometry analysis of Western blots is displayed as mean ± SD and was statistically analyzed via paired t tests. Β-tubulin was used as a loading control. The displayed Western blot is representative of three repeats. Furthermore, transfected cells were incubated for three days and then either TRXR activity assays (B) or RT-qPCR (C) were performed. RT-qPCR was used to measure the mRNA expression levels of BCR-ABL1, NRF2, TRX1, TRXR1 and TXNIP. RPL32 was used as a normalizer of mRNA levels. TRXR activity results were analyzed via a paired T-test and RT-qPCR data were analyzed via one-way ANOVAs with a Dunnett’s post hoc test. Statistical tests compared results between the BCR-ABL1 siRNA transfected cells and the scrambled siRNA transfected cells. * = p < 0.05, ** = p < 0.01. n = 3. Values displayed as mean ± SEM.

Figure 8.
BCR-ABL induces cell death through the TRX system. Inhibition of BCR-ABL by TKIs resulted in a decrease in the expression and activity of the TRX system, likely through the action of PKC. BCR-ABL was shown to activate PKC [44,45], which is a known regulator of NRF2 [12]. The lower activity levels of the TRX system resulted in an increase in ROS, which can lead to apoptosis through a range of mechanisms, including direct damage to DNA, lipids and proteins and the activation of cell death pathways, such as the ASK1 pathway.


Table 1.
The IC50 values of imatinib, dasatinib, ponatinib and GNF-5 in three CML cell lines.
| K562 | KU812 | KCL22 | ||||
|---|---|---|---|---|---|---|
| 24 h | 48 h | 24 h | 48 h | 24 h | 48 h | |
| Imatinib | >2 µM | 0.3 µM | 0.4 µM | 0.3 µM | 0.5 µM | 0.3 µM |
| Dasatinib | >50 nM | 7.5 nM | 1 nM | 1 nM | 17.5 nM | 7.5 nM |
| Ponatinib | >200 nM | 30 nM | 7.5 nM | 5 nM | 30 nM | 20 nM |
| GNF-5 | 5 µM | 1.5 µM | >5 µM | 1 µM | 0.8 µM | 0.5 µM |
Publisher’s Note: MDPI stays neutral with regard to jurisdictional claims in published maps and institutional affiliations. |
© 2021 by the authors. Licensee MDPI, Basel, Switzerland. This article is an open access article distributed under the terms and conditions of the Creative Commons Attribution (CC BY) license (https://creativecommons.org/licenses/by/4.0/).
Share and Cite
MDPI and ACS Style
Clapper, E.; Di Trapani, G.; Tonissen, K.F. The Effect of BCR-ABL Specific Tyrosine Kinase Inhibitors on the Thioredoxin System in Chronic Myeloid Leukemia. Hemato 2021, 2, 237-254. https://0-doi-org.brum.beds.ac.uk/10.3390/hemato2020014
AMA Style
Clapper E, Di Trapani G, Tonissen KF. The Effect of BCR-ABL Specific Tyrosine Kinase Inhibitors on the Thioredoxin System in Chronic Myeloid Leukemia. Hemato. 2021; 2(2):237-254. https://0-doi-org.brum.beds.ac.uk/10.3390/hemato2020014
Chicago/Turabian StyleClapper, Erin, Giovanna Di Trapani, and Kathryn F. Tonissen. 2021. "The Effect of BCR-ABL Specific Tyrosine Kinase Inhibitors on the Thioredoxin System in Chronic Myeloid Leukemia" Hemato 2, no. 2: 237-254. https://0-doi-org.brum.beds.ac.uk/10.3390/hemato2020014