Article

A Score for Predicting Freedom from Progression of Children and Adolescents with Hodgkin Lymphoma

by
Valli De Re
1,*,
Laura Caggiari
1,
Maurizio Mascarin
2,
Mariangela De Zorzi
1,
Caterina Elia
2,
Ombretta Repetto
1,
Lara Mussolin
3,
Marta Pillon
3,
Paola Muggeo
4,
Salvatore Buffardi
5,
Maurizio Bianchi
6,
Alessandra Sala
7,
Luciana Vinti
8,
Piero Farruggia
9,
Elena Facchini
10,
Egesta Lopci
11,
Emanuele S. G. d’Amore
12,
Roberta Burnelli
13 and
with the A.I.E.O.P. Consortium
1
Immunopathology and Cancer Biomarkers—Bio-Proteomics Facility, CRO Aviano National Cancer Institute, 33081 Aviano, Italy
2
Centro di Riferimento Oncologico di Aviano (CRO), AYA Oncology and Pediatric Radiotherapy Unit, IRCCS, 33081 Aviano, Italy
3
Pediatric Hemato-Oncology Clinic, Department of Women’s and Children’s Health, Institute of Pediatric Research—Fondazione Città Della Speranza, University of Padua, 35127 Padua, Italy
4
Department of Pediatric Hemato-Oncology, University of Bari, 70124 Bari, Italy
5
Pediatric Hemato-Oncology Department, Santobono-Pausilipon Children’s Hospital, 80122 Naples, Italy
6
Pediatric Onco-Hematology and Stem Cell Transplant Division, City of Health and Science, Regina Margherita Children’s Hospital, 10126 Turin, Italy
7
Department of Pediatrics, Ospedale San Gerardo, University of Milano-Bicocca, Fondazione MBBM, 20900 Monza, Italy
8
Department of Pediatric Hemato-Oncology, IRCCS Ospedale Bambino Gesù, 00165 Rome, Italy
9
Department of Pediatric Hemato-Oncology, ARNAS Ospedali Civico, G Di Cristina, 90127 Palermo, Italy
10
Pediatric Hemato-Oncology Unit, Policlinico S. Orsola Malpighi, 40138 Bologna, Italy
11
Department of Nuclear Medicine, Humanitas Hospital, 20089 Milan, Italy
12
Department of Pathology, San Bortolo Hospital, 36100 Vicenza, Italy
13
Pediatric Oncology, University Hospital, Sant’Anna Hospital, 44124 Ferrara, Italy
*
Author to whom correspondence should be addressed.
Membership of the A.I.E.O.P. Study Group is provided in the Acknowledgments.
Submission received: 20 April 2021 / Revised: 7 May 2021 / Accepted: 10 May 2021 / Published: 13 May 2021
(This article belongs to the Section Lymphomas)

Abstract

:
Several studies have examined the prognostic performance of therapeutic groups (TG) and early responses to therapy on positron emission tomography/computed tomography (PET/CT) in children and adolescents with classical Hodgkin lymphoma (cHL); less research has been performed on molecular parameters at diagnosis. The aim of the present study was to devise a scoring system based on the TG criteria for predicting freedom from progression (FFP) in 133 patients: 63.2% males; 14 years median age (interquartile range (IQR) 11.9–15.1); with cHL (108 nodular sclerosis (NS) subtype) treated according to the AIEOP LH-2004 protocol; and median 5.55 (IQR 4.09–7.93) years of follow-up. CHL progressed or relapsed in 37 patients (27.8%), the median FFP was 0.89 years (IQR = 0.59–1.54), and 14 patients (10.5%) died. The FPR (final prognostic rank) model associates the biological HLA-G SNP 3027C/A (numerical point assigned (pt) = 1) and absolute neutrophil count (>8 × 10⁹/L, pt = 2) as variables with the TG (TG3, pt = 3). Results of FPR score analyses for FFP suggested that FPR model (Kaplan–Meier curves, log-rank test for trends) was better than the TG model. At diagnosis, high-risk patients classified at FPR rank 4 and 5 identified 18/22 patients who relapse during the follow-up.

1. Introduction

In the AIEOP LH-2004 protocol’s de-escalation of chemoradiotherapy for pediatric and adolescent Hodgkin lymphoma (cHL), risk stratification for patients at higher risk of disease progression or relapse became fundamental to identify candidates for less intensive treatment. Using the current standard of care for pediatric/adolescent cHL, patients allocated to three treatment groups (TG) with both the number of cycles and the addition of radiotherapy depending on the stage, and the computed tomography and positron emission tomography (PET)-guided response assessments [1,2]. TG1 included stage IA or IIA without bulky mediastinal disease or pulmonary hilar lymph node involvement and less than four positive lymph node regions. TG3 included patients considered to be at Ann Arbor stage IIIB or stage IV, or bulky mediastinal disease, whatever the stage. Patients not meeting the criteria for either TG1 or TG3 were included in TG2. Patients were then sub-classified as A or B based on whether or not they had an unexplained fever (temperature above 38 °C), and/or weight loss (>10% over six months), and/or night sweats. Allocation to a TG was followed by restaging with PET/CT [2]. Patients assigned to TG1 received three courses of ABVD (doxorubicin, bleomycin, vinblastine, dacarbazine). Patients in TG2 received four courses of COPP (cyclophosphamide, vincristine, procarbazine, prednisone)/ABV, plus two cycles of IEP (ifosfamide, etoposide, and prednisone) for patients with a partial response (PR). Patients in TG3 received up to six courses of COPP/ABV if they achieved a complete response (CR). In the case of a PR, TG3 patients received two additional courses of IEP + RT depending on their response quality. RT was administered to the nodal regions involved, delivering from 14.4 Gy in patients who obtained a CR and 25.2 Gy in those obtaining a PR at the end of chemotherapy. Patients classified as low risk (TG1) and with a CR at the end of their chemotherapy omitted RT [1,3]. Although the outcomes were excellent, with a >10-year freedom-from-progression (FFP) rate of 72.18% and overall survival (OS) of 89.47% in our series, some patients’ diseases progressed or relapsed. These outcomes required that other prognostic indicators plus TG might be needed to optimize the treatment. However, at present few studies had examined molecular and laboratory parameters available at diagnosis to personalize the therapy before the interim response to therapy on PET/CT in children and adolescents with cHL.
We recently found an association between the biological factor HLA-G+3027 C>A single nucleotide polymorphism (SNP) and a shorter FFP in LH-2004 patients [4]. In this study, considering a longer follow-up (median 6.37 instead of the previous 2.95 years) and 66 additional patients, we have developed a molecular algorithm named FPR (final prognostic rank) that combines the biological HLA-G+3027 SNP and other hematological/biochemical markers with the TG criteria. This FPR model would help clinicians in selecting the best initial treatment for their patients before PET/CT evaluation.

2. Materials and Methods

2.1. Study Cohorts

We analyzed 133 patients with HL aged 13 ± SEM 0.32 (range 3 to 18) years, treated according to the AIEOP LH-2004 between 2004 and 2017 [1]. AIEOP’s HL Study Group, and the ethics committee at the Azienda Ospedaliera di Bologna, Policlinico San Orsola-Malpighi (n°20/2004/0) approved the study protocol. The parents or legal guardians of all patients gave written informed consent.
Ethics Statement: This study was carried out in strict accordance with the principles expressed in the Declaration of Helsinki. It was approved by the ethics committee of the Azienda Ospedaliera di Bologna, Policlinico San Orsola-Malpighi (protocol No. 20/2004/0) and by the ethics committees of all participating institutions: Centro di Riferimento Oncologico di Aviano, Prot. N°206/D; Azienda Ospedaliera Spedali Civili di Brescia, Prof. Francesco De Ferrari, seduta del 13/09/2005; Azienda U.S.L. N.8 Cagliari Prot. N°146/CE/04; Comitato di etica per la ricerca scientifica biomedica, per la buona pratica clinica e per la sperimentazione dei farmaci, Dott. Ubaldo Rosati, approved pt 12 all’O.d.g. riguardo prot LH 2004, in data 15/07/2004; Comitato etico Provinciale di Modena, Pratica n°53144/04; Servizio Sanitario Nazionale Azienda Ospedaliera di rilievo Nazionale, ”Santobono-Pausillipon” Delibera del Direttore Generale N°422 del 16.06.2005; Second universit‘a degli Studi di Napoli, Prot. N°624 del 16.12.2004; dell’Azienda di Rilievo56Nazionale e di Alta Specializzazione Ospedale Civico e Benfratelli, G.Di Cristina e57M.Ascoli—Palermo, Reg. Sper. N°56/1 del 04/05/2004; Comitato Etico Indipendente58(IRB/IEC), Prot. N°23219 del 23/09/2004; Azienda Ospedaliera Pisana Comitato di Bioetica, Studio n°1888/2005; Comitato Etico per la Sperimentazione Clinica della Provincia di Padova, codice studio CE 908P.
The inclusion criteria required biological samples for genetic analysis of HLA-G SNP, a set of hematological and biochemical parameters (i.e., erythrocyte sedimentation rate, albumin, ferritin, hemoglobin, white blood cell (WBC) count, neutrophils, eosinophils, basophils, lymphocytes, monocytes, and platelets); TG groups; World Health Organization (WHO) histological classification of HL (i.e., HD of unclassifiable subtype; MC, mixed cellularity; LRCHL, lymphocyte-rich cHL; NS, nodular sclerosis); sex; and age. Compared with our previous report on HLA-G SNP [4], the present study concerns a median follow-up about three years longer (median 5.55 years (interquartile range (IQR) 4.09–7.93)), 66 new cases, and hematological and biochemical parameters. Among the 133 patients considered, 37 had a progressive or relapsing disease (27.8%), and 14 died (10.53%) during the follow-up period. Table 1 reports the characteristics of the patients.

2.2. Study Design

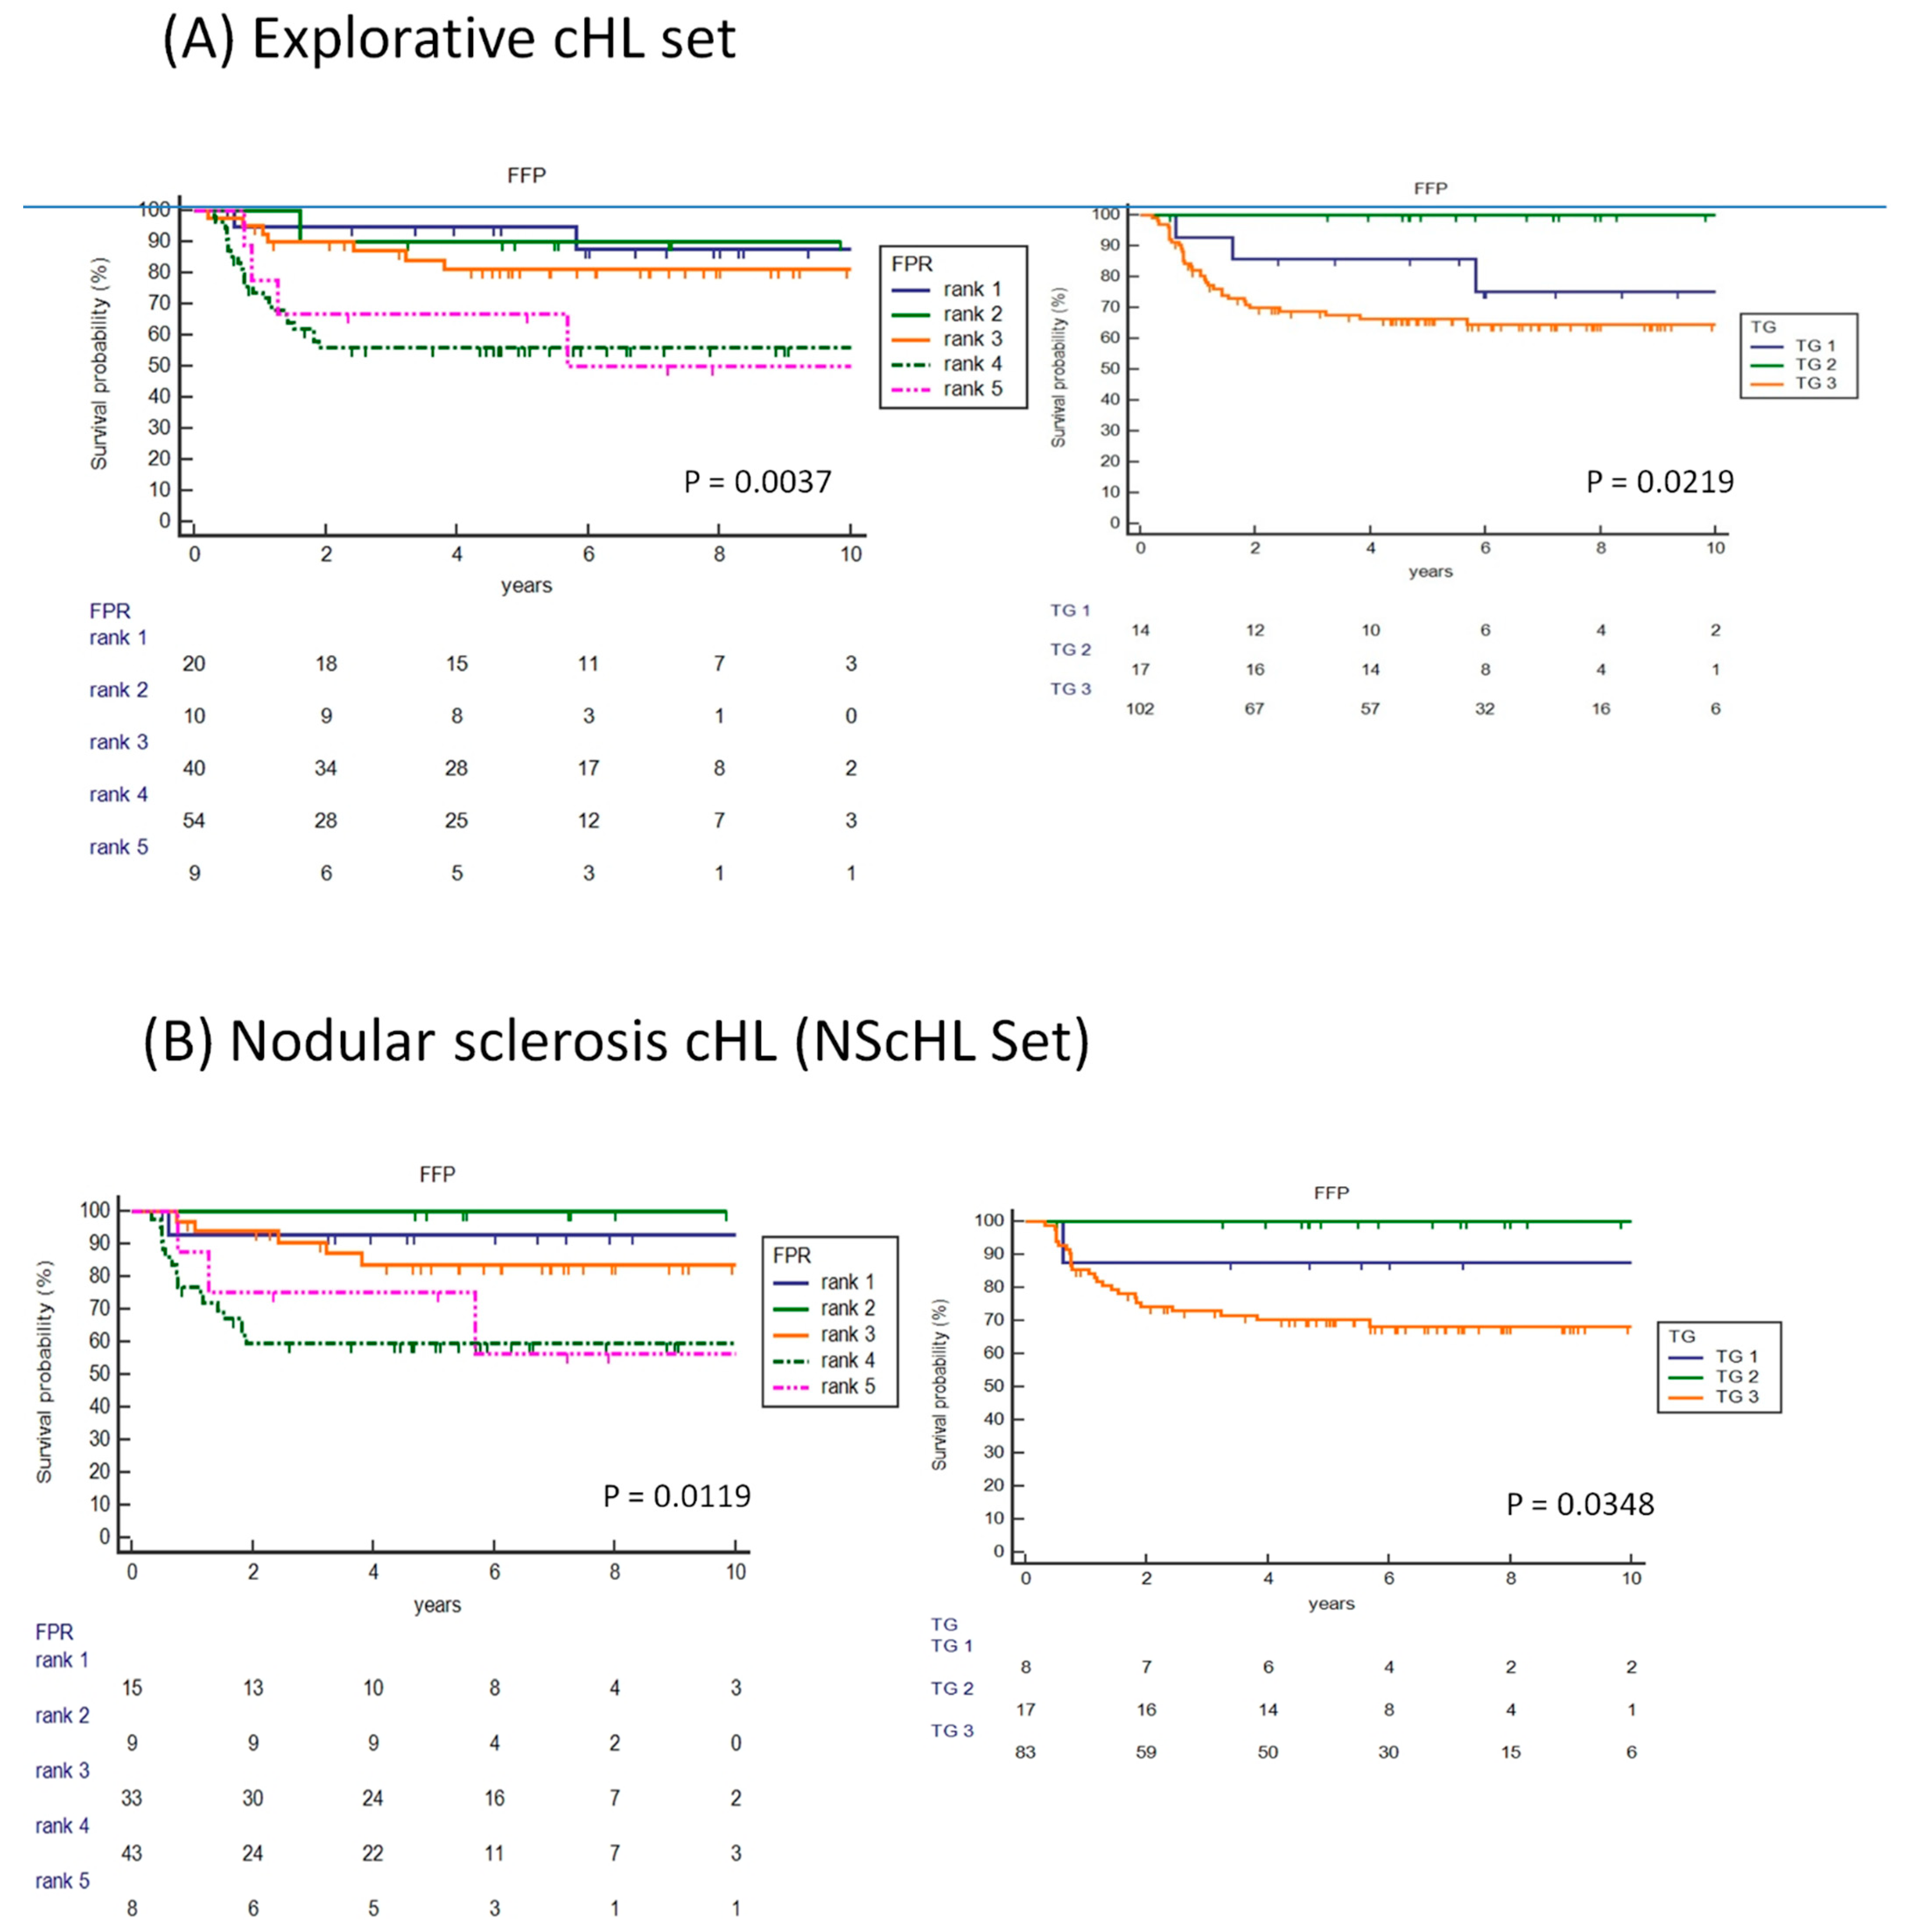
The study included four steps: (1) develop the FPR score pooling for FFP; (2) assess the FPR algorithm overall for the 133 patients with HL (explorative set) and in the 108 histological NS-restricted cHL patients (NS-set); (3) compare the assigned FPR and TG data for FFP in the explorative cHL and NScHL sets; and (4) apply the FPR scoring system to patients’ OS, and interim PET/CT response in the setting of cHL with the NS histotype.
For the first step, we performed an early comparison of receiver operating characteristic (ROC) curve analysis using age and hematological/biochemical data as variables at diagnosis to select the best condition associated with PD/R and its cutoff value corresponding to the highest chi-square.
Supplementary Figure S1 resumes the design of the study.

2.3. Clinical Trial Registration Information

AIEOP’s HL Study Group, and the ethics committee at the Azienda Ospedaliera di Bologna, Policlinico San Orsola-Malpighi (n°20/2004/0) approved the study protocol.

2.4. HLA-G Genotyping

Genomic DNA was extracted from peripheral blood using the DNeasy kit (Qiagen). The 3′-UTR of the HLA-G gene was then amplified by PCR using the following specific primer 50-TGTGAAACAGCTGCCCTGTGT-30, and reverse 50-GTCTTCCATTTATTTTGTCTCT-30 [5]. We used the Direct BigDye Terminator sequencing to sequence the amplification products. The data were analyzed using the Assign SBT software version 3.27b (Conexio Genomics, Fremantle, Australia) [6]. For every single individual, we annotated the polymorphic sites.

2.5. Endpoints and Statistical Analysis

The primary endpoint was the period of FFP, defined as the time relapsing between the date of diagnosis and that of disease progression or relapse, or the latest follow-up for patients with no recurrent disease. Patients were stratified using TG and the FPR scoring system and used in the Kaplan–Meier analysis.
Response to therapy was defined as complete (CR) when there was no clinical, radiological (ultrasound or CT), or radio-isotopic evidence of disease after three cycles of chemotherapy (TG1) or after four cycles of chemotherapy (TG2/TG3). Complete response (CR) was defined as the absence of clinical, radiological (ultrasound and CT scan evaluation), and radio-isotopic evidence of disease. Bulky mediastinal involvement was considered in CR with a reduction of ≥75% of the volume and negative Gallium scan or 18FDG-PET. Partial response (PR) was defined as an incomplete tumor volumetric reduction. Progressive disease (PD) was defined as disease progression during first-line chemotherapy or within three months from stopping therapy. Criteria were either an increase in tumor size in previously involved sites and/or involvement of a new site. Relapse (R) was defined as a pathologically confirmed recurrence of HL after three months from stopping therapy. Patients who survived were censored at the date of their latest follow-up.
We used the Shapiro–Wilk test to check for the normality of the continuous variables distribution and the non-parametric Mann–Whitney test to see if two independent samples derived from the same population. To identify the best variables associated with PD/R, we used the comparison of ROC curves. ROC curve analysis determined the best cutoff for the variable. The laboratory/hematological variable showing the highest ROC AUC was entered in the FFP Cox’s regression model with the TG number and the HLA-G SNP, using a backward selection. In the FPR multivariate model, the hazard ratios of each variable identified the weights for each variable. Subjects in the overall samples were categorized into five risk strata (rank 1 to rank 5) using FPR total points. Kaplan–Meier analyses using the FPR ranks and TG groups showed the FFP and OS survival distribution; the chi-squared test established the FPR model efficacy for tumor response on interim PET/CT evaluation (MedCalc statistical software version 19.0.4).

2.6. Data-Sharing Statement

All patients from their parents or legal guardians gave written informed consent.
CINECA, a non-profit external consortium, collected the patient-sensitive data in a dedicated database (Professor A. Pession, protocol LH-2004, Sper. Clin. n°20/2004).

3. Results

3.1. Demographics and Clinical Details of the Studied Samples

The study enrolled 133 patients, 108 in the NScHL set. Table 1 shows the demographic and clinical characteristics of patients of the explorative cHL set and the NScHL set.
Most patients of the cHL set were in TG3 (76.7%) and had the NS histological tumor type (81.2%). About half of the patients showed an advanced stage (20.3% stage 3 and 27.8% stage 4, respectively) and B-group symptoms. The study sample’s median age at diagnosis was 14 years (in a range of 3 to 18), and the median follow-up was 6.37 [IQR 4.64-8.01] years. During the follow-up, 37 patients (27.8%) showed a progressive or a relapsed disease (PD/R), and 14 died (10.5%) in the cHL set; and 26 patients (24.1%) had a PD/R, and 10 (9.3%) died in the NScHL set.

3.2. Identification of Demographic and Hematological/Biochemical Variables Associated with cHL Progression/Relapse

Erythrocyte sedimentation rate (ESR, mm/hr), albumin (g/L), ferritin (ng/mL), hemoglobin (g/dL), white blood-cell count (WBC, 109/L), neutrophils (109/L), eosinophils (109/L), basophils (109/L), lymphocytes (109/L), monocytes (109/L), platelets (109/L), neutrophil/lymphocyte ratio (N/L), and platelet/lymphocyte ratio (P/L) were subjected to a preliminary ROC curve analysis. Comparison of ROC curves using hematological/laboratory data identified candidate predictors for PD/R (Figure 1A). Under the curves (AUC), the ROC area resulted from 123 samples, except for ESR, ferritin, eosinophils, basophils, and monocytes resulting from 89 patients (data missing in 34 patients). Among the 14 variables tested, neutrophils showed the highest AUC value (0.611, Table 2). The ROC curve for neutrophils evaluated the “best” cutoff value that maximized the risk of PD/R at 7.924 cells/mm3 (Figure 1B); we used the round-up value to 8 × 10⁹/L in the subsequent analyses.

3.3. FPR Multivariate Modeling for FFP Survival

In addition to TG and HLA-G SNP covariates previously found to be associated with a better FFP survival in cHL patients [1,4], we added the variable neutrophils to the multivariate Cox proportional-hazard regression model via the backward procedure. Thus, to perform the multivariate analysis, we included TG (group number), HLA-G SNP (C/A), and neutrophils (8 × 10⁹/L) conditions. The results showed that TG3, HLA-G C/A, and neutrophils (>8 × 10⁹/L) were independent factors negatively affecting the FFP survival curves of patients (p = 0.0037); the model excluded the TG2 variable considered not crucial to the prediction of FFP survival (Table 3). Based on the hazard-ratio of variables included in the model and reported in Table 3, we designed a risk-adapted algorithm (named FPR) as follows:
FPR = TG+V1+V2 where V indicates the two risk factors (variables (V)) reported in Table 3. The minimum and maximum scores were 0 (TG1 or TG2 without any risk factors) and 5 (TG3 with two risk factors), respectively.
Subjects in the overall samples were categorized into five risk strata using the total FPR points as follows: Rank 1 = TG1/TG2, without V risk factors (point 0). Rank 2 = TG1/TG2 with one or two V risk factors (point 1 and point 2). Rank 3 = TG3 without risk factors (point 3). Rank 4 = TG3 with at least one V risk factor (point 4 and point 5). Rank 5 = TG3 with two risk factors (point 6).

3.4. Prediction Result of FPR Model for FFP and Comparison with TG and CHIPS Models

The methods section reported the criteria of TG model used in the clinic. We calculated data resulting from every single patient. Figure 2A showed the Kaplan–Meier curves for FFP using the two different models (i.e., FPR and TG) in the cHL set. The analysis indicated FPR as the best predictive criteria for FFP (p = 0.00377) compared to TG (p = 0.0219). Patients assigned to the first two FPR ranks had a good FFP (both ranks 1 and 2 = 90% follow-up ≥9 years) and were considered at low risk compared to FPR rank 4 (57.41%) and FPR rank 5 (55.55%), which are considered to be at high risk (Figure 2A and Table 4A). On average, the FPR model was consistent with FFP survival, and the calculated hazard ratio indicated that FPR better stratified the patients than TG (Table 4A).
The NScHL set included 108 patients, of which 26 (24.07%) showed a PD/R in the follow-up. The Kaplan–Meier analysis showed a higher HR value for medium (rank 3) and high-risk groups (rank 4 and 5) using the FPR than the TG model, suggesting a better discriminative power of the FPR model (Table 4B). Figure 2A showed the FFP curves obtained in the NScHL set using the FPR and the TG models.

3.5. Molecular FPR and TG Performance in the NScHL Set

The NS histotype is the most frequent cHL histotype in adolescents; in our series, the NS subtype represented 81.2% of all cHL cases studied (108/133 cases), with a prevalence of male sex (66/108 cases, 61.8%).
As we showed using all cHL subtypes, the molecular FPR algorithm discriminated risk for PD/R in the histological NS subtype. FFP survival, in the low-risk ranks 1 and 2 was 93.33% and 100% respectively—better compared to 84.47% in the medium-risk rank 3 (HR 2.27), and furthermore 67.36% and 62.50% in the high-risk groups (rank 4, HR 6.95 and rank 5, HR 5.80, respectively) (Figure 2B). Compared to the TG system, FFP survival was 87.50% in low-risk TG1, 100% in the medium-risk TG2, and 69.88% in the high-risk TG3 group (HR 2.62).
Figure 3 shows the FFP survival curves of histological NS subtype in the different sex classes. Among both the sexes, FFP survival curves were better defined using the FFP model than the TG model (p = 0.0349–p = 0.0179 and p = 0.430–p = 0.0714, for the FFP model and TG model, respectively).

3.6. Comparative FPR and TG Kaplan–Meier Curves for OS

We assessed the effectiveness of the FPR and TG scoring system for OS in the NScHL set (Figure 4). In both systems, the performance showed a good trend, although the curves did not reach a statistically significant difference in survival (p = 0.0626, and p = 0.1955, in the FPR-based and TG-based models, respectively).

3.7. Comparison among the Predictive Models for Treatment Response of FPR, TG, and the Interim PET/CT Scanning

We compared the predictive value at diagnosis of FPR and TG models according to the observed interim response to treatment (PET/CT response assessment). Data were grouped according to PET-positive assessment (residual tumor mass) and PET-negative response (disappearance of tumor) after two or four, depending on the TG stage, cycles of chemotherapy [2]. Table 5A shows PET-assessment distribution according to FPR-based and TG-based groups. Data were available from 94 patients; 14 patients missed PET data because the scan assessment was not performed at the beginning of the enrollment (the year 2004). Both the FPR and TG models showed a good concordance with interim PET/CT scan assessment.
During the follow-up, after adjusted therapy based on PET-evaluation, 22 patients showed a tumor relapse. The FPR model classified patients with relapse in 4 cases (18.18%) in the intermediate-risk group and in 18 cases (81.82%) in the high-risk groups. PET assessment identified 15 of the 22 relapsed cases (PET-positive 68.18%). Table 5B reported FPR and PET sensitivity, specificity, positive predictive value, negative predictive value, and accuracy. Table 5C compared data by combining both the intermediate- and the high-risk groups.

4. Discussion

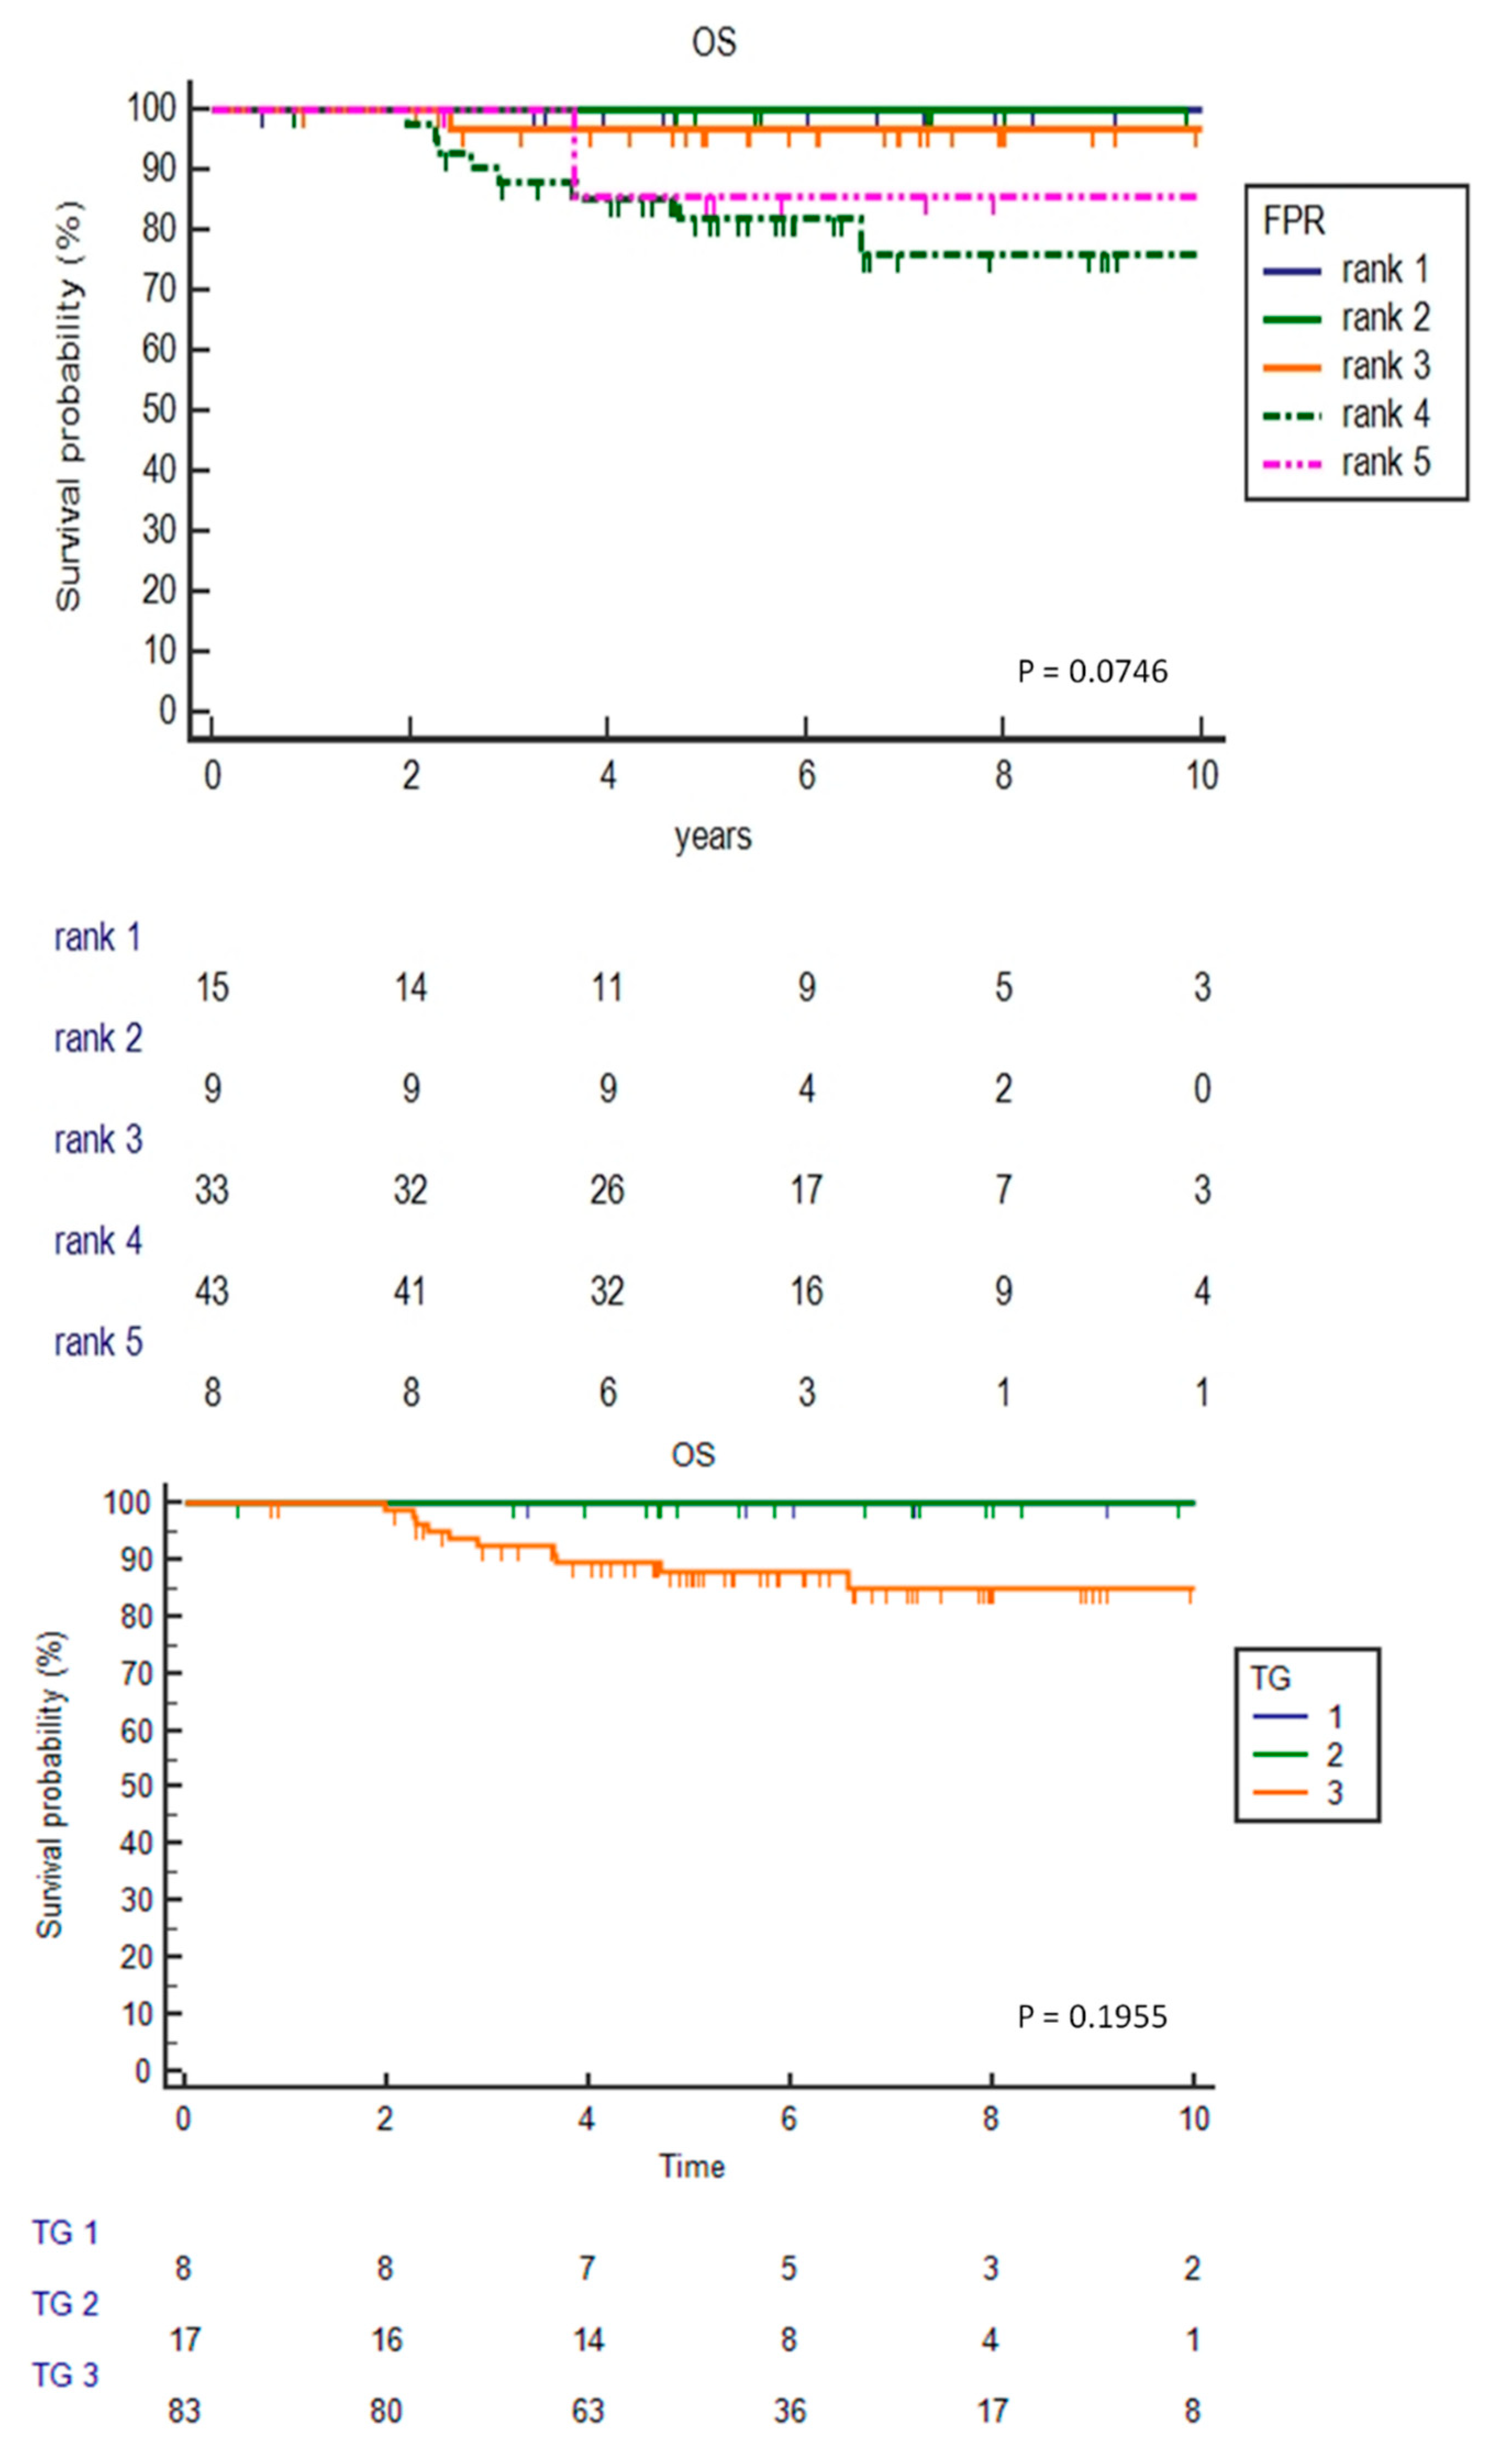
In the present study, we assessed the prognostic factors and outcomes of young (<18 years old) patients with a cHL treated with the AIEOP LH2004 protocol. In addition to the TG criteria used, the proposed PRF model included two additional variables obtained at the diagnosis time: HLA-G+3027 C>A genotype and absolute neutrophil count (>8 × 10⁹/L). These factors revealed a significant adverse prognostic value in terms of FFP, a tendency with a quite significant effect on overall survival, and a potential improvement in high-risk groups (rank 4 and rank 5) to determine the relapse during the follow-up compared to PET-scan assessment.
To our knowledge, this is the first report to highlight the value of associating a hematological factor and a biological HLA-G SNP factor with TG to guide a risk-adapted treatment. When comparing the Kaplan–Meier curves for FFP obtained using the two different models (PRF and TG), the PRF model resulted in the best predictive model in both the cHL and the NScHL sets (Figure 2A,B). Neutrophil count >8 × 10⁹/L indicates neutrophilia, a condition frequently present in cHL [7,8]. Neutrophilia usually increases during acute inflammation, and thus in cHL, this condition could reflect a systemic inflammatory response, which is considered an important component of tumor progression [9,10]. Moreover, neutrophils are involved in the immune response, as an important part of the tumor microenvironment, which plays a central role in cHL pathogenesis [11,12,13]. Neutrophil counts and neutrophil/lymphocyte ratio (NLR) have been proposed as prognostic factors in several solid and hematological tumors, including adults with cHL [14,15,16,17,18,19,20]. A recent study demonstrated that NLR could predict clinical outcomes in PET-negative adult patients with cHL [21].
The pathogenic hypothesis is that the main enzymes secreted by neutrophils, in particular arginase and collagenase/gelatinase, may have a role in tumor immune escape and growth. Arginase has a potent immunosuppressive effect on tumor-infiltrating T-cells by reducing the arginine availability in the micro-ambient conditions necessary for cytotoxic T-cells function and proliferation [8,22,23,24,25]. Gelatinase is a proteolytically active metalloproteinase (MMP) capable of degrading the extracellular matrix constituents and the basement membrane, contributing to tumor growth, angiogenesis, and metastasis [26]. Indeed, abnormally high levels of gelatinase are reported associated with poor prognosis in several cancers [27,28]. Neutrophil gelatinase was also found to affects immune response in healthy donors by inducing an HLA-G+-mediate regulatory T-cell proliferation [29].
FRP score incorporated a biological factor, i.e., the HLA-G SNP, to potentiate the TG-guided therapies. A functional role of HLA-G had yet to be demonstrated, although previously an association with cHL prognosis has been reported [30]. The HLA-G+3027 A variant, which only occurs in the HLA-G 3′-UTR 7 haplotype, is a sequence-dependent macromolecular variant able to reduce HLA-G mRNA expression through interaction with specific cellular miRNA [31,32,33,34]. An interaction between released HLA-G molecules and their ILT leukocyte receptors present on the hematological cells had been hypothesized to produce the reduction of the cell proliferation in hematopoietic malignancy [35,36]. Moreover, HLA-G molecules may condition the tumor microenvironment’s nature, thus inhibiting the proliferation and activity of immune cells present in the tumor microenvironment and probably involved in the cHL growth [37,38]. Some sexual hormones like β-estradiol, progesterone, and prolactin as well as glucocorticoids (dexamethasone, hydrocortisone) may influence HLA-G transcription [39,40,
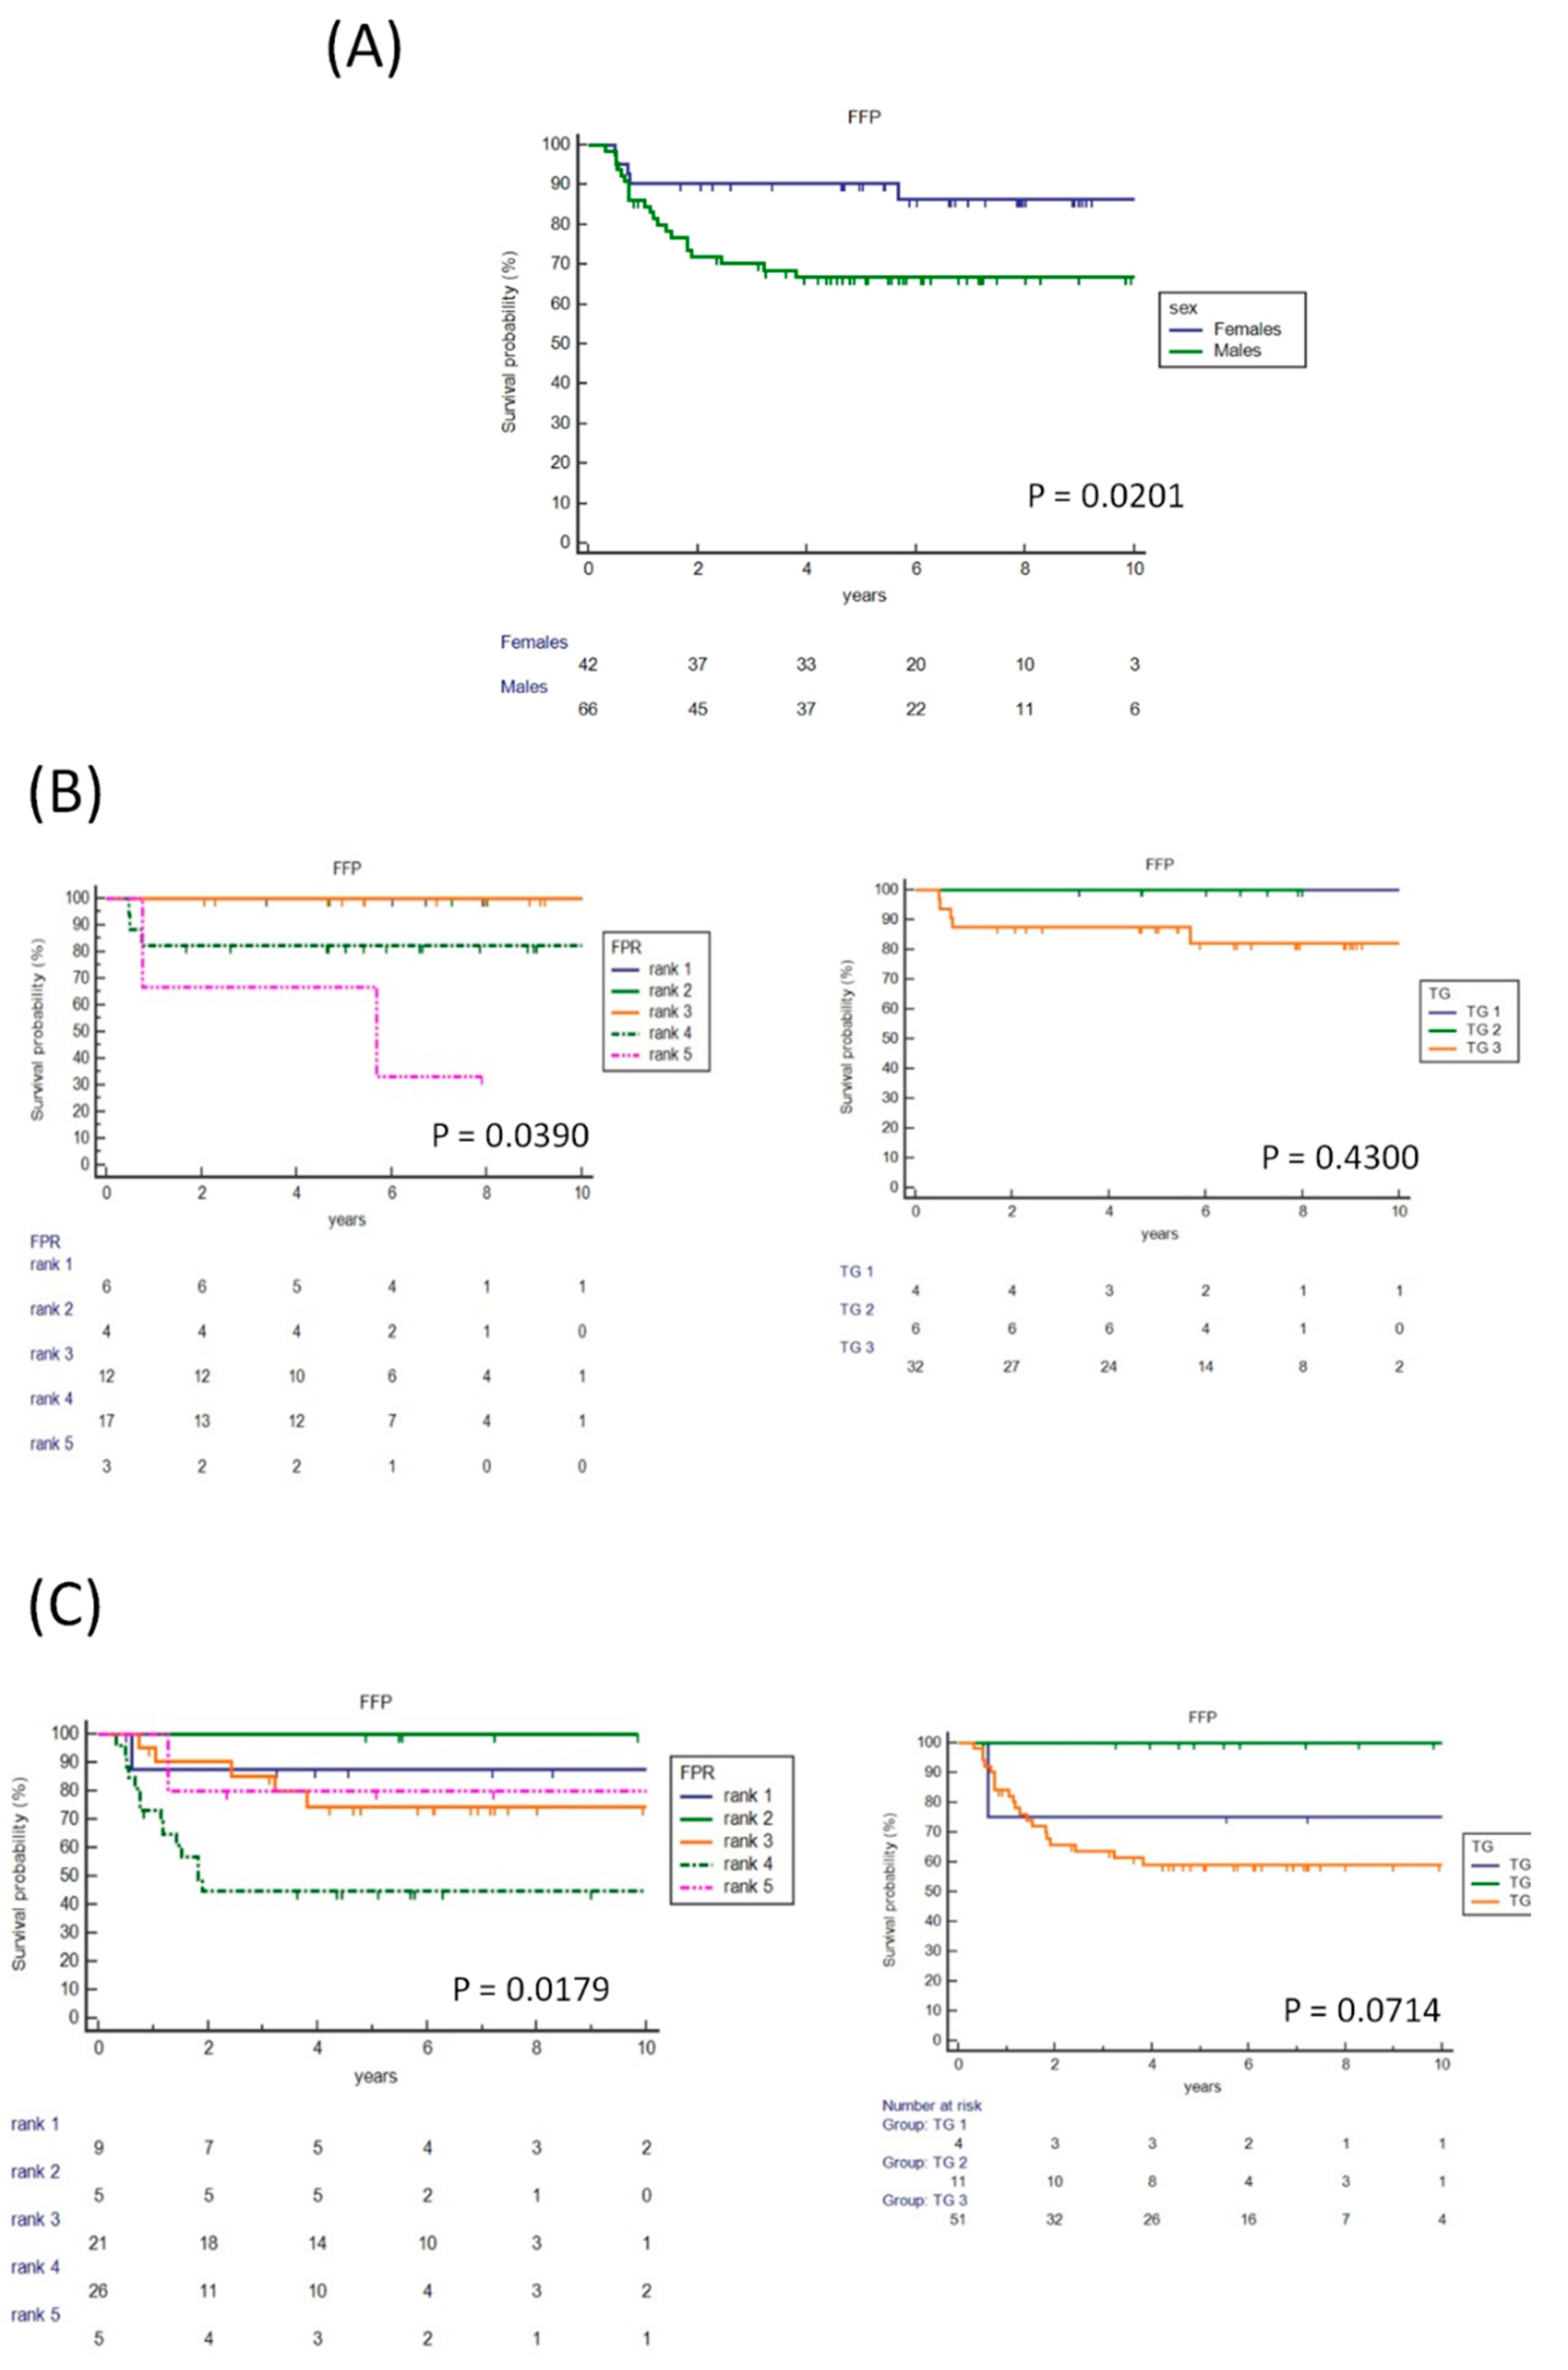
41]. Whether these hormones may induce HLA-G expression in cHL and whether they have a role in the sex-related difference in FFP survival that we found in the NScHL most-frequent histological cHL subtype (Figure 3) are unknown and require further studies.
The FPR scoring system includes the generally used TG choice for treatment and two additional variables: a single SNP test and a minimally-invasive neutrophil count, both obtained at diagnosis from a single peripheral blood sample and quickly experimentally performed.
In our series, HLA-G SNP and neutrophil count availability may reinforce the TG assessment of patients, and could identify at diagnosis patients who may benefit from an optimized treatment before the interim PET/CT scan assessment. Indeed, the data shown in Table 5B indicated an increase in the sensitivity (81.82%) of the FPR model to individualized patients at high risk of FFP, compared to that obtained with the PET scan (66.67%).
Although our results need to be confirmed by additional studies, they may suggest to clinicians the best treatment option before of PET/CT scan imaging, and FPR score could be used to refine treatment at the time of PET/CT stratification, with the hope of increasing the FFP time and reducing any excessive treatment.

5. Conclusions

To date, several studies have examined the prognostic performance of TG and early response to therapy on PET/CT in children and adolescents with cHL, while less research has been performed on molecular parameters measured at diagnosis. We constructed an FPR scoring system for predicting the FFP survival in children and adolescents with cHL that may improve the TG’s ability to tailor a patient’s treatment. The use of FPR score data is encouraged to aid the clinician’s choice of the best treatment option of cHL at diagnosis, before the interim PET/CT-based adjusted treatment. The model proposed is still preliminary and will need to be further investigated in prospective studies.

Supplementary Materials

The following are available online at https://0-www-mdpi-com.brum.beds.ac.uk/article/10.3390/hemato2020016/s1, Supplementary Figure S1: Flow chart illustrating the study design.

Author Contributions

V.D.R., M.M., R.B., designed the research, analyzed data and wrote the paper; L.C., M.D.Z., L.M., contributed to analytical tools; C.E., managed the database; M.P., P.M., S.B., M.B., A.S., L.V., P.F., E.F., O.R. collected and evaluated clinical data; E.L., evaluated early metabolic and PET response; E.S.G.d., revised data of histological classification. All authors have read and agreed to the published version of the manuscript.

Funding

A donation from GOGNE has supported C.E.

Institutional Review Board Statement

The study was conducted according to the guidelines of the Declaration of Helsinki, and approved by the Institutional Review Board protocol No. 20/2004/0, Policlinico San Orsola-Malpighi Bologna.

Informed Consent Statement

Informed consent was obtained from all subjects involved in the study.

Data Availability Statement

CINECA, a non-profit external consortium, collected the patient-sensitive data in a dedicated database (A. Pession, protocol LH-2004, Sper. Clin. n°20/2004).

Acknowledgments

M.D.Z., L.C., O.R. had fellowships funded by 5 × 1000 2010 MdS. A donation from GOGNE has supported C.E. We would like to thank the patients and the A.I.E.O.P. group for the involvement in this study. Francesca Corburn, edited the paper for the English language. Her work is funded by Gruppo Oncologico Cooperativo del Nord-Est GOGNE onlus.† Other members of the A.I.E.O.P. Group: Rinieri Simona, Roberto Rondelli, Alberto Garaventa, Elena Sabattini, Marco Zecca, Massimo Provenzi, Francesca Rossi, Salvatore D’Amico, Sayla Bernasconi, Raffaela De Santis, Tommaso Casini, Fulvio Porta, Irene D’Alba, Rosamaria Mura, Federico Verzegnassi, Antonella Sau, Simone Cesaro, Katia Perruccio, Monica Cellini, Patrizia Bertolini, Domenico Sperlì, Roberta Pericoli, Daniela Galimberti, Adele Civino.

Conflicts of Interest

The authors received no specific funding for this work, except Gruppo Oncologico Cooperativo del Nord-Est GOGNE ONLUS for the language editing. None of the authors has a relevant conflict of interest.

Abbreviations

CRcomplete response
IFinvolved fields
M/Tmediastinal–thoracic ratio
PRpartial response
RTradiotherapy
ROCreceiver operating characteristic
HLAhuman leukocyte antigen
SNPsingle nucleotide polymorphism
FFPfreedom from progression and disease
FPRfinal prognostic rank model
NScHLnodular sclerosis classical Hodgkin lymphoma histological subtype
TGtherapeutic group
PET/CTpositron Emission tomography/computed tomography

References

  1. Burnelli, R.; Fiumana, G.; Rondelli, R.; Pillon, M.; Sala, A.; Garaventa, A.; D’Amore, E.S.G.; Sabattini, E.; Buffardi, S.; Bianchi, M.; et al. Comparison of Hodgkin’s Lymphoma in Children and Adolescents. A Twenty Year Experience with MH’96 and LH2004 AIEOP (Italian Association of Pediatric Hematology and Oncology) Protocols. Cancers 2020, 12, 1620. [Google Scholar] [CrossRef] [PubMed]
  2. Lopci, E.; Mascarin, M.; Piccardo, A.; Castello, A.; Elia, C.; Guerra, L.; Borsatti, E.; Sala, A.; Todesco, A.; Zucchetta, P.; et al. FDG PET in Response Evaluation of Bulky Masses in Paediatric Hodgkin’s Lymphoma (HL) Patients Enrolled in the Italian AIEOP-LH2004 Trial. Eur. J. Nucl. Med. Mol. Imaging 2019, 46, 97–106. [Google Scholar] [CrossRef] [Green Version]
  3. Mascarin, M.; Fiumana, G.; Rondelli, R.; Scarzello, G.; Pillon, M.; Sala, A.; Buffardi, S.; Bianchi, M.; Farruggia, P.; Facchini, E.; et al. Protocollo AIEOP LH-2004 per Bambini e Adolescenti Con Linfoma Di Hodgkin: Si Può Omettere La Radioterapia Nei Pazienti a Basso Rischio, o Ridurne Dosi e Volumi Nei Pazienti a Rischio Standard, Se in Remissione Completa Dopo Chemioterapia Co10. In Proceedings of the XLIV Congresso Nazionale AIEOP, Catania, Italy, 13—15 October 2019. Hematology Reports. [Google Scholar]
  4. De Re, V.; Caggiari, L.; Mussolin, L.; d’Amore, E.S.; Famengo, B.; De Zorzi, M.; Martina, L.; Elia, C.; Pillon, M.; Santoro, N.; et al. HLA-G+3027 Polymorphism Is Associated with Tumor Relapse in Pediatric Hodgkin’s Lymphoma. Oncotarget 2017, 8, 105957–105970. [Google Scholar] [CrossRef]
  5. Castelli, E.C.; Mendes-Junior, C.T.; Deghaide, N.H.S.; de Albuquerque, R.S.; Muniz, Y.C.N.; Simões, R.T.; Carosella, E.D.; Moreau, P.; Donadi, E.A. The Genetic Structure of 3′untranslated Region of the HLA-G Gene: Polymorphisms and Haplotypes. Genes Immun. 2010, 11, 134–141. [Google Scholar] [CrossRef]
  6. De Zorzi, M.; Caggiari, L.; Crovatto, M.; Talamini, R.; Garziera, M.; De Re, V. A New Human Leukocyte Antigen Class I Allele: HLA-A*02:374. Tissue Antigens 2013, 81, 48–49. [Google Scholar] [CrossRef] [PubMed]
  7. Schreck, S.; Friebel, D.; Buettner, M.; Distel, L.; Grabenbauer, G.; Young, L.S.; Niedobitek, G. Prognostic Impact of Tumour-Infiltrating Th2 and Regulatory T Cells in Classical Hodgkin Lymphoma. Hematol. Oncol. 2009, 27, 31–39. [Google Scholar] [CrossRef]
  8. Romano, A.; Parrinello, N.L.; Vetro, C.; Tibullo, D.; Giallongo, C.; La Cava, P.; Chiarenza, A.; Motta, G.; Caruso, A.L.; Villari, L.; et al. The Prognostic Value of the Myeloid-Mediated Immunosuppression Marker Arginase-1 in Classic Hodgkin Lymphoma. Oncotarget 2016, 7, 67333–67346. [Google Scholar] [CrossRef] [PubMed] [Green Version]
  9. Mirili, C.; Paydas, S.; Kapukaya, T.K.; Yılmaz, A. Systemic Immune-Inflammation Index Predicting Survival Outcome in Patients with Classical Hodgkin Lymphoma. Biomark. Med. 2019, 13, 1565–1575. [Google Scholar] [CrossRef] [PubMed]
  10. Mantovani, A.; Allavena, P.; Sica, A.; Balkwill, F. Cancer-Related Inflammation. Nature 2008, 454, 436–444. [Google Scholar] [CrossRef]
  11. Galdiero, M.R.; Varricchi, G.; Loffredo, S.; Mantovani, A.; Marone, G. Roles of Neutrophils in Cancer Growth and Progression. J. Leukoc. Biol. 2018, 103, 457–464. [Google Scholar] [CrossRef]
  12. Quail, D.F.; Joyce, J.A. Microenvironmental Regulation of Tumor Progression and Metastasis. Nat. Med. 2013, 19, 1423–1437. [Google Scholar] [CrossRef]
  13. Calabretta, E.; d’Amore, F.; Carlo-Stella, C. Immune and Inflammatory Cells of the Tumor Microenvironment Represent Novel Therapeutic Targets in Classical Hodgkin Lymphoma. Int. J. Mol. Sci. 2019, 20, 5503. [Google Scholar] [CrossRef] [Green Version]
  14. Zhang, W.; Shen, Y.; Huang, H.; Pan, S.; Jiang, J.; Chen, W.; Zhang, T.; Zhang, C.; Ni, C. A Rosetta Stone for Breast Cancer: Prognostic Value and Dynamic Regulation of Neutrophil in Tumor Microenvironment. Front. Immunol. 2020, 11, 1779. [Google Scholar] [CrossRef]
  15. Wang, J.; Zhou, X.; Liu, Y.; Li, Z.; Li, X. Prognostic Significance of Neutrophil-to-Lymphocyte Ratio in Diffuse Large B-Cell Lymphoma: A Meta-Analysis. PLoS ONE 2017, 12, e0176008. [Google Scholar] [CrossRef] [PubMed]
  16. Stefaniuk, P.; Szymczyk, A.; Podhorecka, M. The Neutrophil to Lymphocyte and Lymphocyte to Monocyte Ratios as New Prognostic Factors in Hematological Malignancie—A Narrative Review. Cancer Manag. Res. 2020, 12, 2961–2977. [Google Scholar] [CrossRef] [PubMed]
  17. Mu, S.; Ai, L.; Fan, F.; Sun, C.; Hu, Y. Prognostic Role of Neutrophil-Lymphocyte Ratio in Multiple Myeloma: A Dose-Response Meta-Analysis. Onco Targets Ther. 2018, 11, 499–507. [Google Scholar] [CrossRef] [PubMed] [Green Version]
  18. Marcheselli, R.; Bari, A.; Tadmor, T.; Marcheselli, L.; Cox, M.C.; Pozzi, S.; Ferrari, A.; Baldini, L.; Gobbi, P.; Aviv, A.; et al. Neutrophil-Lymphocyte Ratio at Diagnosis Is an Independent Prognostic Factor in Patients with Nodular Sclerosis Hodgkin Lymphoma: Results of a Large Multicenter Study Involving 990 Patients. Hematol. Oncol. 2017, 35, 561–566. [Google Scholar] [CrossRef]
  19. Koh, Y.W.; Kang, H.J.; Park, C.; Yoon, D.H.; Kim, S.; Suh, C.; Kim, J.E.; Kim, C.-W.; Huh, J. Prognostic Significance of the Ratio of Absolute Neutrophil Count to Absolute Lymphocyte Count in Classic Hodgkin Lymphoma. Am. J. Clin. Pathol. 2012, 138, 846–854. [Google Scholar] [CrossRef] [Green Version]
  20. Dogan, A.; Demircioglu, S. Assessment of the Neutrophil-Lymphocyte Ratio in Classic Hodgkin Lymphoma Patients. Pak. J. Med. Sci. 2019, 35, 1270–1275. [Google Scholar] [CrossRef] [Green Version]
  21. Romano, A.; Pavoni, C.; Di Raimondo, F.; Tarella, C.; Viviani, S.; Rossi, A.; Patti, C.; Picardi, M.; Cantonetti, M.; La Nasa, G.; et al. The Neutrophil to Lymphocyte Ratio (NLR) and the Presence of Large Nodal Mass Are Independent Predictors of Early Response: A Subanalysis of the Prospective Phase II PET-2-Adapted HD0607 Trial. Cancer Med. 2020, 9, 8735–8746. [Google Scholar] [CrossRef]
  22. Renner, K.; Singer, K.; Koehl, G.E.; Geissler, E.K.; Peter, K.; Siska, P.J.; Kreutz, M. Metabolic Hallmarks of Tumor and Immune Cells in the Tumor Microenvironment. Front. Immunol. 2017, 8. [Google Scholar] [CrossRef] [PubMed] [Green Version]
  23. Bronte, V.; Zanovello, P. Regulation of Immune Responses by L-Arginine Metabolism. Nat. Rev. Immunol. 2005, 5, 641–654. [Google Scholar] [CrossRef] [PubMed]
  24. Lemos, H.; Huang, L.; Prendergast, G.C.; Mellor, A.L. Immune Control by Amino Acid Catabolism during Tumorigenesis and Therapy. Nat. Rev. Cancer 2019, 19, 162–175. [Google Scholar] [CrossRef]
  25. Czystowska-Kuzmicz, M.; Sosnowska, A.; Nowis, D.; Ramji, K.; Szajnik, M.; Chlebowska-Tuz, J.; Wolinska, E.; Gaj, P.; Grazul, M.; Pilch, Z.; et al. Small Extracellular Vesicles Containing Arginase-1 Suppress T-Cell Responses and Promote Tumor Growth in Ovarian Carcinoma. Nat. Commun. 2019, 10, 3000. [Google Scholar] [CrossRef] [PubMed]
  26. Quintero-Fabián, S.; Arreola, R.; Becerril-Villanueva, E.; Torres-Romero, J.C.; Arana-Argáez, V.; Lara-Riegos, J.; Ramírez-Camacho, M.A.; Alvarez-Sánchez, M.E. Role of Matrix Metalloproteinases in Angiogenesis and Cancer. Front. Oncol. 2019, 9. [Google Scholar] [CrossRef] [PubMed] [Green Version]
  27. Roy, R.; Yang, J.; Moses, M.A. Matrix Metalloproteinases as Novel Biomarkers and Potential Therapeutic Targets in Human Cancer. J. Clin. Oncol. 2009, 27, 5287–5297. [Google Scholar] [CrossRef] [Green Version]
  28. Grzywa, T.M.; Sosnowska, A.; Matryba, P.; Rydzynska, Z.; Jasinski, M.; Nowis, D.; Golab, J. Myeloid Cell-Derived Arginase in Cancer Immune Response. Front. Immunol. 2020, 11, 938. [Google Scholar] [CrossRef]
  29. La Manna, G.; Ghinatti, G.; Tazzari, P.L.; Alviano, F.; Ricci, F.; Capelli, I.; Cuna, V.; Todeschini, P.; Brunocilla, E.; Pagliaro, P.; et al. Neutrophil Gelatinase-Associated Lipocalin Increases HLA-G(+)/FoxP3(+) T-Regulatory Cell Population in an In Vitro Model of PBMC. PLoS ONE 2014, 9, e89497. [Google Scholar] [CrossRef] [Green Version]
  30. Caocci, G.; Greco, M.; Fanni, D.; Senes, G.; Littera, R.; Lai, S.; Risso, P.; Carcassi, C.; Faa, G.; La Nasa, G. HLA-G Expression and Role in Advanced-Stage Classical Hodgkin Lymphoma. Eur. J. Histochem. 2016, 60, 2606. [Google Scholar] [CrossRef] [Green Version]
  31. Poras, I.; Yaghi, L.; Martelli-Palomino, G.; Mendes-Junior, C.T.; Muniz, Y.C.N.; Cagnin, N.F.; Sgorla de Almeida, B.; Castelli, E.C.; Carosella, E.D.; Donadi, E.A.; et al. Haplotypes of the HLA-G 3′ Untranslated Region Respond to Endogenous Factors of HLA-G+ and HLA-G-Cell Lines Differentially. PLoS ONE 2017, 12, e0169032. [Google Scholar] [CrossRef] [Green Version]
  32. Martelli-Palomino, G.; Pancotto, J.A.; Muniz, Y.C.; Mendes-Junior, C.T.; Castelli, E.C.; Massaro, J.D.; Krawice-Radanne, I.; Poras, I.; Rebmann, V.; Carosella, E.D.; et al. Polymorphic Sites at the 3′ Untranslated Region of the HLA-G Gene Are Associated with Differential Hla-g Soluble Levels in the Brazilian and French Population. PLoS ONE 2013, 8, e71742. [Google Scholar] [CrossRef]
  33. Celik, A.A.; Simper, G.S.; Hiemisch, W.; Blasczyk, R.; Bade-Döding, C. HLA-G Peptide Preferences Change in Transformed Cells: Impact on the Binding Motif. Immunogenetics 2018, 70, 485–494. [Google Scholar] [CrossRef] [Green Version]
  34. Schwich, E.; Rebmann, V.; Michita, R.T.; Rohn, H.; Voncken, J.W.; Horn, P.A.; Kimmig, R.; Kasimir-Bauer, S.; Buderath, P. HLA-G 3′ Untranslated Region Variants +3187G/G, +3196G/G and +3035T Define Diametrical Clinical Status and Disease Outcome in Epithelial Ovarian Cancer. Sci. Rep. 2019, 9, 5407. [Google Scholar] [CrossRef] [PubMed]
  35. de Charette, M.; Houot, R. Hide or Defend, the Two Strategies of Lymphoma Immune Evasion: Potential Implications for Immunotherapy. Haematologica 2018, 103, 1256–1268. [Google Scholar] [CrossRef] [PubMed]
  36. Naji, A.; Menier, C.; Maki, G.; Carosella, E.D.; Rouas-Freiss, N. Neoplastic B-Cell Growth Is Impaired by HLA-G/ILT2 Interaction. Leukemia 2012, 26, 1889–1892. [Google Scholar] [CrossRef] [PubMed] [Green Version]
  37. Aldinucci, D.; Borghese, C.; Casagrande, N. Formation of the Immunosuppressive Microenvironment of Classic Hodgkin Lymphoma and Therapeutic Approaches to Counter It. Int. J. Mol. Sci. 2019, 20, 2416. [Google Scholar] [CrossRef] [PubMed] [Green Version]
  38. Chiu, J.; Ernst, D.M.; Keating, A. Acquired Natural Killer Cell Dysfunction in the Tumor Microenvironment of Classic Hodgkin Lymphoma. Front. Immunol. 2018, 9, 267. [Google Scholar] [CrossRef] [PubMed]
  39. Carosella, E.D.; Rouas-Freiss, N.; Roux, D.T.-L.; Moreau, P.; LeMaoult, J. HLA-G: An Immune Checkpoint Molecule. In Advances in Immunology; Alt, F.W., Ed.; Elsevier Academic Press Inc.: San Diego, CA, USA, 2015; Volume 127, pp. 33–144. ISBN 978-0-12-802245-0. [Google Scholar]
  40. Hunt, J.S.; Petroff, M.G.; McIntire, R.H.; Ober, C. HLA-G and Immune Tolerance in Pregnancy. FASEB J. 2005, 19, 681–693. [Google Scholar] [CrossRef]
  41. RouasFreiss, N.; Goncalves, R.M.B.; Menier, C.; Dausset, J.; Carosella, E.D. Direct Evidence to Support the Role of HLA-G in Protecting the Fetus from Maternal Uterine Natural Killer Cytolysis. Proc. Natl. Acad. Sci. USA 1997, 94, 11520–11525. [Google Scholar] [CrossRef] [Green Version]
Figure 1. (A) ROC curves comparing quantitative hematological/biochemical variables and patients’ age performance. Only WBC, neutrophils, and N/L ratio shows an AUC > 0.6 (0.603, 0.611, and 0.601, respectively) (Table 2) (B) ROC curve analysis of neutrophils, to calculate the best cutoff point that discriminates between patient groups with and without a progressive or a relapsed cHL. The best cutoff point is 7924 cells/mm3 (sensitivity = 75%, specificity= 50.54%). ROC, receiver operating characteristic; AUC, the area under the receiver operating characteristic curve; WBC, white blood cells; N/L, neutrophil/lymphocyte ratio.
Hemato 02 00016 g001
Figure 2. (A) Kaplan–Meier curves for FFP by FPR and TG models in the explorative cHL set (n = 133 cases, AIEOP LH-2004 protocol). FPR, the final prognostic rank model performed from Cox analysis with covariates (TG 3, HLA-G C/A, neutrophils > 8 × 10⁹/L); the point values for each rank are reported in the result section. TG, therapeutic group criteria, are those used today by clinicians to choose the most appropriate treatment option. The detailed criteria are reported in the introduction and methods sections. (B) Kaplan–Meier curves for FFP by FPR and TG models in the validation set (n = 52 cases, AIEOP LH2044 protocol). Kaplan–Meier curves for FFP by FPR and TG models in the NScHL set (n = 108 cases, AIEOP LH2044 protocol). The FPR model showed a lower P-value compared to the TG model in both the two different cohorts tested.
Hemato 02 00016 g002
Figure 3. (A) Kaplan–Meier curves for FFP NScHL compared by sex (n = 108, AIEOP LH-2004 protocol. (B) Kaplan–Meier curves for FFP in females with NScHL (n = 42, AIEOP LH-2004 protocol) comparing FPR and TG models. (C) Kaplan–Meier curves for FFP in males (n = 66, AIEOP LH-2004 protocol) comparing FPR and TG models. FPR, the final prognostic rank model performed from Cox analysis with covariates (TG 3, HLA-G C/A, neutrophils > 8 × 10⁹/L); the point values for each rank are reported in the results section TG, therapeutic group criteria, are those used today by clinicians to choose the most appropriate treatment option. The detailed criteria used are reported in the introduction and methods sections).
Hemato 02 00016 g003
Figure 4. (A) Kaplan–Meier curves for overall survival (OS) in nodular sclerosis (NScHL), comparing FPR and TG models (n = 108, AIEOP LH-2004 protocol). FPR, the final prognostic rank model performed from Cox analysis with covariates (TG 3, HLA-G C/A, neutrophils > 8 × 10⁹/L); the point values for each rank are reported in the results section TG, therapeutic group criteria, are those used today by clinicians to choose the most appropriate treatment option (the detailed criteria used are reported in the introduction and methods sections).
Hemato 02 00016 g004
Table 1. Pretreatment characteristics of patients included in the explorative cHL set and the NScHL set.
cHL (n = 133)NScHL (n = 108)
Age, years
Median (IQR)14 (11.9–15.1)14 (12.0–15.6)
Gender (%)
-female49 (36.8%)42 (38.9%)
-male84 (63.2)66 (61.1%)
Stage (%)
17 (5.3)4 (3.7)
262 (46.6)52 (48.1)
327 (20.3)22 (20.4)
437 (27.8)30 (27.8)
Treatment group (%)
114 (10.5)8 (7.4%)
217 (12.8)17 (15.7%)
3102 (76.7)83 (76.9%)
Median follow-up, years (IQR)5.55 (4.09–7.93) 5.89 (4.68–7.95)
Histology (%)
NC14 (10.5)
MC8 (6.0)
LRCHL3 (2.3)
NS108 (81.2)108 (100.0%)
Sedimentation rate (mm/hr)
median (IQR)71.0 (38.7–40.0)73 (46.8–101.0)
Albumin (g/L)
median (IQR)39.0 (37.0–40.0)39.0 (31.5–40.0)
Ferritin (ng/mL)
median (IQR)127.5 (61.5–337.5)135.0 (63.5–-335.8)
Hemoglobin (g/L)
median (IQR)11.5 (11.0–12.6)11.7 (10.3–12.6)
White blood cell count (109/L)
median (IQR)12.47 (8.115–16.815)12.60 (8.352–16.585)
Lymphocytes (109/L)
median (IQR)1.81 (1.296–2.312)1.81 (1.312–2.297)
Neutrophils (109/L)
median (IQR)9.07 (5.623–12.526)9.39 (6.263–12.907)
Eosinophils (109/L)
Median (IQR)0.17 (0.067–0.339)0.21 (0.082–0.338)
Basophils (109/L)
median (IQR)0.00 (0.000–0.182)0.00 (0.000–0.145)
Monocytes (109/L)
median (IQR)0.773 (0.053–1.047)0.821 (0.583–1.056)
Platelets (109/L)
median (IQR)393.0 (295.7–464.2)393.5 (300.5–433.5)
NC, not classified; MC, mixed cellularity; LRCHL, lymphocyte-rich classical Hodgkin lymphoma; NS, nodular sclerosis.
Table 2. Univariate ROC analysis of age and hematological/biochemical variables.
VariableAUC.SE.95% CI
Albumin (g/L)0.5330.05700.441 to 0.623
Hemoglobin (g/dl)0.5630.05870.472 to 0.652
White blood-cell count (109/L)0.6030.05700.522 to 0.696
Neutrophils (109/L)0.6110.05720.522 to 0.700
Lymphocytes (109/L)0.5000.06260.409 to 0.591
Platelets (109/L)0.5980.05450.506 to 0.685
ESR (mm/hr)0.5060.07610.384 to 0.628 §
Ferritin (ng/mL)0.5250.07910.402 to 0.646 §
Eosinophils (109/L)0.5740.07820.450 to 0.692 §
Basophils (109/L)0.5430.06280.419 to 0.662 §
Monocytes (109/L)0.5820.07740.458 to 0.699 §
N/L ratio0.6010.05720.509 to 0.687
P/L ratio0.5610.06230.469 to 0.650
Age0.5420.06010.450 to 0.632
ROC, receiver operating characteristic; AUC, the area under the receiver operating characteristic curve; SE (AUC), standard error of ROC AUC; 95% CI, 95% confidence interval. § 34 missing values. ESR, erythrocyte sedimentation rate; N/L ratio, neutrophil/lymphocyte ratio; P/L ratio, platelet/lymphocyte ratio.
Table 3. Results of multivariate COX regression model for FFP (p = 0.0066).
CovariablePredictive VariableHR.95% CI of Exp(b)Numerical Point Assigned
TG.TG1Reference----0
TG2-------0
TG32.87990.8647 to 9.59193
V1HLA-G (C/C)Reference 0
HLA-G (C/A)1.12620.4323 to 2.93351
V2Neutrophils (≤8 × 10⁹/L)Reference 0
Neutrophils (>8 × 10⁹/L)2.32821.0720 to 5.05642
Table 4. Kaplan–Meier analyses identifying the difference in the FFP survival probability in cHL patients (A) and in the NScHL set (B).
(A) cHL n = 133.
Cases SummaryMean ServivalHazard Ratio
Number of EventsSample SizeYears
FPR modeln%TotalMeanSE.HR.95%CI
rank 1210.002010.0320.623reference--
rank 2110.00109.0170.7810.9830.2556 to 3.7775
rank 3717.50409.9070.6361.8120.6913 to 4.7470
rank 42342.59549.3191.0285.6022.1584 to 14.5369
rank 5444.4497.3841.7845.0471.1628 to 21.9065
TG modeln%TotalMeanSE.HR.95%CI
TG 1321.43148.9951.003reference--
TG 200.001710.720.000----
TG 33433.3310210.750.7151.82770.6663 to 5.0135
HR, hazard ratio with 95% confidence interval
(B) NScHL n = 108
Cases SummaryMean SurvivalHazard Ratio
Number of Eventssample SizeYears
FPR modeln%TotalMeanSE.HR.95%CI
rank 116.671510.2110.712reference--
rank 200.0099.8400.000----
rank 3515.633210.1510.6602.26610.6755 to 7.6019
rank 41738.644410.0101.1116.94882.1104 to 22.8794
rank 5337.5088.1981.8125.80211.0392 to 32.3948
FPR modeln%TotalMeanSE.HR.95%CI
TG 1112.5089.6571.21reference--
TG 200.001710.7200.00----
TG 32530.128311.3140.762.61860.6174 to 11.1053
HR, hazard ratio with 95% confidence interval
Table 5. Distribution of progressive/relapsed disease (PD/R) observed during the follow-up according to the predictive assigned FPR groups, and on the interim PET/CT scans, (NScHL n = 94, AIEOP LH-2004 protocol) (A). Sensitivy, specificty and predictive values for High-risk (B) and for Medium plus High-risk (C) patients according with the FPR model and on the interim PET/CT scans.
(A)
RISKLowMediumHigh
FPR at diagnosisrank 1rank 2rank 3rank 4rank 5
total sample size13827388
Interim PET/CT scan
PET-positive0010213
PET-negative 13817175
PD/R at follow-up
total sample size 004153
PET-positive003102
PET-negative00151
PD/R, progressive disease/relapse
(B)
FPR Model High-RiskValue95% CI
Sensitivity81.82%59.72% to 94.81%
Specificity61.11%48.89% to 72.38%
Positive predictive value39.12%31.17% to 47.71%
Negative predictive value91.67%81.65% to 96.45%
Accuracy65.96%55.46% to 75.42%
PET Evaluation from FPR High-Risk Group
Sensitivity66.67%40.99% to 86.66%
Specificity57.14%37.18% to 75.54%
Positive predictive value 32.21%21.72% to 44.87%
Negative predictive value84.88%73.05% to 92.08%
Accuracy59.37%43.89% to 73.60%
Disease prevalence 23.40%
(C)
FPR Model Medium-Risk + High-RiskValue95% CI
Sensitivity100.00%84.56% to 100.00%
Specificity29.17%19.05% to 41.07%
Positive predictive value 30.13%27.11% to 33.34%
Negative predictive value100.00%
Accuracy45.74%35.42% to 56.34%
PET Evaluation from Medium-Risk + High-RiskValue95% CI
Sensitivity68.18%45.13% to 86.14%
Specificity73.61%61.90% to 83.30%
Positive predictive value 44.11%32.82% to 56.05%
Negative predictive value88.34%80.18% to 93.41%
Accuracy72.34%62.15% to 81.07%
Disease prevalence 23.40%.
Publisher’s Note: MDPI stays neutral with regard to jurisdictional claims in published maps and institutional affiliations.

