Article

Proteomic Characterization of Spontaneous Stress-Induced In Vitro Apoptosis of Human Acute Myeloid Leukemia Cells; Focus on Patient Heterogeneity and Endoplasmic Reticulum Stress

1
Department of Clinical Science, University of Bergen, 5020 Bergen, Norway
2
The Proteomics Facility of the University of Bergen (PROBE), University of Bergen, 5020 Bergen, Norway
3
Department of Medicine, Haukeland University Hospital, 5021 Bergen, Norway
*
Author to whom correspondence should be addressed.
Submission received: 25 July 2021 / Revised: 10 September 2021 / Accepted: 13 September 2021 / Published: 17 September 2021
(This article belongs to the Section Leukemias)

Abstract

:
In vitro culture is widely used for characterization of primary human acute myeloid leukemia (AML) cells, but even when using optimized handling and culture conditions the AML cells show spontaneous in vitro apoptosis with a gradual decrease in cell viability during culture. The extent of this stress-induced apoptosis varies between patients, and a high degree of apoptosis is associated with high pre-culture BCL2 levels together with low levels of BAX and Heat Shock Proteins 30 and 90. We compared the global proteomic profiles during ongoing in vitro apoptosis for patients with high and low AML cell viability (i.e., less extensive versus extensive spontaneous apoptosis) after 48 h of culture. We identified 7902 proteins, but only 276 proteins differed significantly between patients with high (i.e., >25% viable cells; 192 upregulated and 84 downregulated peptides) and low viability after in vitro culture. Protein interaction network analysis based on these 276 protein identified three protein networks that included 18 proteins; most of these proteins were localized to the endoplasmic reticulum and several of them are involved in or are altered during the process of endoplasmic reticulum stress/unfolded protein stress response. To conclude, primary AML cells are heterogeneous with regard to degree of apoptosis in response to cellular stress, and this difference in regulation of apoptosis is associated with differences in the induction of and/or response to the unfolded protein stress response.

1. Introduction

Acute myeloid leukemia (AML) is an aggressive hematological malignancy characterized by bone marrow infiltration of immature leukemia cells [1,2]. The acute promyelocytic variant is regarded as a separate entity because of its specific genetic abnormalities, different treatment, and better prognosis than the other AML variants [3]; and in the present article, the term AML refers to the non-promyelocytic variants of the disease.
In vitro culture of AML cells has been widely used in experimental studies [4,5], and when using cryopreserved leukemic cells from biobanks it is then possible to investigate large numbers of patients in repeated experiments and to use the same highly standardized culture conditions for all patients [5]. Such experimental studies have been important for characterization of the hierarchically organized AML cell populations and for identification of new molecular targets. Both clonogenic assays and suspension cultures have then been used to characterize AML cell proliferation/survival, the leukemic cell communication with non-leukemic bone marrow stromal cells, and the effects of experimental interventions on the AML cells [4,5]. Suspension cultures including the whole population of enriched AML cells are most suitable for high-throughput experiments [6,7], e.g., characterization of cytokine effects/release or screening of new possible antileukemic agents for example by using 3H-thymidine incorporation assays [8,9,10,11,12].
AML is a very heterogeneous disease with regard to genetic abnormalities and risk of chemoresistant relapse [1]. The patients are also heterogeneous with regard to survival and proliferation of in vitro cultured AML cells; only a small subset of the hierarchical AML cell population is able to survive and still proliferate after cryopreservation, thawing, and finally in vitro incubation, and this is due to an increasing fraction of leukemic cells showing spontaneous or stress-induced in vitro apoptosis [8]. However, the fraction of viable cells after culture differs between patients, and this heterogeneity is seen even when using the most optimal culture media [9,10,11]. This variation in AML cell viability is caused by spontaneous apoptosis during the in vitro culture, i.e., a process of ongoing apoptotic cell death with a gradual decrease in the viability of the total hierarchically organized AML cell population after initiation of in vitro culture. For primary AML cells, this gradual decrease in viability is observed during the first 5–7 days of culture, and it is observed even for patients that have a minority of cells that survive and proliferate also after 7–14 days of culture. Thus, spontaneous apoptosis is a characteristic of the total AML cell population during the initial period of in vitro culture.
It will be important for our understanding and interpretation of results from experimental in vitro AML studies to characterize the molecular mechanisms behind this spontaneous and stress-induced in vitro apoptosis and how pro- and anti-apoptotic molecular mechanisms differ between patients and thereby contribute to patient heterogeneity. Furthermore, the spontaneous in vitro apoptosis may be due to a more general response to cellular stress (e.g., antileukemic therapy) that reflects important biological characteristics of and differences between patients. Even though AML relapse after intensive therapy seems to be derived from a minority of remaining AML stem cells [13], several biological characteristics of the total AML cell population are associated with the risk of relapse [14,15,16,17,18,19,20]. The in vitro stress response of the total AML cell population may therefore even have a clinical relevance with regard to chemosensitivity and prognosis. In this context we have compared the global proteomic profiles for AML cell populations, showing high versus low spontaneous stress-induced in vitro apoptosis during culture in standardized experimental conditions.

2. Materials and Methods

2.1. Cell Preparation

Primary human AML cells were derived from the peripheral blood of 41 consecutive patients (see Table 1 and Table S1) after written informed consent and in accordance with the Declaration of Helsinki. All patients were admitted to Haukeland University Hospital. The Regional Ethics Committee approved both the collection of biological material in the biobank (REK Vest 2015/1759) and the use of the cells in the present study (REF Vest 2017/305). All patients had a relatively high peripheral blood concentration and a high percentage of AML cells among circulating leukocytes (AML cell concentration > 15 × 109/L, >80% AML cells among circulating leukocytes), and highly enriched AML cell population (>95%) could therefore be prepared by density gradient separation alone (Lymphoprep; Axis-Shield, Oslo, Norway). The cells were stored cryopreserved in liquid nitrogen until used.

2.2. Cell Culture and Proteomic Cell Preparation

Primary AML cells were cultured at a concentration of 1 × 10⁶ cells/mL (10 mL medium per flask) in T25 flasks (Falcon; Glendale, AZ, USA); the culture medium was serum-free Iscove’s Modified Dulbecco Medium (IMDM) without phenol red (Ref. 21056023, ThermoFisher Scientific). The cells were collected after 48 h of in vitro incubation at 37 °C in a humidified atmosphere of 5% CO2. The single-pot, solid-phase-enhanced sample preparation SP3 method was used for digestion of 5–10 µg protein [21,22], but with addition of three extra washes with 80% EtOH for SDS removal and sample tube exchange after the third and the sixth washing step. NanoDrop UV-Vis spectrophotometer (Thermo Scientific, Waltham, MA, USA) was used to measure the peptide concentration prior to LC-MS/MS analysis.

2.3. Analysis of AML Cell Viability and Proliferation

Primary AML cells 1 × 10⁶ cells/mL (24 well culture plates, 2 mL/well) were incubated cultured in serum-free Stem Span SFEMTM medium (Stem Cell Technologies, Vancouver, BC, Canada) as described in detail previously [8], before flow cytometric analysis was used to determine AML cell viability. We could thereafter identify the following main cell populations by using the Annexin V and propidium iodide (PI) method: viable (AnnexinPI), early apoptotic and apoptotic (Annexin+PI), and late apoptotic/necrotic leukemic cells (Annexin+PI+). The results are presented as the percentage of viable cells.
Cell proliferation was analyzed by using a [3H]-thymidine incorporation assay [23,24]. Briefly, culture medium was serum-free Stem Span SFEMTM medium, and the cells were seeded (5 × 10⁴ cells/well, 200 μL medium/well) in flat-bottomed 96-well microtiter plates (Nuncleon™; Nunc, Roskilde, Denmark). After 6 days of incubation, [3H]-thymidine (37 kBq in 20 μL saline per well; TRA 310; Amersham International, Amersham, UK) was added and cultures incubated for an additional 18 h before nuclear incorporation was determined by liquid scintillation counting. The median of triplicate cultures was used in all estimations, and detectable proliferation was defined as an incremental proliferation corresponding to at least 1000 counts per minute (cpm).

2.4. Liquid Chromatography (LC) Tandem Mass Spectrometry (MS) Analysis

Samples containing 0.6 µg tryptic peptides dissolved in 2% acetonitrile (ACN) and 0.5% formic acid (FA) were injected into an Ultimate 3000 RSLC system (Thermo Scientific, Waltham, MA, USA) online coupled to an Orbitrap Eclipse Tribrid mass spectrometer equipped with an EASY-IC/ETD/PTCR ion source and FAIMS Pro interface (Thermo Scientific, San Jose, CA, USA). The LC and column specifications have been described previously [25], except that the gradient composition using 100% ACN as solvent B was as follows: trapping over 5 min with 5% B followed by 5–7% B for 1 min, 7–22% B for the next 119 min, 22–28% B for 14 min, 28–80% B for 7 min, hold 80% B for 21 min, ramp to 5% B for 7 min, and hold 5% B for 21 min.
Instrument control was through Tune 3.4.3072.18 and Xcalibur 4.4. The MS1 resolution was 120,000 and the scan range 375–1500 m/z; AGC target was set to standard, maximum injection time was automatic and RF lens at 30%. The intensity threshold was set at 5.0 × 10⁴ and dynamic exclusion lasted for 30 s. The MS/MS scans consisted of HCD with collision energy at 30%, quadrupole isolation window at 4 m/z, and orbitrap resolution at 15,000.
FAIMS was set up with the standard resolution mode and a total gas flow of 3.6 L/min. The CVs were set to −45, −65, and −80 V. As a quality control for the LC-MS system, a control sample from HeLa cell culture was run in the beginning, during, and in the end of the sample sequence (data not shown).

2.5. Statistical and Bioinformatical Analyses

The raw LC-MS files were searched with the Proteome Discoverer Software (version 2.5, Thermo Fisher Scientific, Bremen, Germany) using the SEQUEST HT database search engine with Percolator validation (FDR < 0.01), against the concatenated reviewed Swiss-Prot human database (canonical and isoform FASTA, downloaded from Uniprot 30 April 2021). Oxidation (M), Gln- > pyro-Glu (N-terminal peptides), and acetylation (N-terminal proteins) were set as dynamic modifications, and carbamidomethylation (C) was set as fixed modification. Default settings were used, except that the total peptide amount for all peptides was used for normalization, and summed abundances were used for protein abundance calculations.
The normalized protein abundances were imported into the Perseus software (version 1.6.1.1, Max Planck Institute for Biochemistry, Martinsread, Germany) [26] for data filtering, processing, and analysis (contaminants and proteins with medium or low confidence were removed from the data set). Proteins with at least five valid values (normalized protein abundance value) in each group were selected for statistical comparisons using Welch’s t-test and Z-statistics [27]. p-values < 0.01 were considered significant.
Perseus was used for hierarchical clustering with Pearson correlations as distance metrics and complete linkage. Gene ontology (GO) analyses were performed using a GO tool [28] where the GO slim subset according to Generic GO slim by GO consortium were reported and GO terms with FDR < 0.05 were considered significantly enriched. Significantly regulated proteins were imported to the STRING database (version 11.0 [29]) using experiments and databases as interaction sources and 0.7 as minimum required interaction score (i.e., high confidence). Cytoscape (version 3.3.0; National Institute of General Medical Sciences, Bethesda, MD, USA) and MCODE (version 2) were used to visualize and classify highly connected protein cluster [30,31].

3. Results

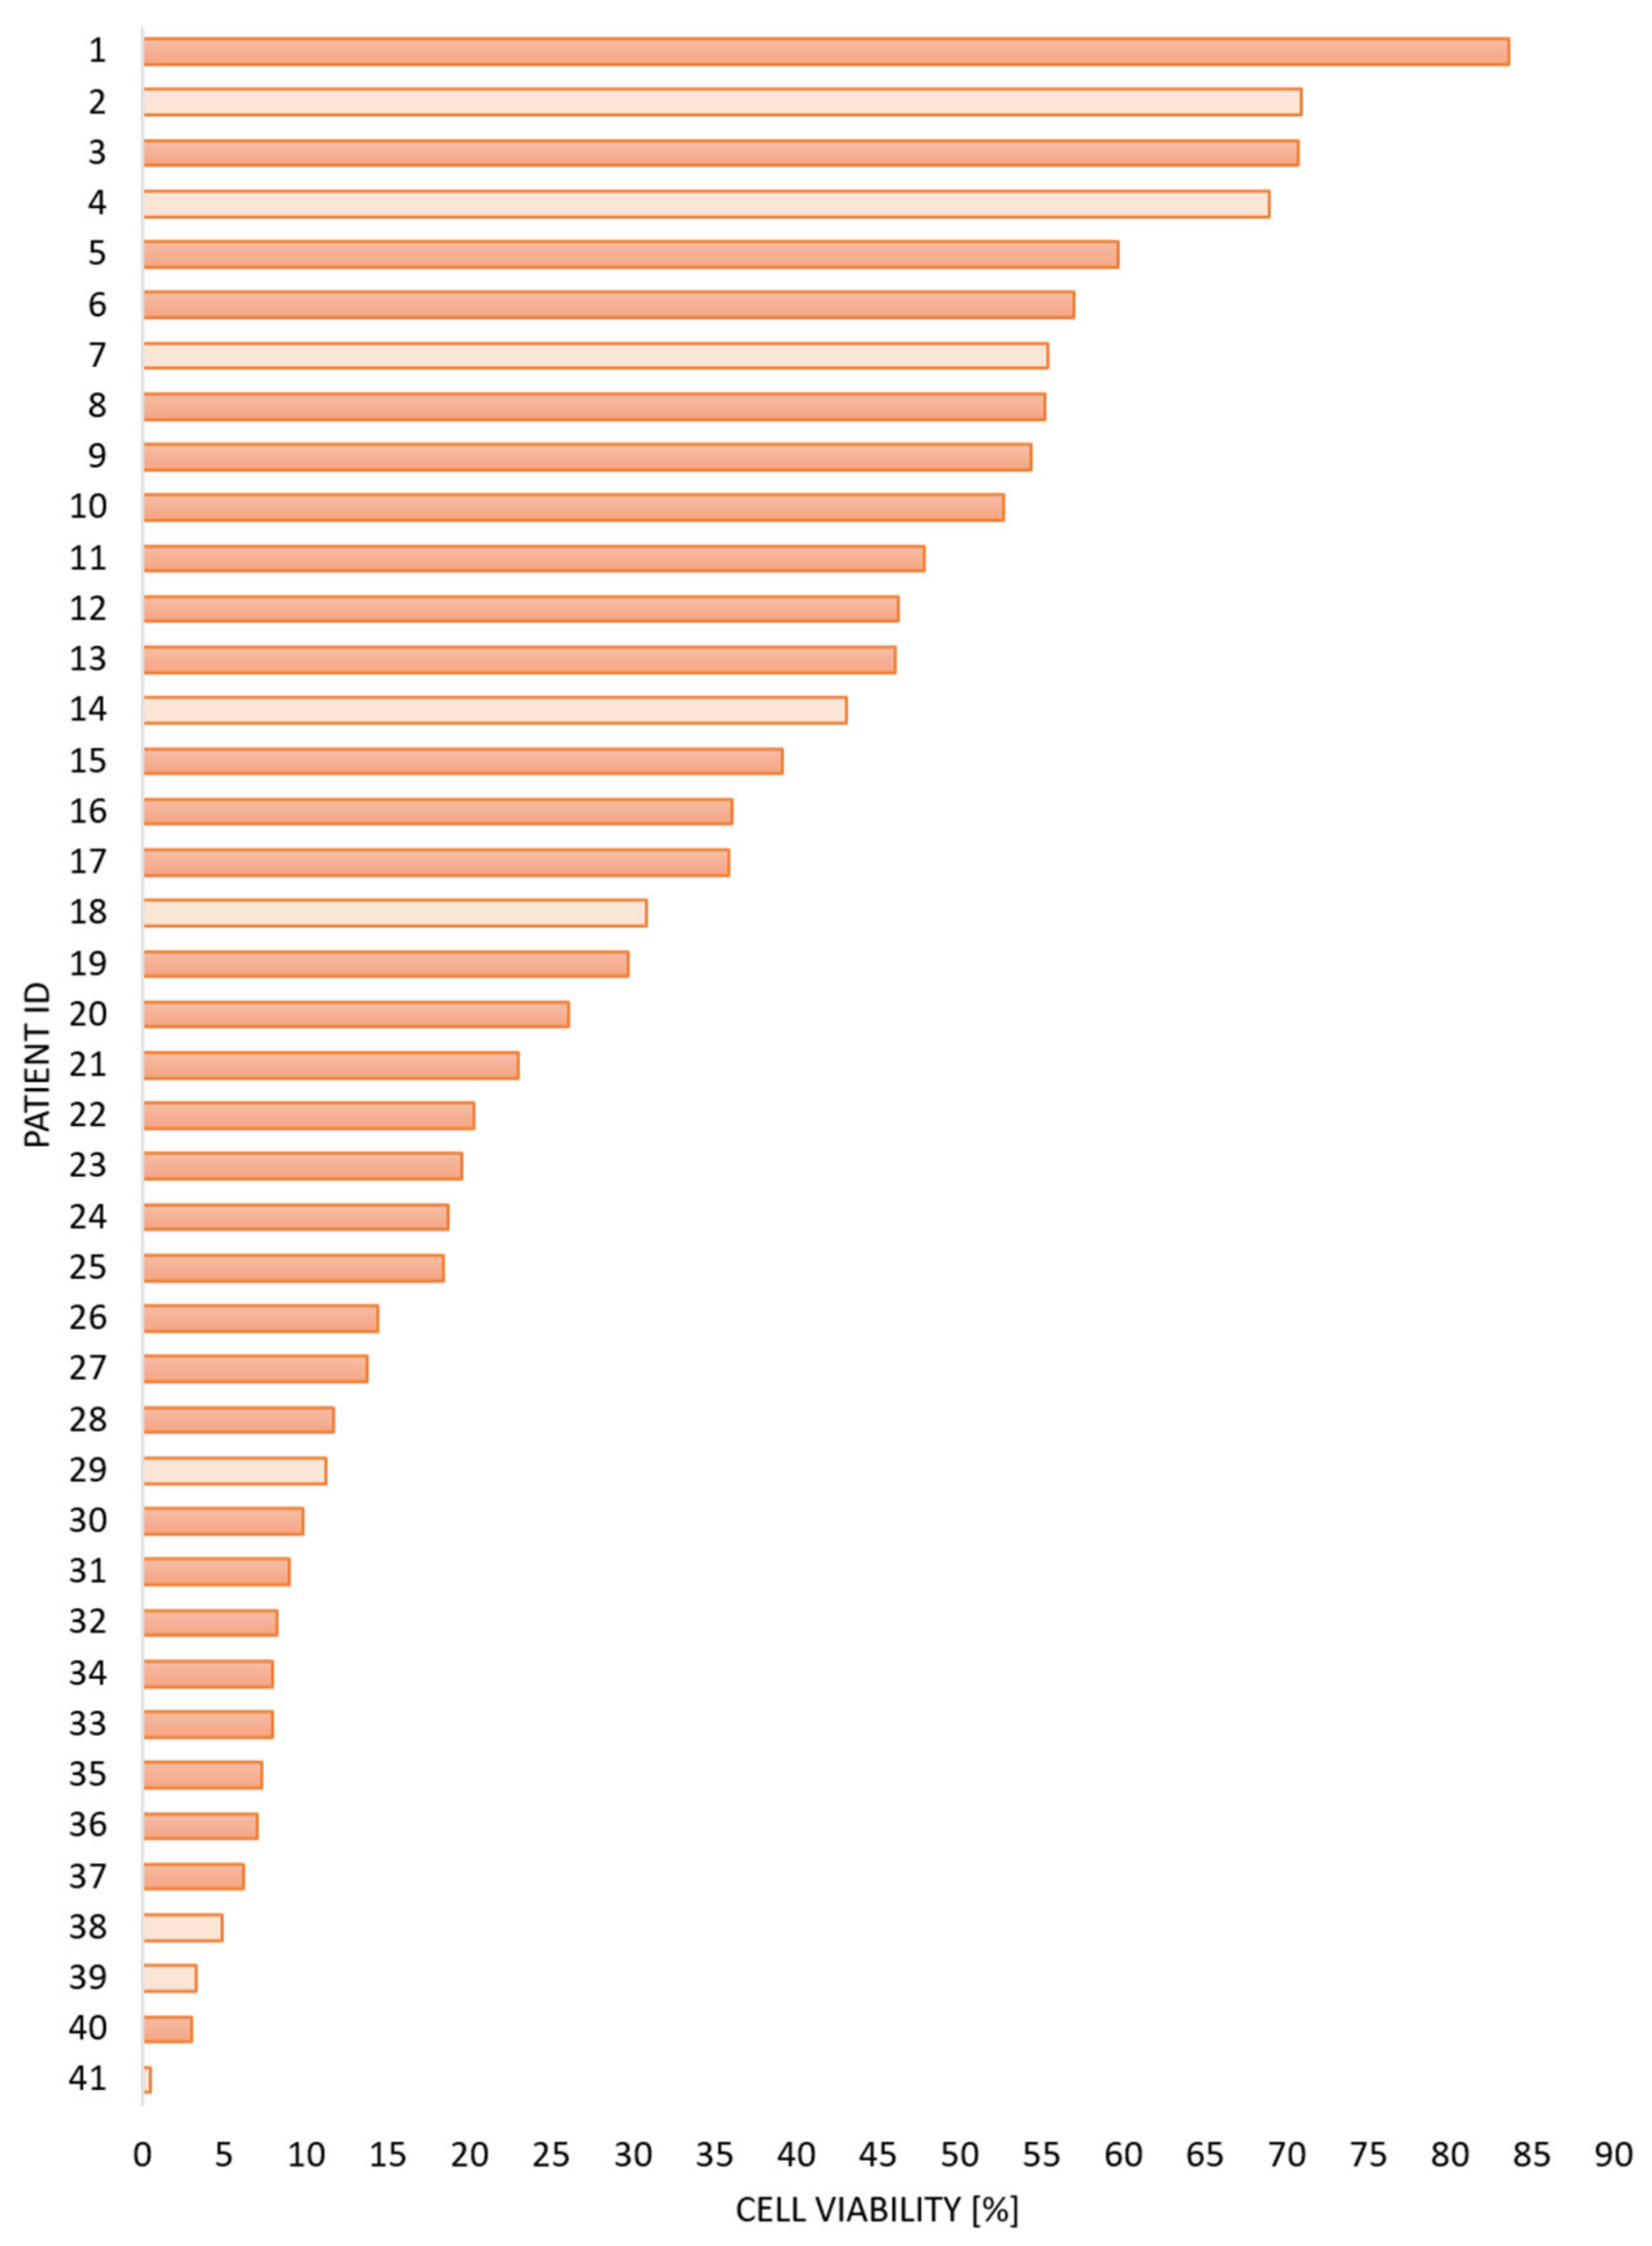
3.1. AML Patients Are Heterogeneous with Regard to Spondtaneous Apoptosis during In Vitro Culture of Their AML Cells

Cryopreserved primary AML cells derived from 41 patients were thawed and cultured for 48 h before the fractions of viable, early apoptotic and late apoptotic/necrotic cells were determined by flow-cytometric analysis as described previously [8]. The cells were cultured in an optimized medium (i.e., Stem Span TM [9]), but despite this we observed an expected variation between individual patients in the fraction of viable cells (Figure 1).
Cells from 32 of these patients were available for proteomic characterization during this process of spontaneous or stress-induced in vitro apoptosis. Based on the overall results for the whole group of 41 patients, we used a cut-off between high and low viability corresponding to 25% viable cells (Figure 1, Tables S1 and S2).
The clinical and biological characteristics of all patients with high (i.e., >25% viable cells) and low AML cell viability are presented in detail in Table S2. The two groups differed significantly with regard to patients with detectable spontaneous or autocrine in vitro proliferation (14 out of the 20 with high viability versus 7 out of 21 with low viability; Fisher’s exact test, p = 0.0244). This association between viability and proliferation was also confirmed by an alternative statistical analysis based on continuous variables (see Table S1, Pearson’s Correlation test, n = 40, r = 0.46, p = 0.002). The two groups did not differ significantly with regard to age, sex, previous hematological malignancies, AML cell differentiation (FAB/morphology, CD34 expression), karyotype, or molecular genetics (FLT3 and NPMI status). The 41 patients included a consecutive group of patients admitted to our hospital with the diagnosis of AML, and the 32 patients included in the proteomic studies represent an unselected subset. The left-out patients were four patients with low and five patients with high viability. The high viability subset of these 31 patients showed a median viability of 50.3% (n = 15, range 26.1–83.6%) and the low viability subset a median viability of 9.8% (n = 17, range 0.5–23.0%). Finally, the 15 high viability patients showed a median proliferation corresponding to 1830 counts per minute (cpm) (range < 1000 to 28°887 cpm), whereas the 17 low viability patients showed median proliferation corresponding to an undetectable level < 1000 cpm (range undetectable to 4263 cpm).

3.2. The Proteomic Analysis of AML Cells with High and Low Viability after In Vitro Culture

Proteomic studies were performed for 32 patients. Based on the overall results, we defined 25% viable cells at the cut-off point between high and low viability (Figure 1, Table S1). According to this definition, 15 patients were classified as high viability patients and 17 patients were classified as showing low viability. We quantified a total of 7902 proteins; more than 6500 proteins could be quantified for the large majority of patients, and the number of quantified proteins did not differ significantly between the two groups (Table S1).

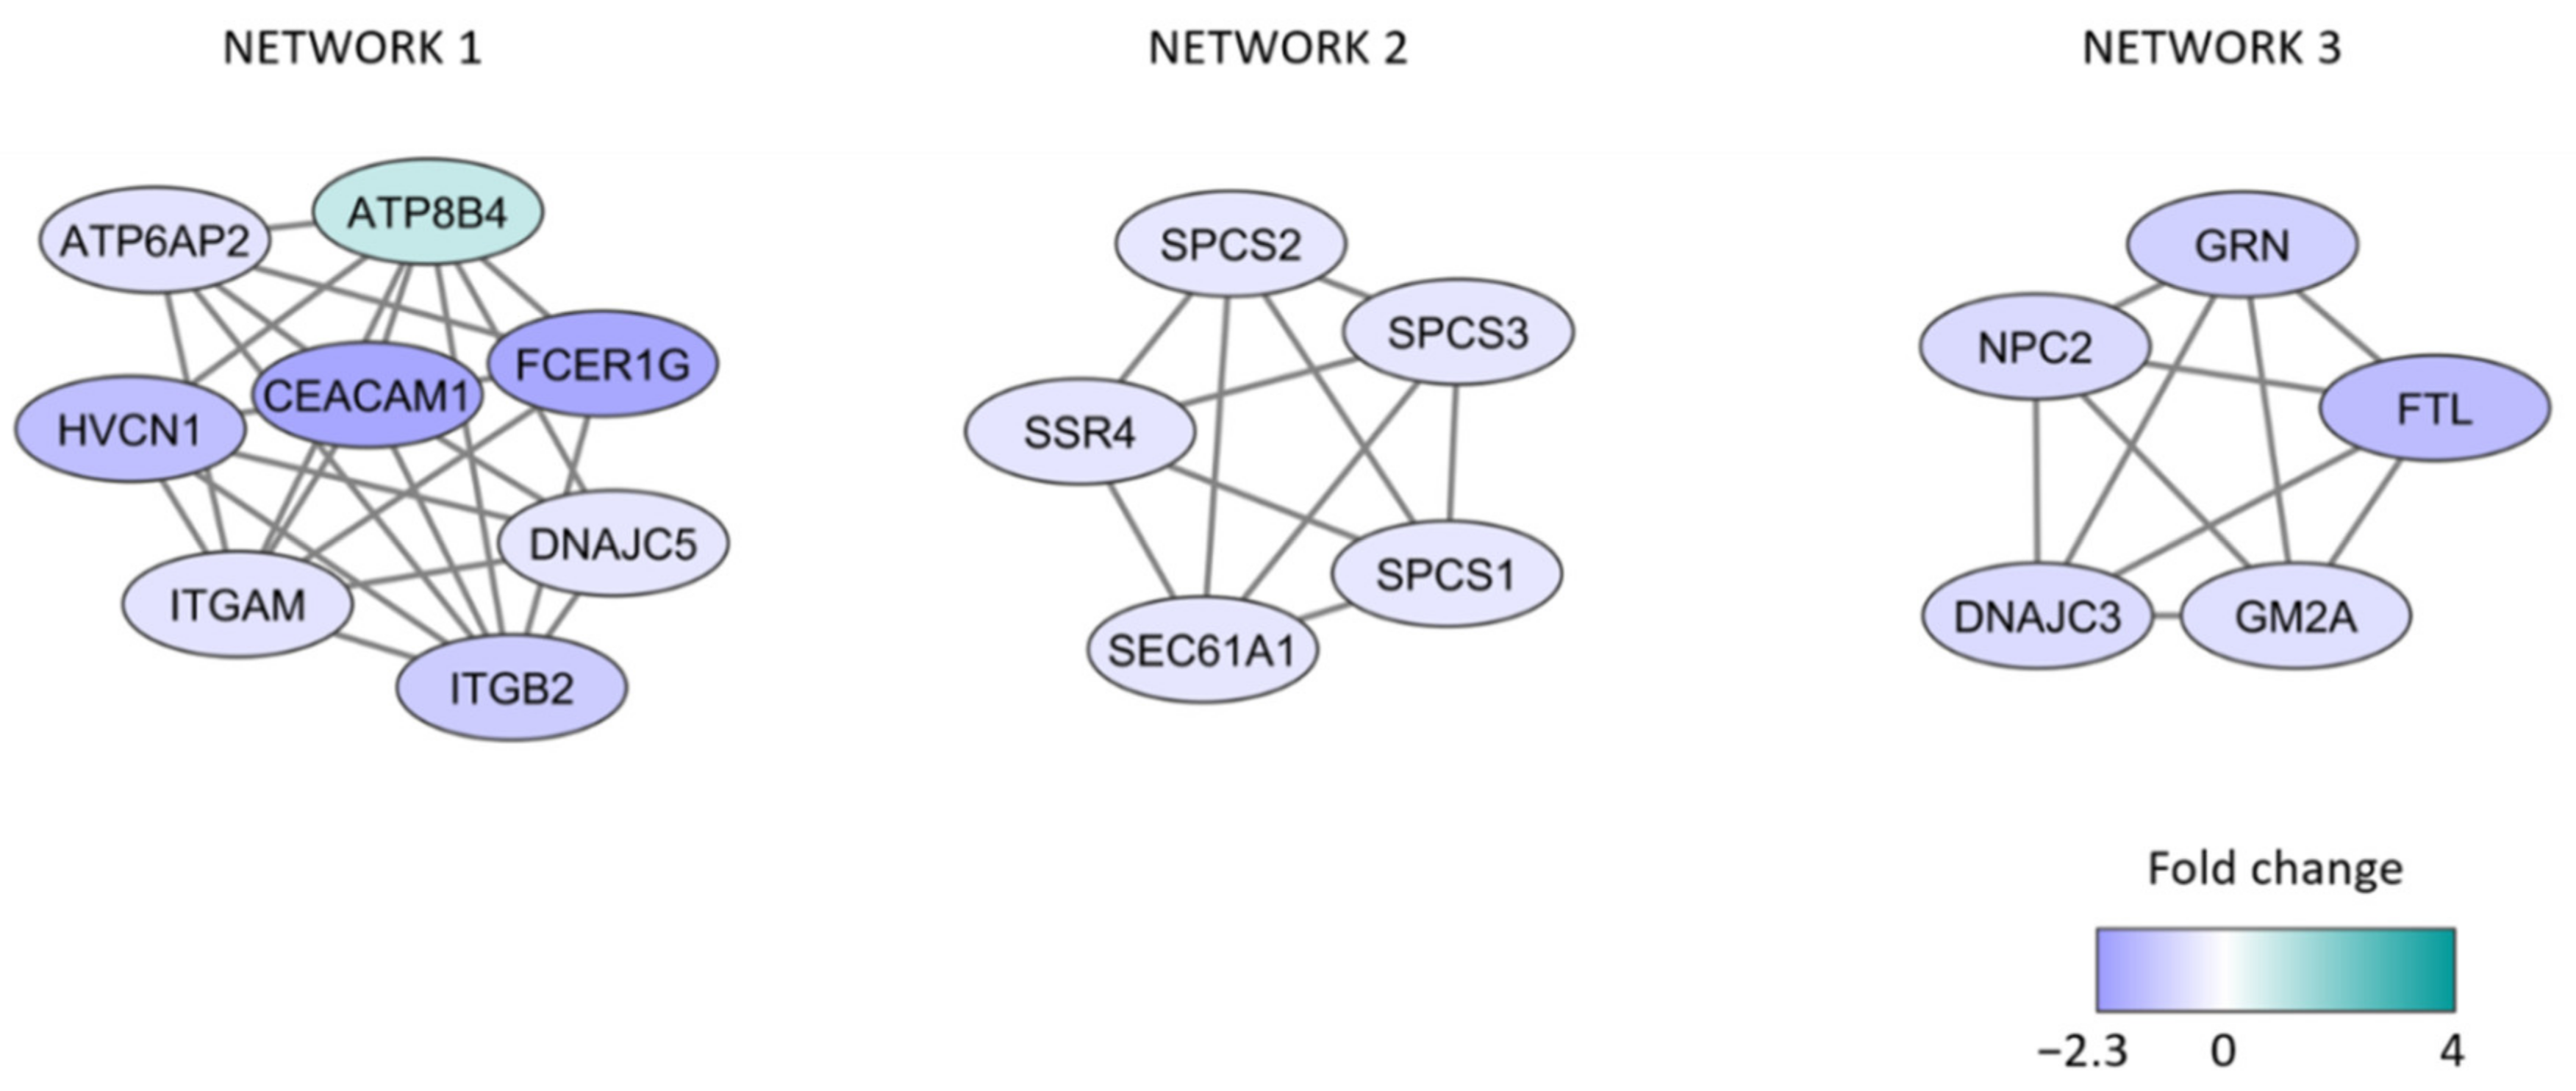
3.3. Identification of Proteins with Different Expression When Comparing Patients with High and Low AML Cell Viability after In Vitro Culture

None of the quantified proteins were detected only for one of the two patient subsets, and all proteins reaching quantifiable levels for at least five patients in one subset also reached quantifiable levels for at least five patients in the other subset. Thus, there is a considerable overlap with regard to the proteomic profile between the high and low viability groups with no qualitative differences (i.e., only quantitative differences, see below) between the two groups.
We also compared the expression of each individual quantified protein; this statistical comparison only included proteins that could be quantified for at least five patients in each of the two groups. A significant difference was defined as p < 0.05 when using Welch’s t test and Z-score; 276 differentially expressed proteins could then be identified (194 peptides with increased and 85 peptides with decreased levels in patients with high viability) and 53 of these proteins showed a p-value < 0.01 (43 increased and 10 decreased in patients with high viability) (Supplementary File 2). Thus, only a minority of the 7209 quantified proteins (less than 5%) show differential expression when comparing patients with high and low AML cell viability after in vitro culture, and most of these proteins show increased levels in cells with high viability after culture.
We did Gene ontology (GO) analyses of the proteins that were upregulated in the cells with high (193 proteins) and low viability (84 proteins), respectively. The most significant terms are listed in Table 2. It can be seen that high viability was associated with high expression especially of proteins involved in transcription, whereas low viability was associated with high levels of proteins involved in cell signaling and organellar functions, especially endoplasmic reticulum localization.
We also did protein network analyses of the differentially expressed proteins; the results from analysis based on MCODE are presented in Figure 2 and these proteins are described more in detail in Table S3. More extensive networks including the same proteins were identified when the analysis was based on String and Cytoscape (Figure S1). These networks were mainly associated with low viability, i.e., they mainly included proteins increased/relatively high levels for patients with high spontaneous or stress-induced in vitro apoptosis (Figure 2, Table 3). All three networks are important for secretory granule/vesicle formation and/or organellar membranes. Network 2 is also important for translation/cotranslation, the protein peptidase complex, and the endoplasmic reticulum, whereas network 3 is important for the lysosomal function (probably also including autophagy). Furthermore, 13 of the 18 network proteins can be localized to the endoplasmic reticulum, and five of them are involved in or influenced by the Endoplasmic reticulum stress response/Unfolded protein response, a cellular response that is characterized by protein un/misfolding, altered regulation of protein synthesis, and protein degradation (see Table S3) [32,33].
Detailed descriptions of the 18 network proteins are given in Table S3, and based on these data the following summary can be made:
  • A majority of the proteins are endoplasmic reticulum proteins (ATP6AP2, ATP8B4, SSR4, DNAJC3, ITGM, ITGB2, SPCS1/2/3, SEC61A1, GRN, NPC2, GM2A).
  • Several proteins are also involved in the endoplasmic reticulum stress response/unfolded protein response (ATP6AP, GRN, DNAJC3, possibly also ITGAM/ITGB2), function as chaperon (DNAJC5), or are increased during cellular stress (FTL).
  • Many of the proteins are also involved in the regulation of apoptosis (HVCN1, ATP6AP, CEACAM1, GRN, FTL, DNAJC3).
  • Finally, GM2A and ATP6AP2 are lysosomal proteins.
To conclude, both the GO term analyses and the protein network analyses suggest that the endoplasmic reticulum is important for the development of spontaneous stress-induced apoptosis during in vitro culture. The endoplasmic reticulum stress response/unfolded protein response is characterized by un/misfolding, altered transcriptional regulation, and adjustment of protein synthesis/chaperone capacity/protein degradation [33]. The network proteins are thus involved in all these processes. The final event of this stress reaction can be either adaptation, increased autophagy, or induction of apoptosis [34]. For our in vitro cultured AML cells, the observed differences in the regulation of this stress response (see Table 2 and Table 3) are associated with increased apoptosis and decreased leukemic cell viability after cryopreservation/thawing/in vitro culture.

3.4. The BCL-2 Family

The BCL2 family proteins are important regulators in apoptosis [34,35,36,37,38], and a high preculture BCL2/BAX ratio as well as a high BCL2 level of primary AML cells are associated with high viability (i.e., low spontaneous in vitro apoptosis) [8]. However, we could not detect any significant associations between the levels of BCL2 family members and the degree of spontaneous apoptosis after 48 h of in vitro culture:
  • BCL2, MCL1, and BID could be quantified for all 32 patients, whereas BAX was detected for all 17 low viability patients and all except one high viability patient. The levels did not differ between the two patient groups.
  • BAK1 was expressed for 16 low and for 13 high viability patients. The levels did not differ between patients with high and low viability.
  • BMF was quantified for a minority of both high viability (six patients) and low viability patients (five patients); the levels did not differ significantly between the groups.
  • NOXA, BIK, HRK, BCLXL, BFL1, BIM, and PUMA could not be quantified for any patient.
These observations suggest that there is no major difference between patients with high and low AML cell viability in the expression of these BCL2 family members during the ongoing process of spontaneous/stress-induced in vitro apoptosis. Furthermore, eight of the 17 low viability patients and three out of the 15 high-viability patients showed a BCL2/BAX ratio exceeding 1; this difference did not even reach borderline significance (Fisher’s exact test, p = 0.258). Finally, we did an unsupervised hierarchical clustering analysis based on the six BCL2 family members with quantifiable protein levels (Figure S2); two main patient subsets could then be identified but the distribution of high/low viability patient samples did not differ between these two patient subsets.

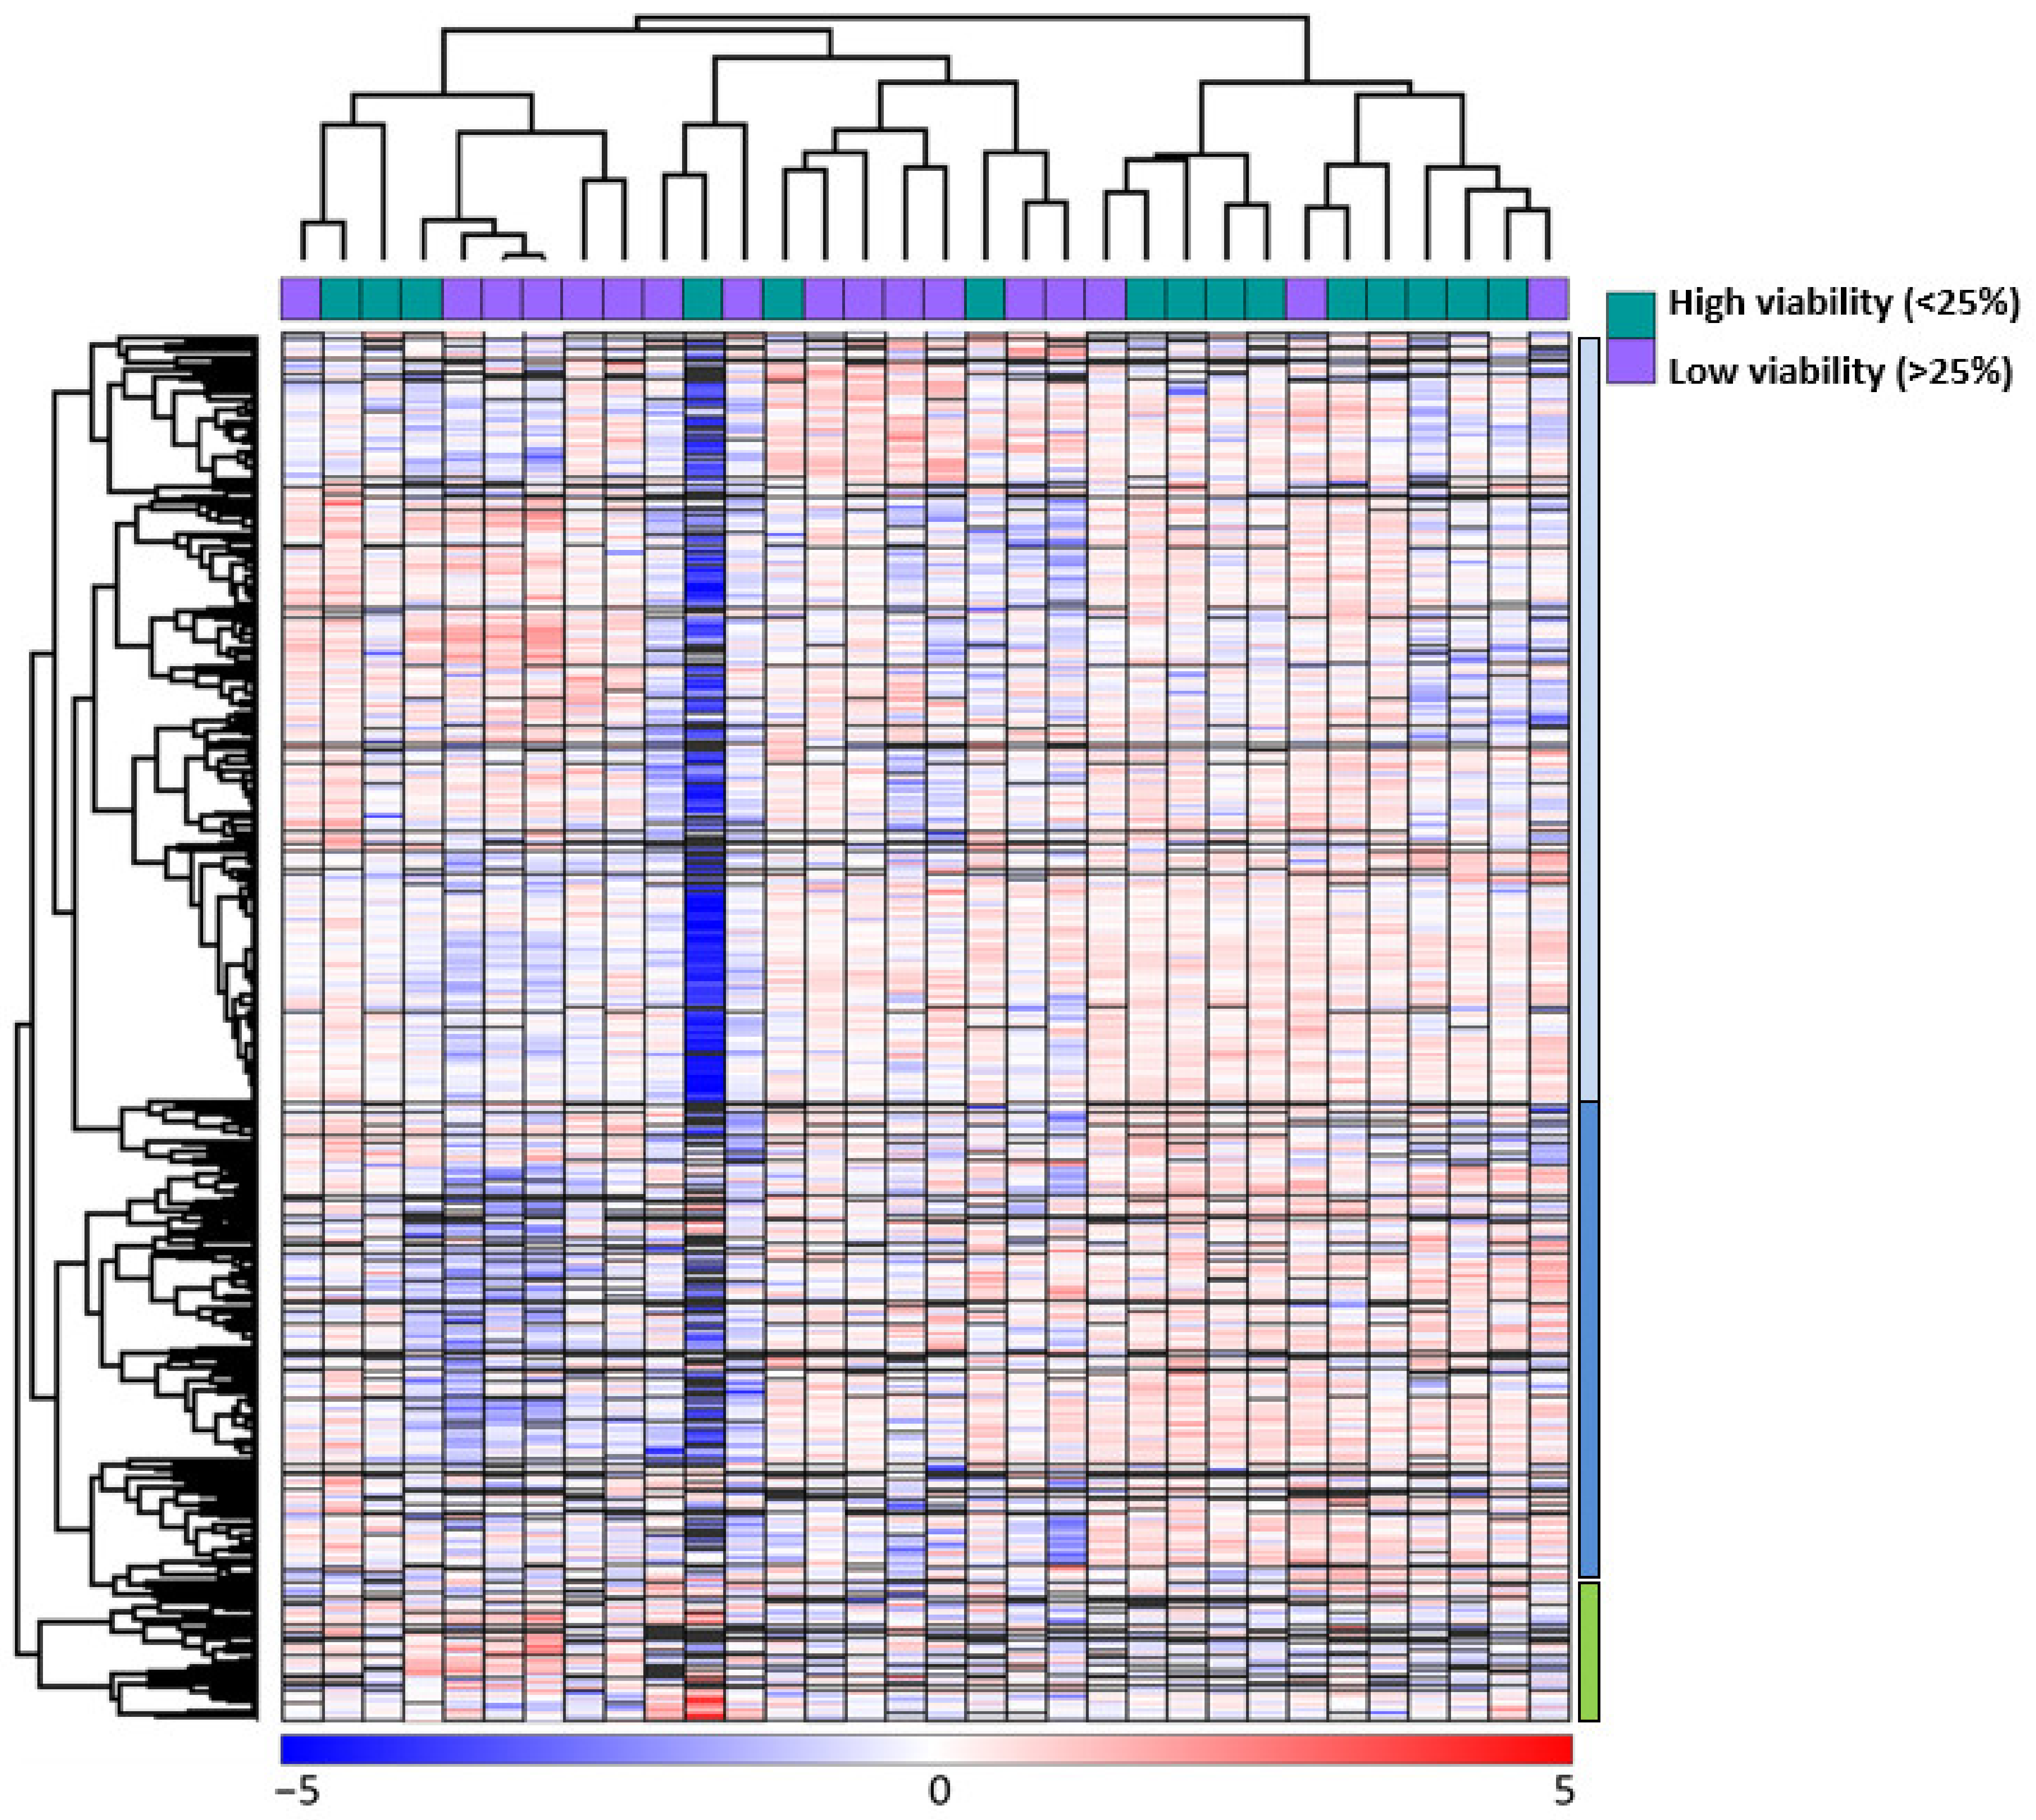
3.5. Unuspervised Hierarchical Clustering Analysis Based on the Global AML Cell Proteomic Profile during Ongoing Spontaneous Stress-Induced Apoptosis

We did an unsupervised hierarchical cluster analysis based on the global proteomic profiles of the 32 primary AML cells (Figure 3). This analysis identified two main patient clusters referred to as the larger patient Subset 1 (the 20 left patients) and the smaller patient Subsets 2 (the 12 right patients); the larger left patient cluster could be further divided into two subsets with 9 and 11 patients, respectively. We also identified three protein subsets. The upper main protein cluster A (indicated by blue color to the right in the figure) included the majority of proteins and could be further divided into two subsets/subclusters referred to as the upper A1 (bright blue color) and lower A2 (dark blue) subclusters. The last main protein cluster included a small group of proteins and is referred to as main protein cluster B (indicated by green, see lower right in the figure).
A majority of the high AML cell viability patients were included in the minor right patient cluster/subset 2 (9 of the 12 patients), whereas only six of the high viability patients were included among the 20 patients in the larger patient cluster 1 (Fisher’s exact test, p = 0.0269). Thus, the difference in AML cell viability is also reflected in the clustering analysis based on the global proteomic profiles, but this analysis could not separate the high/low patients into two separate groups. The analysis also shows that even high-viability patients are heterogeneous with regard to the global proteomic profile, and the minority of high viability patients included in the left main patient cluster even included an exceptional patient with very low protein levels for a majority of proteins in the upper main protein cluster. This exceptional patient was an elderly patient with AML secondary to MDS and showing the highest AML cell viability of all 41 patients (Table S1, patient 1).
The three main patient groups (i.e., the two subsets in main cluster 1 including 9 and 11 patients, respectively; patient cluster 2) subsets did not differ significantly with regard to age, sex, or expression of the stem cell marker CD34 (Table S4). However, morphological signs of differentiation (FAB 4/5) differed significantly (Kruskall–Wallis test, p = 0.04221), and a large group of these patients clustered together in patient subset 3. Furthermore, the number of patients with Flt3-ITD reached only borderline significance when comparing the two main clusters (Fisher’s exact test, p = 0.0542), but the FLt3-ITD patients clustered close to each other especially the eight FLT3-ITD patients in patient subset 2, and patients with the genotype Normal karyotype/FLT3-ITD/NPM1-Ins were mainly located in the patient subset 2 (Table S4; Fishers exact test, p = 0.0135).
We compared the two patient clusters 1 and 2 with regard to different expression of individual proteins. A significant difference was defined as p < 0.05 when using Welch’s t test and Z-score. We then identified 217 differentially expressed proteins; 130 proteins were significantly increased for the 12 patients in the right cluster 2 that included nine patients with high viability, whereas 87 proteins were significantly increased in the larger left cluster 1 that mainly included patients with low viability (Supplementary File 2).
We also did GO analyses to compare the two main patient subsets, and these analyses also showed that these two patient subsets differed with regard to transcriptional regulation as well as extracellular space/region, plasma membrane, and intracellular vesicles (Table 4). Thus, the two main subsets differed with regard to the frequencies of patients with high/low viability after in vitro culture, and the most significant GO terms reflect similar differences as the proteomic comparison of high/low viability cells.
We also did GO analyses to compare the three main protein subsets, and these analyses showed that the three clusters differed with regard to proteins involved in endoplasmic reticulum/transport/organelle membrane (Cluster A1), nucleus/transcription (cluster A2), and extracellular/secreted proteins (Cluster B) (Table 5).
To conclude, the unsupervised hierarchical clustering analysis was based on the overall proteomic profiles of primary human AML cells during the process of stress-induced apoptosis, and the clustering analysis does not only reflect differences between patients with regard to endoplasmic reticulum stress/apoptosis but also differences associated with fundamental biological characteristics of the cells (i.e., morphology/differentiation and genetic abnormalities).

3.6. Hierarchical Clustering Analysis Based on the Overall Proteomic Profiles of the AML Cells; the Associations between Bax:Bcl2 Balance and Patient Subclassification

We estimated the Bax:Bcl2 ratio for AML cells derived from all 32 patients (Table S5). The Bax:Bcl2 ratio showed no correlation with AML cell viability (Pearson’s correlation test, r = 0.08) or AML cell proliferation (r = 0.05).
We then compared the Bax:Bcl2 ratio for the various patient subsets identified by the hierarchical clustering analysis (Figure 3); this analysis identified the two main patient clusters 1 and 2, and the main cluster 1 could be further divided into the two subsets/subclusters 1.1 (the nine left patients) and 1.2 (the other 11 patients) (Figure 3; Table S5). Patient subcluster 1.2 included a significantly higher number of patients with low AML cell viability (see Table S4 and Section 3.5). However, cluster 1.2 also included an increased number of patients with a Bax:Bcl2 ratio < 1.0 (Table S5; 8 out of 11 patients) compared with the other patients (4 out of 21 patients; Fisher’s exact test, p = 0.006). The four last patients with Bax:Bcl2 ratio < 1.0 clustered together in patient cluster 2 (Figure 3, Table S5), and in contrast the eight other patients including the four last patients were characterized by relatively high AML cell viability (range 23.0–70.7% viable cells). Thus, a low Bax:Bcl2 ratio (i.e., indicating a higher antiapoptotic activity that favors AML cell survival) is observed only for a subset/minority of the patients with high AML cell viability.
To summarize, (i) the Bax:Bcl2 ratio showed no association with AML cell viability; but (ii) patients with low Bax:Bcl2 ratio < 1.0 showed a limited heterogeneity with regard to the overall proteomic profile and clustered close to each other in only two different groups; and (iii) only one of these two Bax:Bcl2 < 1.0 patient subsets showed high viability/low apoptosis. Taken together these observations are consistent with the hypothesis that the impact of the Bax:Bcl2 balance on AML cell survival (i.e., stress-induced apoptosis) varies between patients and a strong effect of this balance is seen only for a minority of these patients. For most patients, other regulatory mechanisms (e.g., the endoplasmic stress reaction) seem to be more important to maintain the proapoptotic activity during ongoing spontaneous in vitro apoptosis.

4. Discussion

Functional in vitro models are extensively used in experimental studies of AML, and it is then important to use well-characterized and standardized models. However, primary AML cells undergo spontaneous or stress-induced apoptosis during in vitro culture even when using optimized culture conditions [8], and a better understanding of this phenomenon is important for our understanding and interpretation of results from experimental AML studies. Even though spontaneous apoptosis is seen for all patients, the degree and kinetics of the apoptotic process vary between patients [8,11], and the apoptotic process itself may therefore reflect important and possibly clinically relevant biological differences between patients. If this is the case, it would be similar to xenograft models of human AML where differences in engraftment reflect clinical outcome and engraftment is seen especially for patients with adverse outcome [39].
Our study included only patients with relatively high levels of AML cells in peripheral blood; enriched AML cell populations could then be prepared by density gradient separation alone [4,5]. By using this simple and highly standardized method for cell preparation, it was possible to avoid alterations induced by more extensive separation procedures [5]. Even though the level of circulating leukemia cells does not seem to have any major prognostic impact for patients receiving intensive and potentially curative chemotherapy (especially when the leukocyte count is below 100 × 109/L; for a detailed discussion see [12]), we would emphasize that our present results may be representative only for patients with relatively high levels of circulating AML cells.
As described in Section 2, our patients represent a consecutive group of 42 patients admitted to Haukeland University Hospital. Thus, all samples were derived during their stay at the Section for Hematology at our hospital and shipment of samples was thereby avoided; the samples could immediately be transported to our laboratory and cryopreservation of enriched AML samples was then done without delay and in accordance with the same standardized guidelines for all samples included in the study.
Previous studies suggest that AML relapse is derived from residual leukemic stem cells [13], and the risk of relapse will therefore depend on the chemosensitivity of this minority within the hierarchically organized AML cell population. However, one would expect that both the leukemic stem cells and the majority of more mature AML cells have the same genetic abnormalities that are important prognostic factors in AML [1]. Furthermore, several other biological characteristics of the total AML cell population are also associated with long-term AML-free survival, including mRNA expression profiles, noncoding RNA profiles, proteomic and phosphoproteomic profiles, as well as characteristics of epigenetic and metabolic regulation [12,14,15,16,17,18,19,20]. Finally, (i) no morphological signs of residual bone marrow disease 14 days after start of induction treatment and (ii) complete remission achieved after only one induction cycle are established prognostic markers in AML, and both these morphological criteria refer to the chemosensitivity of the overall AML cell population. For these reasons, we regard investigation of the overall cell populations to be relevant.
AML cells undergo spontaneous apoptosis during in vitro culture, and the viability will gradually decrease during standardized culture conditions corresponding to the conditions used in our present study (i.e., cryopreservation/thawing/serum-free IMDM-based medium/48 h of culture), although it shows a wide variation between patients [8]. We did our proteomic evaluation of the AML cells after 48 h of in vitro culture because at this time point patients show a wide variation in leukemic cell viability before the leukemic cell viability further decreases to similar low levels of viable cells [8]. Thus, the difference between patients with regard to spontaneous in vitro apoptosis is mainly due to differences in the kinetics of apoptosis induction. Finally, previous methodological studies have shown that intact viable/apoptotic/necrotic cells can then be detected [8].
Previous studies suggest that the balance between cellular levels of BAX and BCL2 is important for regulation of apoptosis during in vitro AML cell culture, and high preculture BCL2 levels or high BCL2:BAX ratios are then associated with low degree of apoptosis [8]. Several studies also suggest that this pretherapy balance between pro- and antiapoptotic mediators in the AML cells is associated with prognosis after intensive therapy; most of these studies have described that high BCL2 level, relatively low BAX level, or low high BCL2/BAX ratio are associated with decreased long-term AML-free survival [40,41,42,43,44,45,46,47]. One previous study suggests that the intracellular mediator compartmentalization is important for the associations with prognosis [45]. Furthermore, high spontaneous AML cell apoptosis with low viability is also associated with low preculture cellular levels of Heat shock protein (HSP) 70 and HSP90 [8], and clinical studies have shown that high intracellular HSP70/HSP90 levels in the malignant cells are associated with reduced survival both in AML and preleukemic myelodysplastic syndrome [48,49]. Although intracellular levels of neither BCL2/BAX nor HSP70/HSP90 are regarded as independent prognostic parameters in AML [1], these clinical observations indicate that BCL2/BAX as well as HSP70/HSP90 levels are important both (i) for clinical chemoresistance and thereby contribute to a high-risk AML cell phenotype, and (ii) they are in addition important for regulation of spontaneous or stress-induced AML cell apoptosis. Taken together these observations indicate that the molecular mechanisms involved in spontaneous in vitro apoptosis can influence the clinical chemosensitivity/survival.
In the present study, we investigated the proteomic profiles of AML cells derived from a consecutive group of patients. These patients showed a wide variation in the degree of spontaneous apoptosis/cell viability after standardized in vitro culture. High spontaneous apoptosis is associated with a high BCL2/BAX ratio and decreased levels of the chaperones HSP70 and HSP90 [8]. Our present study also suggests that the patient heterogeneity with regard to spontaneous in vitro apoptosis reflects complex cellular differences between patients in the regulation of apoptosis. Furthermore, we observed a significant association between spontaneous apoptosis and the capacity of short-term autocrine proliferation; and previous studies have described significant associations between short-term proliferative capacity and survival after intensive chemotherapy [50,51]. Taken together, these observations suggest that clinical chemoresistance/survival is reflected both in the capacity of autocrine short-term proliferation and resistance to spontaneous apoptosis, although it should be emphasized that the capacity of long-term in vitro proliferation [11,52] or xenotransplant proliferation/engraftment [52] seems to show a stronger association than both short-term proliferation and AML cell survival.
The associations between BCL2/BAX/HSP70/HSP90 and apoptosis/cell survival have been described in native AML cells prior to in vitro culture [32,33,41,42,43,44,45,46,47,53,54,55]. In our present study, we decided to further study the proteomic profiles as a dynamic profile during ongoing apoptosis-inducing in vitro culture. We could not detect any differences in cellular levels of BCL2 family members or HSP70/HSP90 when comparing patients with high and low cellular viability after 48 h of in vitro culture. This observation can probably be explained by modulation of BCL2 family member and HSP levels during culture, e.g., by the stress-induced endoplasmic reticulum/unfolded protein stress response [56,57,58].
Our proteomic study suggests that the endoplasmic reticulum stress/unfolded protein reaction is important for regulation of AML cell viability/apoptosis. The endoplasmic stress can result in better balance between protein synthesis and chaperone capacity by reducing protein synthesis, increasing chaperone capacity, and inducing autophagy/protein degradation, but the reaction can also result in induction of apoptosis [57,58,59,60,61,62,63,64,65,66,67]. The importance of this reaction as a proapoptotic signal seems to vary between patients. Our study indicates that its importance is also reflected in the extent of spontaneous in vitro apoptosis; and the potential role of this reaction as a proapoptotic signal during cellular stress is as also suggested by the association with the pre-stress cellular levels of the HSP70 and HSP90 chaperones [8]. Our present study also identified three protein networks that seem to be of particular importance for the proapoptotic effect of the endoplasmic reticulum stress response in AML cells. However, our hierarchical clustering analysis suggests that the global proteomic profile in addition is influenced by other AML cell characteristics (e.g., cell differentiation, genetic abnormalities) even during cytoplasmic reticulum stress. Similar associations between morphology and the proteomic profile have been described previously for primary AML cells investigated without in vitro culture [68]. Thus, future studies of possible biomarkers for increased susceptibility to endoplasmic reticulum stress should focus on selected proteins or protein profiles (e.g., proteins identified in our present study) and not on the global proteomic profiles.
In our study we observed differences in the regulation of the endoplasmic stress response when comparing the cryopreserved cells before in vitro culture. These differences may be present in circulating AML cells in vivo, but we cannot exclude the possibility that they are caused by an ex vivo stress response to cell separation and cryopreservation. However, the observed association between prognosis and activation of the endoplasmic stress response in previous clinical studies [69,70] suggest that our present observations have a clinical relevance independent of whether our differences represent an ex vivo stress response or not. In our opinion, the present differences probably represent in vivo differences; modulation of intracellular protein levels during ex vivo handling of cell samples at a standardized room temperature seems less likely. However, further studies are needed to clarify whether these differences are important also in vivo, e.g., as a stress response during antileukemic treatment.
In our study we included a relatively large group of consecutive patients, for this reason a large number of elderly patients unfit for intensive and potentially curative therapy were included. Our patients are thus representative with regard to AML cell biology, but they are heterogeneous with regard to antileukemic treatment, and for this reason the numbers are too low to allow comparison of survival between patient subsets.
The endoplasmic stress response has been investigated in few previous AML studies. Two studies examined mRNA levels of three cellular molecules/biomarkers of endoplasmic reticulum stress and suggested that signs of endoplasmic reticulum stress were associated with a favorable prognosis [69,70]. This is also consistent with another study suggesting that endoplasmic reticulum stress can induce apoptosis in human AML cells [71]. A last recent study emphasized the importance of the JUN transcription factor for the regulation of several key effectors of this stress reaction [72]. These last authors suggest that inhibition of JUN activation through blocking of upstream signaling or direct JUN inhibition should be considered as possible therapeutic strategies in human AML. An alternative strategy could be inhibition of the V-ATPase as suggested by our present results and from the observations in other malignancies [72].
Several strategies have been investigated to improve the survival/viability of cryopreserved cells, and especially the studies of normal hematological stem/progenitor cells are relevant for AML cells. To the best of our knowledge, no previous studies have compared different procedures for cryopreservation of immature malignant hematopoietic cells, e.g., primary human AML cells. Targeting the endoplasmic stress response may be a possibility to improve viability, but it has not been investigated in previous studies. Most of the reported studies of normal hematopoietic cells have tried to decrease the toxicity of the freezing solutions. First, reduction of the toxic dimethyl sulfoxide concentration from 10% to 5% seems to improve the survival of normal immature hematopoietic cells, including hematopoietic stem cells [73,74]. Second, addition of antiapoptotic agents to the freezing solutions can also reduce the toxicity, e.g., catalase, threalose, and hyaluronic acid [75,76,77]. Thirdly, optimization of the freezing or thawing procedures should also be further investigated, although controlled cooling does not seem to have an effect [78]. Finally, improved viability by the use of boron has been described for mesenchymal stem cells [79]. Until there is a general agreement on the optimal method for stem cell or AML cell preservation, it will be important to include detailed descriptions of the methods for cryopreservation and thawing in future biobank studies, and only to include/compare samples that are prepared according to the same methodological protocols [80,81].

5. Conclusions

High stress-induced spontaneous apoptosis of in vitro cultured primary human AML cells is associated with high expression of several markers of the endoplasmic reticulum/unfolded protein stress response. Although the endoplasmic reticulum response can function as a protective mechanism during cellular stress, our study suggests that at least for certain patients this stress response is associated with apoptosis induction. This effect has also been described in AML xenograft models [71]. Further increase of the endoplasmic reticulum stress through targeted therapy may therefore represent a possible strategy to increase the proapoptotic activity for this AML patient subset, i.e., as a part of future and personalized AML therapy [82].

Supplementary Materials

The following are available online at https://0-www-mdpi-com.brum.beds.ac.uk/article/10.3390/hemato2030039/s1, Table S1: The classification of 41 AML patients based on the degree of spontaneous in vitro stress-induced apoptosis of their leukemic cells, Table S2: Clinical and biological characteristics of AML patients included in the study; the patients are listed based on the AML cell viability after 48 h of in vitro culture, Table S3: Interaction network analyses of proteins showing a significant difference between patients with high and low spontaneous in vitro apoptosis. Table S4: Clinical and biological characteristics of AML patients included in the study; the patients are listed according to the two main patient clusters, Table S5: The Bax:Bcl2 ratio during spontaneous in vitro apoptosis of primary human AML cells derived from 32 patients; a comparison with the hierarchical clustering analysis of the AML cell proteomic profiles. Figure S1: Protein network analysis of differentially expressed proteins based on String and Cytoscape, Figure S2. Unsupervised hierarchical clustering analysis based on the expression of BCL2 family members. Supplementary File 2: Page 1: A list of differentially expressed proteins when comparing patients with high and low viability after in vitro culture based on a p-value < 0.05. Page 2: A list of differentially expressed proteins based on a p-value < 0.01. Page 3: A list of protein showing differential expression when comparing the patient main clusters identified in Figure 3.

Author Contributions

Conceptualization, E.A., E.B., A.K.B. and Ø.B.; methodology, E.A., E.B., M.H.-V., F.S., F.S.B., A.K.B., H.R. and Ø.B.; formal analysis, E.A., E.B., M.H.-V. and Ø.B.; investigation E.A., E.B. and A.K.B.; resources, Ø.B.; data curation, E.A. and E.B; writing—original draft preparation, E.A. and Ø.B.; writing—review and editing, E.A, E.B., F.S., F.S.B., M.H.-V., H.R., A.K.B. and Ø.B.; visualization, E.A. and Ø.B.; supervision, A.K.B. and Ø.B.; project administration, Ø.B.; funding acquisition, Ø.B. All authors have read and agreed to the published version of the manuscript.

Funding

This research was funded by the Norwegian Cancer Society (grant 100933 and 182609) and Research Council of Norway (INFRASTRUKTUR-program grant 295910).

Institutional Review Board Statement

The project was approved by the Regional Ethics Committee REK Vest (University of Bergen), references 2017/305 and 2015/1759.

Informed Consent Statement

Cells were collected after written informed consent.

Data Availability Statement

The data presented in this study are available on request from the corresponding author.

Acknowledgments

The assistance of Kristin Paulsen Rye and Olav Mjaavatn is gratefully acknowledged. Mass spectrometry-based proteomic analyses were performed by The Proteomics Unit at University of Bergen (PROBE). This facility is a member of the National Network of Advanced Proteomics Infrastructure (NAPI), which is funded by the Research Council of Norway (INFRASTRUKTUR-program project number: 295910).

Conflicts of Interest

The authors declare no conflict of interest.

References

  1. Döhner, H.; Estey, E.; Grimwade, D.; Amadori, S.; Appelbaum, F.R.; Büchner, T.; Dombret, H.; Ebert, B.L.; Fenaux, P.; Larson, R.A.; et al. Diagnosis and management of AML in adults: 2017 ELN recommendations from an international expert panel. Blood 2017, 129, 424–447. [Google Scholar] [CrossRef] [Green Version]
  2. Arber, D.A.; Orazi, A.; Hasserjian, R.; Thiele, J.; Borowitz, M.J.; Le Beau, M.M.; Bloomfield, C.D.; Cazzola, M.; Vardiman, J.W. The 2016 revision to the World Health Organization classification of myeloid neoplasms and acute leukemia. Blood 2016, 127, 2391–2405. [Google Scholar] [CrossRef] [PubMed]
  3. Sanz, M.A.; Fenaux, P.; Tallman, M.S.; Estey, E.H.; Löwenberg, B.; Naoe, T.; Lengfelder, E.; Döhner, H.; Burnett, A.K.; Chen, S.J.; et al. Management of acute promyelocytic leukemia: Updated recommendations from an expert panel of the European LeukemiaNet. Blood 2019, 133, 1630–1643. [Google Scholar] [CrossRef] [Green Version]
  4. Gjertsen, B.T.; Øyan, A.M.; Marzolf, B.; Hovland, R.; Gausdal, G.; Døskeland, S.O.; Dimitrov, K.; Golden, A.; Kalland, K.H.; Hood, L.; et al. Analysis of acute myelogenous leukemia: Preparation of samples for genomic and proteomic analyses. J. Hematother. Stem Cell Res. 2002, 11, 469–481. [Google Scholar] [CrossRef]
  5. Bruserud, Ø.; Gjertsen, B.T.; Foss, B.; Huang, T.S. New strategies in the treatment of acute myelogenous leukemia (AML): In vitro culture of aml cells—The present use in experimental studies and the possible importance for future therapeutic approaches. Stem Cells 2001, 19, 1–11. [Google Scholar] [CrossRef]
  6. Griffiths, M.; Sundaram, H. Drug design and testing: Profiling of antiproliferative agents for cancer therapy using a cell-based methyl-[3H]-thymidine incorporation assay. Methods Mol. Biol. 2011, 731, 451–465. [Google Scholar] [PubMed]
  7. Cavanagh, B.L.; Walker, T.; Norazit, A.; Meedeniya, A.C. Thymidine analogues for tracking DNA synthesis. Molecules 2011, 16, 7980–7993. [Google Scholar] [CrossRef] [PubMed] [Green Version]
  8. Ryningen, A.; Ersvaer, E.; Øyan, A.M.; Kalland, K.H.; Vintermyr, O.K.; Gjertsen, B.T.; Bruserud, Ø. Stress-induced in vitro apoptosis of native human acute myelogenous leukemia (AML) cells shows a wide variation between patients and is associated with low BCL-2:Bax ratio and low levels of heat shock protein 70 and 90. Leuk. Res. 2006, 30, 1531–1540. [Google Scholar] [CrossRef]
  9. Bruserud, Ø.; Gjertsen, B.T.; von Volkman, H.L. In vitro culture of human acute myelogenous leukemia (AML) cells in serum-free media: Studies of native AML blasts and AML cell lines. J. Hematother. Stem Cell Res. 2000, 9, 923–932. [Google Scholar] [CrossRef] [PubMed]
  10. Bruserud, Ø.; Frostad, S.; Foss, B. In vitro culture of acute myelogenous leukemia blasts: A comparison of four different culture media. J. Hematother. 1999, 8, 63–73. [Google Scholar] [CrossRef] [PubMed]
  11. Brenner, A.K.; Aasebø, E.; Hernandez-Valladares, M.; Selheim, F.; Berven, F.; Grønningsæter, I.S.; Bartaula-Brevik, S.; Bruserud, Ø. The capacity of long-term in vitro proliferation of acute myeloid leukemia cells supported only by exogenous cytokines is associated with a patient subset with adverse outcome. Cancers 2019, 11, 73. [Google Scholar] [CrossRef] [PubMed] [Green Version]
  12. Aasebø, E.; Berven, F.S.; Bartaula-Brevik, S.; Stokowy, T.; Hovland, R.; Vaudel, M.; Døskeland, S.O.; McCormack, E.; Batth, T.S.; Olsen, J.V.; et al. Proteome and phosphoproteome changes associated with prognosis in acute myeloid leukemia. Cancers 2020, 12, 709. [Google Scholar] [CrossRef] [Green Version]
  13. Bruserud, Ø.; Aasebø, E.; Hernandez-Valladares, M.; Tsykunova, G.; Reikvam, H. Therapeutic targeting of leukemic stem cells in acute myeloid leukemia—The biological background for possible strategies. Expert Opin. Drug Discov. 2017, 12, 1053–1065. [Google Scholar] [CrossRef]
  14. Hernandez-Valladares, M.; Bruserud, Ø.; Selheim, F. The implementation of mass spectrometry-based proteomics workflows in clinical routines of acute myeloid leukemia: Applicability and perspectives. Int. J. Mol. Sci. 2020, 21, 6830. [Google Scholar] [CrossRef]
  15. Aasebø, E.; Berven, F.S.; Hovland, R.; Døskeland, S.O.; Bruserud, Ø.; Selheim, F.; Hernandez-Valladares, M. The progression of acute myeloid leukemia from first diagnosis to chemoresistant relapse: A comparison of proteomic and phosphoproteomic profiles. Cancers 2020, 12, 1466. [Google Scholar] [CrossRef] [PubMed]
  16. Mer, A.S.; Lindberg, J.; Nilsson, C.; Klevebring, D.; Wang, M.; Grönberg, H.; Lehmann, S.; Rantalainen, M. Expression levels of long non-coding RNAs are prognostic for AML outcome. J. Hematol. Oncol. 2018, 11, 52. [Google Scholar] [CrossRef] [PubMed] [Green Version]
  17. Stäubert, C.; Bhuiyan, H.; Lindahl, A.; Broom, O.J.; Zhu, Y.; Islam, S.; Linnarsson, S.; Lehtiö, J.; Nordström, A. Rewired metabolism in drug-resistant leukemia cells: A metabolic switch hallmarked by reduced dependence on exogenous glutamine. J. Biol. Chem. 2015, 290, 8348–8359. [Google Scholar] [CrossRef] [PubMed] [Green Version]
  18. Lazarevic, V.; Hörstedt, A.S.; Johansson, B.; Antunovic, P.; Billström, R.; Derolf, Å.; Lehmann, S.; Möllgård, L.; Peterson, S.; Stockelberg, D.; et al. Failure matters: Unsuccessful cytogenetics and unperformed cytogenetics are associated with a poor prognosis in a population-based series of acute myeloid leukaemia. Eur. J. Haematol. 2015, 94, 419–423. [Google Scholar] [CrossRef]
  19. Grønbæk, K.; Müller-Tidow, C.; Perini, G.; Lehmann, S.; Bach Treppendahl, M.; Mills, K.; Plass, C.; Schlegelberger, B. European Genomics and Epigenomics Study on MDS and AML (EuGESMA), COST Action BM0801. A critical appraisal of tools available for monitoring epigenetic changes in clinical samples from patients with myeloid malignancies. Haematologica 2012, 97, 1380–1388. [Google Scholar] [CrossRef] [Green Version]
  20. Eppert, K.; Takenaka, K.; Lechman, E.R.; Waldron, L.; Nilsson, B.; van Galen, P.; Metzeler, K.H.; Poeppl, A.; Ling, V.; Beyene, J.; et al. Stem cell gene expression programs influence clinical outcome in human leukemia. Nat. Med. 2011, 17, 1086–1093. [Google Scholar] [CrossRef]
  21. Wisniewski, J.R.; Zougman, A.; Nagaraj, N.; Mann, M. Universal sample preparation method for proteome analysis. Nat. Methods 2009, 6, 359–362. [Google Scholar] [CrossRef]
  22. Kulak, N.A.; Pichler, G.; Paron, I.; Nagaraj, N.; Mann, M. Minimal, encapsulated proteomic-sample processing applied to copy-number estimation in eukaryotic cells. Nat. Methods 2014, 11, 319–324. [Google Scholar] [CrossRef] [PubMed]
  23. Stapnes, C.; Doskeland, A.P.; Hatfield, K.; Ersvaer, E.; Ryningen, A.; Lorens, J.B.; Gjertsen, B.T.; Bruserud, Ø. The proteasome inhibitors bortezomib and PR-171 have antiproliferative and proapoptotic effects on primary human acute myeloid leukaemia cells. Br. J. Haematol. 2007, 136, 814–828. [Google Scholar] [CrossRef]
  24. Grønningsæter, I.S.; Reikvam, H.; Aasebø, E.; Bartaula-Brevik, S.; Tvedt, T.H.; Bruserud, Ø.; Hatfield, K.J. Targeting cellular metabolism in acute myeloid leukemia and the role of patient heterogeneity. Cells 2020, 9, 1155. [Google Scholar] [CrossRef] [PubMed]
  25. Aasebø, E.; Birkeland, E.; Selheim, F.; Berven, F.; Brenner, A.K.; Bruserud, Ø. The extracellular bone marrow microenvironment—A proteomic comparison of constitutive protein release by in vitro cultured osteoblasts and mesenchymal stem cells. Cancers 2020, 13, 62. [Google Scholar] [CrossRef]
  26. Tyanova, S.; Temu, T.; Sinitcyn, P.; Carlson, A.; Hein, M.Y.; Geiger, T.; Mann, M.; Cox, J. The Perseus computational platform for comprehensive analysis of (prote)omics data. Nat. Methods 2016, 13, 731–740. [Google Scholar] [CrossRef]
  27. Arntzen, M.Ø.; Koehler, C.J.; Barsnes, H.; Berven, F.S.; Treumann, A.; Thiede, B.; Isobari, Q. Software for isobaric quantitative proteomics using IPTL, iTRAQ, and TMT. J. Proteome Res. 2011, 10, 913–920. [Google Scholar] [CrossRef] [PubMed]
  28. Scholz, C.; Lyon, D.; Refsgaard, J.C.; Jensen, L.J.; Choudhary, C.; Weinert, B.T. Avoiding abundance bias in the functional annotation of post-translationally modified proteins. Nat. Methods 2015, 12, 1003–1004. [Google Scholar] [CrossRef]
  29. Szklarczyk, D.; Morris, J.H.; Cook, H.; Kuhn, M.; Wyder, S.; Simonovic, M.; Santos, A.; Doncheva, N.T.; Roth, A.; Bork, P.; et al. The STRING database in 2017: Quality-controlled protein-protein association networks, made broadly accessible. Nucleic Acids Res. 2017, 45, D362–D368. [Google Scholar] [CrossRef] [PubMed]
  30. Shannon, P.; Markiel, A.; Ozier, O.; Baliga, N.S.; Wang, J.T.; Ramage, D.; Amin, N.; Schwikowski, B.; Ideker, T. Cytoscape: A software environment for integrated models of biomolecular interaction networks. Genome Res. 2003, 13, 2498–2504. [Google Scholar] [CrossRef]
  31. Bader, G.D.; Hogue, C.W. An automated method for finding molecular complexes in large protein interaction networks. BMC Bioinform. 2003, 4, 2. [Google Scholar] [CrossRef] [PubMed] [Green Version]
  32. Hetz, C.; Papa, F.R. The unfolded protein response and cell fate control. Mol. Cell 2018, 69, 169–181. [Google Scholar] [CrossRef] [PubMed] [Green Version]
  33. Chipurupalli, S.; Kannan, E.; Tergaonkar, V.; D’Andrea, R.; Robinson, N. Hypoxia induced ER stress response as an adaptive mechanism in cancer. Int. J. Mol. Sci. 2019, 20, 749. [Google Scholar] [CrossRef] [PubMed] [Green Version]
  34. Siddiqui, W.A.; Ahad, A.; Ahsan, H. The mystery of BCL2 family: Bcl-2 proteins and apoptosis: An update. Arch. Toxicol. 2015, 89, 289–317. [Google Scholar] [CrossRef] [PubMed]
  35. Czabotar, P.E.; Lessene, G.; Strasser, A.; Adams, J.M. Control of apoptosis by the BCL-2 protein family: Implications for physiology and therapy. Nat. Rev. Mol. Cell Biol. 2014, 15, 49–63. [Google Scholar] [CrossRef]
  36. Leibowitz, B.; Yu, J. Mitochondrial signaling in cell death via the Bcl-2 family. Cancer Biol. Ther. 2010, 9, 417–422. [Google Scholar] [CrossRef] [Green Version]
  37. Hata, A.N.; Engelman, J.A.; Faber, A.C. The BCL2 family: Key mediators of the apoptotic response to targeted anticancer therapeutics. Cancer Discov. 2015, 5, 475–487. [Google Scholar] [CrossRef] [PubMed] [Green Version]
  38. Galluzzi, L.; Vitale, I.; Abrams, J.M.; Alnemri, E.S.; Baehrecke, E.H.; Blagosklonny, M.V.; Dawson, T.M.; Dawson, V.L.; El-Deiry, W.S.; Fulda, S.; et al. Molecular definitions of cell death subroutines: Recommendations of the Nomenclature Committee on Cell Death 2012. Cell Death Differ. 2012, 19, 107–120. [Google Scholar] [CrossRef]
  39. Pearce, D.J.; Taussig, D.; Zibara, K.; Smith, L.L.; Ridler, C.M.; Preudhomme, C.; Young, B.D.; Rohatiner, A.Z.; Lister, T.A.; Bonnet, D. AML engraftment in the NOD/SCID assay reflects the outcome of AML: Implications for our understanding of the heterogeneity of AML. Blood 2006, 107, 1166–1173. [Google Scholar] [CrossRef] [Green Version]
  40. Sharawat, S.K.; Bakhshi, R.; Vishnubhatla, S.; Gupta, R.; Bakhshi, S. BAX/BCL2 RMFI ratio predicts better induction response in pediatric patients with acute myeloid leukemia. Pediatr. Blood Cancer 2013, 60, E63–E66. [Google Scholar] [CrossRef]
  41. Kornblau, S.M.; Vu, H.T.; Ruvolo, P.; Estrov, Z.; O’Brien, S.; Cortes, J.; Kantarjian, H.; Andreeff, M.; May, W.S. BAX and PKCalpha modulate the prognostic impact of BCL2 expression in acute myelogenous leukemia. Clin. Cancer Res. 2000, 6, 1401–1409. [Google Scholar]
  42. Del Poeta, G.; Venditti, A.; Del Principe, M.I.; Maurillo, L.; Buccisano, F.; Tamburini, A.; Cox, M.C.; Franchi, A.; Bruno, A.; Mazzone, C.; et al. Amount of spontaneous apoptosis detected by Bax/Bcl-2 ratio predicts outcome in acute myeloid leukemia (AML). Blood 2003, 101, 2125–2131. [Google Scholar] [CrossRef]
  43. Deng, G.; Lane, C.; Kornblau, S.; Goodacre, A.; Snell, V.; Andreeff, M.; Deisseroth, A.B. Ratio of bcl-xshort to bcl-xlong is different in good- and poor-prognosis subsets of acute myeloid leukemia. Mol. Med. 1998, 4, 158–164. [Google Scholar] [CrossRef] [PubMed]
  44. Ong, Y.L.; McMullin, M.F.; Bailie, K.E.; Lappin, T.R.; Jones, F.G.; Irvine, A.E. High bax expression is a good prognostic indicator in acute myeloid leukaemia. Br. J. Haematol. 2000, 111, 182–189. [Google Scholar] [PubMed]
  45. Reichenbach, F.; Wiedenmann, C.; Schalk, E.; Becker, D.; Funk, K.; Scholz-Kreisel, P.; Todt, F.; Wolleschak, D.; Döhner, K.; Marquardt, J.U.; et al. Mitochondrial BAX determines the predisposition to apoptosis in human AML. Clin. Cancer Res. 2017, 23, 4805–4816. [Google Scholar] [CrossRef] [PubMed] [Green Version]
  46. Del Poeta, G.; Ammatuna, E.; Lavorgna, S.; Capelli, G.; Zaza, S.; Luciano, F.; Ottone, T.; Del Principe, M.I.; Buccisano, F.; Maurillo, L.; et al. The genotype nucleophosmin mutated and FLT3-ITD negative is characterized by high bax/bcl-2 ratio and favourable outcome in acute myeloid leukaemia. Br. J. Haematol. 2010, 149, 383–387. [Google Scholar] [CrossRef]
  47. Schaich, M.; Illmer, T.; Seitz, G.; Mohr, B.; Schäkel, U.; Beck, J.F.; Ehninger, G. The prognostic value of Bcl-XL gene expression for remission induction is influenced by cytogenetics in adult acute myeloid leukemia. Haematologica 2001, 86, 470–477. [Google Scholar]
  48. Duval, A.; Olaru, D.; Campos, L.; Flandrin, P.; Nadal, N.; Guyotat, D. Expression and prognostic significance of heat-shock proteins in myelodysplastic syndromes. Haematologica 2006, 91, 713–714. [Google Scholar]
  49. Thomas, X.; Campos, L.; Mounier, C.; Cornillon, J.; Flandrin, P.; Le, Q.H.; Piselli, S.; Guyotat, D. Expression of heat-shock proteins is associated with major adverse prognostic factors in acute myeloid leukemia. Leuk. Res. 2005, 29, 1049–1058. [Google Scholar] [CrossRef] [PubMed]
  50. Löwenberg, B.; van Putten, W.L.; Touw, I.P.; Delwel, R.; Santini, V. Autonomous proliferation of leukemic cells in vitro as a determinant of prognosis in adult acute myeloid leukemia. N. Engl. J. Med. 1993, 328, 614–619. [Google Scholar] [CrossRef] [PubMed]
  51. Rombouts, W.J.; Löwenberg, B.; van Putten, W.L.; Ploemacher, R.E. Improved prognostic significance of cytokine-induced proliferation in vitro in patients with de novo acute myeloid leukemia of intermediate risk: Impact of internal tandem duplications in the Flt3 gene. Leukemia 2001, 15, 1046–1053. [Google Scholar] [CrossRef] [PubMed] [Green Version]
  52. Griessinger, E.; Anjos-Afonso, F.; Pizzitola, I.; Rouault-Pierre, K.; Vargaftig, J.; Taussig, D.; Gribben, J.; Lassailly, F.; Bonnet, D. A niche-like culture system allowing the maintenance of primary human acute myeloid leukemia-initiating cells: A new tool to decipher their chemoresistance and self-renewal mechanisms. Stem Cells Transl. Med. 2014, 3, 520–529. [Google Scholar] [CrossRef]
  53. Buteyn, N.J.; Santhanam, R.; Merchand-Reyes, G.; Murugesan, R.A.; Dettorre, G.M.; Byrd, J.C.; Sarkar, A.; Vasu, S.; Mundy-Bosse, B.L.; Butchar, J.P.; et al. Activation of the intracellular pattern recognition receptor NOD2 promotes acute myeloid leukemia (AML) cell apoptosis and provides a survival advantage in an animal model of AML. J. Immunol. 2020, 204, 1988–1997. [Google Scholar] [CrossRef] [PubMed]
  54. Karakas, T.; Miething, C.C.; Maurer, U.; Weidmann, E.; Ackermann, H.; Hoelzer, D.; Bergmann, L. The coexpression of the apoptosis-related genes bcl-2 and wt1 in predicting survival in adult acute myeloid leukemia. Leukemia 2002, 16, 846–854. [Google Scholar] [CrossRef] [Green Version]
  55. Haes, I.; Dendooven, A.; Mercier, M.L.; Puylaert, P.; Vermeulen, K.; Kockx, M.; Deiteren, K.; Maes, M.B.; Berneman, Z.; Anguille, S. Absence of BCL-2 expression identifies a subgroup of AML with distinct phenotypic, molecular, and clinical characteristics. J. Clin. Med. 2020, 9, 3090. [Google Scholar] [CrossRef]
  56. Lee, M.G.; Liu, Y.C.; Lee, Y.L.; El-Shazly, M.; Lai, K.H.; Shih, S.P.; Ke, S.; Hong, M.C.; Du, Y.C.; Yang, J.C.; et al. Heteronemin, a marine sesterterpenoid-type metabolite, induces apoptosis in prostate LNcap cells via oxidative and ER stress combined with the inhibition of topoisomerase II and Hsp90. Mar. Drugs 2018, 16, 204. [Google Scholar] [CrossRef] [PubMed] [Green Version]
  57. Kim, S.H.; Kang, J.G.; Kim, C.S.; Ihm, S.H.; Choi, M.G.; Yoo, H.J.; Lee, S.J. Cytotoxic effect of celastrol alone or in combination with paclitaxel on anaplastic thyroid carcinoma cells. Tumor Biol. 2017, 39, 1010428317698369. [Google Scholar] [CrossRef] [Green Version]
  58. Cui, Y.; Xu, H.; Yang, Y.; Zhao, D.; Wen, Y.; Lv, C.; Qiu, H.; Wang, C. The regulation of miR-320a/XBP1 axis through LINC00963 for endoplasmic reticulum stress and autophagy in diffuse large B-cell lymphoma. Cancer Cell Int. 2021, 21, 305. [Google Scholar] [CrossRef]
  59. Rahmani, M.; Mayo, M.; Dash, R.; Sokhi, U.K.; Dmitriev, I.P.; Sarkar, D.; Dent, P.; Curiel, D.T.; Fisher, P.B.; Grant, S. Melanoma differentiation associated gene-7/interleukin-24 potently induces apoptosis in human myeloid leukemia cells through a process regulated by endoplasmic reticulum stress. Mol. Pharmacol. 2010, 78, 1096–1104. [Google Scholar] [CrossRef] [PubMed]
  60. Pae, H.O.; Jeong, S.O.; Jeong, G.S.; Kim, K.M.; Kim, H.S.; Kim, S.A.; Kim, Y.C.; Kang, S.D.; Kim, B.N.; Chung, H.T. Curcumin induces pro-apoptotic endoplasmic reticulum stress in human leukemia HL-60 cells. Biochem. Biophys. Res. Commun. 2007, 353, 1040–1045. [Google Scholar] [CrossRef]
  61. De Sá Bacelar, T.; da Silva, A.J.; Costa, P.R.; Rumjanek, V.M. The pterocarpanquinone LQB 118 induces apoptosis in tumor cells through the intrinsic pathway and the endoplasmic reticulum stress pathway. Anticancer Drugs 2013, 24, 73–83. [Google Scholar] [CrossRef]
  62. Navid, F.; Colbert, R.A. Causes and consequences of endoplasmic reticulum stress in rheumatic disease. Nat. Rev. Rheumatol. 2017, 13, 25–40. [Google Scholar] [CrossRef] [PubMed]
  63. Xu, C.; Bailly-Maitre, B.; Reed, J.C. Endoplasmic reticulum stress: Cell life and death decisions. J. Clin. Investig. 2005, 115, 2656–2664. [Google Scholar] [CrossRef] [PubMed] [Green Version]
  64. Madden, E.; Logue, S.E.; Healy, S.J.; Manie, S.; Samali, A. The role of the unfolded protein response in cancer progression: From oncogenesis to chemoresistance. Biol. Cell 2019, 111, 1–17. [Google Scholar] [CrossRef] [PubMed]
  65. Lee, G.H.; Kim, D.S.; Kim, H.T.; Lee, J.W.; Chung, C.H.; Ahn, T.; Lim, J.M.; Kim, I.K.; Chae, H.J.; Kim, H.R. Enhanced lysosomal activity is involved in Bax inhibitor-1-induced regulation of the endoplasmic reticulum (ER) stress response and cell death against ER stress: Involvement of vacuolar H+-ATPase (V-ATPase). J. Biol. Chem. 2011, 286, 24743–24753. [Google Scholar] [CrossRef] [Green Version]
  66. Scherer, O.; Steinmetz, H.; Kaether, C.; Weinigel, C.; Barz, D.; Kleinert, H.; Menche, D.; Müller, R.; Pergola, C.; Werz, O. Targeting V-ATPase in primary human monocytes by archazolid potently represses the classical secretion of cytokines due to accumulation at the endoplasmic reticulum. Biochem. Pharmacol. 2014, 91, 490–500. [Google Scholar] [CrossRef] [PubMed]
  67. Iurlaro, R.; Muñoz-Pinedo, C. Cell death induced by endoplasmic reticulum stress. FEBS J. 2016, 283, 2640–2652. [Google Scholar] [CrossRef] [Green Version]
  68. Casado, P.; Wilkes, E.H.; Miraki-Moud, F.; Hadi, M.M.; Rio-Machin, A.; Rajeeve, V.; Pike, R.; Iqbal, S.; Marfa, S.; Lea, N.; et al. Proteomic and genomic integration identifies kinase and differentiation determinants of kinase inhibitor sensitivity in leukemia cells. Leukemia 2018, 32, 1818–1822. [Google Scholar] [CrossRef]
  69. Schardt, J.A.; Mueller, B.U.; Pabst, T. Activation of the unfolded protein response in human acute myeloid leukemia. Methods Enzymol. 2011, 489, 227–243. [Google Scholar]
  70. Schardt, J.A.; Weber, D.; Eyholzer, M.; Mueller, B.U.; Pabst, T. Activation of the unfolded protein response is associated with favorable prognosis in acute myeloid leukemia. Clin. Cancer Res. 2009, 15, 3834–3841. [Google Scholar] [CrossRef] [Green Version]
  71. Rouault-Pierre, K.; Lopez-Onieva, L.; Foster, K.; Anjos-Afonso, F.; Lamrissi-Garcia, I.; Serrano-Sanchez, M.; Mitter, R.; Ivanovic, Z.; de Verneuil, H.; Gribben, J.; et al. HIF-2α protects human hematopoietic stem/progenitors and acute myeloid leukemic cells from apoptosis induced by endoplasmic reticulum stress. Cell Stem Cell 2013, 13, 549–563. [Google Scholar] [CrossRef] [Green Version]
  72. Zhou, C.; Martinez, E.; Di Marcantonio, D.; Solanki-Patel, N.; Aghayev, T.; Peri, S.; Ferraro, F.; Skorski, T.; Scholl, C.; Fröhling, S.; et al. JUN is a key transcriptional regulator of the unfolded protein response in acute myeloid leukemia. Leukemia 2017, 31, 1196–1205. [Google Scholar] [CrossRef] [Green Version]
  73. Akkök, C.A.; Liseth, K.; Nesthus, I.; Løkeland, T.; Tefre, K.; Bruserud, O.; Abrahamsen, J.F. Autologous peripheral blood progenitor cells cryopreserved with 5 and 10 percent dimethyl sulfoxide alone give comparable hematopoietic reconstitution after transplantation. Transfusion 2008, 48, 877–883. [Google Scholar] [CrossRef]
  74. Abrahamsen, J.F.; Rusten, L.; Bakken, A.M.; Bruserud, Ø. Better preservation of early hematopoietic progenitor cells when human peripheral blood progenitor cells are cryopreserved with 5 percent dimethylsulfoxide instead of 10 percent dimethylsulfoxide. Transfusion 2004, 44, 785–789. [Google Scholar] [CrossRef]
  75. Sasnoor, L.M.; Kale, V.P.; Limaye, L.S. Prevention of apoptosis as a possible mechanism behind improved cryoprotection of hematopoietic cells by catalase and trehalose. Transplantation 2005, 80, 1251–1260. [Google Scholar] [CrossRef]
  76. Sasnoor, L.M.; Kale, V.P.; Limaye, L.S. Supplementation of conventional freezing medium with a combination of catalase and trehalose results in better protection of surface molecules and functionality of hematopoietic cells. J. Hematother. Stem Cell Res. 2003, 12, 553–564. [Google Scholar] [CrossRef] [PubMed]
  77. Khetan, S.; Corey, O. Maintenance of stem cell viability and differentiation potential following cryopreservation within 3-dimensional hyaluronic acid hydrogels. Cryobiology 2019, 90, 83–88. [Google Scholar] [CrossRef]
  78. Miyazaki, T.; Suemori, H. Slow cooling cryopreservation optimized to human pluripotent stem cells. Adv. Exp. Med. Biol. 2016, 951, 57–65. [Google Scholar] [PubMed]
  79. Demirci, S.; Doğan, A.; Şişli, B.; Sahin, F. Boron increases the cell viability of mesenchymal stem cells after long-term cryopreservation. Cryobiology 2014, 68, 139–146. [Google Scholar] [CrossRef]
  80. Bissoyi, A.; Nayak, B.; Pramanik, K.; Sarangi, S.K. Targeting cryopreservation-induced cell death: A review. Biopreserv. Biobank. 2014, 12, 23–34. [Google Scholar] [CrossRef] [PubMed]
  81. Shibamiya, A.; Schulze, E.; Krauß, D.; Augustin, C.; Reinsch, M.; Schulze, M.L.; Steuck, S.; Mearini, G.; Mannhardt, I.; Schulze, T.; et al. Cell banking of hiPSCs: A practical guide to cryopreservation and quality control in basic research. Curr. Protoc. Stem Cell Biol. 2020, 55, e127. [Google Scholar] [CrossRef] [PubMed]
  82. Testa, U.; Pelosi, E.; Castelli, G. Precision medicine treatment in acute myeloid leukemia is not a dream. Hemato 2021, 2, 8. [Google Scholar] [CrossRef]
Figure 1. The variation in spontaneous stress-induced AML cell apoptosis between patients. Primary AML cells were derived from 41 consecutive patients. The cells were separated/enriched, cryopreserved, and stored frozen in liquid nitrogen until they were thawed and cultured in vitro for 48 h before the percentages of viable-early apoptotic-late apoptotic/necrotic cells were determined by flow cytometry. The figure presents the percentage of viable AML cells (x-axis) derived from 41 individual patients (y-axis, patient number/identity) at the end of the culture period. The median viability for all 41 patients was 23.0% (range 0.5–83.6%). The results are presented as the percentage of viable cells. The 32 patients included in the proteomic studies (see Section 3.2, Section 3.3, Section 3.4 and Section 3.5) are indicated by dark color and based on the median viability level in this analysis of overall viability data including 41 patients; we used 25% viable cells as the cut-off between high and low viability patients.
Hemato 02 00039 g001
Figure 2. Protein network analyses identified by MCODE. The protein interaction network analysis was based on the 276 differentially expressed proteins identified by the comparison of patients with high and low viability after 48 h of in vitro AML cell culture. The figure presents the three clusters that included at least five proteins. Purple color indicates decreased abundance in the high viability group (i.e., high levels for patients with <25% viable cells due to increased spontaneous/stress-induced apoptosis); turquoise color indicates increased protein abundance in the high viability group.
Hemato 02 00039 g002
Figure 3. Unsupervised hierarchical clustering analysis based on the global proteomic profiles of primary AML cells during on-going spontaneous stress-induced in vitro apoptosis; an analysis based on all 7684 identified proteins. The analysis included 32 patients; for 15 of them, the AML cells showed high viability after 48 h of in vitro culture whereas for 17 of them low viability was observed; this classification is indicated at the top of the figure. Two main patient clusters were identified. The left main cluster included 20 patients and is referred to as patient cluster 1; this main cluster could be further divided into two patient subsets/subclusters 1.1 (left subset, n = 9)) and the right subset 1.2 including the remaining 11 patients. The right main cluster included 12 patients and is referred to as patient subset 2. Red color indicates a protein level higher than the corresponding median level for each individual protein, whereas blue color indicates a lower level than the corresponding median level (see the lower bar in the figure). We identified three protein subsets; the upper main protein cluster (referred to as protein cluster A) included the majority of proteins and could be further divided into two protein subsets/subclusters indicated by blue and dark blue color (see right part of the figure; referred to as upper Subset A1 and lower A2 cluster in the text). The second main protein cluster included a small group of proteins and is referred to as protein cluster B (indicated by green, see lower right in the figure).
Hemato 02 00039 g003
Table 1. Clinical and biological characteristics of the 41 AML patients included in the study. Unless otherwise stated, the results are presented as the number of patients.
Sex and Age (n = 41) Cytogenetic Abnormalities
Males/females22/19Normal karyotype21
Age (years; median/range)70/18–87Favorable 4
Intermediate9
Predisposition/previous disease Adverse4
Previous chronic myeloid neoplasia 1Not tested3
Myelodysplastic syndrome8
Relapsed AML3FLT3 status
Chemotherapy0ITD14
Normal19
Morphology/FAB classification Not tested8
M0/M117
M28NPM1 status
M4/M516Insertion14
M6/M70Insertion + Flt3-ITD8
Normal20
CD34 expression22Not tested7
Abbreviations: FAB, French-American-British; ITD, internal tandem duplication.
Table 2. Classification of proteins showing differential expression when comparing AML cells with high (i.e., >25% viable cells) and low viability after in vitro culture using a GO tool. We identified 276 proteins with significantly different levels, and the table presents the six terms for each of the two patient subsets with the lowest false discovery rate (FDR) when analyzing GO cellular component/cellular component text mining, GO biological process, GO cell components, GO molecular function, KEGG pathways, Reactome pathways, and UniProt keywords. The table presents the description of each term together with foreground and background counts, p- and s-values. S-value is a combination of (minus log) p value and effect size (i.e., positive associations in the foreground divided by all associations); a positive value indicates overrepresentation of a given term, and a negative value indicates underrepresentation of a given term. Foreground counts indicate the number of positive associations in a given cluster for a given term (i.e., the number of proteins associated with the given term) and background counts indicate the number of positive associations in the dataset. The proteins were ranked based on the FDR and the table presents the six highest ranked terms for each group.
TermDescriptionFDRCategoryForeground CountBackground Countp-Values-Value
High expression in patients with high viability/low spontaneous apoptosis
KW-0539Nucleus0.0017UniProt keywords11525972.13 × 10−61.32
KW-0832Ubl conjugation0.0017UniProt keywords7214432.11 × 10−60.98
KW-0805Transcription regulation0.0017UniProt keywords528291.50 × 10−60.90
KW-0804Transcription0.0017UniProt keywords538771.46 × 10−60.89
KW-1017Isopeptide bond0.0017UniProt keywords5911352.54 × 10−60.83
KW-0863Zinc-finger0.0018UniProt keywords385862.37 × 10−60.65
High expression in patients with low viability/high spontaneous apoptosis
KW-0675Receptor0.00032UniProt keywords141742.77 × 10−70.92
KW-0256Endoplasmic reticulum0.00033UniProt keywords286445.61 × 10−71.49
KW-0472Membrane0.00041UniProt keywords6523411.25 × 10−62.55
KW-1133Transmembrane helix0.00041UniProt keywords5012172.13 × 10−62.36
KW-0732Signal0.00041UniProt keywords376581.04 × 10−62.05
KW-1015Disulfide bond0.00041UniProt keywords356651.18 × 10−61.88
Table 3. Classification of proteins showing differential expression for each of the three networks identified in the protein network interaction analysis (see Figure 2) using a GO tool. We identified 276 proteins with significantly different levels, and 18 of them were included in the three networks. The table presents the six terms with the lowest false discovery rate (FDR) when analyzing GO cellular component/cellular component text mining, GO biological process, GO cell components, GO molecular function, KEGG pathways, Reactome pathways, and UniProt keywords. The table presents the description of each term together with foreground and background counts, as well as p- and s-values. S-value is a combination of (minus log) p value and effect size (i.e., positive associations in the foreground divided by all associations); a positive value indicates overrepresentation of a given term, and a negative value indicates underrepresentation of a given term. Foreground counts indicate the number of positive associations in a given cluster for a given term (i.e., the number of proteins associated with the given term) and background counts indicate the number of positive associations in the dataset. The proteins were ranked based on the FDR and the table presents the six highest ranked terms for each network.
TermDescriptionFDRCategoryForeground CountBackground Countp-Values-Value
Network 1
KW-1003Cell membrane4.28 × 10−5UniProt88243.7 × 10−86.57
GOCC:0030141Secretory granule0.00017CC-TM84684.6 × 10−86.85
GOCC:0098588Bounding membrane of organelle0.00017CC-TM88444.4 × 10−86.47
GOCC:0030659Cytoplasmic vesicle membrane0.00017CC-TM83313.1 × 10−76.21
GOCC:0030667Secretory granule membrane0.00017CC-TM81755.9 × 10−76.08
GOCC:0098805Whole membrane0.00017CC-TM89541.2 × 10−76.00
Network 2 CC-TM
HSA-72766Translation0.00038Reactome52791.0 × 10−76.71
HSA-1799339SRP-dependent cotranslational protein targeting to membrane0.00080Reactome51032.6 × 10−76.49
GOCC:0005787Signal peptidase complex3.76 × 10−5CC-TM359.6 × 10−94.81
map03060Protein export0.00013KEGG4193.0 × 10−75.20
GOCC:0005789Endoplasmic reticulum membrane0.00024CC-TM52901.2 × 10−76.62
HSA-400511Synthesis, secretion, and inactivation of GPI 0.00026Reactome361.4 × 10−84.70
Network 3
GOCC:0034774Secretory granule lumen3.2 × 10−5CC-TM51678.2 × 10−97.90
GOCC:0035578Azurophil granule lumen9.68 × 10−5CC-TM5809.8 × 10−86.93
GO:0005764Lysosome0.0036CC54651.3 × 10−65.50
Abbreviations: CC, GO cellular component; CC-TM, GO cellular component TextMining; GPI, Glucose-dependent Insulinotropic Polypeptide (GIP); KEGG, KEGG pathway; UniProt, UniProt keywords.
Table 4. Classification of proteins showing differential expression when comparing AML cells from the two main patient clusters identified in the hierarchical clustering analysis (Figure 3). The analysis is based on the overall proteomic profiles for the 32 patients. The table presents the six terms with the lowest false discovery rate (FDR) when analyzing GO cellular component/cellular component text mining, GO biological process, GO cell components, GO molecular function, KEGG pathways, Reactome pathways, and UniProt keywords. The table presents the description of each term together with foreground and background counts, p- and s-values. S-value is a combination of (minus log) p value and effect size (i.e., positive associations in the foreground divided by all associations); a positive value indicates overrepresentation of a given term, and a negative value indicates underrepresentation of a given term. Foreground counts indicate the number of positive associations in a given cluster for a given term (i.e., the number of proteins associated with the given term) and background counts indicate the number of positive associations in the dataset.
TermDescriptionFDRCategoryForeground CountBackground Countp-Values-Value
Upregulated in the right patient cluster B (n = 12)
KW-0832Ubl conjugation0.0019UniProt 5314651.77 × 10−61.16
KW-1017Isopeptide bond0.0019UniProt 4411483.27 × 10−60.97
KW-0805Transcription regulation0.0019UniProt 378421.84 × 10−60.95
KW-0804Transcription0.0019UniProt 378911.62 × 10−60.92
KW-0863Zinc-finger0.0053UniProt 265974.10 × 10−50.51
GO:0003700DNA-binding transcription factor activity0.0095GO MF192231.6 × 10−6068
Downregulated in the right patient cluster (n = 12)
GO:0005886plasma membrane0.00084GO CC6016259.48 × 10−72.83
GO:0005576extracellular region0.00084OG CC 5216249.05 × 10−72.28
GO:0005615extracellular space0.00095GO CC4914142.06 × 10−62.11
GO:0031410cytoplasmic vesicle0.00085GO CC4012861.54 × 10−61.65
GO:0030312external encapsulating structure0.00079GO CC111172.83 × 10−70.73
GO:0031012extracellular matrix0.00079GO CC111172.83 × 10−70.73
Abbreviations: CC, cellular component; MF, molecular function; Uniprot, Uniprot Pathway.
Table 5. Classification of proteins included in the three major protein subsets (clusters A1, A2, and B) identified in the unsupervised hierarchical cluster analysis based on the overall proteomic profiles for the 32 patients (Figure 3). We used a GO tool for the analysis. This table presents the six terms with the lowest false discovery rate (FDR) when analyzing GO cellular component/cellular component text mining, GO biological process, GO cell components, GO molecular function, KEGG pathways, Reactoma pathways, and UniProt keywords for each of the three protein subsets. The table presents the description of each term together with foreground and background counts, as well as p- and s-values. S-value is a combination of (minus log) p value and effect size (i.e., positive associations in the foreground divided by all associations); a positive value indicates overrepresentation of a given term, and a negative value indicates underrepresentation of a given term. Foreground counts indicate the number of positive associations in a given cluster for a given term (i.e., the number of proteins associated with the given term) and background counts indicate the number of positive associations in the dataset.
TermDescriptionFDRCategoryForeground CountBackground Countp-Values-Value
Protein cluster 1A
KW-0472Membrane0.018UniProt 172125301.42 × 10−50,20
KW-0256Endoplasmic reticulum0.017UniProt 5206711.82 × 10−50.12
KW-0813Transport0.033UniProt 7189918.39 × 10−50.11
GOCC:0012505Endomembrane system0.036GO CC-TM140420011.08 × 10−50.21
GOCC:0016020Membrane0.036GO CC-TM173625511.35 × 10−50.20
GOCC:0031090Organelle membrane0.036GO CC-TM116516199.22 × 10−60.20
Protein cluster 1B
KW-0539Nucleus0.0044UniProt 107827378.27 × 10−60.44
KW-0804Transcription0.0044UniProt 4389295.85 × 10−60.31
KW-0805Transcription regulation0.0044UniProt 4158795.79 × 10−60.30
KW-0238DNA-binding0.0044UniProt 3056255.22 × 10−60.23
KW-0832Ubl conjugation0.0044UniProt 57915072.31 × 10−50.19
KW-0863Zinc-finger0.0044UniProt 2756269.99 × 10−60.16
Protein cluster 2
KW-0325Glycoprotein0.0012UniProt 17210343.60 × 10−60.69
KW-1015Disulfide bond0.0012UniProt 1427913.25 × 10−60.62
KW-1003Cell membrane0.0012UniProt 1539293.01 × 10−60.62
KW-0732Signal0.0012UniProt 1317713.16 × 10−60.54
KW-0472Membrane0.0012UniProt 28425304.91 × 10−60.53
KW-0964Secreted0.0012UniProt 763722.37 × 10−60.38
Abbreviations: CC-TM, cellular component TextMining; Uniprot, Uniprot Keywords.
Publisher’s Note: MDPI stays neutral with regard to jurisdictional claims in published maps and institutional affiliations.

