
Purification and Characterization of Antibodies Directed against the α-Gal Epitope
by
 ,
,
Andreas Zappe
1,* ,
,
Julia Rosenlöcher
1,
Guido Kohla
1,
Stephan Hinderlich
2 and
Maria Kristina Parr
3 1
Department of Molecular Biochemistry, Octapharma Biopharmaceuticals GmbH, 12489 Berlin, Germany
2
Department of Life Sciences and Technology, Beuth University of Applied Sciences, 13353 Berlin, Germany
3
Institute of Pharmacy, Freie Universität Berlin, 14195 Berlin, Germany
*
Author to whom correspondence should be addressed.
BioChem 2021, 1(2), 81-97; https://0-doi-org.brum.beds.ac.uk/10.3390/biochem1020008
Submission received: 8 June 2021
/
Revised: 13 July 2021
/
Accepted: 22 July 2021
/
Published: 2 August 2021
Abstract
:The α-Gal epitope is an immunogen trisaccharide structure consisting of N-acetylglucosamine (GlcNAc)β1,4-galactose (Gal)α1,3-Gal. It is presented as part of complex-type glycans on glycoproteins or glycolipids on cell surfaces of non-primate mammalians. About 1% of all antibodies in human sera are specific toward α1,3-Gal and are therefore named as anti-α-Gal antibodies. This work comprises the purification and characterization of anti-α-Gal antibodies from human immunoglobulin G (IgG). A synthetically manufactured α Gal epitope affinity resin was used to enrich anti-α-Gal antibodies. Selectivity experiments with purified antibodies were carried out using enzyme-linked immunosorbent assays (ELISA), Western blotting, and erythrocyte agglutination. Furthermore, binding affinities toward α-Gal were determined by surface plasmon resonance (SPR) and the IgG distribution of anti α Gal antibodies (83% IgG2, 14% IgG1, 2% IgG3, 1% IgG4) was calculated applying ELISA and immunodiffusion. A range of isoelectric points from pH 6 to pH 8 was observed in 2D gel electrophoresis. Glycan profiling of anti α Gal antibodies revealed complex biantennary structures with high fucosylation grades (86%). Additionally, low amounts of bisecting GlcNAc (15%) and sialic acids (13%) were detected. The purification of anti-α-Gal antibodies from human IgG was successful, and their use as detection antibodies for α Gal-containing structures was evaluated.
1. Introduction
The α-Gal epitope is an immunogen glycan antigen composed of the structure N-acetylglucosamine (GlcNAc)β1,4-galactose-(Gal)α1,3-Gal [1,2]. The epitope is located on complex-type glycans of proteins and lipids of non-primate mammals [3]. It was originally discovered by Karl Landsteiner in 1935 [4]. Primates do not express the α-Gal epitope because of an evolutionary inactivation of the α1,3-galactosyltransferase [5,6], except α-Gal epitopes on human tumor cells [7,8,9]. Up to 1% of all IgG antibodies in human sera show selectivity toward α1,3-Gal on glycoproteins [10,11,12,13] and glycolipids [14,15,16].
The primate immune system is continuously stimulated by antigenic carbohydrate structures on cell surfaces of gastrointestinal bacteria [17,18]. Consequently, primate organisms produce anti-α-Gal antibodies as polyclonal antibodies. Galili et al. conducted pioneer research in terms of purification and selectivity analysis of anti-α-Gal antibodies. They discovered anti-α-Gal producing B-cells in lymphoid tissue along the gastrointestinal tract [19]. The presence of anti-α-Gal antibodies leads to severe immune reactions up to anaphylactic shock when exposed to α1,3-Gal. However, the unconjugated glycan epitope has no effect on the immune system. It is considered a hapten due to its small size and can only develop its immunogenic effect in combination with bigger antigens. Synthetic α-Gal haptens are currently designed and used in animal models to investigate different types of immune responses [20].
The α-Gal epitope was found in pig tissue [21,22] and thyroglobulin of various species, including bovine [23]. Therefore, it remains challenging to carry out xenotransplantations without α-Gal-mediated rejection reactions [24,25]. The α-Gal epitope may also be present on recombinant proteins produced in murine cell systems, e.g., cetuximab (brand name ErbituxTM), a chimeric mouse–human IgG1 therapeutic antibody recombinantly expressed in SP2/0 cells [26].
A high prevalence of hypersensitivity reactions to cetuximab has been reported in some areas of the United States [26,27,28], correlated with a high titer of cetuximab-specific IgE antibodies [29]. The analysis of these IgE antibodies revealed high selectivity for α-Gal epitopes located on the Fab regions [29,30]. The location of patients with high titers of anti-cetuximab IgE antibodies geographically overlapped with regions of reported “red meat allergy” [31,32,33,34]. This allergy could be linked to tick bites by Amblyomma americanum, known as Lone Star tick [35,36,37,38,39]. It could be shown that components in tick saliva trigger the immune system and induce immunogenic effects by α-Gal-containing substances [30].
We intended to obtain novel analytical results on the properties of anti-α-Gal IgG antibodies, purified from a commercial, liquid, ready-to-use, intravenous human IgG concentrate (Octagam®). From the pharmaceutical and health care perspective, the α-Gal epitope is a dangerous immunogen epitope, which may be located on recombinant glycoproteins. The availability of purified anti-α-Gal antibodies as a detection tool could prevent safety risks and rejection reactions. Aspects such as binding behavior, selectivity, and sensitivity must be known before specific applications such as rapid and straightforward detection can be analyzed. We consider antibody purification, characterization, and selectivity experiments as the first important steps for α-Gal detection. In addition, it was our concern to use classic methods for the evaluation and characterization of purified antibodies. We chose a human IgG concentrate as a source for the purification of anti-α-Gal antibodies because anti-α-Gal IgG make up a large proportion of human serum and their influence on the immune system is virtually unknown. The analyses carried out here provide a good basis for further experiments dealing with therapeutic applications of anti-α-Gal antibodies. Anti-α-Gal antibodies in patients’ blood may lead to a more effective uptake and presentation of antigen from antigen-presenting cells (APCs). Increased activity of the immune system has already been identified on the mouse model using α-Gal-coated influenza virus [40].
2. Materials and Methods
If not indicated otherwise, chemicals were purchased from Sigma Aldrich GmbH, Munich, Germany, and Merck KGaA, Darmstadt, Germany. Biotinylated glycans and the α-Gal affinity resin (Galα1,3-Galβ1,4-GlcNAcβ-OCH2CH2CH2NH2) were purchased from GlycoNZ, Auckland, Australia. Octagam® (purity 95%) was provided as a liquid, ready-to-use, intravenous human IgG concentrate (10% w/v, 100 mg/mL) by Octapharma Biopharmaceuticals GmbH, Dessau, Germany.
2.1. Purification of Anti-α-Gal Antibodies
The purification of anti-α-Gal antibodies from Octagam® IgG concentrate was performed using an ÄktaPure 25 Chromatography System (GE Healthcare, Freiburg, Germany). A glass column (Tricorn 5/50, 5 mm column diameter, volume 1.16 mL, GE Healthcare, Freiburg, Germany) was manually packed with 1 mL of α-Gal affinity resin (GlycoNZ, Auckland, Australia) and equilibrated with PBS (0.5 mL/min). The absorption signal at 214 nm was monitored, and an Octagam® sample (100 mg/mL) was applied. The affinity matrix was loaded with three samples of human IgG concentrate, each with a volume of 5 mL. The chromatography was carried out at room temperature with a constant flow rate of 0.5 mL/min. The third sample injection was followed by an additional washing step with 5 mL of PBS. The elution of retained antibodies was performed with 500 mM galactose in PBS at 0.5 mL/min. A further wash step with 100 mM glycine pH 2.0 followed at the same flow rate. The Gal-eluted antibody fraction was collected separately and stored at 4 °C. The buffer of samples was exchanged to PBS pH 7.4 and concentrated by Amicon® Ultra centrifugal filters (cutoff: 30 kDa, Merck, Darmstadt, Germany). The Protein concentration was determined by the Pierce bicinchoninic acid (BCA) protein assay kit (Thermo Fisher Scientific, Schwerte, Germany) using IgG as a standard, and adjusted to 1 mg/mL.
2.2. Conjugation of Anti-α-Gal Antibodies with Horseradish Peroxidase
The conjugation of purified anti-α-Gal antibodies with horseradish peroxidase (HRP) was accomplished using the HRP conjugation kit of Abcam (Cambridge, United Kingdom). The conjugation reaction was carried out according to the manufacturer’s instructions. In brief, modifier reagent was mixed with the anti-α-Gal antibody solution (1 mg/mL) in a ratio of 1:10. This solution was added to HRP and incubated for 3 h in the dark at room temperature. A quenching reagent was added to the modifier–antibody solution in a ratio of 1:10. The mixture was again incubated for 30 min in the dark, without further removal of excess HRP.
2.3. Characterization of the Purified Anti-α-Gal Antibody
2.3.1. ELISA Binding Assays
Biotinylated glycan epitopes were immobilized on a streptavidin precoated, flat-bottom, 96-well plate (Thermo Fisher Scientific, Schwerte, Germany) by incubation of 1 µg/mL glycan in PBS overnight at 4 °C while shaking (300 rpm). Unspecific binding was blocked with Roti-BlockTM blocking buffer (Carl Roth GmbH, Karlsruhe) for 1 h. The well plate was washed between each incubation step 3 times with PBS/0.1% (v/v) Tween 20. Purified anti-α-Gal antibodies were applied with the indicated concentrations. Samples were incubated for 1 h at 37 °C on the plate by shaking (300 rpm), detected by HRP-coupled goat anti-human IgG Fc (A0170, Sigma-Aldrich, Darmstadt, Germany), and diluted 1:10,000 in Roti-BlockTM blocking buffer (Carl Roth GmbH, Karlsruhe). The plate was incubated with tetramethylbenzidine (Carl Roth GmbH, Germany) for 5 min. The absorption at 450 nm was measured (Multiskan Go, Thermo Scientific, Germany | SkanIt Software, version 3.2) after terminating the reaction with 1 M hydrochloric acid. For the representation of glycan structures, the symbol nomenclature of the Consortium for Functional Glycomics was used: green circle, mannose; yellow circle, galactose; blue square, GlcNAc; yellow square, N-acetylgalactosamine (GalNAc); red triangle, fucose; purple diamond, Neu5Ac [41].
For the competitive ELISA, a 96-well plate was coated with 1 µg/mL BSA-α-gal conjugate (Dextra Laboratories Ltd., Reading, UK) in 100 mM ammonium carbonate, pH 9.6, overnight at 4 °C. After washing, the plate was blocked with Roti-BlockTM blocking buffer (Carl Roth GmbH, Karlsruhe) for 1 h. The purified anti-α-Gal antibodies were preincubated in different excesses (0-, 5-, 10-, 20-, 50-, 100-fold molar excess) of biotinylated α-gal epitope and Galα1,3-gal for 1 h in PBS. After 1 h, the reaction vial was filled to 100 µL with deionized water. The mixtures of preincubated anti-α-Gal antibodies were added to immobilized BSAα-Gal and incubated for 1 h at 37 °C by shaking (300 rpm). For detection, the samples were incubated with HRP-coupled goat anti-human IgG Fc (Sigma-Aldrich, Darmstadt, Germany, A0170), diluted 1:10,000 in Roti-BlockTM blocking buffer (Carl Roth GmbH, Karlsruhe). The plate was developed under the same conditions as the ELISA with biotinylated glycan epitopes.
2.3.2. Erythrocyte Agglutination Assay
A round-bottom well plate was blocked with 1% BSA (w/v) in deionized water for 2 h at room temperature. Aliquots of 50 µL of samples with different anti-α-Gal antibody concentrations (100 µg/mL, 50 µg/mL, 25 µg/mL, 12.5 µg/mL, 6.25 µg/mL, 3.12 µg/mL, 1.56 µg/mL, 0.78 µg/mL) in physiological sodium chloride solution were added, together with 50 µL of 0.5% (v/v) rabbit red blood cells (Dunn Labortechnik GmbH, Asbach, Germany) or human red blood cells (Deutsches Rotes Kreuz, Berlin, Germany) prepared by Fikoll (GE Healthcare, Braunschweig, Germany) density gradient centrifugation. Dilutions of erythrocyte suspensions were both made in physiological sodium chloride solution. Human erythrocytes were additionally incubated with blood group A antigen antibody (Thermo Fisher Scientific, Schwerte, Germany) in concentrations equal to anti-α-Gal antibodies in physiological sodium chloride solution. The well plate was incubated overnight at room temperature without shaking and was covered with a lid. Agglutination results were documented with the G-Box imaging system (Syngene, Cambridge, UK) and visually inspected.
2.3.3. Surface Plasmon Resonance (SPR)
SPR experiments were performed on a Biacore T200 (GE Healthcare, Freiburg, Germany). Biotinylated glycan epitopes were diluted in 10 mM hydroxyethyl–piperazine–ethane sulfonic acid (HEPES)/150 mM NaCl/0.02% (v/v) Tween 20, pH 7.5, and covalently coupled with streptavidin precoated SPR chips (Sensor Chip SA, BR100032) with immobilization levels of 200 response units (RU). Biotin was immobilized up to a response of 200 RU on one flow chamber as a reference. Purified anti-α-Gal antibodies were applied in different concentrations (157 nM, 52 nM, 17 nM, 6 nM, 2 nM, 0.67 nM) in 10 mM sodium acetate pH 4.5. Equal concentrations of human anti-factor VIII antibody (Coachrom Diagnostica, Maria Enzersdorf, Austria, MAB-HF8) were used as a negative control. A multicycle kinetic analysis was performed at 20 °C in 10 mM HEPES/150 mM NaCl/0.02% (v/v) Tween 20, pH 7.5, at a flow rate of 10 µL/min. The association and dissociation phases were monitored for 360 s, and the flow chamber surfaces were regenerated with two subsequent injections of 10 mM glycine, pH 2.0, for 10 s at 10 µL/min. The resulting binding data were fitted to a Langmuir 1:1 binding model by global fit analysis, which allowed the calculation of the dissociation constant KD. First-order kinetics were assumed. The experiments were evaluated with the Biacore T200 evaluation software (version 3.1).
2.3.4. Western Blot
Gel electrophoresis was performed with tris-glycine gradient gels (8–16%, Anamed, Groß-Bieberau). Samples were pretreated with galactosidase or IdeZ. For galactosidase digest, 100 µg of glycoprotein, rebuffered to deionized water, were mixed with 5 mU of α-1,3,4,6-galactosidase (Prozyme, Ballerup, Denmark, GKX5007) and adjusted to 100 mM sodium citrate/phosphate, pH 6.0 with a total volume of 20 µL. The digestion was incubated for 18 h at 37 °C. For IdeZ digest, an amount of 50 µg protein was adjusted to 50 mM sodium phosphate, pH 7.5. The digestion was incubated at 37 °C for 30 min in a total reaction volume of 25 µL, including 1 µL of IgG-specific IdeZ protease (New England Biolabs, Ipswich, UK).
After enzymatical pretreatment the samples were adjusted to 0.72% Tris-HCl pH 6.8 (w/v), 2.5% sodium dodecyl sulfate (w/v), 10% glycerin (v/v), 10 mM dithiothreitol, 0.05% bromophenol (w/v) and incubated for 5 min at 95 °C. The dual color protein standard marker (Bio-Rad, Germany) was used. Running conditions were set to 100 V for 10 min, followed by 150 V for 50 min. After completed electrophoresis, the gel was blotted to a nitrocellulose membrane, as described by Towbin et al. [42]. A constant current of 250 mA was set for 1 h. Subsequently, the membrane was blocked overnight with 10% (v/v) RotiBlockTM blocking buffer (Carl Roth GmbH, Karlsruhe, Germany). The membrane was incubated with HRP-conjugated anti-α-Gal antibodies (1:4000) for 1 h at room temperature by soft shaking and washed 3 times with 10 mM Tris-HCl/0.1% tween 20 (v/v). The signal was detected via SuperSignal West Pico Chemiluminescent Substrate (Thermo Fisher Scientific, Schwerte, Germany) and documented by the G-Box imaging system (Syngene, Cambridge, UK).
2.3.5. Determination of IgG Subclasses
IgG subclasses of purified anti-α-Gal antibodies were determined with the human IgG subclass profile kit (Thermo Fisher Scientific, Schwerte, Germany). The assay was performed according to the manufacturers’ instructions. In brief, monoclonal antibodies, specific for one of the IgG subclasses 1, 2, 3, and 4 were preincubated with 2 µg/mL of anti-Gal antibody in dilution buffer for 5 min. A flat-bottom 96-well plate, precoated with anti-IgG antibodies, was loaded with the pre-incubated monoclonal antibodies. After 1 h incubation at room temperature by shaking at 300 rpm, followed by 3 washing steps, bound antibodies were detected by HRP-coupled anti-human IgG antibody (1:1000 in dilution buffer). Concentrations of IgG subclasses were calculated using four-parameter logistic regression (software: Excel, Microsoft Office, Version: 2010). IgG subclasses were additionally determined by radial immunodiffusion plates, which contained anti-IgG subclass antibodies (The Binding Site, Schwetzingen, Germany). Different concentrations of calibrators (IgG1: 140, 350, 840, 1400 µg/mL; IgG2: 80, 200, 480, 800 µg/mL; IgG3: 120, 300, 720, 1200 µg/mL; IgG4: 50, 125, 300, 500 µg/mL) were applied to the plates and the relative abundances of IgG subclasses were quantified relatively by measuring the diameter of visible precipitation rings as previously described by Dunn et al. [43].
2.3.6. Two-Dimensional (2D) Gel Electrophoresis
Purified anti-α-Gal antibodies were diluted to a concentration of 300 µg/mL with rehydration buffer (2.4 M thiourea, 8.4 M urea, 4.8% cholamidopropyl–dimethylammonium–propane sulfonate (Chaps) (w/v), 2.4% immobiline buffer (v/v), 0.36% dithiothreitol (v/v) and applied to lanes of a reswell tray. Immobilized pH gradient (IPG) gel strips (ImmobilineTM DryStrip pH 6–11; GE Healthcare, Freiburg, Germany) were set on the samples in the lanes of the reswell tray and incubated overnight. The strips were removed from the box and placed on a DryStrip aligner. Both ends of the used strips were covered with moist paper. The loaded aligner was inserted into a focusing chamber (Multiphor II, GE Healthcare, Freiburg, Germany) and coated with mineral oil. Electrodes were put on, and the focusing process was started at a constant temperature of 20 °C, constant current (2 mA), constant power (5 W) with the following voltage gradient: 1 min 200 V, 15 min 200 V, 1 min 500 V, 15 min 500 V, 1 min 2000 V, 60 min 2000 V, 60 min 3500 V, 150 min 3500 V. Focused gel strips were incubated with electrophoresis equilibration buffer (6 M urea, 30% glycerin (v/v), 3% sodium dodecyl sulfate (w/v), 0.05 M Tris-HCl, 5 mM dithiothreitol) for 15 min. The solution was removed and replaced by equilibration buffer with 5 mM iodoacetamide and incubated for a further 15 min. Strips were stored in running buffer (250 mM Tris, 1.9 M Glycin, 35 mM SDS) before the second dimension was developed. The strips were placed on a tris-glycine gradient gel (8–16%, Anamed, Groß-Bieberau, Germany) and coated with warm 1% agarose (w/v). The dual color protein standard marker (Bio-Rad, Germany) was additionally applied. Running conditions were set to 100 V for 15 min, followed by 150 V for 75 min. After complete electrophoresis, the gel was stained with silver [44] and documented by the G-Box imaging system (Syngene, Cambridge, UK).
2.3.7. N-Glycan Analysis
Purified anti-α-Gal antibodies (15 µg) were incubated in 1% (v/v) Rapigest solution (Waters GmbH, Eschborn, Germany) with 10% (v/v) tris(2-carboxyethyl)phosphine (Sigma Aldrich GmbH, Darmstadt, Germany) in deionized water and incubated for 5 min at 95 °C with shaking at 300 rpm. After cooling to room temperature, Rapid PNGase F (Waters GmbH, Eschborn Germany) was added to a total volume of 30 µL. The mixture was incubated for 30 min at 50 °C. A solution containing 12 µL of 9 mg of Rapifluor–MS dissolved in dimethylformamide was added and incubated for 5 min in the dark. The solution was diluted with acetonitrile to a final volume of 370 µL. The cleaning of labeled N-glycans was performed with the GlycoWorks HILIC µElution Plate (Waters GmbH, Eschborn, Germany). The cleaning procedure was performed according to the instructions delivered by the manufacturer. N-glycans were lyophilized in a vacuum centrifuge and resuspended in 10 µL of a solution containing 94% (v/v), acetonitrile 3% (v/v) dimethylformamide and 3% water (v/v). Aliquots of 4 µL of N-glycan solution were analyzed by liquid chromatography coupled to mass spectrometry (LC-MS, Xevo®G2-XS QTof with AcquityH UPLC®Class, Waters GmbH, Eschborn, Germany) using an electrospray ionization source (High-Performance ZsprayTM-Multi mode source) in positive mode. LC separation was performed on a Waters Acquity UPLC Glycan BEH Amide column (130 Å, 1.7 µm, 2.1 × 150 mm), the temperature was kept constant at 60 °C, and a 35 min gradient of 25% A (50 mM ammonium formate pH 4.4)/75% B (acetonitrile) to 46% A/54% B was run. The mass spectrometer’s instrument settings were adjusted for maximum sensitivity and detection selectivity (2750 V capillary voltage, 80 V cone voltage, 120 °C source temperature, 500 °C desolvation temperature, 50 L/h cone gas flow, 800 L/h desolvation gas flow). Calibration was performed with Flu Fibrinopeptide B, and a mass range between 750 Da and 2500 Da was recorded. The assignment of glycan structures was performed according to the respective retention times of the LC elution profile (GU units of glycan standards) and mass-to-charge ratios. For the representation of glycan structures, the symbol nomenclature of the Consortium for Functional Glycomics was used: green circle, mannose; yellow circle, galactose; blue square, GlcNAc; yellow square, N-acetylgalactosamine (GalNAc); red triangle, fucose; purple diamond, Neu5Ac [41].
3. Results and Discussion
3.1. Purification of Anti-α-Gal Antibodies
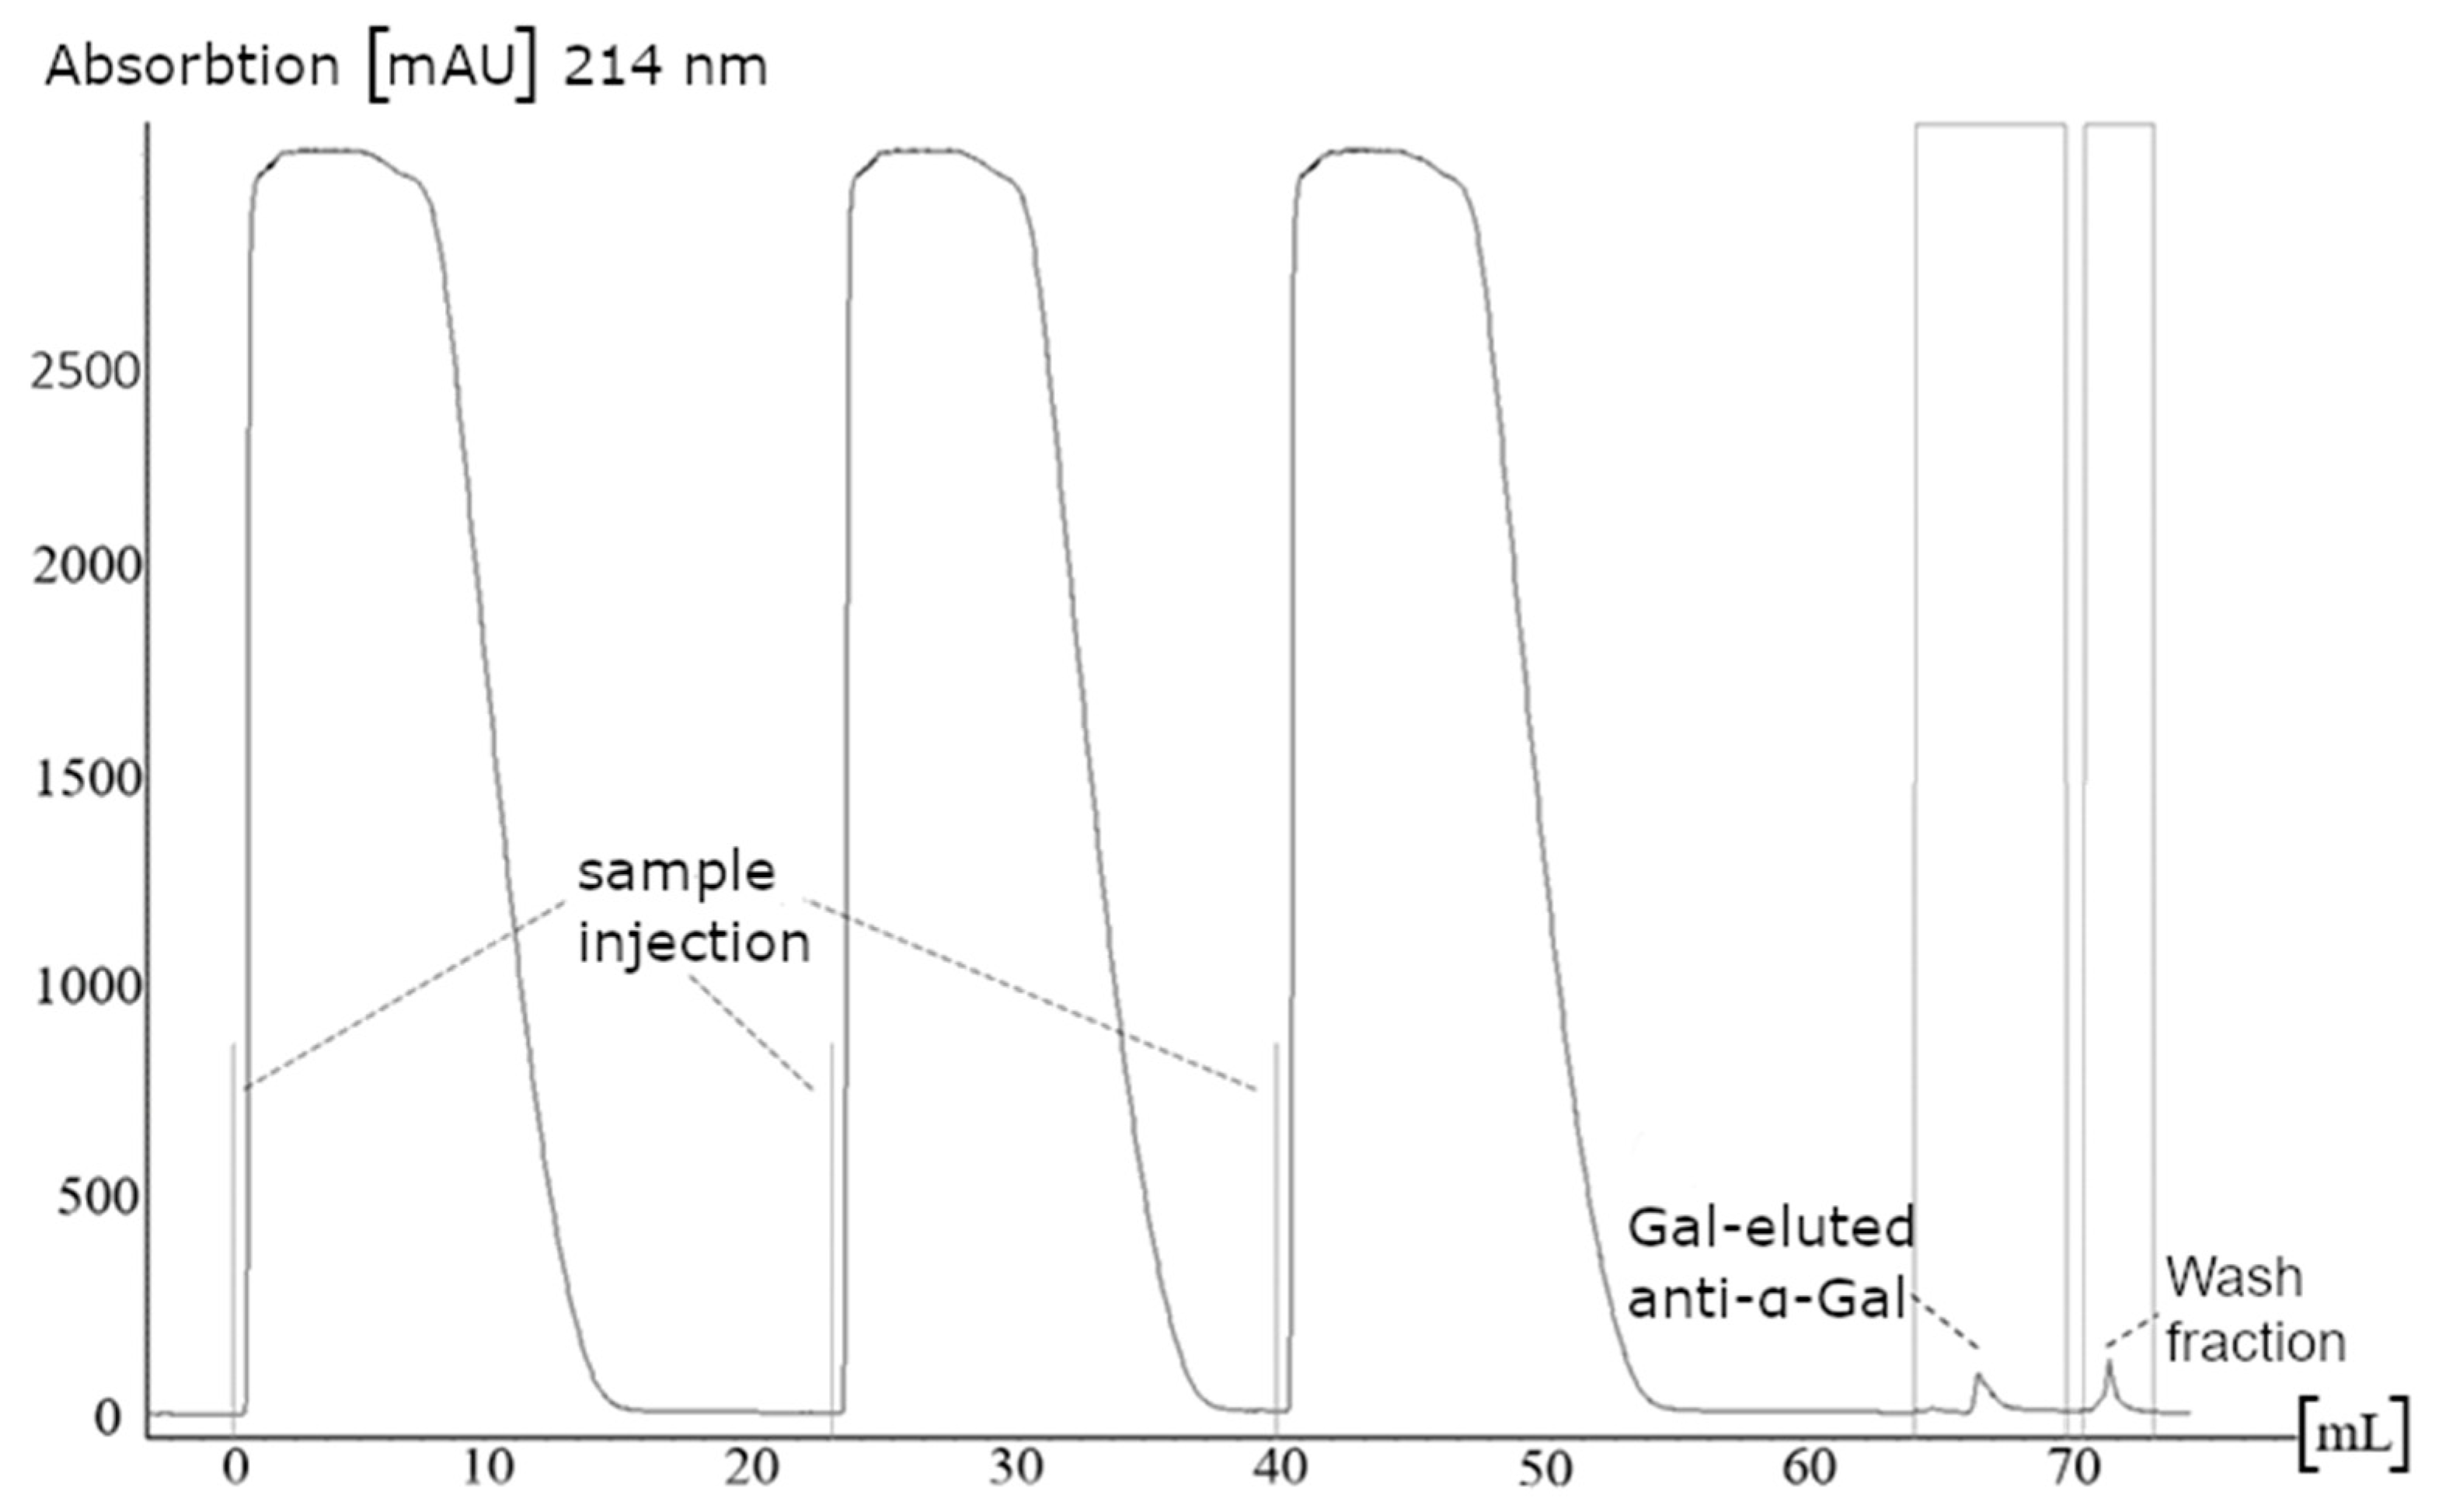
Anti-α-Gal antibodies were purified from a commercial human plasma-derived IgG concentrate (Octagam®, 100 mg/mL) by affinity chromatography on GlcNAcβ1,4-Galα1,3-Gal equipped sepharose. After washing with phosphate-buffered saline (PBS), bound anti-α-Gal antibodies were competitively eluted by 500 mM Gal. Subsequently, the column was washed with 100 mM glycine, pH 2.0 (Figure 1).
A threefold application of IgG was necessary to detect significant signals during elution. Collected fractions of several runs were pooled and the buffer was exchanged to PBS. The antibody concentration was adjusted to 1 mg/mL for further analysis. In earlier studies, anti-α-Gal antibodies were purified from human plasma by affinity chromatography using melibiose as affinity ligand [10,11,13]. Other affinity ligands such as α-Gal conjugated beads or bovine thyroglobulin were used [45,46].
The elution and wash fraction each revealed a relative protein amount of about 0.15% of totally applied IgG. This amount represents less than the content of about 1% anti-α-Gal antibodies in human IgG serum reported in the literature [47,48]. The lesser amount of anti-α-Gal antibodies in human serum may indicate only partial binding of α-Gal antibodies to the affinity column or an incomplete elution. Additionally, the high specificity of the affinity matrix may have led to a lower yield of anti-α-Gal antibodies because unspecific antibodies did not have sufficient binding affinity and eluted in the wash fraction. Furthermore, shape heterogeneity of the elution peak was observed, emphasizing the existence of different subclasses of anti-Gal antibodies.
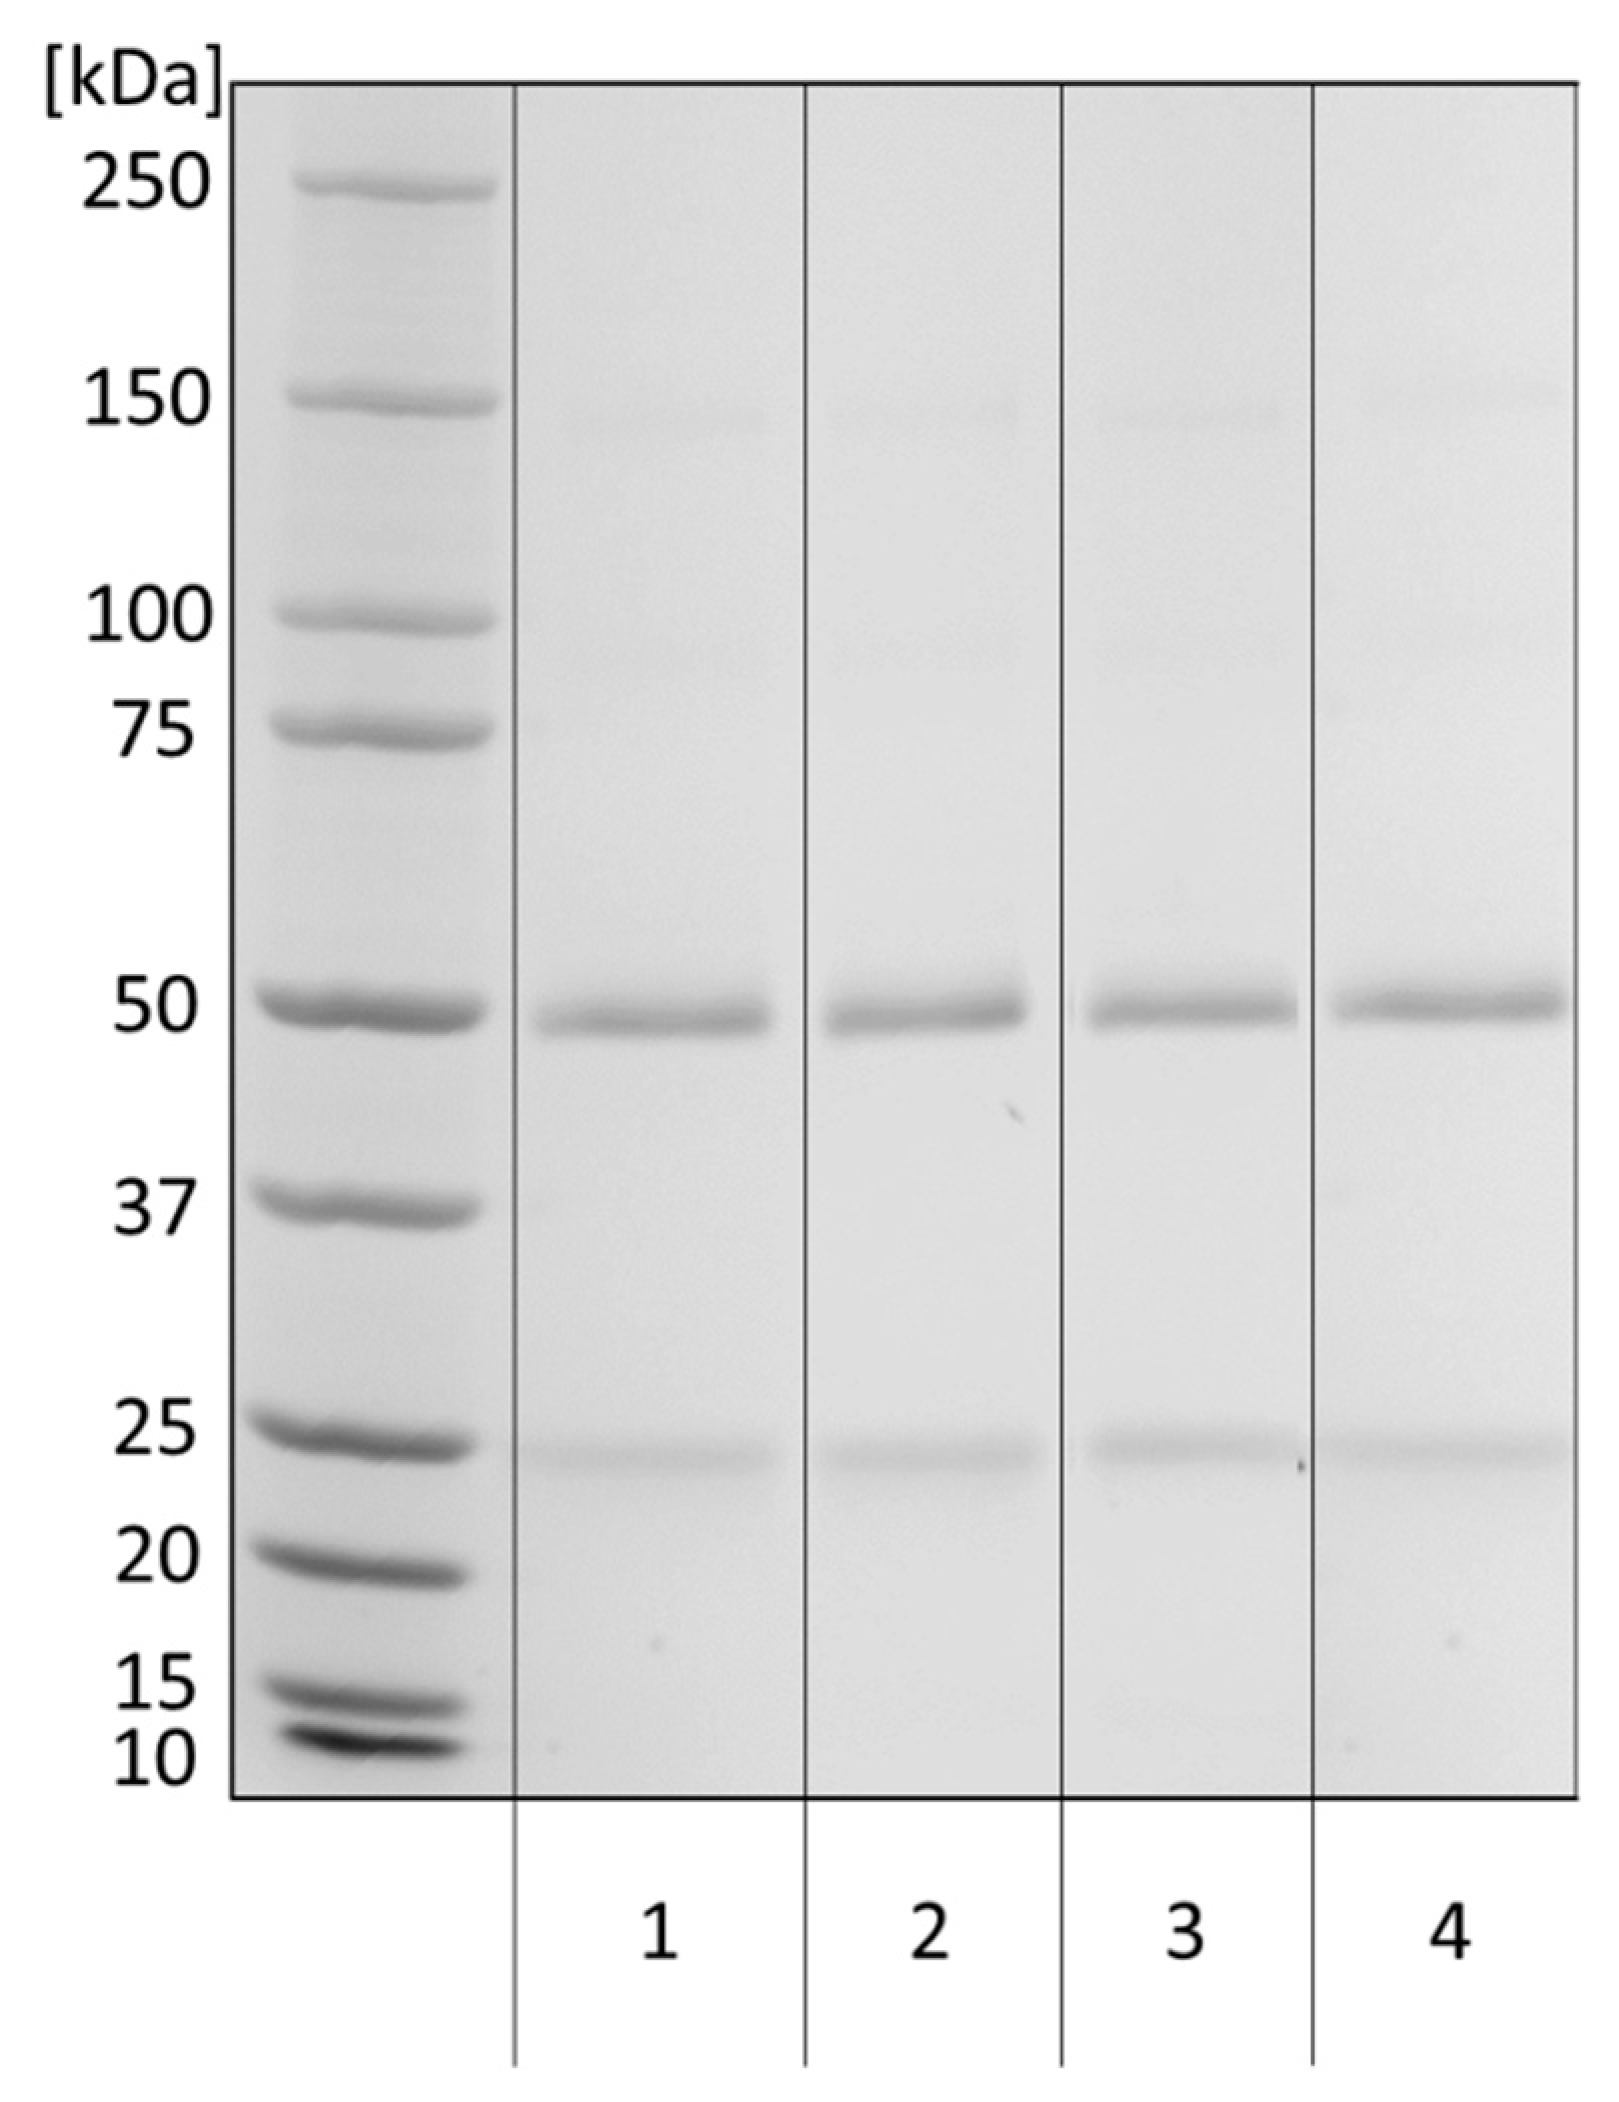
The composition of purified anti-α-Gal antibodies was evaluated by sodium dodecyl sulfate–polyacrylamide gel–electrophoresis (SDS–PAGE) under reducing conditions (Figure 2).
All samples showed bands at 50 kDa (heavy chain of IgG) and 25 kDa (light chain of IgG) and a minor signal of 150 kDa (nonreduced IgG). No major non-IgG impurities were detected.
3.2. Anti-α-Gal Antibody Characteristics
3.2.1. Subclass Determination
The IgG subclass profile of anti-α-Gal antibodies was determined by ELISA utilizing four subclass-specific monoclonal antibodies. IgG2 was found to be the most abundant immunoglobulin isotype (83%), followed by IgG1 (14%) and tiny amounts of IgG3 (2%) and IgG4 (1%). In an orthogonal approach, radial immunodiffusion (RID) was used for the determination of IgG subclasses distribution. Anti-α-Gal sample and IgG subclass calibrators were applied to gel plates containing anti-subclass specific antibodies. Equal concentrations of the antibodies formed radial precipitation lines around the sample spots. Relative abundances of anti-α-Gal IgG subclasses were calculated by diameter comparison from samples and calibrators (Table 1). In this analysis, IgG2 is the most abundant isotype (76%), followed by IgG1 (24%), whereas IgG3 and IgG4 were not detected.
The determined IgG subclass profile confirmed reports from the literature on the average amount of the subclasses of anti-α-Gal IgG (~10% for IgG1 and 80–90% for IgG2) in healthy individuals [49]. In contrast, the general subclass distribution of human IgG is about 60% for IgG1, 32% for IgG2, and 4% each for IgG3 and IgG4 [50], revealing a preference of anti-α-Gal antibodies for IgG2. Anti-α-Gal IgG2 is produced due to the natural stimulation of α-Gal-bearing bacteria in the intestinal flora [51]. This immune reaction is mediated by CD1d-receptor presenting lipid-linked carbohydrate antigens on APCs, which can be recognized by invariant natural killer T cells (iNKT) [52,53].
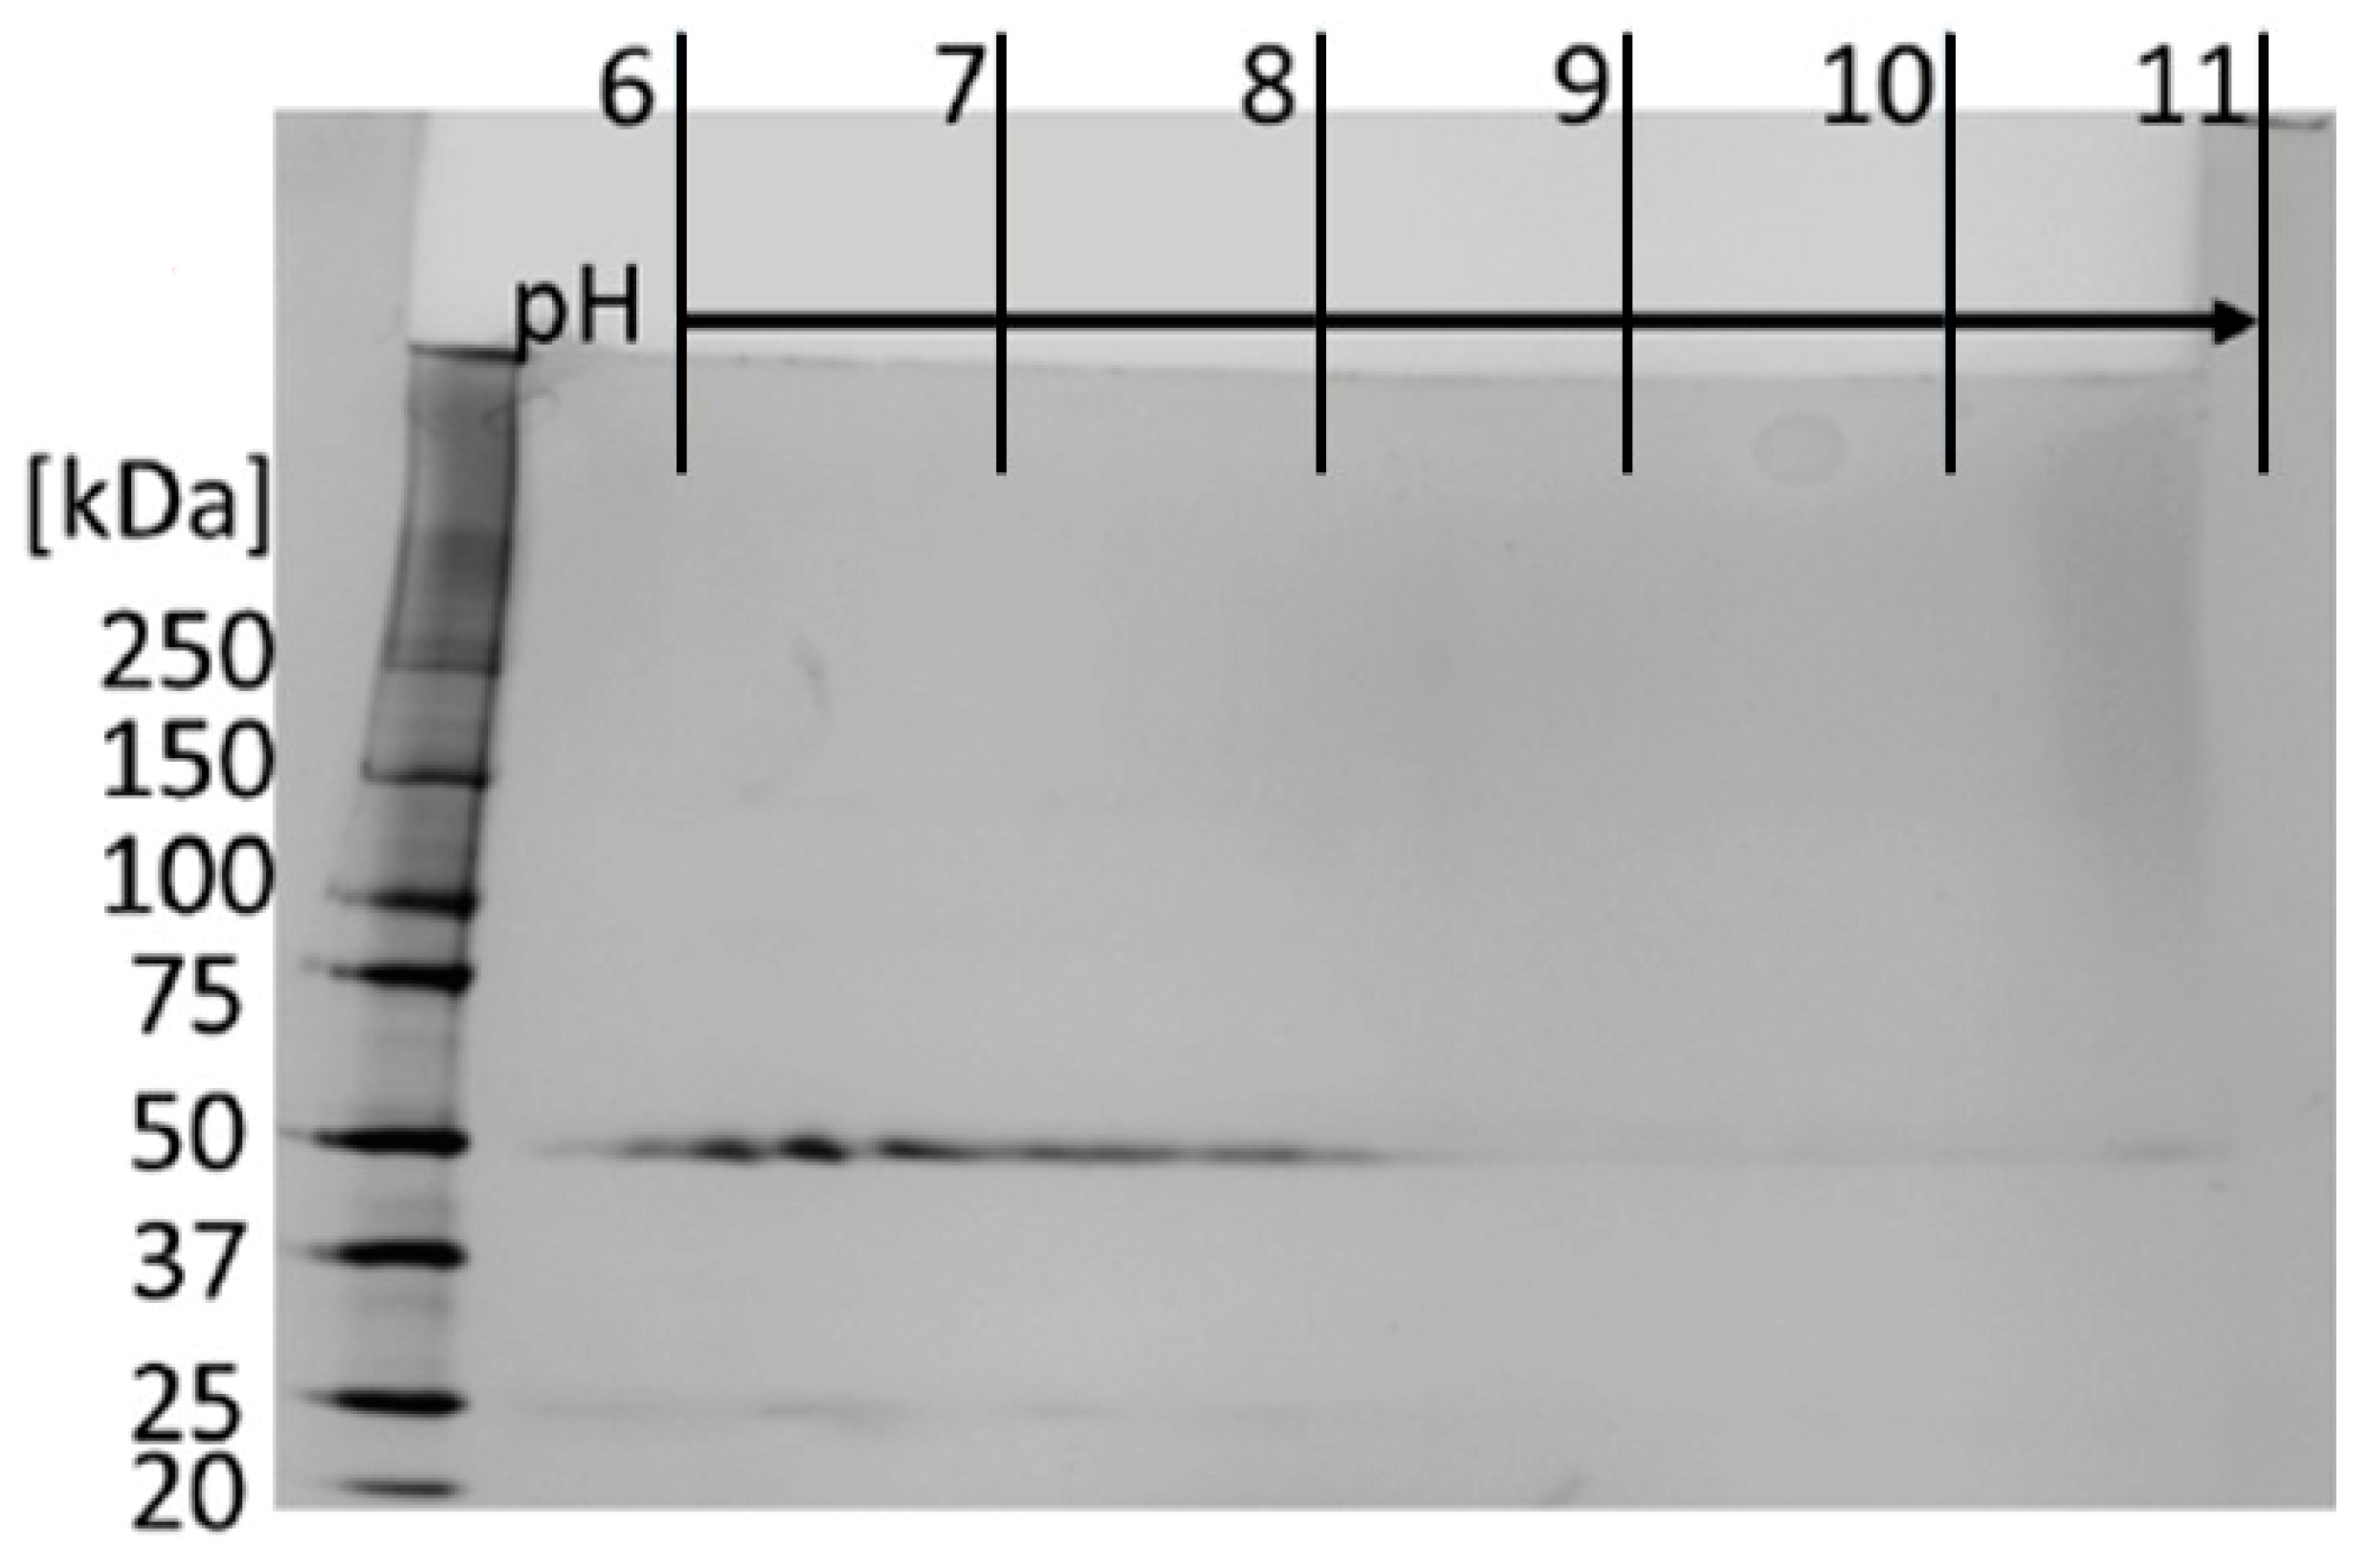
Anti-α-Gal IgG1 is produced after the occurrence of a tick bite and a subsequent exposure to α-Gal [54]. However, the anti-α-Gal IgG subclass distribution determined here was in accordance with the level of anti-α-Gal IgG subclasses of healthy people who did not suffer from tick bites [49]. The IgG subclass determination by RID was similar to the ELISA results. Nevertheless, in terms of quantitation, RID plates are reported to deliver partly inaccurate results, which may be the reason for minor differences between both assays [55]. The heterogeneity of the anti-α-Gal antibody sample was additionally shown by 2D electrophoresis (Figure 3).
Silver-stained spots at 50 kDa and 25 kDa are referred to as the heavy and the light chain of the reduced anti-α-Gal antibody. The spots represented the range of isoelectric points (IEPs) from pH 6 to pH 8 of anti-α-Gal antibodies, at least in parts due to the different subclasses or different subclass-specific glycosylation. The determined range of IEPs reflects the general range of IEPs for human IgG antibodies reported in the literature [56,57]. Galili et al. performed isoelectric focusing experiments and determined an IEP-range between pH 4 and pH 8.5 [1]. Our experiments revealed a more restricted range between pH 6 and pH 8, which underlined the possibility that anti-α-Gal subpopulations with different net charges exist.
3.2.2. Selectivity and Binding Affinities of Anti-α-Gal Antibodies
ELISA Assay
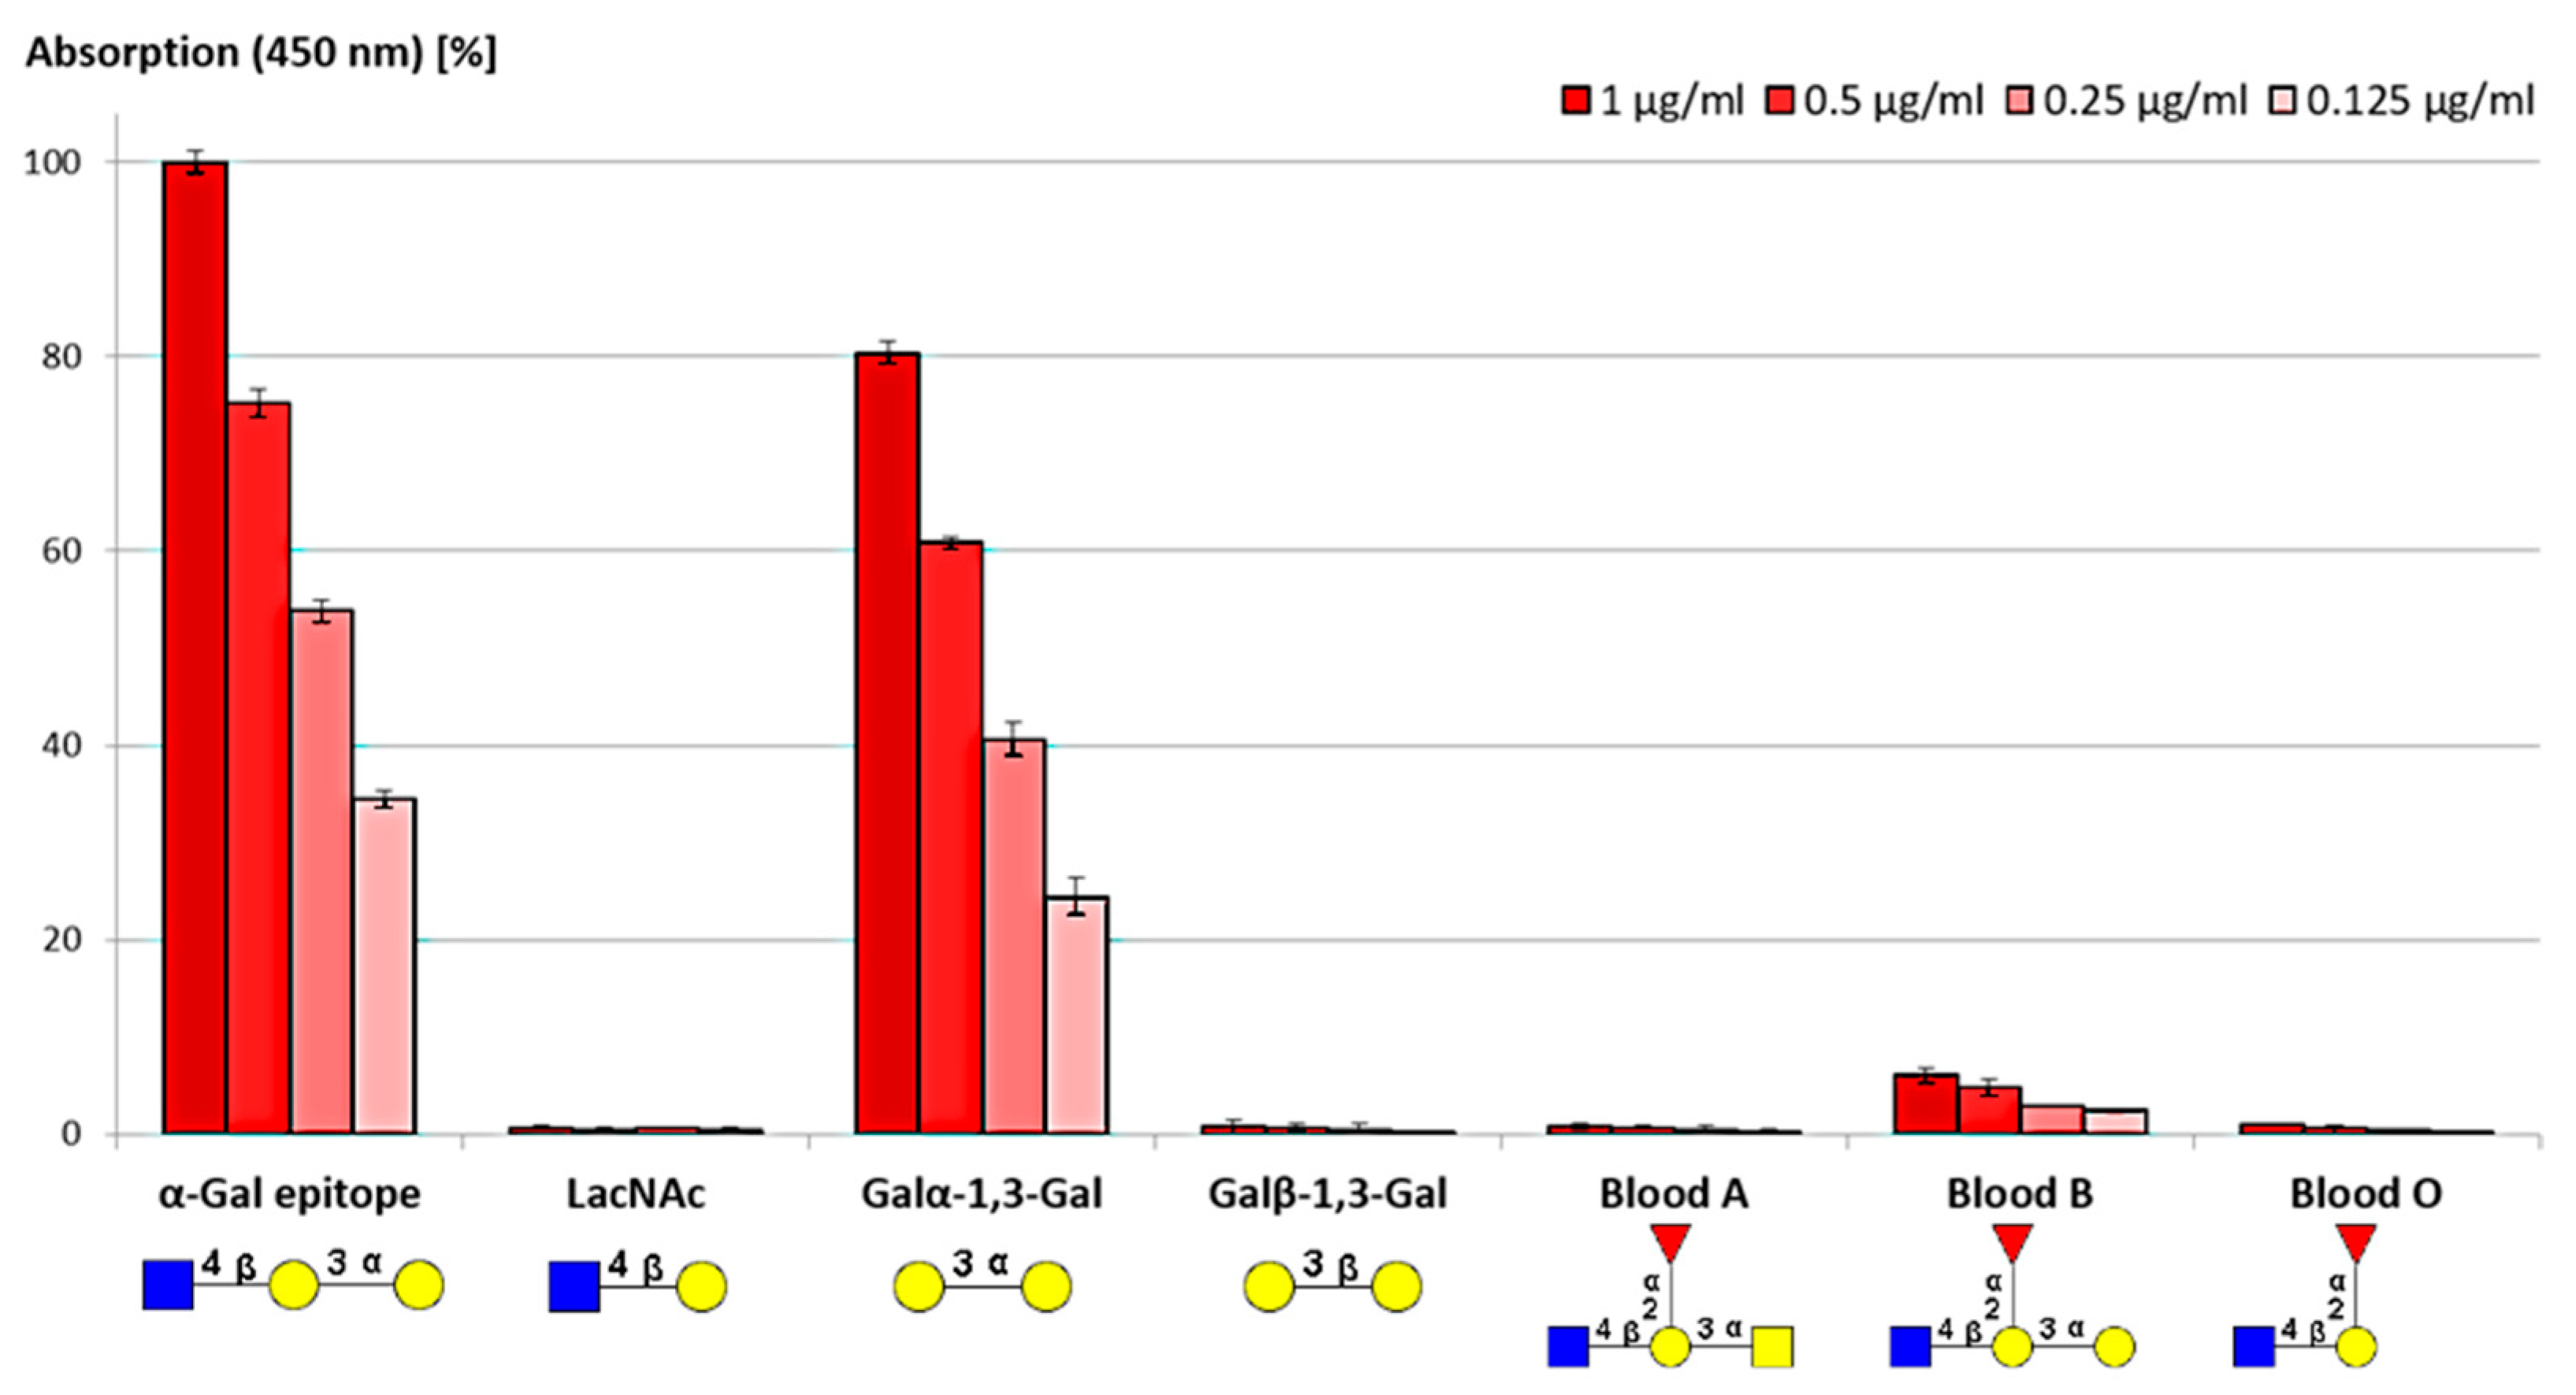
In order to evaluate the selectivity of purified anti-α-Gal antibodies, commercial biotinylated glycan epitopes were coated on a streptavidin precoated well plate, and the interaction between glycoconjugate and antibody was analyzed (Figure 4). Any glycan epitope without terminal α1,3-Gal did not reveal significant signals. Anti-α-Gal antibodies bound to the trisaccharide GlcNAcβ1,4-Galα1,3-Gal and, with a lower affinity, to the disaccharide Galα1,3-Gal. This result is in agreement with a study [58], in which was observed that the GlcNAc-residue downstream the Galα1,3-Gal disaccharide reinforced the binding via additional hydrogen bonds. Furthermore, binding to the structurally similar blood group B epitope was observed.
The purified anti-α-Gal antibodies are shown to be specific because epitopes without terminally α-Gal-linked Gal residues were not detected. A linkage variation evades antibody binding and indicates a very narrow binding pocket. The weak binding to the blood group B epitope further demonstrates that anti-blood group B antibodies are indeed a subpopulation of anti-α-Gal antibodies, as was already emphasized in the literature [59]. Individuals with blood type B produce lower titers of anti-α-Gal antibodies because of their self-tolerance to blood group B. Consequently, blood type B individuals have a higher susceptibility to α-Gal-bearing pathogens such as malaria [60]. Furthermore, blood group B individuals are less affected by red meat allergy [61]. To our current knowledge, it cannot be excluded that the occurrence of blood group B has an impact on tolerance of cetuximab, but it cannot be confirmed either.
Erythrocyte Agglutination
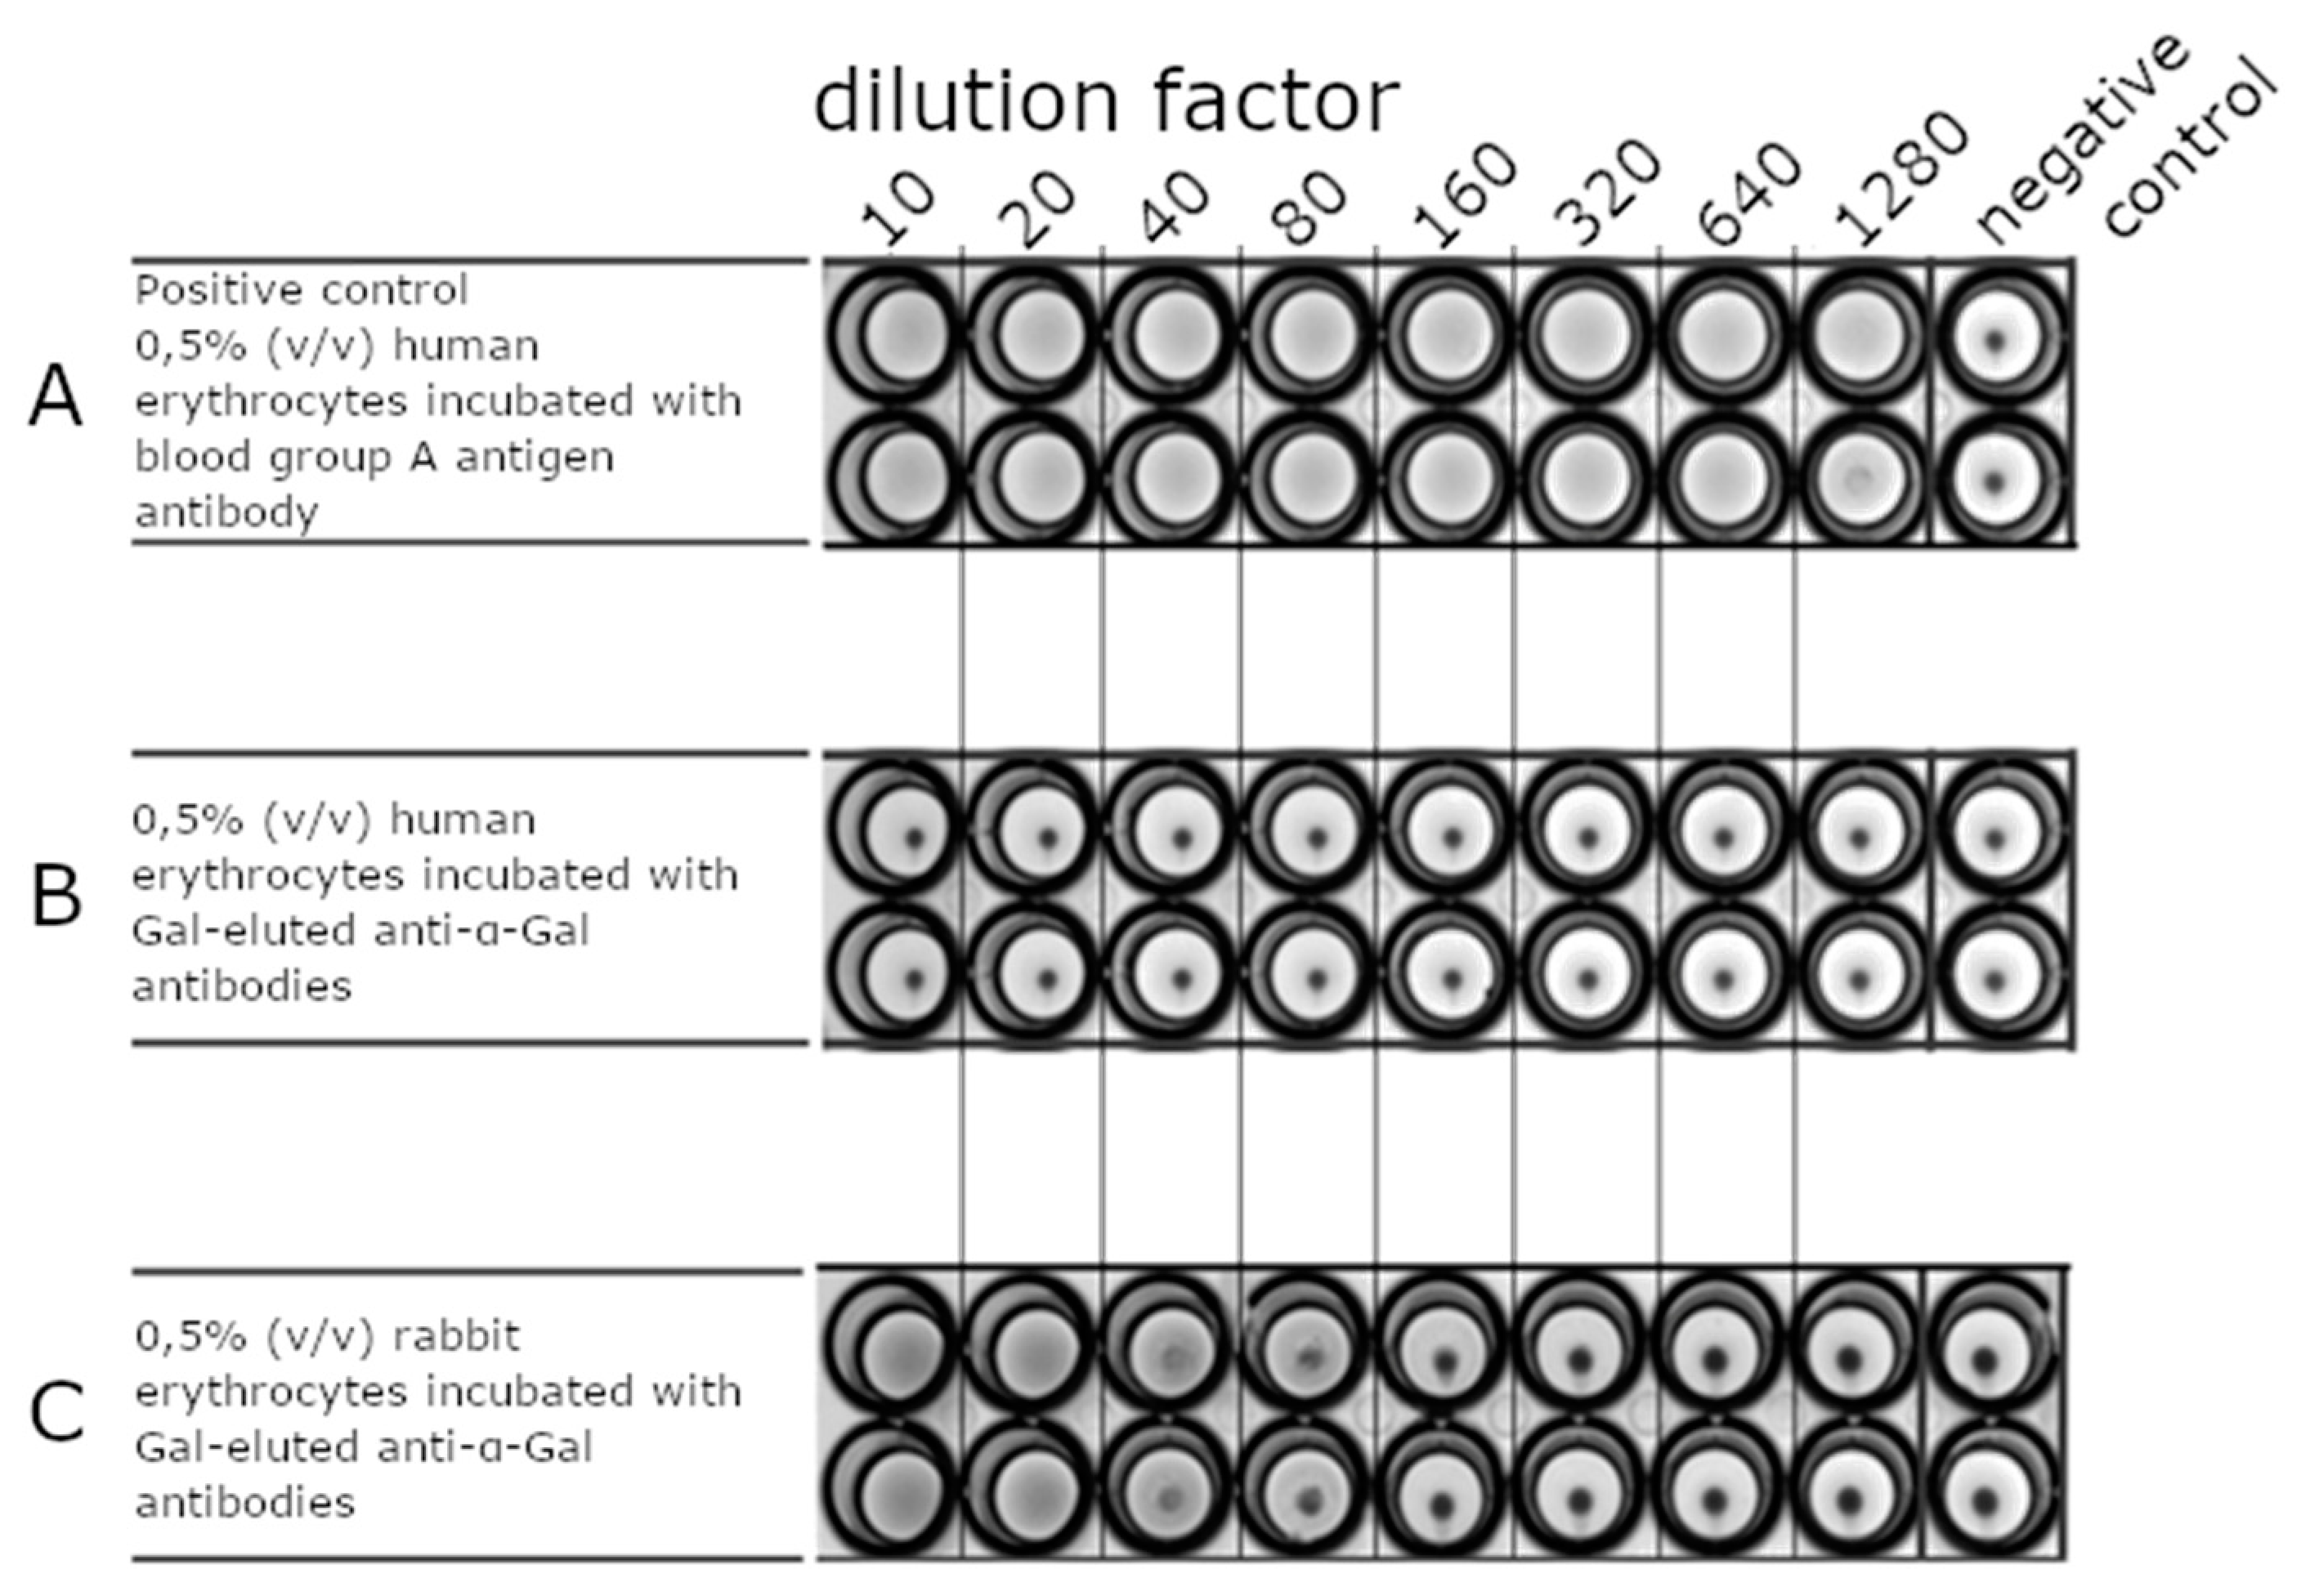
An erythrocyte agglutination assay was performed to provide further evidence of the selectivity of Gal-eluted anti-α-Gal antibodies (Figure 5). Different concentrations of anti-α-Gal antibodies were applied to a round-bottom well plate. Human and rabbit erythrocytes were added to the wells. Erythrocytes without antibodies served as a negative control. Cross-linked erythrocytes were visible as a fading surface in the round-bottom well when human blood group A erythrocytes were incubated with anti-human blood group A antibodies (Figure 5A). Unconnected cells slid down the round-bottom well, forming a dot (Figure 5, negative controls without the addition of antibodies). Anti-α-Gal antibodies bound to rabbit red blood cells in a concentration-dependent manner (Figure 5C), whereas human erythrocytes were not bound by anti-α-Gal antibodies at all (Figure 5B). These data confirm the literature, which emphasized that the α-Gal epitope is only present on rabbit erythrocytes [62,63] but not on human erythrocytes. Furthermore, the data demonstrate that purified anti-α-Gal antibodies did not show unspecific binding to the cell surface of human erythrocytes.
In former studies, the selectivity of purified anti-α-Gal antibodies was shown by the agglutination of rabbit red blood cells or ELISA [1,64]. The binding of anti-α-Gal antibodies to other glycans than α-Gal cannot be completely ruled out due to the presentation of many other glycan epitopes, such as the AB0, Diego, or Kell antigens [65] on the surface of erythrocytes.
Binding Affinity
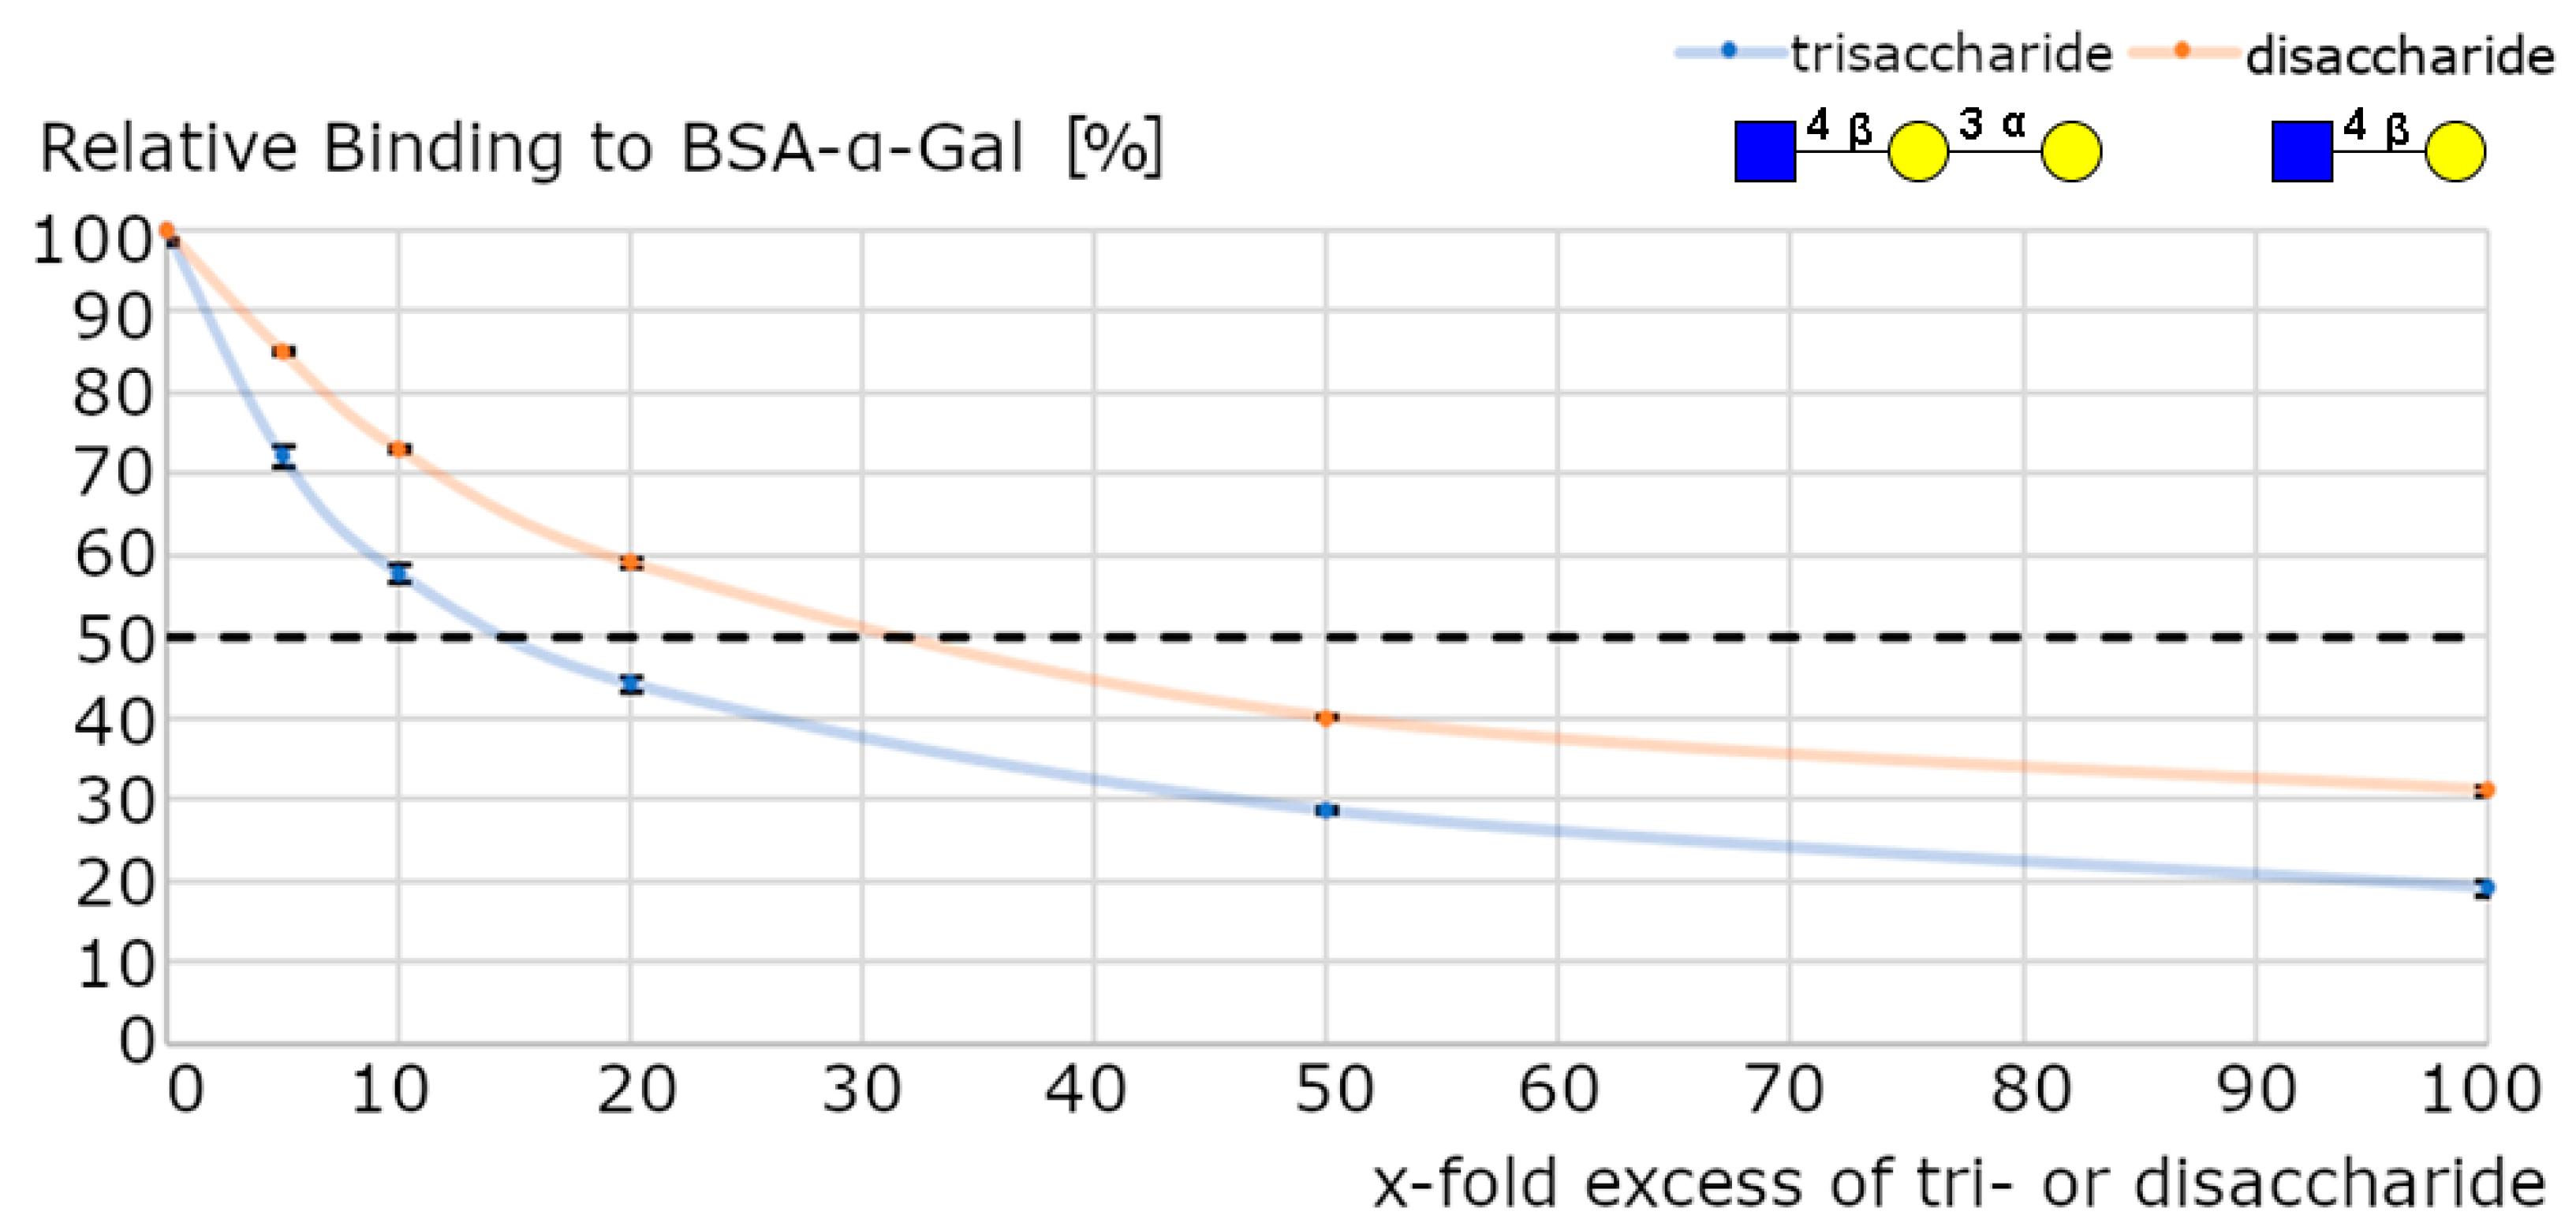
Surface plasmon resonance (SPR) measurements were performed to investigate dissociation constants of purified anti-α-Gal antibodies. Biotinylated glycan epitopes were coated on a streptavidin precoated sensor chip. Measurements with blood group A and blood group O epitopes were omitted since no binding was detected via ELISA. LacNAc, Galβ1,3-Gal, and an anticoagulation factor VIII antibody were used as negative controls. Purified anti-α-Gal antibodies only bound to the α-Gal epitope (KD = 144 ± 20 nM, n = 3) and to the α-Gal disaccharide (KD = 191 ± 18 nM, n = 3). The stabilizing effect of the additional GlcNAc-residue (GlcNAcβ1,4-Galα1,3-Gal) did not significantly affect the interaction. However, a higher affinity of the trisaccharide, compared to the disaccharide (Galα1,3-Gal), was shown by an inhibition assay. Anti-α-Gal antibodies were incubated with different excesses of either the trisaccharide or disaccharide. The binding to immobilized bovine serum albumin (BSA)-α-Gal was determined (Figure 6). Twice the amount of disaccharide than trisaccharide was necessary for a 50% inhibition of BSA-α-Gal binding.
The affinity of anti-α-Gal antibodies to α-Gal is high, compared to the dissociation constant of other carbohydrate-specific antibodies. The dissociation constant KD of high-affinity monoclonal antibodies specific for chlamydial lipopolysaccharide was reported in the range of about 500 to 700 nM [66]. That was a 2.5-to-4-times higher dissociation constant than the KD that was calculated for the binding of anti-α-Gal antibodies to α-Gal in our assay. Compared to dissociation constants of specific therapeutical monoclonal antibodies, which were in the picomolar range for their corresponding antigen, the affinity of anti-α-Gal was lower by a factor up to 2000 [67]. To include potential effects of polypeptide backbones on the binding affinity of anti-α-Gal antibodies, we immobilized bovine thyroglobulin on a carboxylmethyl (CM) 5 sensor chip and measured the binding affinity to purified anti-α-Gal antibodies. The dissociation constant was determined as 1.6 nM, which suggests a strong positive influence of the protein part on anti-α-Gal antibody affinity. Binding studies of anti-α-Gal IgE, bovine thyroglobulin, and human serum albumin coated with α-Gal determined dissociation constants of 36 nM (bovine thyroglobulin) and 363 nM (albumin) [64]. Experiments to determine the binding affinity of an engineered antibody against N-glycolylneuraminic acid (Neu5Gc) on proteins resulted in dissociation constants at about 1 µM [68]. This is a 1000-fold higher dissociation constant than the KD values determined here (KD between anti-Gal and bovine thyroglobulin = 1.6 nM), indicating a very high affinity of purified anti-α-Gal antibodies toward α-Gal epitopes. The high specificity of the purified antibodies is the decisive difference to the recombinant anti-Gal antibody variants M86 and G-13. In contrast to the simple enrichment and purification of human, highly specific anti-Gal antibodies, the expression of the recombinant variants leads to numerous problems such as autolysis or self-agglutination [59,69,70,71].
3.2.3. N-Glycosylation Profile of Anti-α-Gal Antibodies
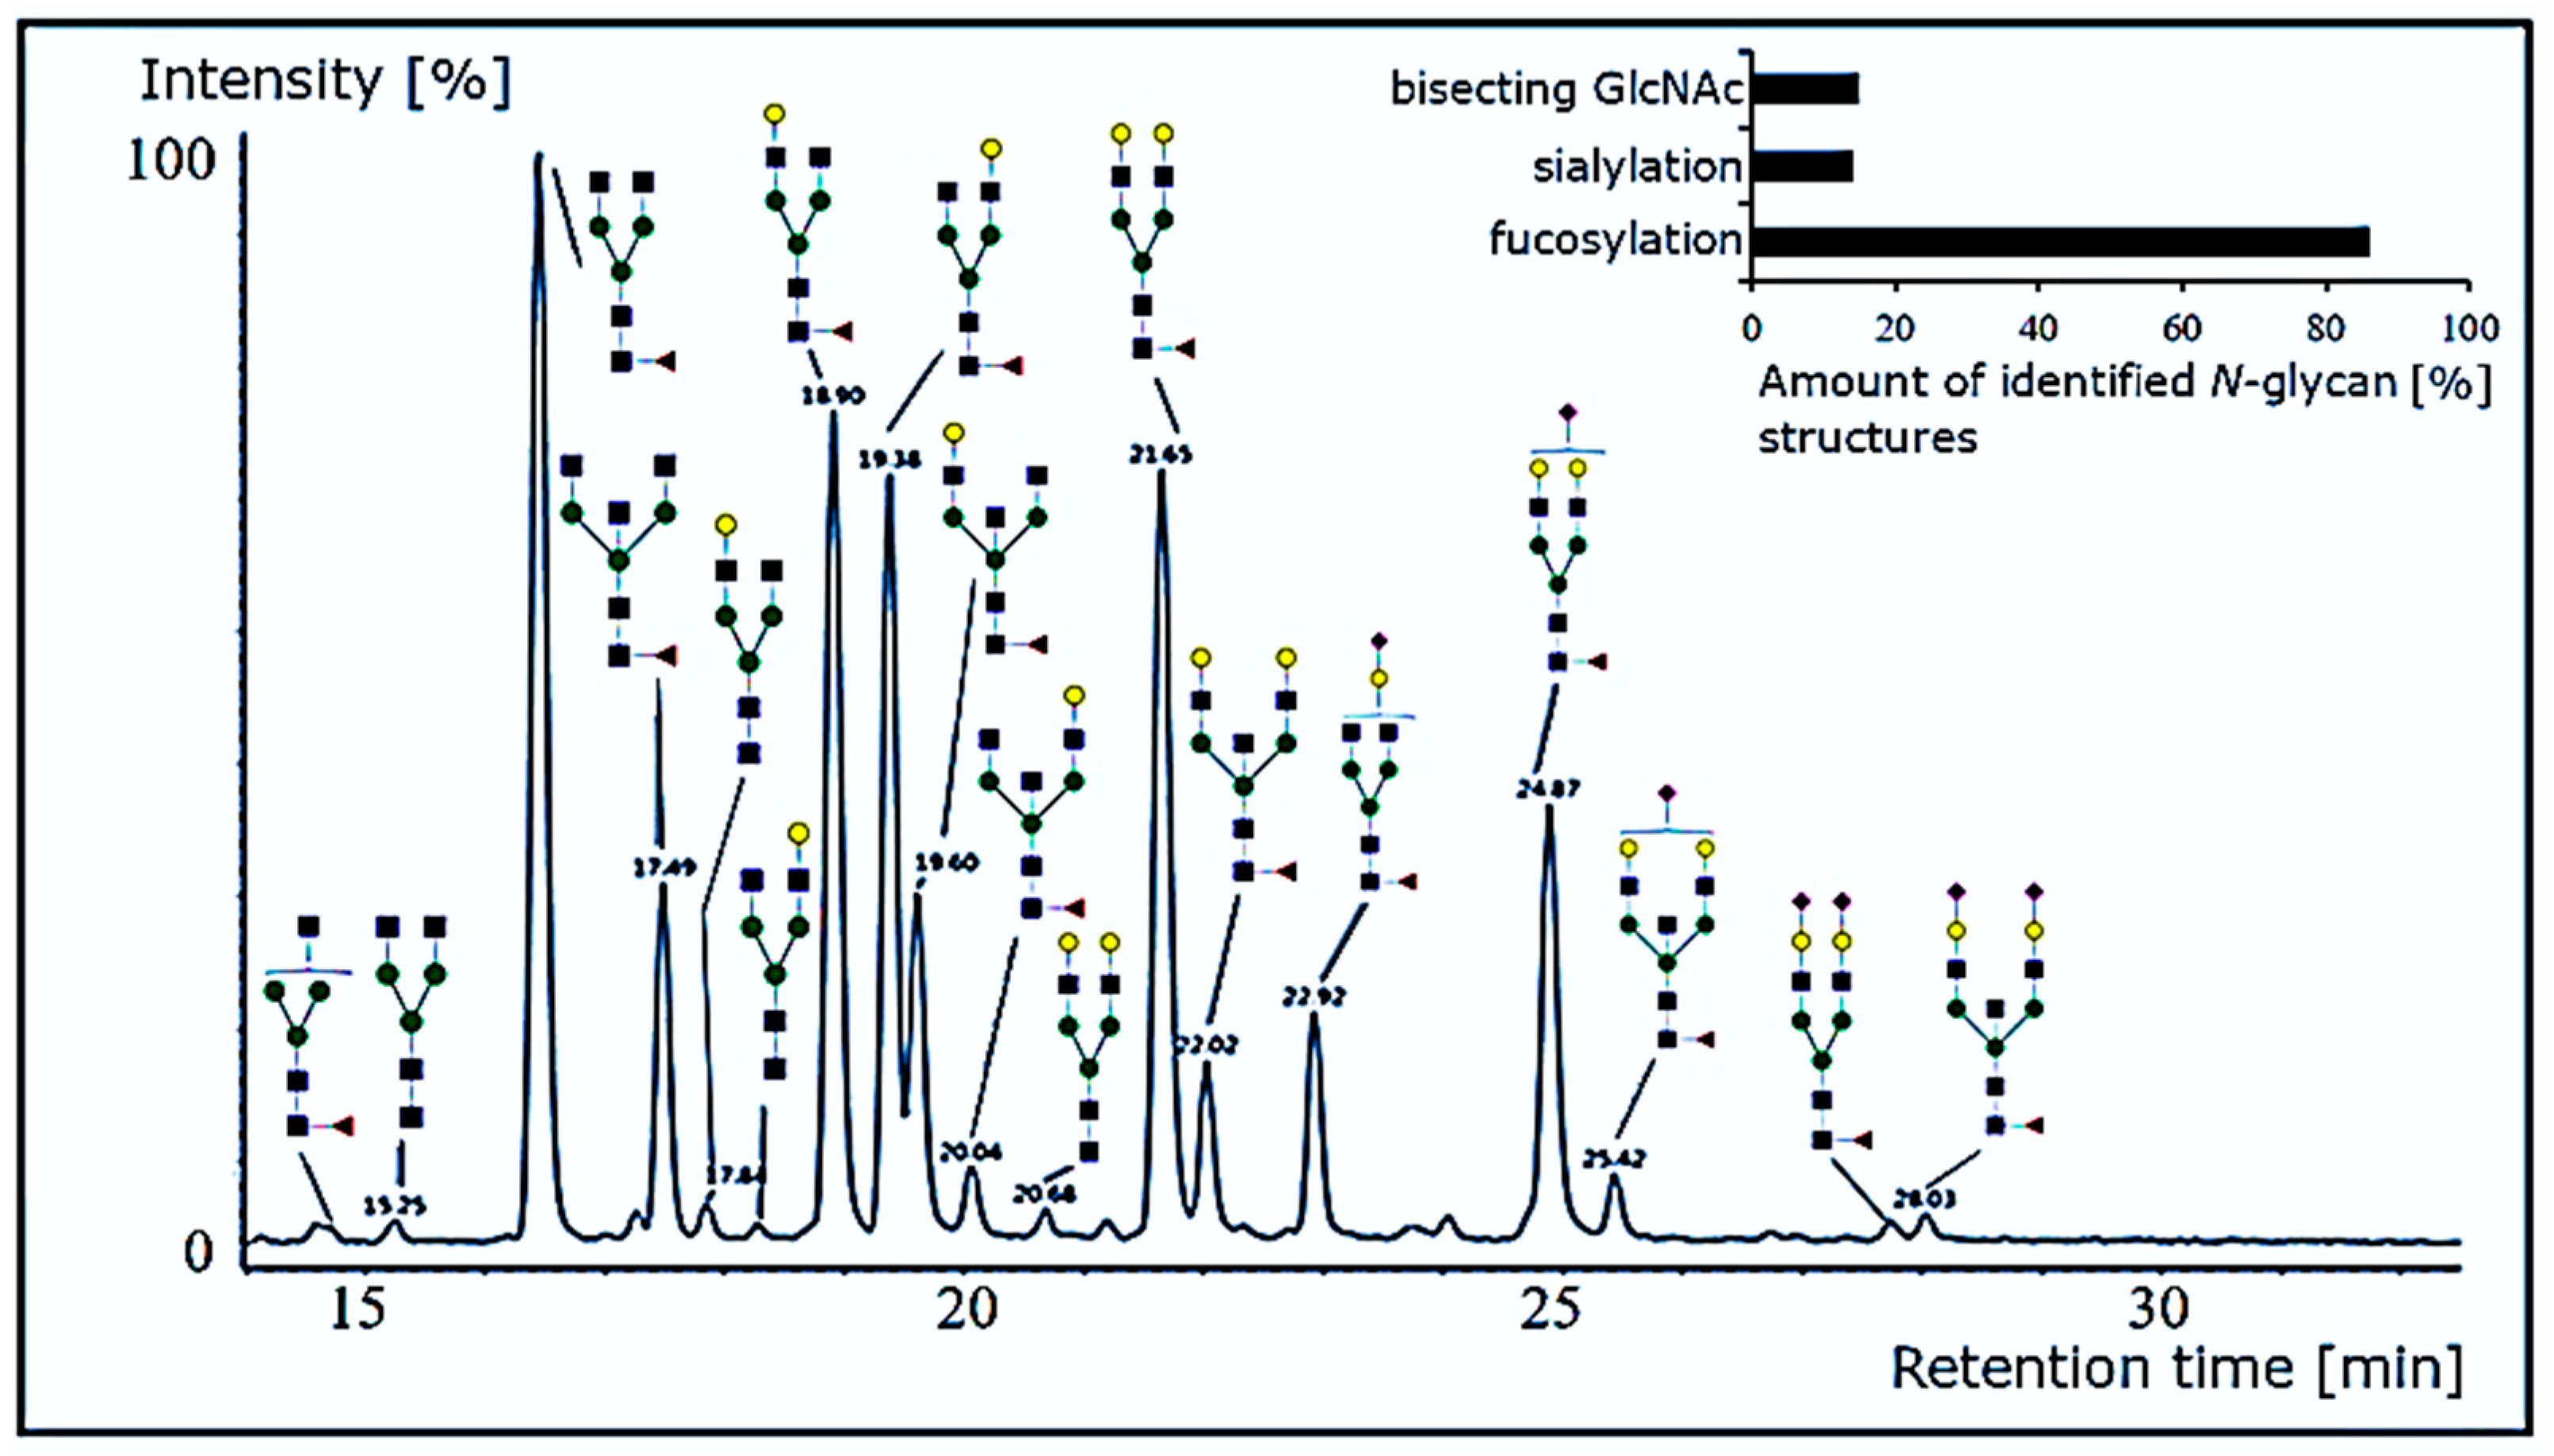
The glycosylation of antibodies has been extensively studied [72,73,74]. To characterize the N-glycosylation profile of purified anti-α-Gal antibodies, their N-glycans were enzymatically released with PNGase F. Enzymatically released N-glycans were labeled with fluorescent RapiFluor MS reagent, separated via hydrophilic interaction liquid chromatography (HILIC), and applied to the mass spectrometric analysis. The resulting N-glycan profile of purified anti-α-Gal antibodies revealed a typical human IgG-like glycosylation (Figure 7).
Out of the detected N-glycans, 86% were fucosylated. The most prominent structure was the complex biantennary, fucosylated glycan without antennary galactoses (G0) followed by the mono- and fully galactosylated forms (G1 and G2). Bisecting GlcNAc (15% of all structures) and sialylated glycans (12% partial, 1% full) represent further elements. To our knowledge, the N-glycosylation profile of anti-α-Gal antibodies was not reported before. Especially the high grade of core fucosylation (86%), the low grade of sialylation (13%), and a moderate grade of bisection (15%) are typical for human IgG [75,76]. Glycan structure–function relationships, particularly for antibodies, are a major issue to date [77]. A fully elucidated N-glycan profile of anti-α-Gal may help prospective therapeutic applications of the antibody or optimize its recombinant expression.
3.3. Verification of the Anti-α-Gal Suitability as Detection Antibody
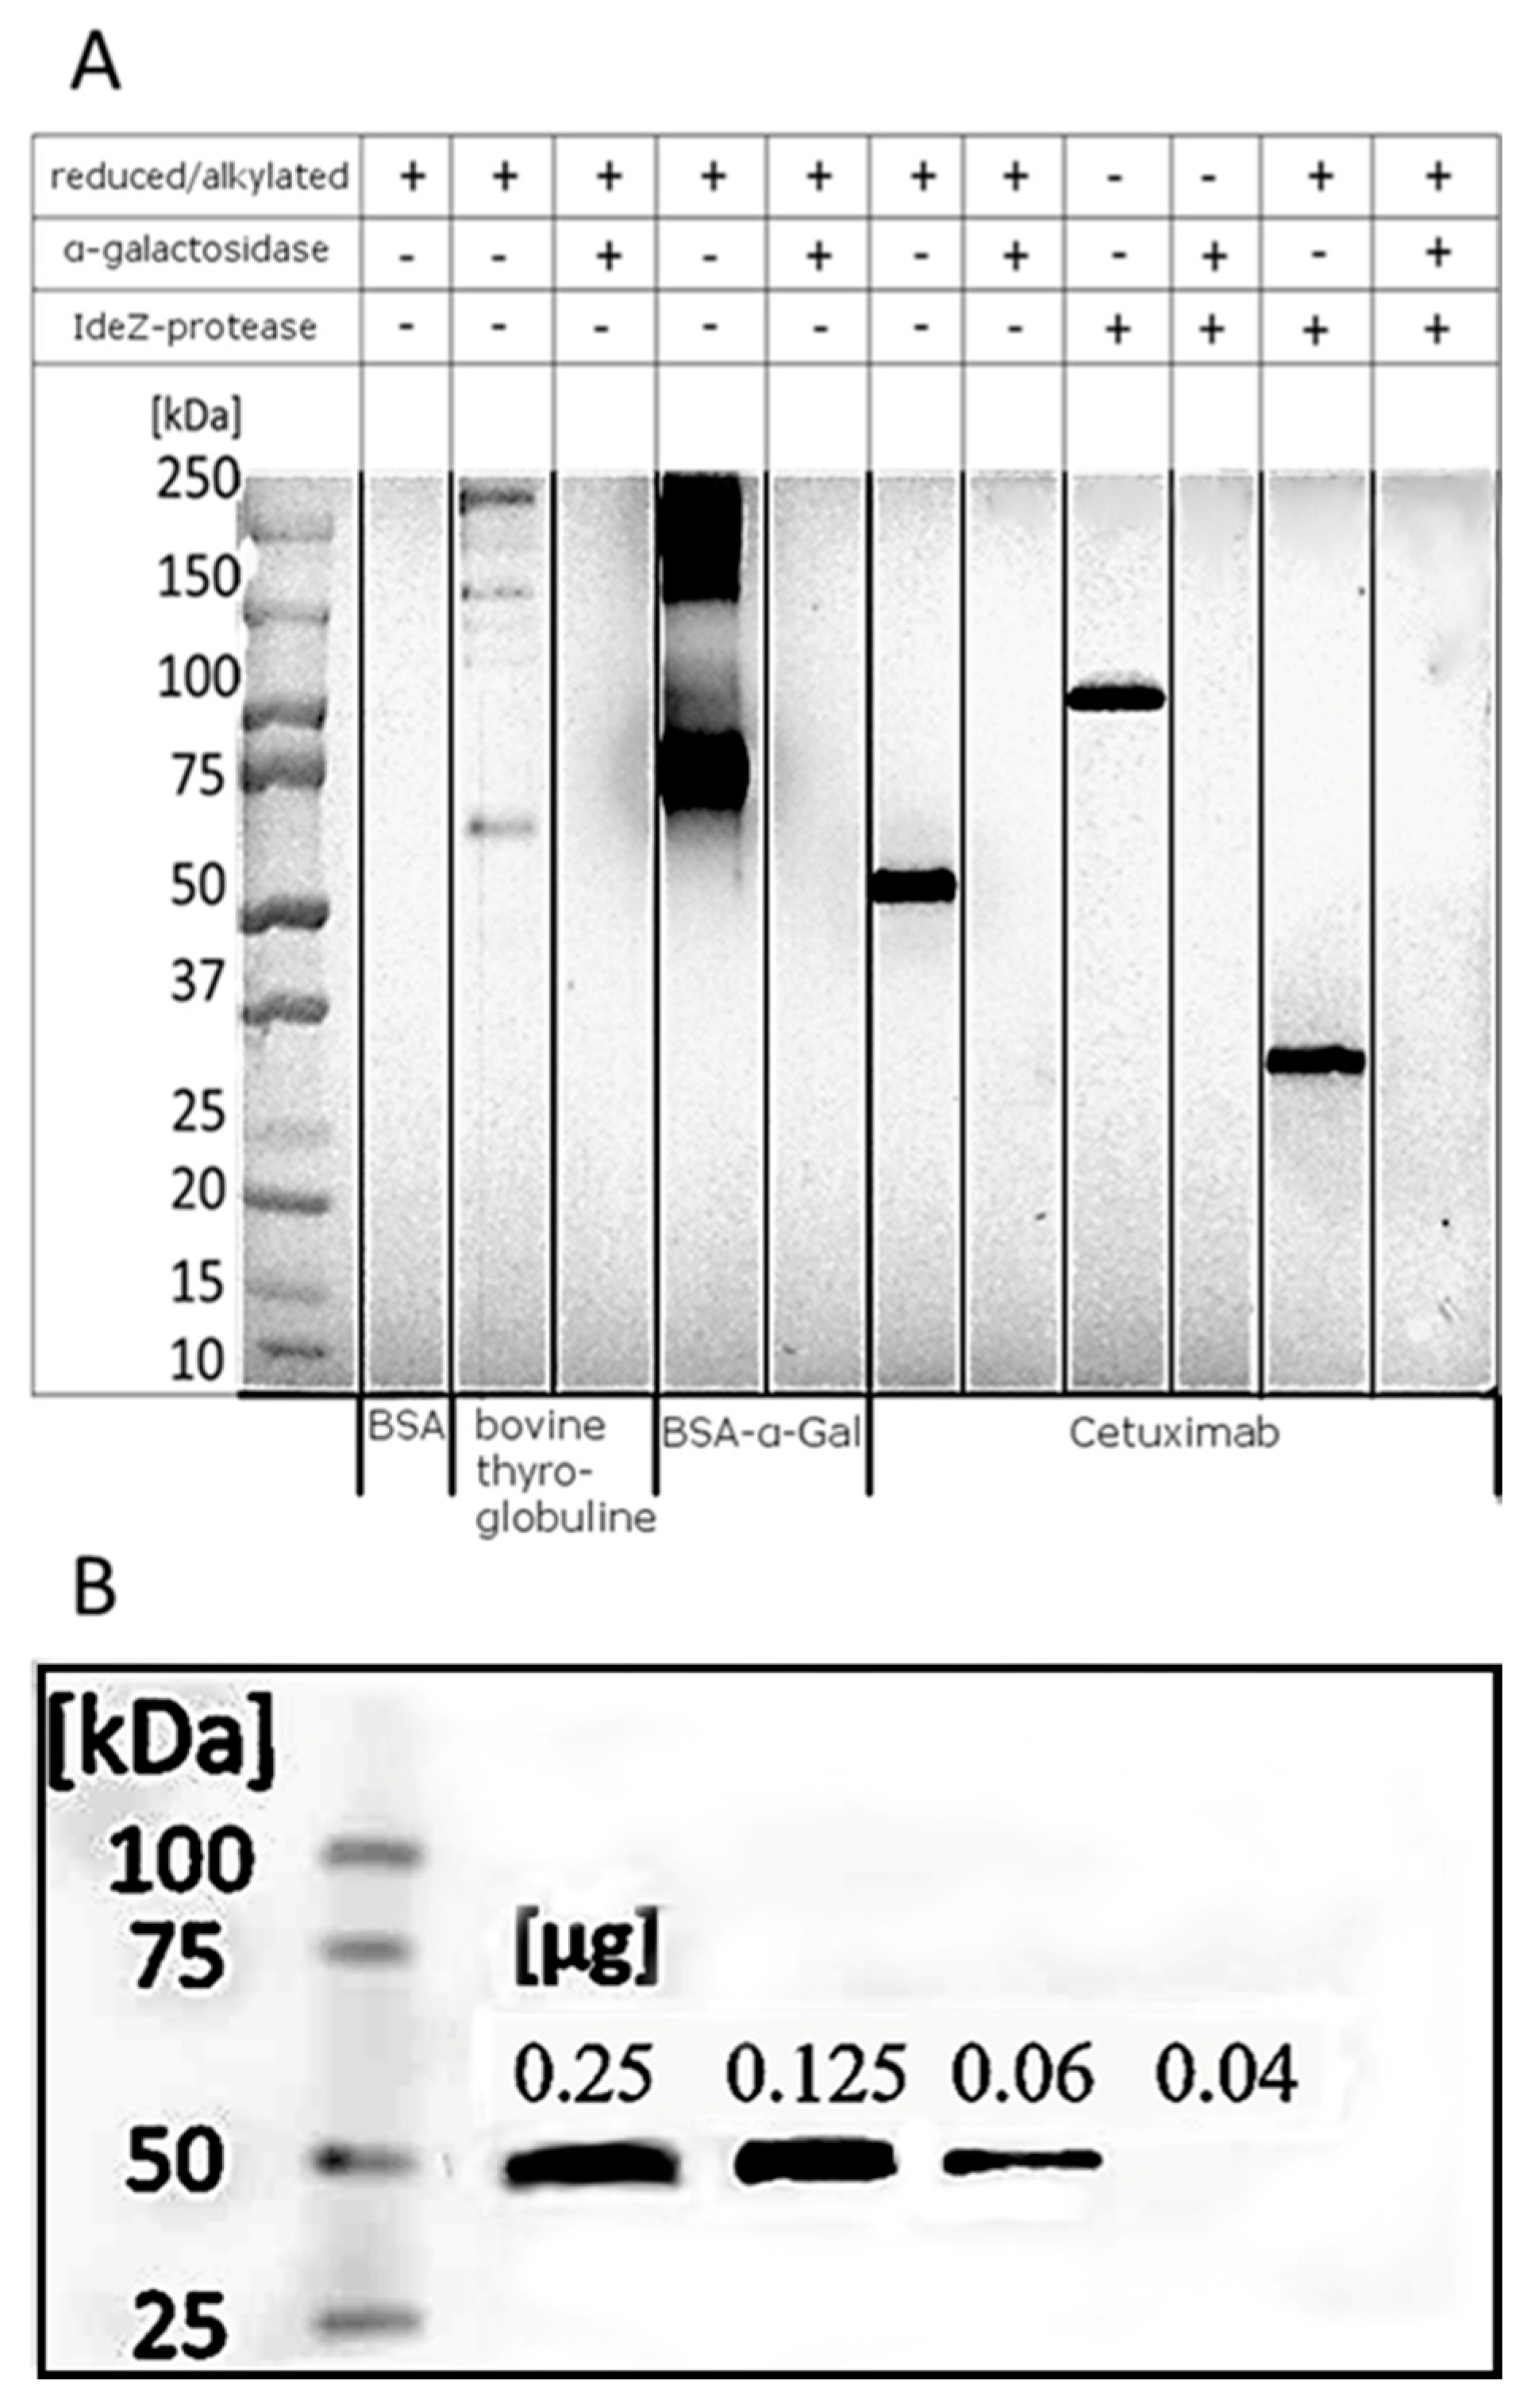
In this study, purified anti-α-Gal antibodies were investigated for their applicability in Western blot analyses applying HRP-induced chemiluminescence for detection. For proof of concept, the α-Gal-carrying glycoproteins bovine thyroglobulin, cetuximab, and a synthetically produced BSA-α-Gal-conjugate were analyzed utilizing the purified anti-α-Gal fraction as primary antibodies (Figure 8A).
After reduction and alkylation, bovine thyroglobulin showed bands from 75 to over 250 kDa, representing products caused by the reduction of disulfide bridges, which is in line with reports from the literature [78]. Synthetic BSA-α-Gal revealed a monomer at about 66 kDa and bands from 150 kDa to over 250 kDa, most likely due to aggregation. Cetuximab showed a band at 50 kDa, indicating glycosylation at the heavy chain. After cleavage at the hinge region, catalyzed by IdeZ protease, the Fab fragment was detected at 100 kDa. After reduction, this signal was shifted to ~25 kDa. Anti-α-Gal antibodies did neither bind to any α1,3-galactosidase-treated proteins nor the negative control (BSA).
Different amounts of cetuximab were separated by SDS–PAGE, blotted, and developed with HRP-conjugated anti-α-Gal antibodies (Figure 8B) to evaluate the detection limit of anti-α-Gal antibodies. Cetuximab was detectable down to a value of 0.04 µg (0.28 pmol). The known molar amount of four α-Gal epitopes for cetuximab [79] reveals a detection limit of 1.12 pmol of α-Gal epitopes.
Detailed glycan analysis requires a lot of time, expensive equipment, and skilled scientists. This assay is fast and comparatively uncomplicated. However, an obvious disadvantage of the Western blot assay is that only glycoproteins of sufficiently high mass can be analyzed due to the previous separation via gel electrophoresis. Glycopeptides are too small to be detected with Western blot, whereas mass spectrometric detection of glycopeptides or even smaller molecules has been carried out a lot of times [80,81,82]. Therefore, selected model glycoproteins with high amounts of α-Gal epitopes were analyzed via Western blot in this study only. Purified anti-α-Gal antibodies can also be used for quantification of the amount of α-Gal in specific glycoproteins in ELISA assays with higher sensitivity (see Figure 4 for use of α-Gal antibodies in ELISA in general). For this, more therapeutic glycoproteins with low α-Gal content should be analyzed to identify the detection limit of the anti-α-Gal antibody.
For example, the monoclonal antibodies palivizumab, dinutuximab, necitumumab, and elotuzumab, which are produced in α-Gal synthesizing murine cells [83] may require continuous monitoring of the α-Gal content during bioprocesses.
Author Contributions
Writing—original draft preparation, visualization, investigation, conceptualization, methodology A.Z.; conceptualization, methodology, validation, investigation, data curation, writing—review and editing, J.R.; conceptualization, methodology, validation, investigation, data curation, writing—review and editing, G.K.; supervision, project administration, writing—review and editing, S.H.; supervision, project administration, writing—review and editing, M.K.P. All authors have read and agreed to the published version of the manuscript.
Funding
This research received no external funding.
Institutional Review Board Statement
Not applicable.
Informed Consent Statement
Not applicable.
Conflicts of Interest
The authors declare no conflict of interest.
References
- Galili, U.; Rachmilewitz, E.A.; Peleg, A.; Flechner, I. A unique natural human IgG antibody with anti-alpha-galactosyl specificity. J. Exp. Med. 1984, 160, 1519–1531. [Google Scholar] [CrossRef] [PubMed]
- Huai, G.; Qi, P.; Yang, H.; Wang, Y. Characteristics of α-Gal epitope, anti-Gal antibody, α1,3 galactosyltransferase and its clinical exploitation (Review). Int. J. Mol. Med. 2016, 37, 11–20. [Google Scholar] [CrossRef] [PubMed] [Green Version]
- Galili, U.; Shohet, S.B.; Kobrin, E.; Stults, C.L.; Macher, B.A. Man, apes, and Old World monkeys differ from other mammals in the expression of alpha-galactosyl epitopes on nucleated cells. J. Biol. Chem. 1988, 263, 17755–17762. [Google Scholar] [CrossRef]
- Steinke, J.W.; Platts-Mills, T.A.; Commins, S.P. The alpha-gal story: Lessons learned from connecting the dots. J. Allergy Clin. Immunol. 2015, 135, 589–596. [Google Scholar] [CrossRef] [Green Version]
- Larsen, R.D.; Rivera-Marrero, C.A.; Ernst, L.K.; Cummings, R.D.; Lowe, J.B. Frameshift and nonsense mutations in a human genomic sequence homologous to a murine UDP-Gal:beta-D-Gal(1,4)-D-GlcNAc alpha(1,3)-galactosyltransferase cDNA. J. Biol. Chem. 1990, 265, 7055–7061. [Google Scholar] [CrossRef]
- Lantéri, M.; Giordanengo, V.; Vidal, F.; Gaudray, P.; Lefebvre, J.-C. A complete 1,3-galactosyltransferase gene is present in the human genome and partially transcribed. Glycobiology 2002, 12, 785–792. [Google Scholar] [CrossRef]
- Chen, Z.C.; Tanemura, M.; Galili, U. Synthesis of -gal epitopes (Gal 1-3Gal 1-4GlcNAc-R) on human tumor cells by recombinant 1,3galactosyltransferase produced in Pichia pastoris. Glycobiology 2001, 11, 577–586. [Google Scholar] [CrossRef] [PubMed] [Green Version]
- Tanemura, M.; Miyoshi, E.; Nagano, H.; Eguchi, H.; Matsunami, K.; Taniyama, K.; Hatanaka, N.; Akamatsu, H.; Mori, M.; Doki, Y. Cancer immunotherapy for pancreatic cancer utilizing α-gal epitope/natural anti-Gal antibody reaction. World J. Gastroenterol. 2015, 21, 11396–11410. [Google Scholar] [CrossRef]
- Tanida, T.; Tanemura, M.; Miyoshi, E.; Nagano, H.; Furukawa, K.; Nonaka, Y.; Akita, H.; Hama, N.; Wada, H.; Kawamoto, K.; et al. Pancreatic cancer immunotherapy using a tumor lysate vaccine, engineered to express α-gal epitopes, targets pancreatic cancer stem cells. Int. J. Oncol. 2014, 46, 78–90. [Google Scholar] [CrossRef]
- Galili, U.; Buehler, J.; Shohet, S.B.; Macher, B.A. The human natural anti-Gal IgG. III. The subtlety of immune tolerance in man as demonstrated by crossreactivity between natural anti-Gal and anti-B antibodies. J. Exp. Med. 1987, 165, 693–704. [Google Scholar] [CrossRef]
- Galili, U. The α-gal epitope and the anti-Gal antibody in xenotransplantation and in cancer immunotherapy. Immunol. Cell Biol. 2005, 83, 674–686. [Google Scholar] [CrossRef]
- Macher, B.A.; Galili, U. The Galalpha1,3Galbeta1,4GlcNAc-R (alpha-Gal) epitope: A carbohydrate of unique evolution and clinical relevance. Biochim. Biophys. Acta 2008, 1780, 75–88. [Google Scholar]
- Galili, U. Anti-Gal: An abundant human natural antibody of multiple pathogeneses and clinical benefits. Immunology 2013, 140, 1–11. [Google Scholar] [CrossRef] [PubMed]
- Eto, T.; Ichikawa, Y.; Nishimura, K.; Ando, S.; Yamakawa, T. Chemistry of lipid of the posthemyolytic residue or stroma of erythrocytes. XVI. Occurrence of ceramide pentasaccharide in the membrane of erythrocytes and reticulocytes of rabbit. J. Biochem. 1968, 64, 205–213. [Google Scholar] [CrossRef] [PubMed]
- Egge, H.; Kordowicz, M.; Peter-Katalinić, J.; Hanfland, P. Immunochemistry of I/i-active oligo- and polyglycosylceramides from rabbit erythrocyte membranes. Characterization of linear, di-, and triantennary neolactoglycosphingolipids. J. Biol. Chem. 1985, 260, 4927–4935. [Google Scholar] [CrossRef]
- Takahashi, H.; Chinuki, Y.; Tanaka, A.; Morita, E. Laminin g-1 and collagen\alpha-1 (VI) chain are galactose-\alpha-1,3-galactose-bound allergens in beef. Allergy 2014, 69, 199–207. [Google Scholar] [CrossRef] [PubMed]
- Galili, U.; Mandrell, R.E.; Hamadeh, R.M.; Shohet, S.B.; Griffiss, J.M. Interaction between human natural anti-alpha-galactosyl immunoglobulin G and bacteria of the human flora. Infect. Immun. 1988, 56, 1730–1737. [Google Scholar] [CrossRef] [PubMed] [Green Version]
- Yilmaz, B.; Portugal, S.; Tran, T.; Gozzelino, R.; Ramos, S.; Gomes, J.; Regalado, A.; Cowan, P.J.; D’Apice, A.J.; Chong, A.S.; et al. Gut Microbiota Elicits a Protective Immune Response against Malaria Transmission. Cell 2014, 159, 1277–1289. [Google Scholar] [CrossRef] [Green Version]
- Galili, U.; Anaraki, F.; Thall, A.; Hill-Black, C.; Radic, M. One percent of human circulating B lymphocytes are capable of producing the natural anti-Gal antibody. Blood 1993, 82, 2485–2493. [Google Scholar] [CrossRef] [PubMed] [Green Version]
- Anraku, K.; Sato, S.; Jacob, N.; Eubanks, L.M.; Ellis, B.A.; Janda, K.D. The design and synthesis of an α-Gal trisaccharide epitope that provides a highly specific anti-Gal immune response. Org. Biomol. Chem. 2017, 15, 2979–2992. [Google Scholar] [CrossRef]
- Vaughan, H.A.; Loveland, B.E.; Sandrin, M.S. Gal alpha(1,3)Gal is the major xenoepitope expressed on pig endothelial cells recognized by naturally occurring cytotoxic human antibodies. Transplantation 1994, 58, 879–882. [Google Scholar] [CrossRef]
- Tanemura, M.; Maruyama, S.; Galil, I.U. Differential expression of alpha-GAL epitopes (Galalpha1-3Galbeta1-4GlcNAc-R) on pig and mouse organs. Transplantation 2000, 69, 187–190. [Google Scholar] [CrossRef]
- Spiro, R.G.; Bhoyroo, V.D. Occurrence of alpha-D-galactosyl residues in the thyroglobulins from several species. Localization in the saccharide chains of the complex carbohydrate units. J. Biol. Chem. 1984, 259, 9858–9866. [Google Scholar] [CrossRef]
- Tanemura, M.; Yin, D.; Chong, A.S.; Galili, U. Differential immune responses to alpha-Gal epitopes on xenografts and allografts // Differential immune responses to alpha-gal epitopes on xenografts and allografts: Implications for accommodation in xenotransplantation. J. Clin. Investig. 2000, 105, 301–310. [Google Scholar] [CrossRef] [PubMed] [Green Version]
- Naso, F.; Gandaglia, A.; Iop, L.; Spina, M.; Gerosa, G. Alpha-Gal detectors in xenotransplantation research: A word of caution. Xenotransplantation 2012, 19, 215–220. [Google Scholar] [CrossRef]
- Chung, C.H.; Mirakhur, B.; Chan, E.; Le, Q.-T.; Berlin, J.; Morse, M.; Murphy, B.A.; Satinover, S.M.; Hosen, J.; Mauro, D.; et al. Cetuximab-Induced Anaphylaxis and IgE Specific for Galactose-α-1,3-Galactose. N. Engl. J. Med. 2008, 358, 1109–1117. [Google Scholar] [CrossRef] [Green Version]
- Ebo, D.G.; Faber, M.; Sabato, V.; Leysen, J.; Gadisseur, A.; Bridts, C.H.; de Clerck, L.S. Sensitization to the mammalian oligosaccharide galactose-alpha-1,3-galactose (alpha-gal): Experience in a Flemish case series. Acta Clin. Belg. 2013, 68, 206–209. [Google Scholar] [CrossRef]
- Michel, S.; Scherer, K.; Heijnen, I.A.F.M.; Bircher, A.J. Skin prick test and basophil reactivity to cetuximab in patients with IgE to alpha-gal and allergy to red meat. Allergy 2013, 69, 403–405. [Google Scholar] [CrossRef]
- Berg, E.A.; Platts-Mills, T.A.; Commins, S.P. Drug allergens and food—the cetuximab and galactose-α-1,3-galactose story. Ann. Allergy. Asthma Immunol. 2014, 112, 97–101. [Google Scholar] [CrossRef] [PubMed] [Green Version]
- Platts-Mills, T.A.; Schuyler, A.J.; Tripathi, A.; Commins, S.P. Anaphylaxis to the Carbohydrate Side Chain Alpha-gal. Immunol. Allergy Clin. N. Am. 2015, 35, 247–260. [Google Scholar] [CrossRef] [PubMed] [Green Version]
- Jappe, U. “Update on meat allergy. alpha-Gal: A new epitope, a new entity?”. Der Hautarzt Zeitschrift Für Dermatologie Venerologie Und Verwandte Gebiete 2012, 63, 299–306. [Google Scholar] [CrossRef]
- Jappe, U.; Minge, S.; Kreft, B.; Ludwig, A.; Przybilla, B.; Walker, A.; Varga, R.; Seidel, P.; Biedermann, T.; Anemüller, W.; et al. Meat allergy associated with galactosyl-α-(1,3)-galactose (α-Gal)-Closing diagnostic gaps by anti-α-Gal IgE immune profiling. Allergy 2017, 73, 93–105. [Google Scholar] [CrossRef] [PubMed]
- Wolver, S.E.; Sun, D.R.; Commins, S.P.; Schwartz, L.B. A peculiar cause of anaphylaxis: No more steak? The journey to discovery of a newly recognized allergy to galactose-alpha-1,3-galactose found in mammalian meat. J. Gen. Intern. Med. 2013, 28, 322–325. [Google Scholar] [CrossRef] [PubMed] [Green Version]
- Flaherty, M.G.; Kaplan, S.J.; Jerath, M.R. Diagnosis of Life-Threatening Alpha-Gal Food Allergy Appears to Be Patient Driven. J. Prim. Care Community Health 2017, 8, 345–348. [Google Scholar] [CrossRef] [Green Version]
- Commins, S.P.; James, H.R.; Kelly, L.A.; Pochan, S.L.; Workman, L.J.; Perzanowski, M.S.; Kocan, K.M.; Fahy, J.V.; Nganga, L.W.; Ronmark, E.; et al. The relevance of tick bites to the production of IgE antibodies to the mammalian oligosaccharide galactose-α-1,3-galactose. J. Allergy Clin. Immunol. 2011, 127, 1286–1293.e6. [Google Scholar] [CrossRef] [Green Version]
- Hamsten, C.; Tran, T.A.T.; Starkhammar, M.; Brauner, A.; Commins, S.P.; Platts-Mills, T.A.; van Hage, M. Red meat allergy in Sweden: Association with tick sensitization and B-negative blood groups. J. Allergy Clin. Immunol. 2013, 132, 1431–1434.e6. [Google Scholar] [CrossRef] [Green Version]
- Arslan, L.G. Red meat allergy induced by tick bites: A Norwegian case report. Eur. Ann. Allergy Clin. Immunol. 2017, 49, 186–188. [Google Scholar] [CrossRef] [Green Version]
- Khoury, J.K.; Khoury, N.C.; Schaefer, D.; Chitnis, A.; Hassen, G.W. A tick-acquired red meat allergy: A case series. Am. J. Emerg. Med. 2017. [CrossRef]
- Mateos-Hernández, L.; Villar, M.; Moral, A.; Rodríguez, C.G.; Arias, T.A.; De La Osa, V.; Brito, F.F.; De Mera, I.G.F.; Alberdi, P.; Ruiz-Fons, F.; et al. Tick-host conflict: Immunoglobulin E antibodies to tick proteins in patients with anaphylaxis to tick bite. Oncotarget 2017, 8, 20630–20644. [Google Scholar] [CrossRef]
- Abdel-Motal, U.M.; Guay, H.M.; Wigglesworth, K.; Welsh, R.M.; Galili, U. Immunogenicity of Influenza Virus Vaccine Is Increased by Anti-Gal-Mediated Targeting to Antigen-Presenting Cells. J. Virol. 2007, 81, 9131–9141. [Google Scholar] [CrossRef] [Green Version]
- Varki, A.; Cummings, R.D.; Esko, J.D.; Freeze, H.; Stanley, P.; Marth, J.D.; Bertozzi, C.R.; Hart, G.; Etzler, M.E. Symbol nomenclature for glycan representation. Proteomics 2009, 9, 5398–5399. [Google Scholar] [CrossRef] [Green Version]
- Towbin, H.; Staehelin, T.; Gordon, J. Electrophoretic transfer of proteins from polyacrylamide gels to nitrocellulose sheets: Procedure and some applications. Proc. Natl. Acad. Sci. USA 1979, 76, 4350–4354. [Google Scholar] [CrossRef] [Green Version]
- Dunn, A.; Duffy, C.; Gordon, A.; Morrison, S.; Arguello, A.; Welsh, M.; Earley, B. Comparison of single radial immunodiffusion and ELISA for the quantification of immunoglobulin G in bovine colostrum, milk and calf sera. J. Appl. Anim. Res. 2018, 46, 758–765. [Google Scholar] [CrossRef] [Green Version]
- Chevallet, M.; Luche, S.; Rabilloud, T. Silver staining of proteins in polyacrylamide gels. Nat. Protoc. 2006, 1, 1852–1858. [Google Scholar] [CrossRef] [Green Version]
- Rieben, R.; Allmen, E.; Korchagina, E.Y.; Nydegger, U.E.; Neethling, F.A.; Kujundžić, M.; Koren, E.; Bovin, N.V.; Cooper, D.K. Detection, immunoabsorption, and inhibition of cytotoxic activity of anti-αGal antibodies using newly developed substances with synthetic Gal α1-3Gal disaccharide epitopes. Xenotransplantation 1995, 2, 98–106. [Google Scholar] [CrossRef]
- Obukhova, P.; Rieben, R.; Bovin, N. Normal human serum contains high levels of anti-Gal alpha 1-4GlcNAc antibodies. Xenotransplantation 2007, 14, 627–635. [Google Scholar] [CrossRef]
- Yu, P.; Holzknecht, E.Z.; Bruno, D.; Parker, W.; Platt, J.L. Modulation of natural IgM binding and complement activation by natural IgG antibodies: A role for IgG anti-Gal alpha1-3Gal antibodies. J. Immunol. 1996, 157, 5163–5168. [Google Scholar] [PubMed]
- Tomlinson, S.; Nussenzweig, V. Human alternative complement pathway-mediated lysis of rabbit erythrocytes is enhanced by natural anti-Galalpha1-3Gal antibodies. J. Immunol. 1997, 159, 5606–5609. [Google Scholar]
- Rispens, T.; Derksen, N.I.L.; Commins, S.P.; Platts-Mills, T.A.; Aalberse, R.C. IgE Production to α-Gal Is Accompanied by Elevated Levels of Specific IgG1 Antibodies and Low Amounts of IgE to Blood Group, B. PLoS ONE 2013, 8, e55566. [Google Scholar] [CrossRef] [PubMed]
- Vidarsson, G.; Dekkers, G.; Rispens, T. IgG Subclasses and Allotypes: From Structure to Effector Functions. Front. Immunol. 2014, 5, 520. [Google Scholar] [CrossRef] [PubMed] [Green Version]
- Germann, T.; Bongartz, M.; Dlugonska, H.; Hess, H.; Schmitt, E.; Kolbe, L.; Kölsch, E.; Podlaski, F.J.; Gately, M.K.; Rüde, E. Interleukin-12 profoundly up-regulates the synthesis of antigen-specific complement-fixing IgG2a, IgG2b and IgG3 antibody subclasses in vivo. Eur. J. Immunol. 1995, 25, 823–829. [Google Scholar] [CrossRef] [PubMed]
- Yue, S.C.; Shaulov, A.; Wang, R.; Balk, S.P.; Exley, M.A. CD1d ligation on human monocytes directly signals rapid NF-kappaB activation and production of bioactive IL-12. Proc. Natl. Acad. Sci. USA 2005, 102, 11811–11816. [Google Scholar] [CrossRef] [PubMed] [Green Version]
- Liu, S.; Kandeva, T.; Tchervenkov, J. CD1d-Mediated Interaction Between Activated T Cells and B Cells Is Essential to B-Cell Proliferation and Anti-α-Gal Antibody Production. Transplant. Proc. 2009, 41, 398–402. [Google Scholar] [CrossRef] [PubMed]
- He, J.-S.; Subramaniam, S.; Narang, V.; Srinivasan, K.; Saunders, S.P.; Carbajo, D.; Wen-Shan, T.; Hamadee, N.H.; Lum, J.; Lee, A.; et al. IgG1 memory B cells keep the memory of IgE responses. Nat. Commun. 2017, 8, 641. [Google Scholar] [CrossRef] [Green Version]
- Choi, Y.; Lee, S.; Kwon, S.Y.; Lee, Y.; Park, Y.K.; Ban, S.J. Analysis of the proficiency of single radial immunodiffusion assays for quality control of influenza vaccines in Korea. Biologicals. 2017, 50, 137–140. [Google Scholar] [CrossRef] [PubMed]
- Williamson, A.R. Antibody isoelectric spectra. Analysis of the heterogeneity of antibody molecules in serum by isoelectric focusing in gel and specific detection with hapten. Eur. J. Immunol. 1971, 1, 390–394. [Google Scholar] [CrossRef] [PubMed]
- Prin, C.; Bene, M.C.; Gobert, B.; Montagne, P.; Faure, G.C. Isoelectric restriction of human immunoglobulin isotypes. Biochim. Biophys. Acta (BBA) Gen. Subj. 1995, 1243, 287–289. [Google Scholar] [CrossRef]
- Milland, J.; Yuriev, E.; Xing, P.-X.; McKenzie, I.F.C.; Ramsland, P.A.; Sandrin, M.S. Carbohydrate residues downstream of the terminal Galα(1,3)Gal epitope modulate the specificity of xenoreactive antibodies. Immunol. Cell Biol. 2007, 85, 623–632. [Google Scholar] [CrossRef]
- Galili, U.; LaTemple, D.C.; Radic, M.Z. A sensitive assay for measuring α-gal epitope expression on cells by a monoclonal anti-gal antibody1. Transplantation 1998, 65, 1129–1132. [Google Scholar] [CrossRef]
- Cabezas-Cruz, A.; de la Fuente, J. Immunity to α-Gal: Toward a Single-Antigen Pan-Vaccine To Control Major Infectious Diseases. ACS Cent. Sci. 2017, 3, 1140–1142. [Google Scholar] [CrossRef]
- Brestoff, J.R.; Tesfazghi, M.T.; Zaydman, M.A.; Jackups, R.; Kim, B.S.; Scott, M.G.; Gronowski, A.M.; Grossman, B.J. The B antigen protects against the development of red meat allergy. J. Allergy Clin. Immunol. Pract. 2018, 6, 1790–1791. [Google Scholar] [CrossRef] [PubMed]
- Galili, U.; Swanson, K. Gene sequences suggest inactivation of alpha-1,3-galactosyltransferase in catarrhines after the divergence of apes from monkeys. Proc. Natl. Acad. Sci. USA 1991, 88, 7401–7404. [Google Scholar] [CrossRef] [Green Version]
- Galili, U. Significance of the Evolutionary α1,3-Galactosyltransferase (GGTA1) Gene Inactivation in Preventing Extinction of Apes and Old World Monkeys. J. Mol. Evol. 2014, 80, 1–9. [Google Scholar] [CrossRef]
- Plum, M.; Michel, Y.; Wallach, K.; Raiber, T.; Blank, S.; Bantleon, F.I.; Diethers, A.; Greunke, K.; Braren, I.; Hackl, T.; et al. Close-up of the Immunogenic α1,3-Galactose Epitope as Defined by a Monoclonal Chimeric Immunoglobulin E and Human Serum Using Saturation Transfer Difference (STD) NMR. J. Biol. Chem. 2011, 286, 43103–43111. [Google Scholar] [CrossRef] [PubMed] [Green Version]
- Pourazar, A. Red cell antigens: Structure and function. Asian J. Transfus. Sci. 2007, 1, 24–32. [Google Scholar] [CrossRef]
- Müller-Loennies, S.; MacKenzie, C.; Patenaude, S.I.; Evans, S.; Kosma, P.; Brade, H.; Brade, L.; Narang, S. Characterization of high affinity monoclonal antibodies specific for chlamydial lipopolysaccharide. Glycobiology 2000, 10, 121–130. [Google Scholar] [CrossRef] [PubMed] [Green Version]
- Rispens, T.; Heer, P.O.-D.; Derksen, N.I.; Wolbink, G.; Van Schouwenburg, P.A.; Kruithof, S.; Aalberse, R.C. Nanomolar to sub-picomolar affinity measurements of antibody–antigen interactions and protein multimerizations: Fluorescence-assisted high-performance liquid chromatography. Anal. Biochem. 2013, 437, 118–122. [Google Scholar] [CrossRef]
- Sharma, R.K. Generation of Recombinant Anti-N-Glycolylneuraminic Acid (Neu5Gc) Scfv and Its Applications for Detection and Quantitation of Neu5Gc. Ph.D. Thesis, National University of Ireland, Galway, Ireland, 2016. [Google Scholar]
- Galili, U.; Basbaum, C.; Shohet, S.; Buehler, J.; Macher, B. Identification of erythrocyte Gal alpha 1-3Gal glycosphingolipids with a mouse monoclonal antibody, Gal-13. J. Biol. Chem. 1987, 262, 4683–4688. [Google Scholar] [CrossRef]
- Gao, H.-W.; Li, S.-B.; Sun, W.Q.; Yun, Z.-M.; Zhang, X.; Song, J.-W.; Zhang, S.-K.; Leng, L.; Ji, S.-P.; Tan, Y.-X.; et al. Quantification of α-Gal Antigen Removal in the Porcine Dermal Tissue by α-Galactosidase. Tissue Eng. Part C Methods 2015, 21, 1197–1204. [Google Scholar] [CrossRef]
- Buehler, J.; Galili, U.; Macher, B.A. Use of the enzyme-linked immunoadsorbent assay to monitor the purification of glycosphingolipid antigens by high-performance liquid chromatography. Anal. Biochem. 1987, 164, 521–525. [Google Scholar] [CrossRef]
- Zheng, K.; Bantog, C.; Bayer, R. The impact of glycosylation on monoclonal antibody conformation and stability. mAbs 2011, 3, 568–576. [Google Scholar] [CrossRef] [PubMed] [Green Version]
- Higel, F.; Seidl, A.; Sörgel, F.; Friess, W. N-glycosylation heterogeneity and the influence on structure, function and pharmacokinetics of monoclonal antibodies and Fc fusion proteins. Eur. J. Pharm. Biopharm. 2016, 100, 94–100. [Google Scholar] [CrossRef] [PubMed] [Green Version]
- Li, T.; DiLillo, D.J.; Bournazos, S.; Giddens, J.; Ravetch, J.V.; Wang, L.-X. Modulating IgG effector function by Fc glycan engineering. Proc. Natl. Acad. Sci. USA 2017, 114, 3485–3490. [Google Scholar] [CrossRef] [Green Version]
- Zhang, P.; Woen, S.; Wang, T.; Liau, B.; Zhao, S.; Chen, C.; Yang, Y.; Song, Z.; Wormald, M.R.; Yu, C.; et al. Challenges of glycosylation analysis and control: An integrated approach to producing optimal and consistent therapeutic drugs. Drug Discov. Today 2016, 21, 740–765. [Google Scholar] [CrossRef] [PubMed] [Green Version]
- Sakae, Y.; Satoh, T.; Yagi, H.; Yanaka, S.; Yamaguchi, T.; Isoda, Y.; Iida, S.; Okamoto, Y.; Kato, K. Conformational effects of N-glycan core fucosylation of immunoglobulin G Fc region on its interaction with Fc\gamma receptor IIIa. Sci. Rep. 2017, 7, 13780. [Google Scholar] [CrossRef] [Green Version]
- Cymer, F.; Beck, H.; Rohde, A.; Reusch, D. Therapeutic monoclonal antibody N-glycosylation–Structure, function and therapeutic potential. Biologicals 2018, 52, 1–11. [Google Scholar] [CrossRef]
- Apostolovic, D.; Krstic, M.; Mihailovic, J.; Starkhammar, M.; Cirkovic, V.T.; Hamsten, C.; van Hage, M. Peptidomics of an in vitro digested \alpha-Gal carrying protein revealed IgE-reactive peptides. Sci. Rep. 2017, 7, 5201. [Google Scholar] [CrossRef]
- Qian, J.; Liu, T.; Yang, L.; Daus, A.; Crowley, R.; Zhou, Q. Structural characterization of N-linked oligosaccharides on monoclonal antibody cetuximab by the combination of orthogonal matrix-assisted laser desorption/ionization hybrid quadrupole–quadrupole time-of-flight tandem mass spectrometry and sequential enzymatic digestion. Anal. Biochem. 2007, 364, 8–18. [Google Scholar] [CrossRef] [PubMed]
- Dalpathado, D.S.; Desaire, H. Glycopeptide analysis by mass spectrometry. Analyst 2008, 133, 731–738. [Google Scholar] [CrossRef]
- Cao, L.; Qu, Y.; Zhang, Z.; Wang, Z.; Prytkova, I.; Wu, S. Intact glycopeptide characterization using mass spectrometry. Expert Rev. Proteom. 2016, 13, 513–522. [Google Scholar] [CrossRef] [PubMed] [Green Version]
- Huang, Y. New Approaches for Quantitative Analysis of Glycopeptides Using Liquid Chromatography-Mass Spectrometry. Ph.D. Thesis, University of Georgia, Athens, Greece, 2016. [Google Scholar]
- Lalonde, M.-E.; Durocher, Y. Therapeutic glycoprotein production in mammalian cells. J. Biotechnol. 2017, 251, 128–140. [Google Scholar] [CrossRef] [PubMed]
Figure 1.
Exemplary chromatogram of the affinity purification of anti-Gal antibodies. Three samples of human IgG concentrate were applied to the affinity matrix (Galα1,3-Galβ1,4-GlcNAc-exposed sepharose). The absorption was monitored at 214 nm. Elution of bound antibodies was carried out by 500 mM Gal.

Figure 2.
SDS–PAGE analysis of eluted anti-α-Gal antibodies to examine potential contamination with other proteins. A Tris-glycine gradient gel (8–16%) was loaded with Octagam® (1), unbound antibody (2), Gal-eluted antibody (3), and wash fraction (4) in reducing sample buffer. The gel was stained with Coomassie brilliant blue. The loaded amount of each sample was 2 µg.

Figure 3.
Two-dimensional gelelectrophoresis analysis of purified anti α Gal antibodies. Proteins were separated by isoelectric focusing, followed by SDS–PAGE (8–16% gradient gel) and silver staining.
Figure 3.
Two-dimensional gelelectrophoresis analysis of purified anti α Gal antibodies. Proteins were separated by isoelectric focusing, followed by SDS–PAGE (8–16% gradient gel) and silver staining.

Figure 4.
ELISA assay of anti-α-Gal antibody binding to different commercial glycoconjugates serving as ligands in ELISA. Data of Gal-eluted anti-α-Gal antibodies are shown as red bars. Each eluate was applied in the indicated four different concentrations. Data are presented as means +/− SEM, n = 3.

Figure 5.
Agglutination of rabbit and human red blood cells to analyze the anti α Gal specificity toward the α Gal epitope. Agglutinations were carried out as duplicates. Different dilutions (10 to 1280) of antibody solution (1 mg/mL) were applied to a round-bottom well plate and incubated with human or rabbit erythrocytes. Agglutination takes place when a cross-linking between antibodies and erythrocytes becomes visible as a milky surface. The formation of a clot shows no agglutination. (A) Anti-blood group A antibody was applied on human red blood cells prepared from human plasma of an adult with blood group A as a positive control. (B) Anti-α-Gal antibody was applied on human red blood cells. The cells did not show any agglutination. (C) Anti-α-Gal antibody was applied on rabbit erythrocytes. The cells showed agglutination up to an antibody dilution factor of 80. Erythrocytes without additions were used as a negative control.

Figure 6.
Anti-Gal antibody inhibition assay. A purified anti-Gal antibody was incubated with different excesses of trisaccharide (GlcNAc-β1,4-Gal-α1,3-Gal) or disaccharide (Gal-α1,3-Gal). Preincubated antibodies were subsequently incubated with immobilized BSA-α-Gal in a well-plate. Data are presented as means +/− SEM, n = 3.

Figure 7.
N-glycan profile of anti-α-Gal antibodies. PNGase F-released N-glycans were separated via hydrophilic interaction liquid chromatography. Peak identification was achieved by independent Q-TOF mass spectrometry. A schematic N-glycan representation is given for signals with a relative peak area >2% only. Evaluations were carried out using the Waters UNIFI 1.9.2 software.

Figure 8.
(A) Western blot analysis of glycoproteins, developed by HRP-coupled anti-α-Gal antibodies. BSA (negative control), bovine thyroglobulin, BSA-α-Gal, and cetuximab (1 µg each) were separated on an 8–16% gradient gel and blotted. Previous digestions by α1,3 galactosidase and IdeZ-protease are indicated (- undigested, + digested); (B) Western blot analysis of cetuximab developed by anti-α Gal-HRP conjugate (1:4000).


Table 1.
Determination of IgG subclasses using RID plates. Measured diameters of calibrators and anti-α-Gal samples were squared and summarized with appropriately calculated concentrations. The relative proportions of IgG subclasses were determined by normalizing the calculated IgG concentrations. IgG3 and IgG4 were not detected (n.d.).
| Subclass | Calibrator Concentration [µg/mL] | Squared Diameter [cm2] | Sample Concentration [µg/mL] | Relative Part [%] | |
|---|---|---|---|---|---|
| Calibrator | Sample | ||||
| IgG1 | 1400 | 0.81 | 0.36 ± 0.06 | 492 ± 111 | 24 ± 6 |
| 840 | 0.64 | ||||
| 350 | 0.25 | ||||
| 140 | 0.16 | ||||
| IgG2 | 800 | 0.64 | 0.55 ± 0.05 | 1422 ± 137 | 76 ± 7 |
| 480 | 0.36 | ||||
| 200 | 0.16 | ||||
| 80 | 0.09 | ||||
| IgG3 | - | - | n.d. | - | - |
| IgG4 | - | - | n.d. | - | - |
Publisher’s Note: MDPI stays neutral with regard to jurisdictional claims in published maps and institutional affiliations. |
© 2021 by the authors. Licensee MDPI, Basel, Switzerland. This article is an open access article distributed under the terms and conditions of the Creative Commons Attribution (CC BY) license (https://creativecommons.org/licenses/by/4.0/).
Share and Cite
MDPI and ACS Style
Zappe, A.; Rosenlöcher, J.; Kohla, G.; Hinderlich, S.; Parr, M.K. Purification and Characterization of Antibodies Directed against the α-Gal Epitope. BioChem 2021, 1, 81-97. https://0-doi-org.brum.beds.ac.uk/10.3390/biochem1020008
AMA Style
Zappe A, Rosenlöcher J, Kohla G, Hinderlich S, Parr MK. Purification and Characterization of Antibodies Directed against the α-Gal Epitope. BioChem. 2021; 1(2):81-97. https://0-doi-org.brum.beds.ac.uk/10.3390/biochem1020008
Chicago/Turabian StyleZappe, Andreas, Julia Rosenlöcher, Guido Kohla, Stephan Hinderlich, and Maria Kristina Parr. 2021. "Purification and Characterization of Antibodies Directed against the α-Gal Epitope" BioChem 1, no. 2: 81-97. https://0-doi-org.brum.beds.ac.uk/10.3390/biochem1020008