1. Introduction
The low-temperature heat capacity measurements are required for understanding the phase transformations and construction of low-temperature regions of the equilibrium pressure—temperature (p-T) phase diagrams of elements and compounds, especially those important for mineralogy and explorative materials science (e.g., search for new materials under high pressure). At the same time, there are a number of problems that arise during the heat capacity measurements for analysis of equilibria at low temperatures and high pressures, such as
- (1)
the direct (adiabatic) measurements at ambient pressure are time-consuming, costly and most importantly require a significant amount of pure compound (typically hundreds of µg), which makes explorative studies and study of phases recovered from very high pressures difficult (the pressure achievable in the laboratory is inversely proportional to the reaction volume);
- (2)
the results of typical Physical Property Measurement System (PPMS) measurements are limited in temperature (~350 K) and can be influenced by systematic errors due to either poor thermal contact between the sample and the heater-thermometry platform; and/or between the grains in a polycrystalline sample (porosity, bad sintering, reduced inter-grain contacts, etc.);
- (3)
systematic errors can also arise due to the water present in two forms—(i) bound into crystal structure during the sample synthesis and (ii) absorbed from air due to the porosity of the sample;
- (4)
low thermal stability of some high-pressure phases (such as rs-ZnO) can limit possible measurements to low temperatures, while the data of interest may lay at much higher temperatures, so the reliable extrapolation procedures are required; and finally,
- (5)
heat capacity data collection at high pressure remains rather exotic, very time-consuming, available in arbitrary units and accessible only in a very narrow p-T domain.
Usually, the construction of the phase diagrams at high enough temperatures (subject to the material and the pressure) is not considered be of importance once the reversible transitions between phases are observed. However, in some cases, even at high temperature, the crystallization of a new allotrope/polymorph is not reversible and, moreover, may occur outside the domain of thermodynamic stability (e.g., in the case of boron [
1] or boron oxide [
2]). The fundamental question of low-temperature stability can be hardly resolved without reliable low-temperature heat capacity data. Thus, the convincing thermodynamic analysis of materials at extended
p-T regions of the phase diagram is hardly possible without low-temperature data on
Cp at ambient pressure and without the methods of its extrapolation to high temperatures and high pressures.
Zinc oxide ZnO is a functional material that can be used both in industrial applications and for basic research in common w-ZnO form [
3], as well as in high-pressure rs-ZnO form that is a material of interest for bright blue luminescence [
4]. rs-ZnO can be recovered at ambient conditions as individual (nanostructured) phase, up to the volume of ~100 mm
3 per individual high-pressure synthesis experiment [
4,
5]. The recovery of such a substantial sample volume allowed conducting the measurements of a wide range of physical properties—previously unavailable—such as, for example, the standard enthalpy of the w-ZnO-to-rs-ZnO phase transformation Δ
H(298.15 K) = 11.7 ± 0.3 kJ mol
−1 [
6]. At the same time, the reported data should be taken with precaution, since the bulk samples with micro-sized grains are available only for w-ZnO. Recent advances in the diverse synthetic routes of rs-ZnO materials [
4] allowed us to obtain samples of chemical purity for reliable measurements of the heat capacities of both polymorphs for consistent side-by-side comparison.
Here, we report low-temperature heat capacities for both nanostructured ZnO polymorphs, consistent with observable phase transformation between polymorphs at high temperature (when pressure hysteresis between direct and inverse transformations becomes negligible). We established that the nanostructured samples contain the absorbed water (problem (3) of the list above), which is the major source of measurement errors that can be quite significant and should be considered when physical property measurements are conducted. Accounting for the exact amount of absorbed water (by using thermal gravimetric analysis) allowed us to obtain the accurate estimate of heat capacities and to evaluate the equilibrium pressure between w-ZnO and rs-ZnO polymorphs at high pressure and room temperature. No significant impact of nanostructuring on heat capacity has been observed for w-ZnO.
2. Experimental Section
The rs-ZnO sample purity was of primary concern for our work. In fact, rs-ZnO can be recovered at ambient conditions only when nanopowders of w-ZnO are used as precursors [
4]. Preparation of starting w-ZnO nanopowders by methods of solution chemistry [
4] does not allow synthesis of ZnO nanoparticles free of surface chemical groups that can strongly impact the heat capacity measurements and subsequent free energy calculations. Milling techniques also does not allow obtaining the samples of high crystal perfection for measurements of sufficient thermodynamic quality. To avoid any organic or inorganic impurity—except small amount of absorbed water—we synthesized w-ZnO nanopowder “precursor” by thermal decomposition of zinc peroxide ZnO
2 (Prolabo, 70% of Zn in the form of ZnO
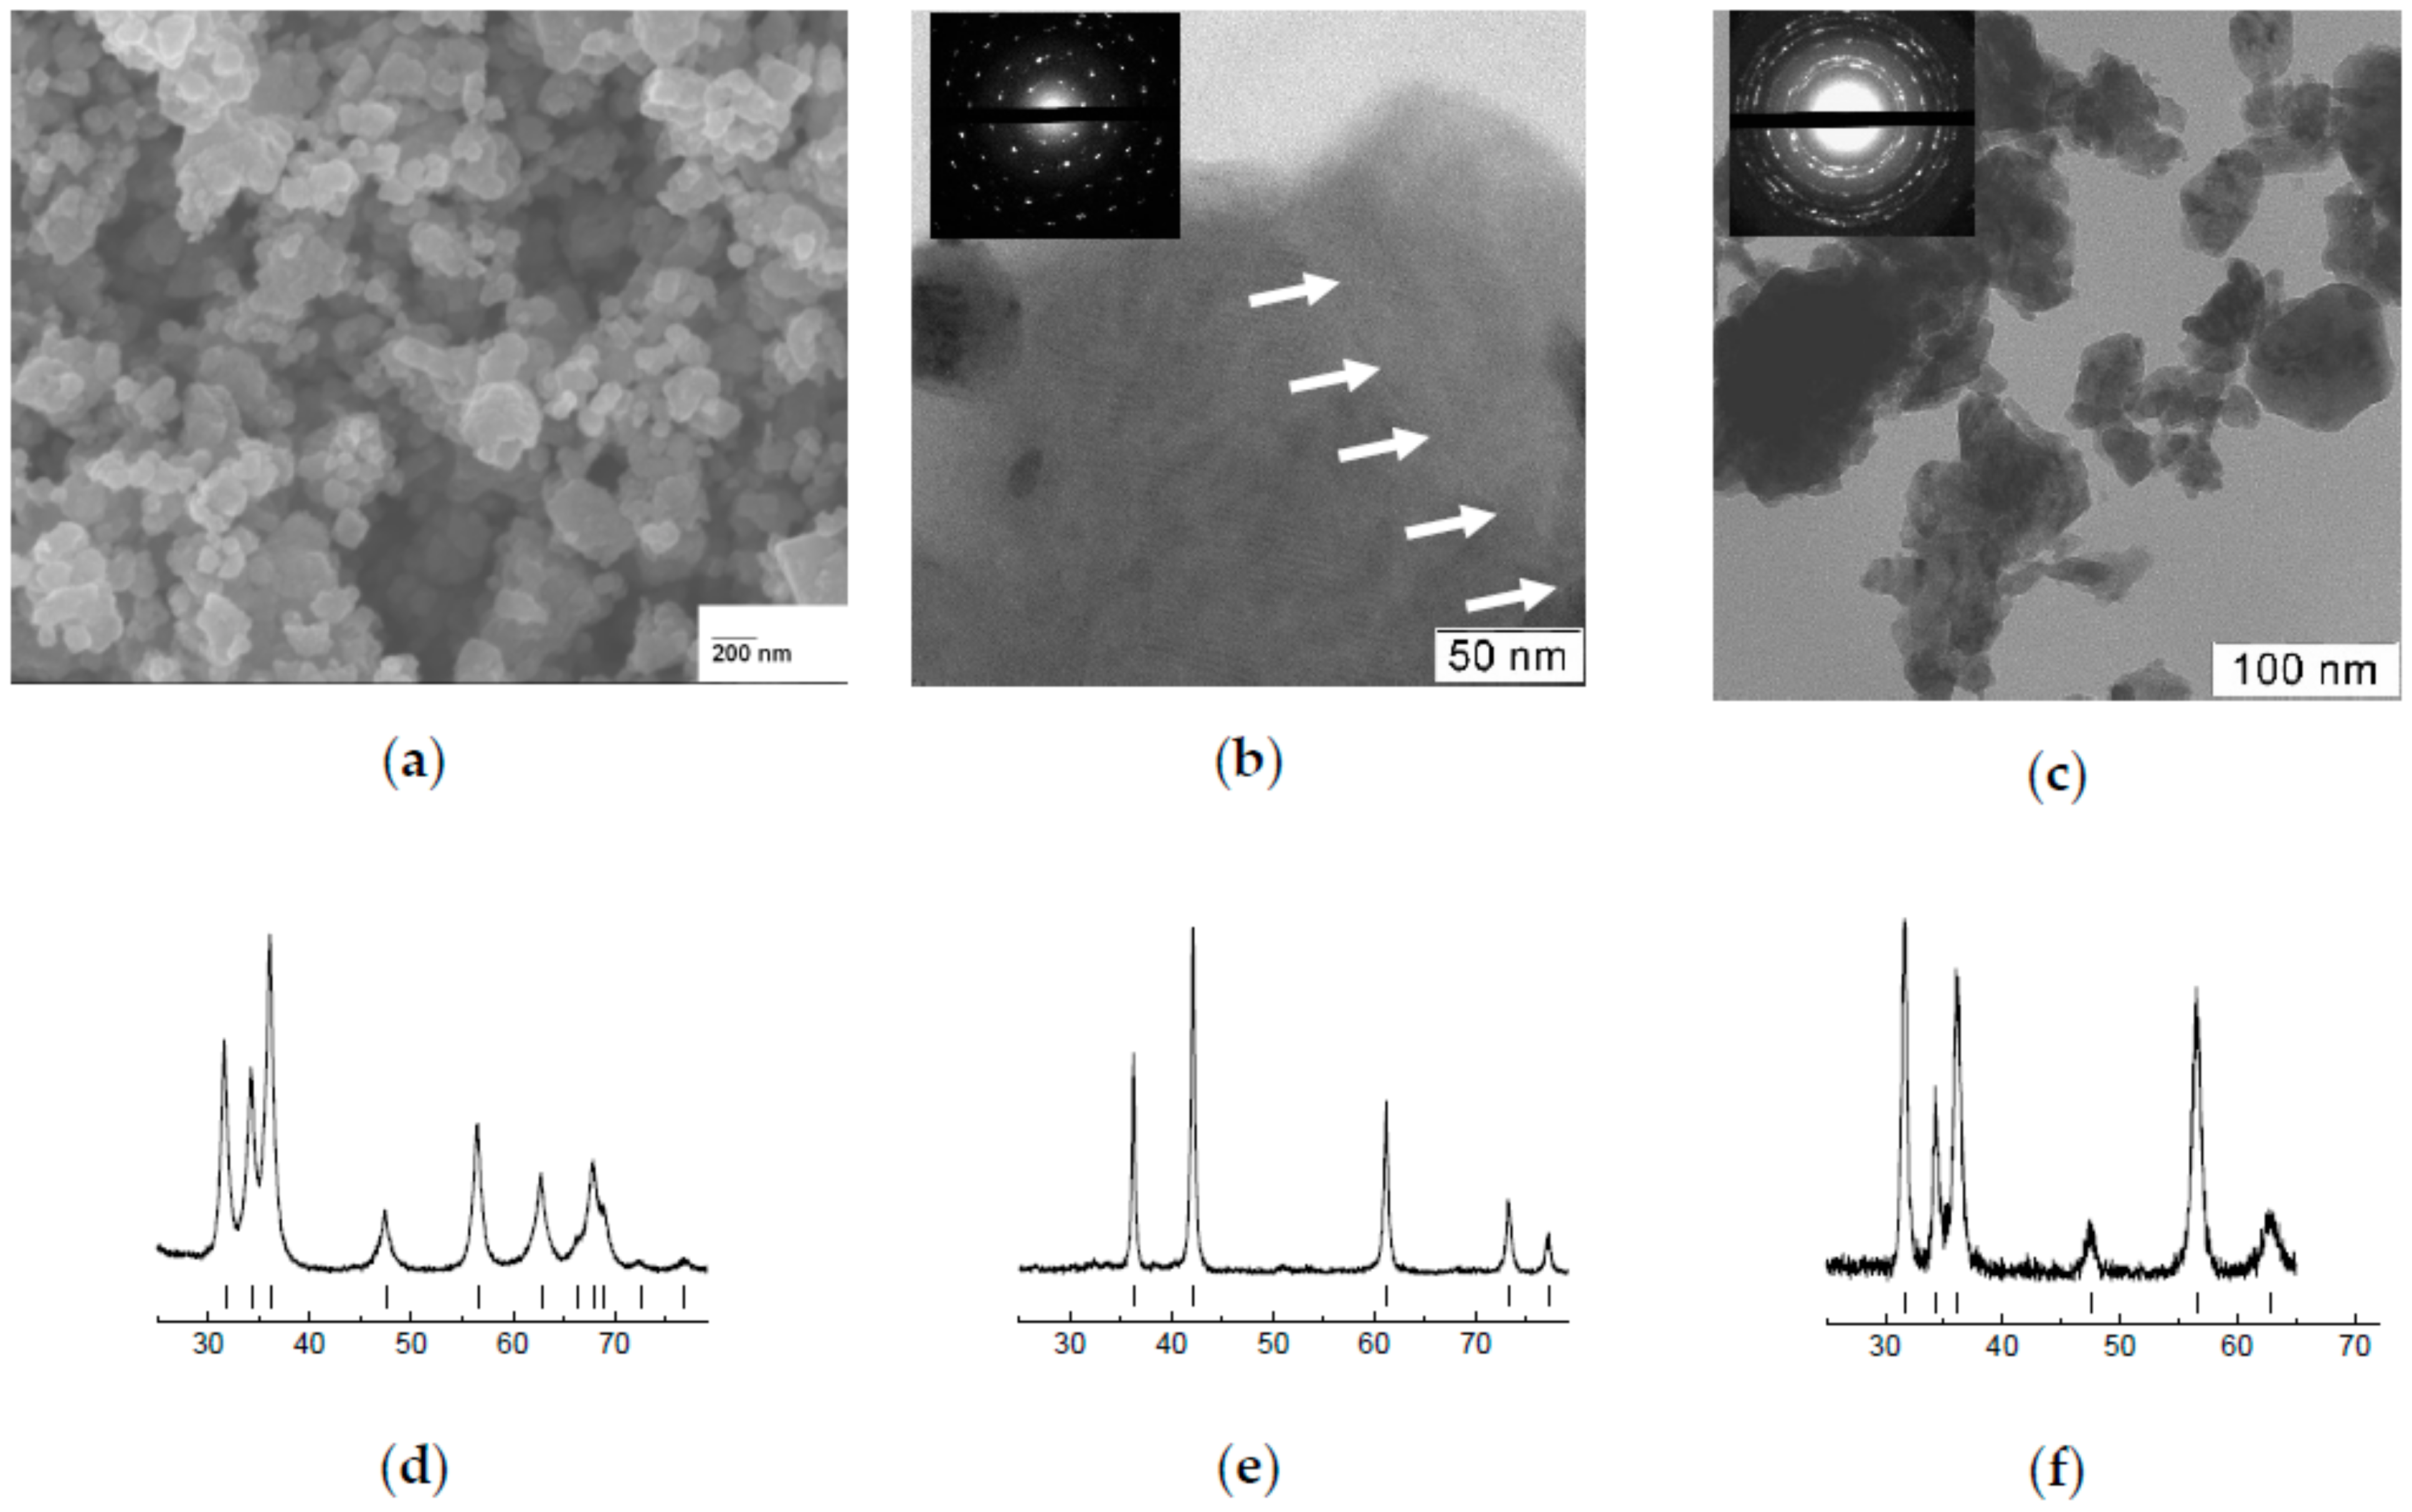
2) in a muffle furnace in air at 570 K (120 min.). Νanoparticles with grain size of 10–50 nm can be clearly seen on the SEM image (
Figure 1a). The X-ray diffraction pattern of the initial w-ZnO powder shows lines broadening due to nanocrystallinity (
Figure 1d). No diffraction peaks from ZnO
2 or other crystalline impurities were detected.
Single-phase nanocrystalline bulk (pellet ~1 mm thickness and 4.5 mm in diameter) rs-ZnO has been synthesized from w-ZnO nanopowder (grain size of ~9 nm) at 7.7 GPa & 800 K and subsequent rapid quenching (
Figure 1b,e). The details of high-pressure synthesis and characterization of the recovered samples are described earlier [
4,
5,
7]. Nanocrystalline bulk w-ZnO obtained by reverse (from rs-ZnO to w-ZnO) phase transformation was used as reference sample (
Figure 1c,f). This eliminates the potential influence of grain size and possible surface contribution to the heat capacity. The X-ray powder diffraction patterns taken before and after the calorimetric measurement confirmed that the samples were single-phases without any impurity. As one can see on the upper right part of the photo (
Figure 1b) between rs-ZnO nanograins exist intergrain boundaries that could contain water molecules absorbed on the w-ZnO surface before the high-pressure synthesis. As follows from [
4], this water probably plays the role of “glue” and helps to stabilize metastable rock salt phase at ambient pressure. Elimination of these water molecules will inevitably lead to reverse transformation to wurtzite phase.
w-ZnO samples for Cp measurements were obtained via reverse phase transformation of the corresponding rs-ZnO bulks by linear heating (5 or 10 K/min) at controlled conditions in a DSC-131 evo scanning calorimeter (SETARAM Instrumentation).
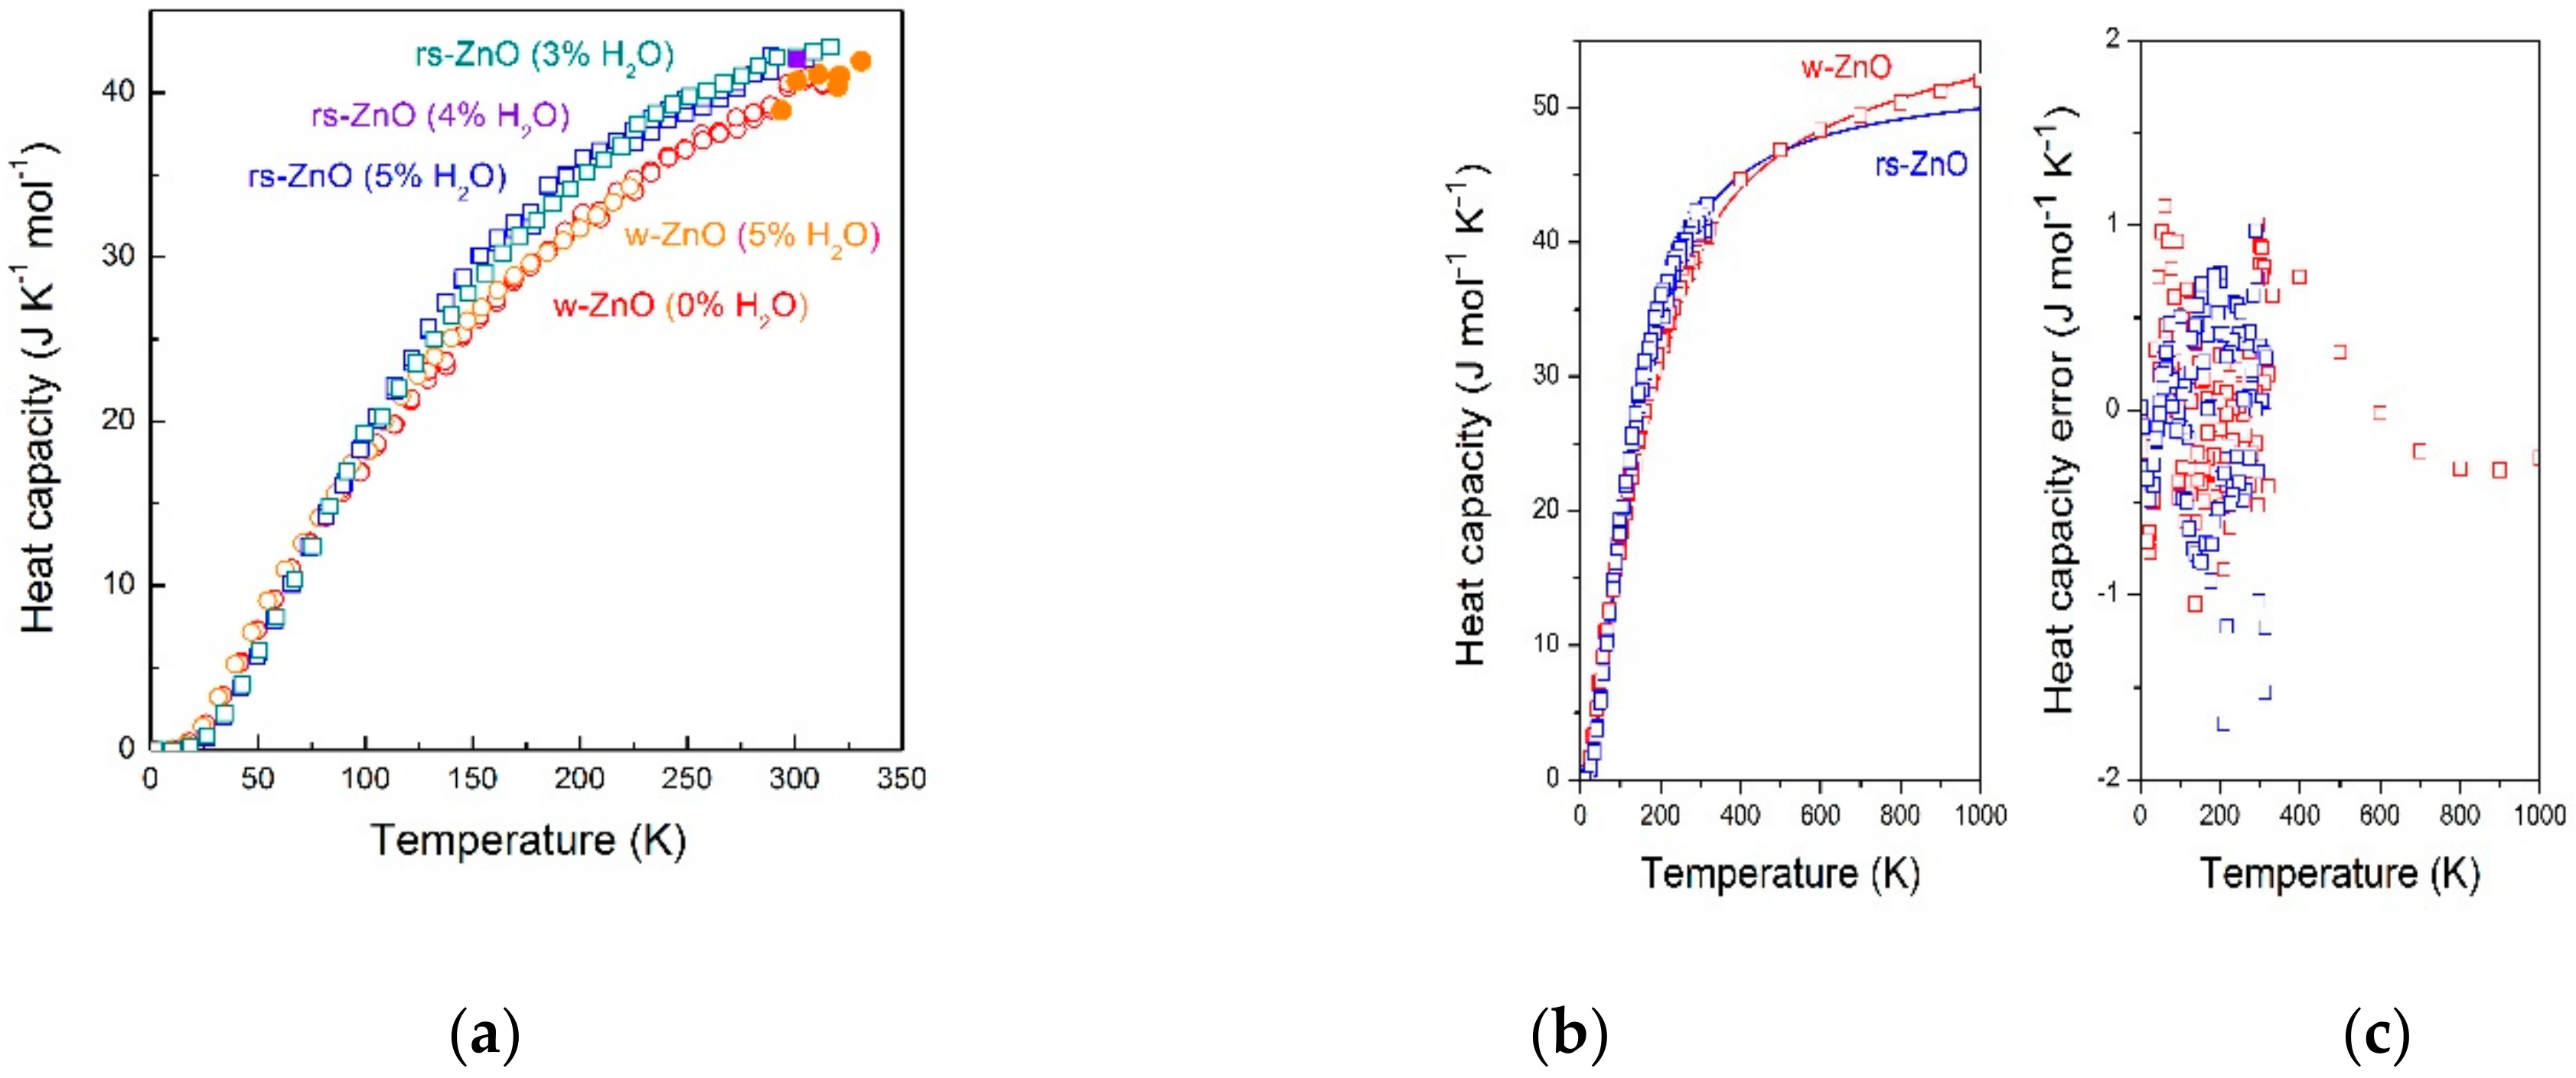
Heat capacity of rs-ZnO and w-ZnO bulk samples was measured between 310 and 2 K (
Figure 2a, open symbols) using calibrated heater-thermometer platforms in Physical Property Measurement System apparatus by Quantum Design. Data at 40 different temperature points (two measurements per point) have been collected at constant helium pressure (35–60 × 10
−2 Pa) and in constant magnetic field (0.187 Oe) (
Figure 2a). Before measurements, one side of each ZnO ingot was polished into a flat surface. Most of the measurements were performed on two cubic-shaped samples with 4.90 mg (rs-ZnO) and 13.80 mg (w-ZnO) weight. The ZnO molar weight of 81.38 g/mole was used to molar
Cp calculation according to the 2011 IUPAC recommendation [
8]. Recently, it has been shown that PPMS can precisely measure the low-temperature
Cp for samples of milligram size [
9]. Thus, the low-temperature
Cp measurements of high-pressure phases, which were almost impossible to achieve previously, can now be carried out using this technique. The accuracy of
Cp measurement in our experiments was estimated to be better than 1% between 4.2 K and 315 K, and 4% at temperatures below 4.2 K.
Heat capacity measurements in the 294–331 K range (
Figure 2a, solid symbols) were performed by heat flux calorimetry using micro DSC-7 evo Calvet calorimeter (SETARAM Instrumentation). Dynamic calibration for heat generation was carried out by the Joule effect using a E.J.3 calibration unit. Temperature calibration of the instrument was performed with standard substances (gallium, indium, etc.) according to the IUPAC recommendations. Calisto program package (v 1.086, AKTS AG) was applied for running the experiment, data collection and initial data processing. Stepwise heating mode was used as recommended for precise thermodynamic measurements [
10]. The accuracy of
Cp measurements was estimated to be better than 0.25%.
Thermogravimetry measurements (Labsys evo TG/DSC thermal analyzer, SETARAM Instrumentation) were used for evaluation of the amount of absorbed water in the samples. Typically, the H
2O loss was in the range of 2–4 wt%. These values can be considered as an underestimate, while the heat capacity contribution shows the water amount of ~5 wt% (this value should be taken with precaution since
Cp of absorbed water is higher than that of bulk water [
11]). The correction to heat capacity has been made using the reference data for water in the 2–273 K and 273–310 K temperature ranges [
12]:
3. Results & Discussion
rs-ZnO samples available at ambient pressure are always nanostructured, and can survive only at quite moderate temperatures. Previous reports suggest possible impact of nanostructuring on ZnO heat capacity values. Our experiments, however, indicate that to the accuracy of the measurements, no difference between nanostructured w-ZnO (obtained by reverse transformation of rs-ZnO upon heating) and bulk w-ZnO is observed. At the same time, samples exposed to air may show higher heat capacity, if absorbed water correction is not made. Typically, 3–5 wt% of water was found as the equilibrium value for nano-rs-ZnO, and both nano-and micro-w-ZnO. Corrected values for rs-ZnO and w-ZnO are shown in
Figure 2a. No distinction between nano- and micro-samples will be made in the following discussion.
The experimental values of the heat capacity for w-ZnO and rs-ZnO nanostructured samples (
Figure 2b) were fitted to the adaptive pseudo-Debye model proposed by Holtzapfel (explicitly formulated in [
13]) that gives the analytical expression for
Cp as
where
τ =
T/
θh;
θh is Debye temperature in the high-temperature region;
C1,
C2 and
A are parameters to be fitted;
C3 = 1;
a characterizes non-harmonicity;
R is gas constant. Parameter
C0 has been chosen as
C0 = (5
θl3)/(π
4 θh3), with
θl and
θh Debye temperatures in the low- and high-temperature regions, respectively, in order to obtain these values directly as fitting parameters.
The fitting of the experimental data to Equation (1) was performed using the simplex method using the MATLAB software. The uniqueness and stability of the solution (i.e., a set of above-mentioned parameters determining theoretical curve) of inverse problem have been tested by multiple minimization procedures from various sets of starting parameters. To improve the solution quality and obtain the parameters allowing high-temperature extrapolation, we added the available data on Cp of w-ZnO up to 1250 K, which allowed obtaining the reliable values of θh, A and a. It was possible to exclude the mutual compensation of fitting parameters only in the case of w-ZnO: the number and quality of the initial data combined with the a value constrained to be positive and with taking into account the additional high-temperature data. In order to avoid occasional non-physical solutions for rs-ZnO, we used the w-ZnO parameters as the initial approximation. For both phases, non-harmonicity parameter a was found to be zero.
The fitting gave the following sets of parameters:
(1) for w-ZnO: θh = 256 K, θl = 132 K, C0 = 0.0070, C1 = 0.4490, C2 = 0.9942, A = 0.0208, a = 0;
and
(2) for rs-ZnO: θh = 226 K, θl = 335 K, C0 = 0.1663, C1 = 0.3864, C2 = 0.9755, A = 0.0055, a = 0.
One can see that the high-temperature limits of Debye temperature
θD are close, while the low-temperature values are in agreement with the general rule that the higher density corresponds to higher Debye temperature. At the same time, our
θ-values are noticeably lower than the previously reported Debye temperatures (~400 K) for w-ZnO [
14]. Such discrepancy can be explained, from one side, by nanostructuring of our samples, and, from the other side, by the experimental errors that allow treating the
θl values as fitting parameters. Only rigorous study of fully water-free samples could reveal whether nanostructuring impacts Debye temperature or not.
In the case of the nanostructured w-ZnO obtained by reverse transformation from rs-ZnO at 523 K, the heat capacity is quasi-indistinguishable from the large-grain samples. This is indicative of essentially zero surface entropy of our nano-w-ZnO, similar to previous observations for nano-w-ZnO obtained by chemical decomposition of zinc nitrate at 573 K [
11]. Such closeness can be attributed to the thermal cure of the surface.
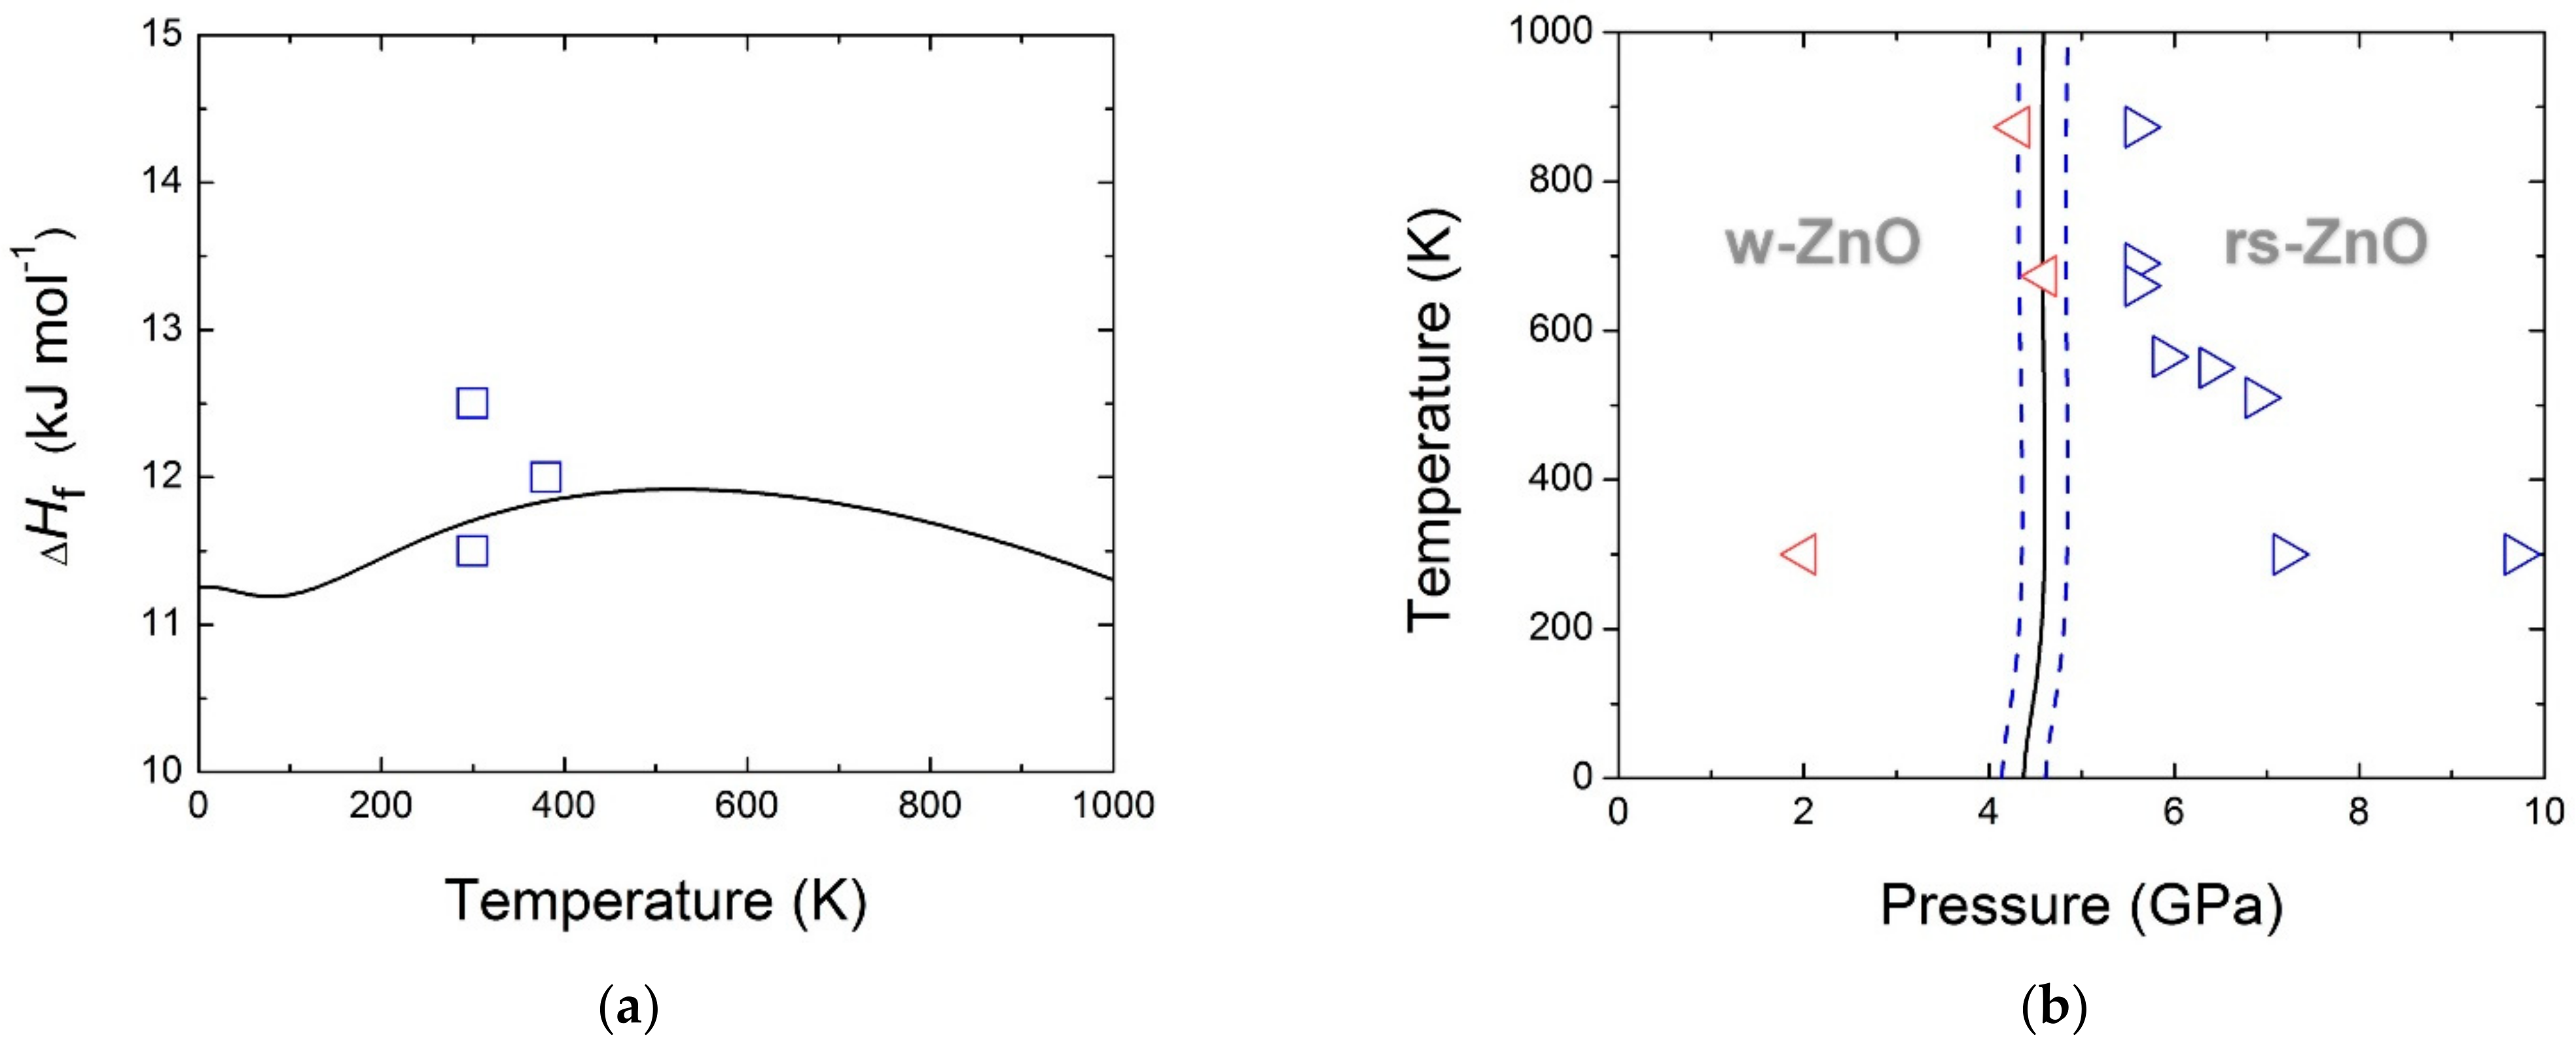
Figure 3a shows the formation enthalpy Δ
Hf calculated using the fitted values of heat capacities and experimental value of Δ
Hf (298.15 K) = 11.7 ± 0.3 kJ mol
−1 [
6]. One can observe only weak temperature dependence of Δ
Hf. The minimum and maximum on the curve are due to the double intersection of heat capacity curves of w-ZnO and rs-ZnO nanostructured phases. These values differ by a factor of two from the results of indirect measurements at high temperatures (e.g., by EFM measurements [
15]), which can be explained by the 1100–1300 K experimental range that is out of rs-ZnO stability region, as well as by the nanocrystallinity of our samples. It is also interesting to compare Δ
Hf values with the ab initio predictions (at 0 K) that show a large dispersion (from 15 to 30 kJ mol
−1) of calculated values, e.g., 21.230 and 28.950 kJ mol
−1 (by LDA and GGA, respectively) in [
16] and 15.247 and 22.871 kJ mol
−1 (by LDA and GGA, respectively) in [
17]. The variation of the calculated values by a factor of two does not allow making any reliable evaluation of thermodynamic stabilities of bulk phases at low temperatures. At the same time, the ab initio simulations of structural transition in ZnO nanowires at high pressures (calculations using the SIESTA code) indicated that passage from bulk crystal to nanograins reduces Δ
Hf (0 K) from 23 kJ mol
−1 down to 10 kJ mol
−1 [
18]. This result is consistent with the data in [
6] and imply the difference between bulk- and nano-phase diagrams of ZnO.
Nano-phase diagram of zinc oxide has been calculated using the fitted experimental heat capacity values, directly-measured Δ
Hf [
6] and thermoelastic
p-V-T data on rs-ZnO [
5,
19] and w-ZnO [
20]. The experimental data on direct and inverse transformations in ZnO at high (above 500 K) temperatures are in satisfactory agreement [
7,
19]. At lower temperatures, where the transformation hysteresis is pronounced, the application of the estimated
peq for the equilibrium pressure as shown in Eq. 2 results in the
peq value of 5 ± 3 GPa at 300 K [
19,
21]. The uncertainties have an order of magnitude of the yield stress accumulated during the transformation [
22]. Here, we should note that the use of the hypothesis that
is methodologically incorrect. In fact, both direct and inverse transformations were observed experimentally at finite pressure, which is in agreement with Landau character of 2nd-order transformation driven by the lattice strain as order parameter. Such model requires the onset pressure of ~9.4 GPa [
22] above the equilibrium corresponding to the formal requirement of Δ
Grs/w(
p,
T) = 0.

 ,
, 


