Article

Evaluation of ((La0.60Sr0.40)0.95Co0.20Fe0.80O3-x)-Ag Composite Anode for Direct Ammonia Solid Oxide Fuel Cells and Effect of Pd Impregnation on the Electrochemical Performance

1
CSIRO Energy, Private Bag 10, Clayton South, VIC 3169, Australia
2
CSIRO Manufacturing, Private Bag 31, Clayton South, VIC 3169, Australia
*
Author to whom correspondence should be addressed.
Submission received: 5 March 2021 / Revised: 23 April 2021 / Accepted: 30 April 2021 / Published: 3 May 2021
(This article belongs to the Special Issue Feature Papers of Solids 2021)

Abstract

:
Ammonia produced using renewable hydrogen is being viewed as a promising media for the export of energy from locations rich in renewable energy sources. Solid oxide fuel cells (SOFCs) are efficient devices for converting such exported ammonia back into electricity at the point of use; however, investigations on materials and operating regimes for direct ammonia fuelled SOFCs are limited. In this work, we evaluated the direct ammonia SOFC performance with a Silver-Lanthanum Strontium Cobalt Ferrite (Ag-LSCF) composite anode and a novel Palladium (Pd) nanoparticle decorated Silver-Lanthanum Strontium Cobalt Ferrite (Pd-Ag-LSCF) composite anode in the temperature range of 500 °C to 800 °C. It is hypothesised that palladium nanoparticles in the anode provide hydrogen dissolution and shift the ammonia decomposition reaction towards the right. The cell performance was evaluated with both hydrogen and ammonia as fuels and a clear-cut improvement in the performance was observed with the addition of Pd for both the fuels. The results showed performance enhancements of 20% and 43% with hydrogen and ammonia fuels, respectively, from the addition of Pd to the Ag-LSCF anode. Open-circuit voltage (OCV) values of the cells with hydrogen and ammonia fuels recorded over the temperature range of 500 °C to 800 °C indicated the possibility of direct electro-oxidation of ammonia in SOFCs.

1. Introduction

A substantial decrease in the levelised cost of renewable electricity production has been observed over the past decade due to advances in engineering and increased market penetration of solar and wind power electricity generators. Despite these advances, the actual penetration of nonhydro related renewables remains limited due to the uneven distribution of renewables and their inherent intermittency. In response to these challenges, the avenues for long-term energy storage and transport in the form of different chemicals and fuels are being explored. While batteries cater for short-term energy storage requirements, for longer terms, energy storage in the form of storable and transportable chemicals is sought. Hydrogen is a lead contender among these chemical storage techniques; however, the storage and transport of hydrogen is still expensive [1,2]. In the search for alternatives, ammonia has emerged as a promising candidate for long-term storage and transport of renewable energy due to its high gravimetric energy density of 5.2 kWh/kg and high hydrogen content of 121 g/L [3]. Ammonia can be easily compressed and stored in liquid form under relatively mild conditions (100 kPa pressure or −33 °C temperature) and there is extensive infrastructure already present for transport and handling, as around 200 M tonnes of ammonia per annum is already produced globally [3]. One of the major hurdles in the application of ammonia as an energy carrier is the limited number of pathways for the utilisation of transported ammonia for power generation. The current approaches involve energy-intensive multistep processes for the cracking of ammonia and subsequent hydrogen separation and compression before it can be used in fuel cell vehicles or for electricity generation. Ammonia-fed solid-oxide fuel cells (SOFCs) offer a highly efficient pathway for ammonia-into-electricity conversion in a single step without the need for external ammonia cracking. This technology offers the highest round-trip electric and thermal efficiencies (>50%) amongst all known technologies for ammonia utilisation [3]. There have been concerns about the possibility of NOx formation in ammonia fuelled SOFCs with oxygen ion conductor electrolytes. However, several recent experimental studies have reported that no NOx formation can be observed at operating temperatures of less than 900 °C, and only about 5 ppm can be found at 1000 °C [4,5,6]. Despite efficiency advantages, direct ammonia-fed solid oxide fuel cells (DA-SOFCs) have not been studied extensively and materials specifically tailored for efficient ammonia utilisation have not yet been developed. Most of the experimental investigations of DA-SOFCs are focussed on nickel-based anodes [7,8,9]. Nickel metal is a well-established catalyst that promotes ammonia cracking; however, Ni-based anodes still face challenges in commercialisation regarding redox stability, the endothermic nature of ammonia decomposition and the possibility of forming nickel nitrides in the presence of ammonia at lower operating temperatures [9,10]. In this context, further research is sought to evaluate alternate electrodes and to better understand the reaction mechanism. Here, we report a novel composite anode decorated with a hydrogen-absorbing metal for use in an ammonia SOFC. The perovskite phase is an A-site deficient Lanthanum Strontium Cobalt Ferrite (La0.60Sr0.40)0.95Co0.20Fe0.80O3-x, which is typically used as a cathode (air electrode) in SOFCs; however, more recently, this perovskite has been evaluated as a fuel electrode for fuel cells and also in solid oxide electrolysers [11,12]. Despite potential phase changes and being a p-type semiconductor, SOFCs with LSCF anodes have delivered promising performances when a conducting phase such as silver is mixed with LSCF or introduced as a current collection layer [13,14,15]. In this work, we report a response of planar SOFC with an Ag-LSCF composite anode for ammonia fuel. We, for the first time, also report initial investigations on the effect of addition of palladium, which could enhance ammonia dissociation by allowing faster dissolution of hydrogen, which can then be transported to triple phase boundary either via bulk or surface diffusion of hydrogen.

2. Experimental Methods

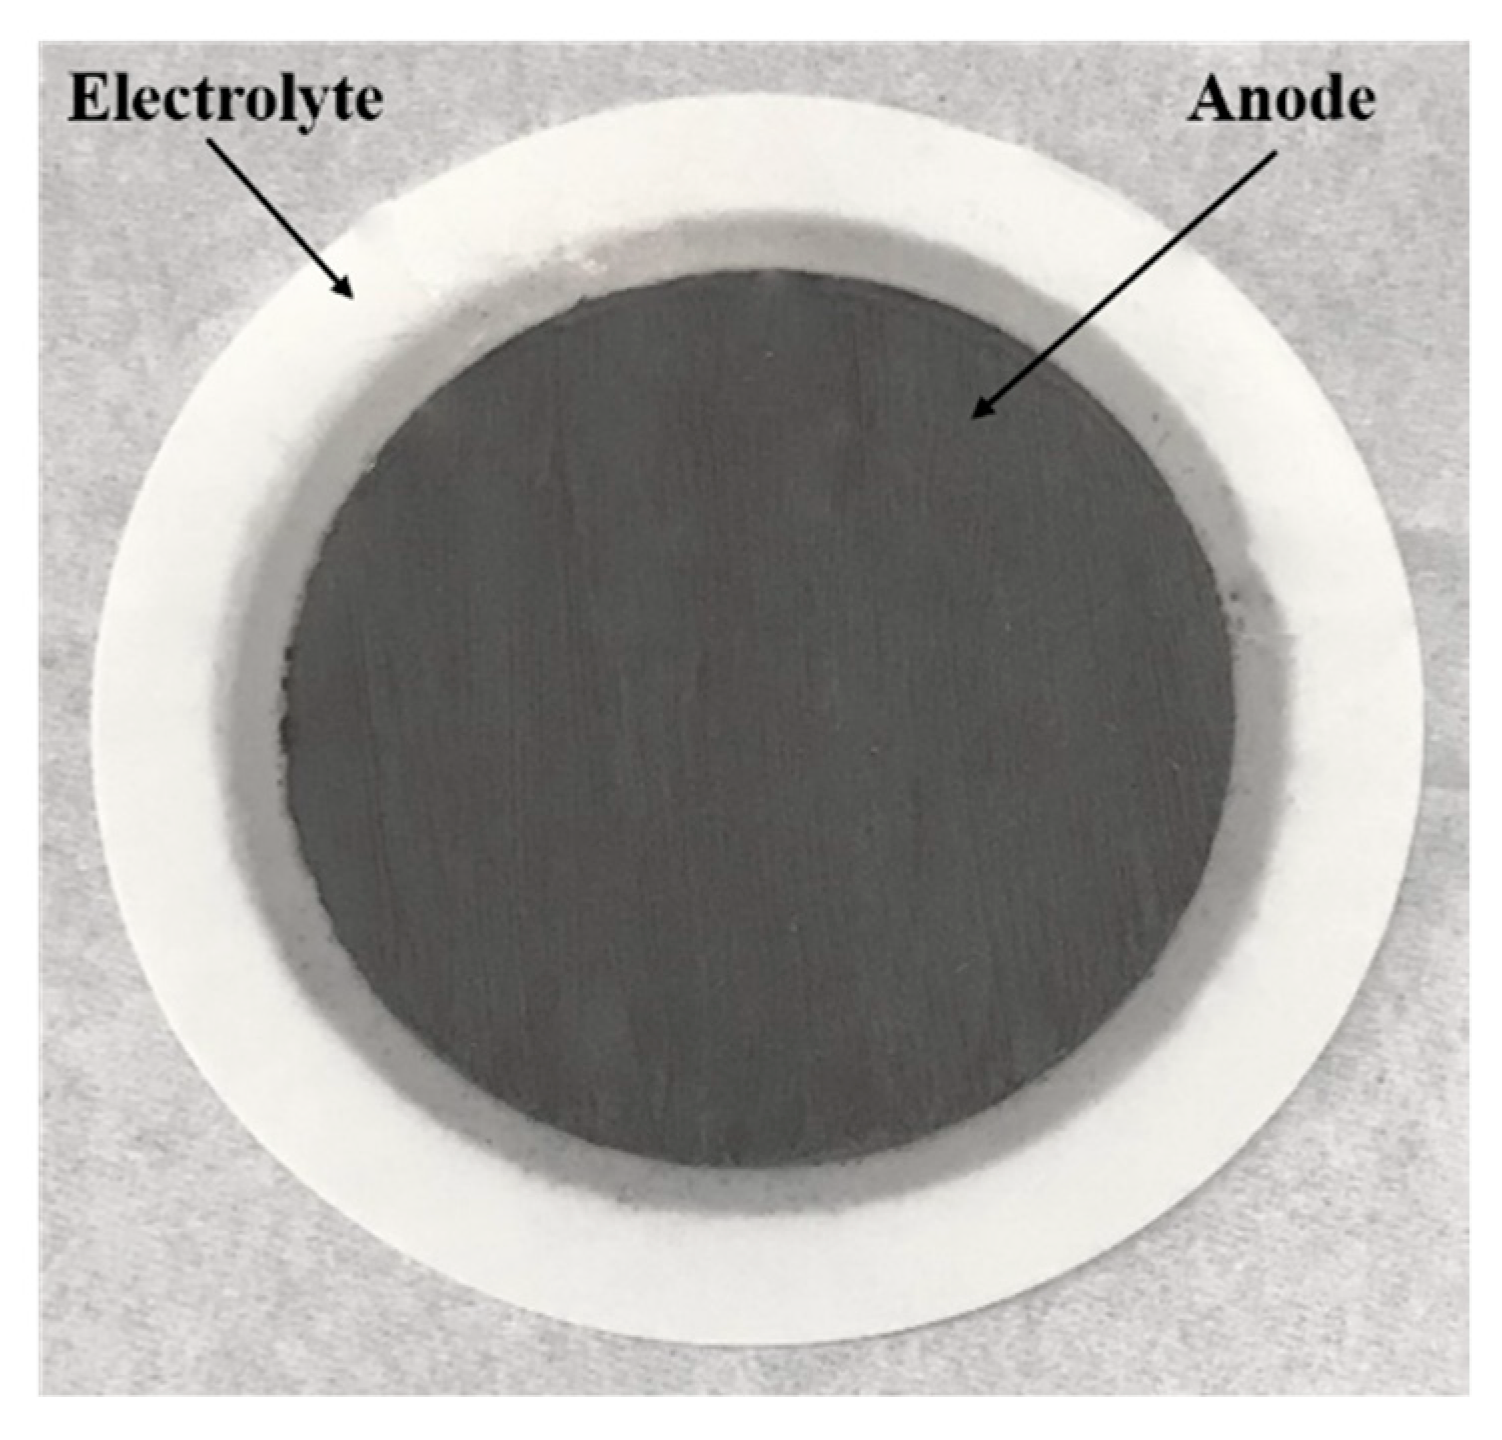
2.1. Materials and Cell Fabrication

Two anodes were prepared for testing in this work with an identical electrolyte and cathode in an SOFC planar cell arrangement. One anode comprised (La0.60Sr0.40)0.95Co0.20Fe0.80O3-x-δ (LSCF) (Fuel Cell Materials Inc., Lewis Center, OH, USA) and Silver powder (Alfa Aesar) mixed in a 65:35 ratio by weight with commercial ink vehicle (Fuel Cell Materials). The second anode was the same as the first—i.e., an LSCF-Ag composite anode; however, it had additional palladium catalyst particles. The anode with Pd catalyst is referred to as “Pd-Ag-LSCF” and the one without Pd as “Ag-LSCF”. The Pd-Ag-LSCF electrode was synthesised by ultrasonically dispersing LSCF powder into an aqueous solution of Pd nitrate dihydrate (Sigma Aldrich). The target weight of Pd catalyst was 2 wt% of the anode. After dispersing, the solution was air dried followed by calcination at 950 °C for 2 h. Next, the aforementioned powder was mixed with Silver powder in a 65:35 ratio by weight with ink vehicle. Electrolyte-supported half-cells (Fiaxell SOFC Technologies, Switzerland) consisting of an LSCF cathode layer with Gadolinium doped Ceria (GDC) interlayer on a 3 mol % Yttria-stabilised Zirconia (3-YSZ) electrolyte support were brush coated with in-house prepared anode slurries as described above to obtain an active anode area of 10.17 cm2 (Figure 1). Prepared cells were subsequently dried and sintered at 820 °C for 2 h in air. Such a low sintering temperature for the composite anode was selected based upon the previously reported studies for such composite electrodes [11,12,16,17]. More work might be required to further optimise the sintering temperature to obtain suitable microstructure and adhesion.
Silver paste was coated on the anode side of sintered cells for optimal current collection. Silver coated electrolyte-supported cells (ESCs) were sintered for 1 h at 800 °C in air. The prepared cells were assembled in a Fiaxell assembly as shown in Figure 2. Nickel mesh was used in the cell fixture for current collection on the anode side while a gold mesh was used on the cathode side. A mica sheet was used as sealant to provide hermetic sealing between the fuel and the air chambers of the cell fixture. Current collector meshes were spring-loaded to provide firm contact between the current collector mesh and cell and to ensure sealing.

2.2. Material Characterisation

A phase assemblage of Ag-LSCF and Pd-Ag-LSCF anode materials were analysed using X-ray Diffraction (XRD) before and after cell operation. A Rigaku SmartLab, equipped with a rotating anode CuKα source (45 kV, 200 mA) and Hypix 3000 detector, was employed to obtain the X-ray diffractograms. The diffractometer was operated in Bragg–Brentano mode with a ½° incidence slit, 20 mm receiving slit and a beam limiting mask of 10 mm. Data were collected over the 2θ range 5° to 130° with a step size of 0.01° and a scan rate of 2° per minute.
Analyses were performed on the collected XRD data using the Bruker XRD search match program EVA™5. Crystalline phases were identified using the ICDD-JCPDS powder diffraction database. Rietveld analysis was performed on the data using the Bruker TOPAS™ V5 program to determine wt% values. Background signal was described using a combination of a Chebyshev polynomial linear interpolation function and 1/x function. Cell parameters, vertical sample displacement, peak full width at half maximum, scale factor and preferred orientation were all refined. For wt% values, error ranges were calculated based on three estimated standard deviations, as calculated by TOPAS.
Microstructure images and EDS mappings were obtained Field Emission Scanning Electron Microscopy (FESEM; Merlin-Zeiss Ultra-Plus with a Gemini II column, Germany).

2.3. Cell Performance Evaluation

Cell performance tests were conducted at temperatures starting from 500 °C and at intervals of 100 °C thereafter to a maximum temperature of 800 °C, with both pure hydrogen (BOC, North Ryde, NSW, Australia) and pure ammonia (Coregas, Yennora, NSW, Australia) as fuels. Hydrogen and ammonia flow rates of 75 mL/min and 50 mL/min were used on the anode side, respectively. For both hydrogen and ammonia testing, an air flow rate of 75 mL/min was used on the cathode side. The current voltage (I–V) characterisation and electrochemical impedance spectroscopy (EIS) analyses under open-circuit voltage (OCV) were performed with hydrogen and ammonia fuels sequentially on the anode side at 100 °C intervals from 500 °C to 800 °C. Cell performance evaluation was performed using a Versastat4 (Princeton Applied Research, Oak Ridge, TN, USA). For EIS, amplitude of 20 mV was used. EIS was recorded at open-circuit voltage (OCV). After performance evaluation at different temperatures, a short-term stability test was conducted over 60 h for both cells with ammonia fuel.

3. Result and Discussion

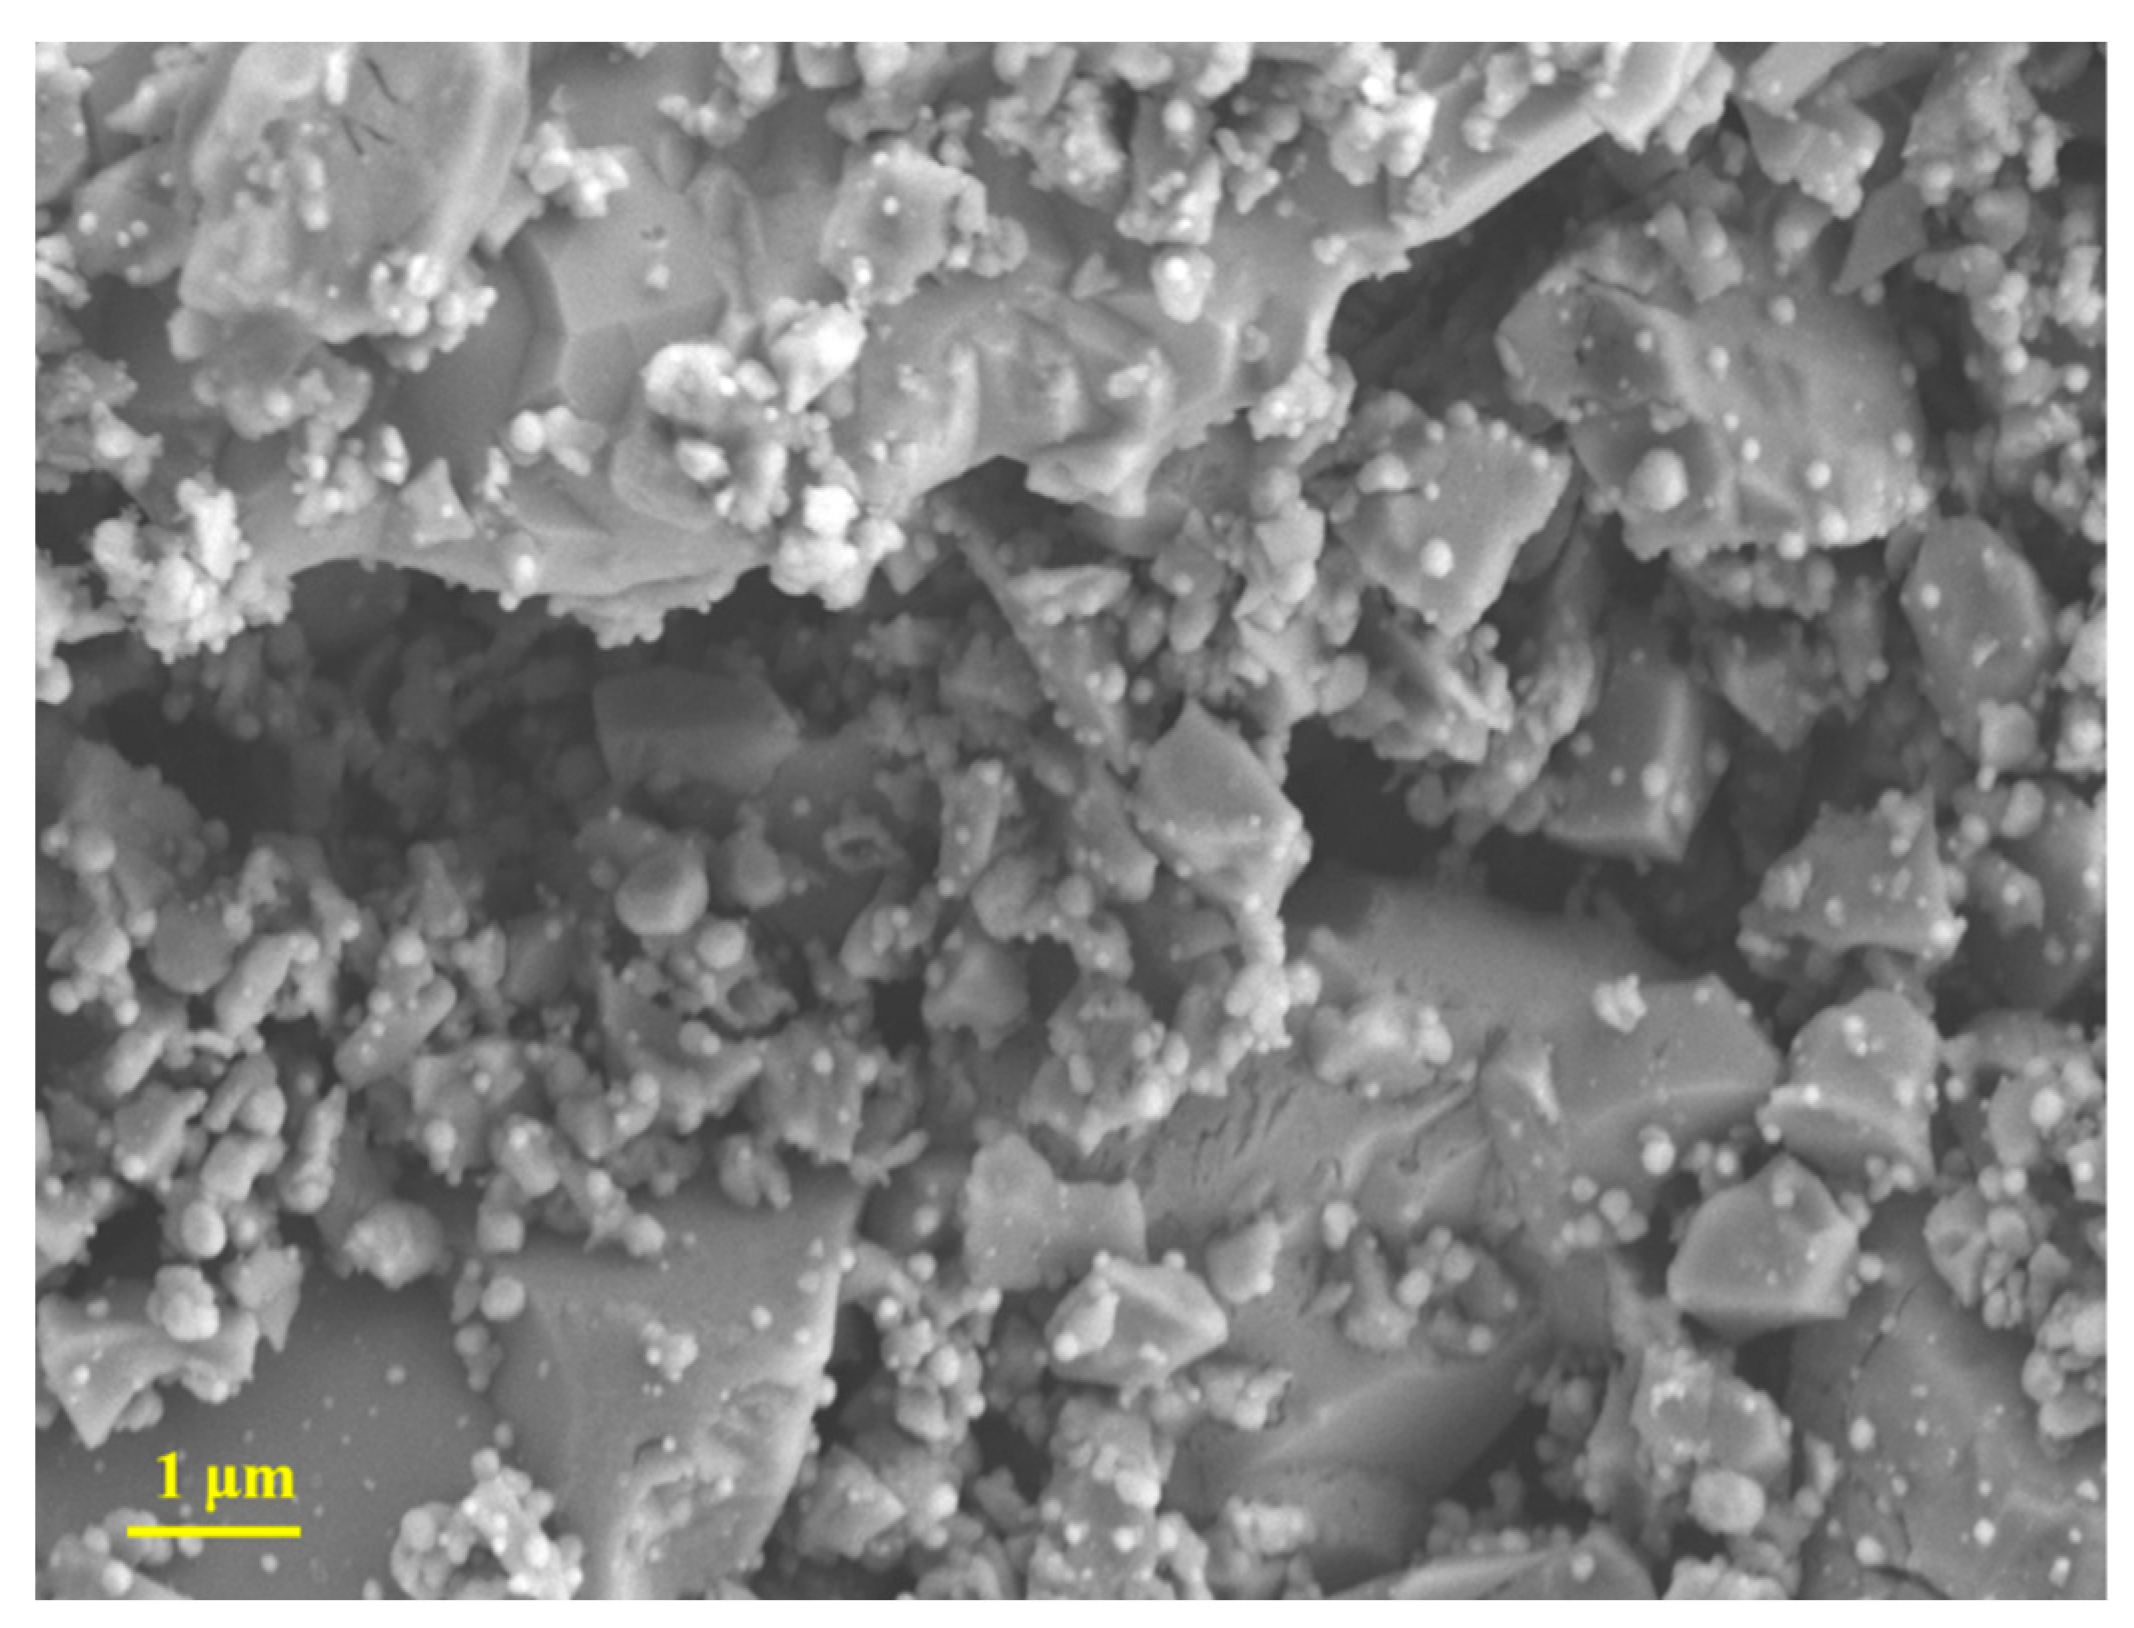
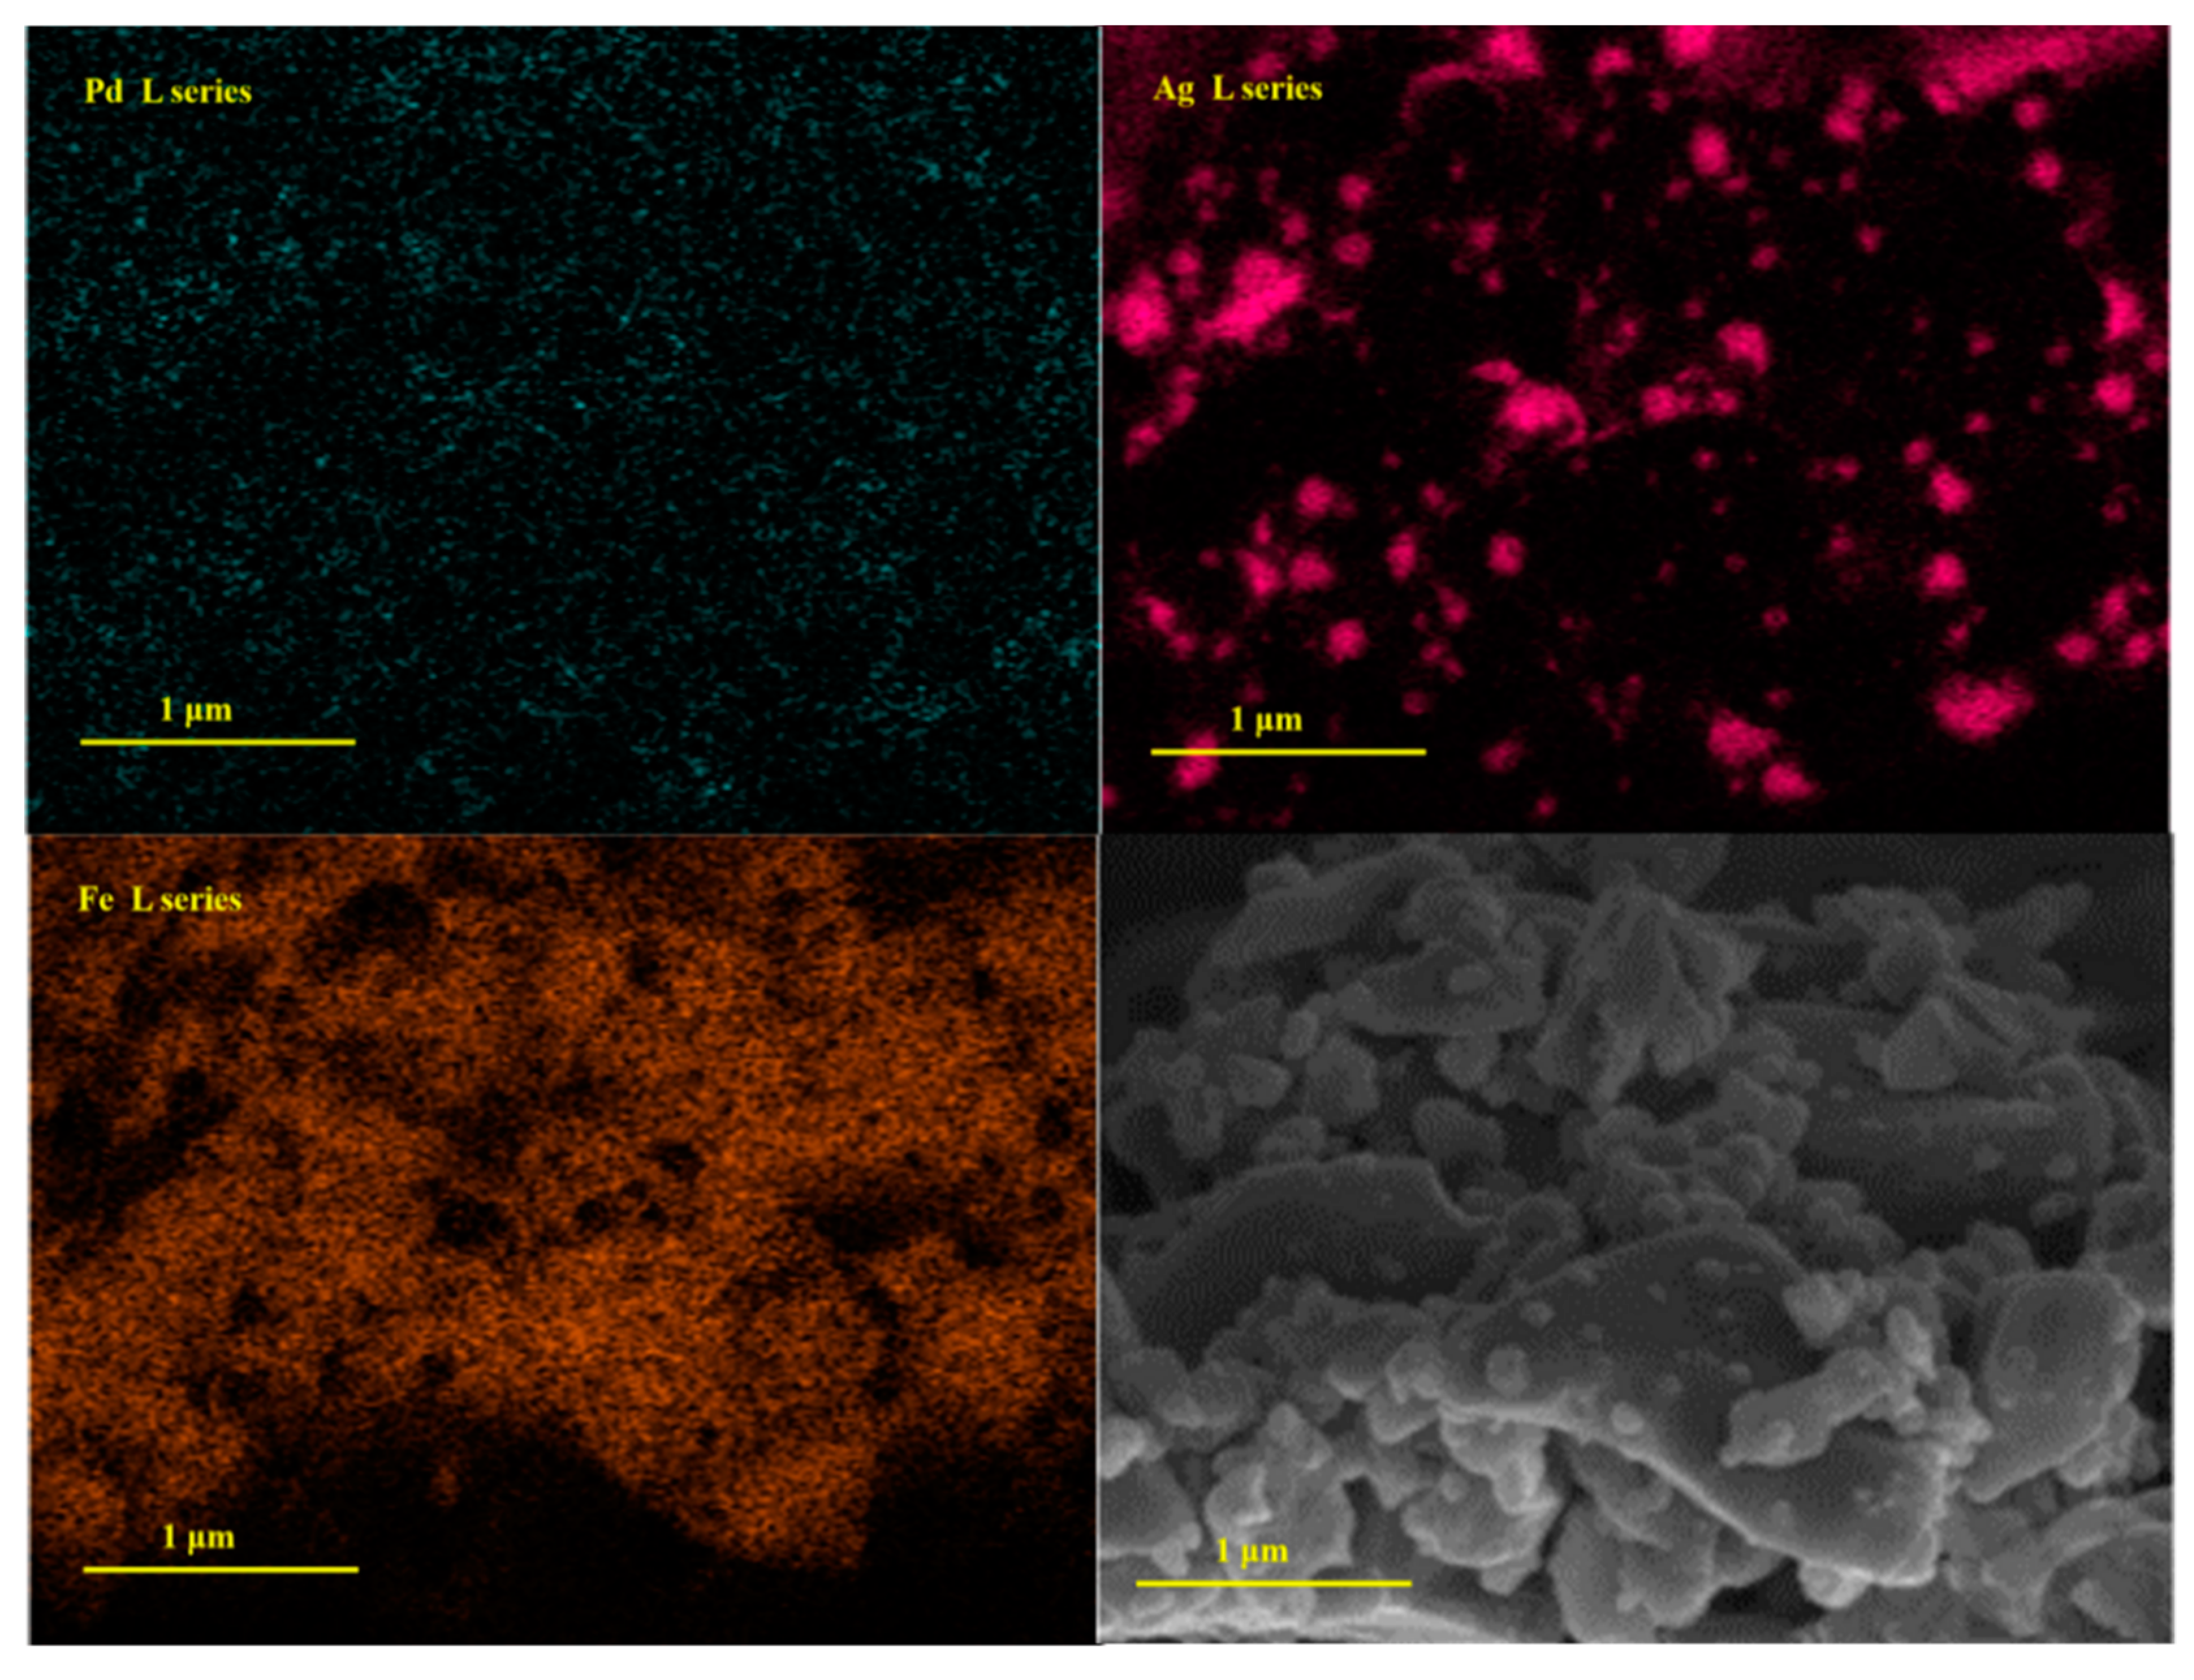
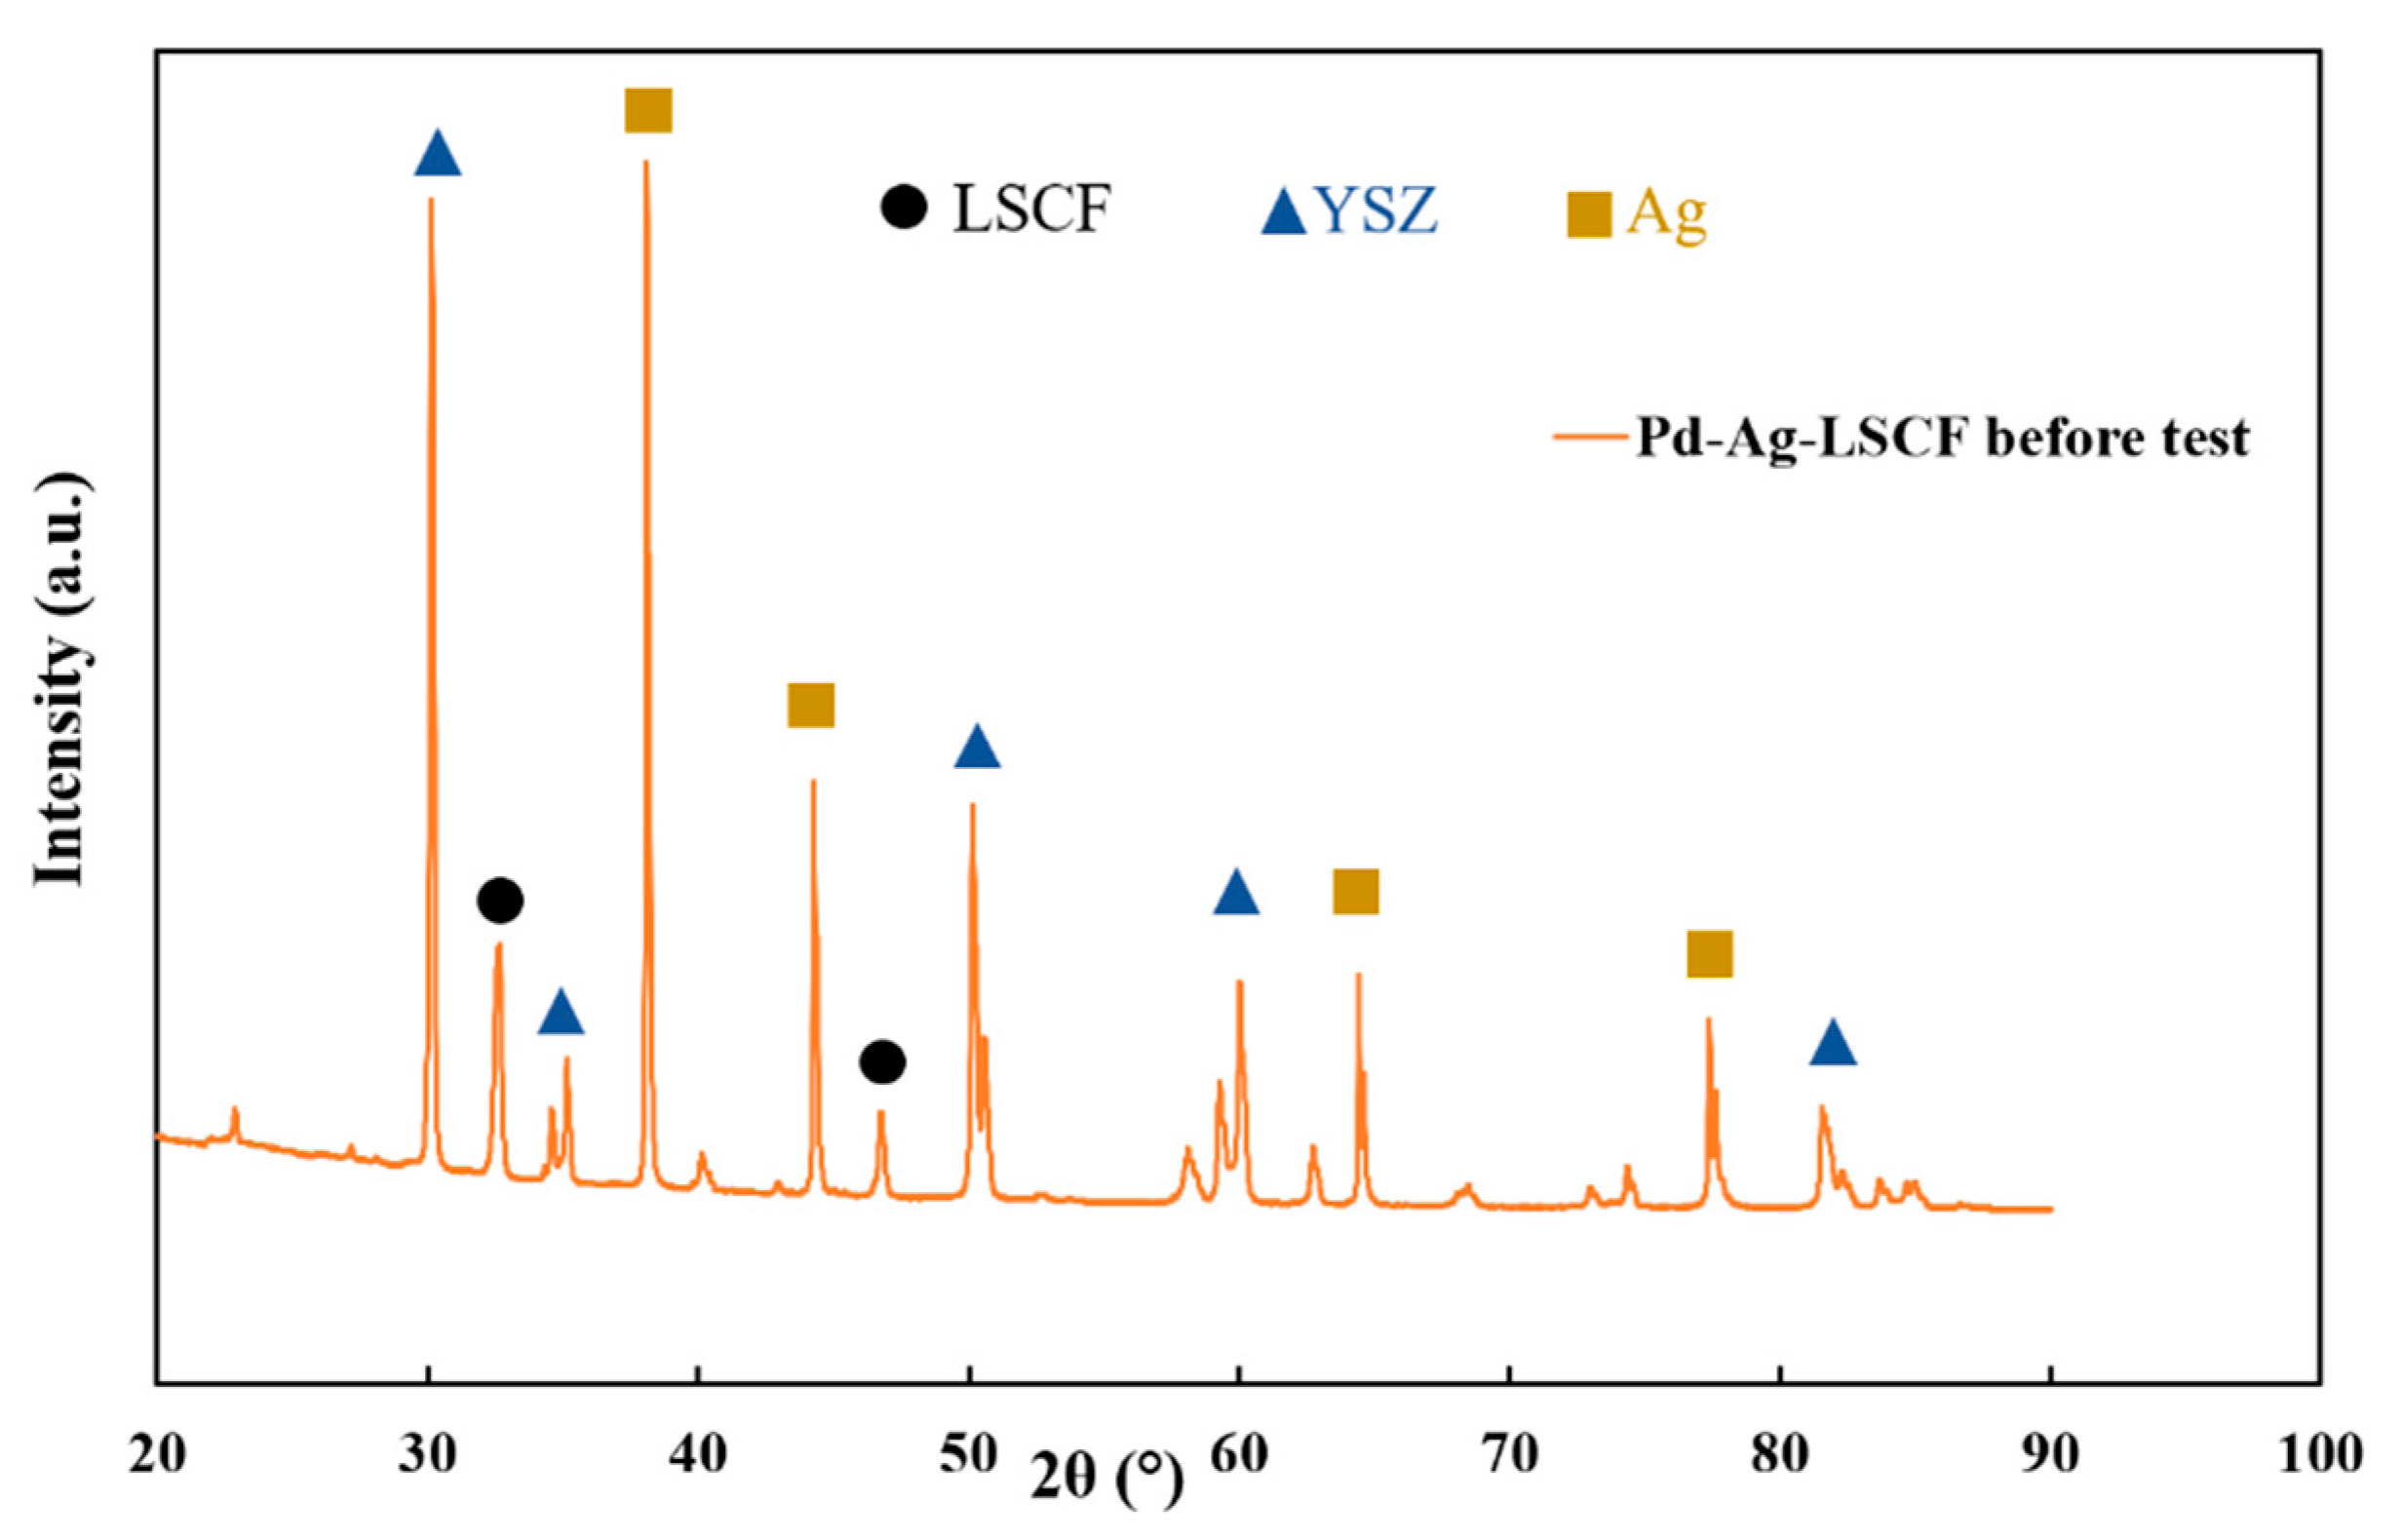
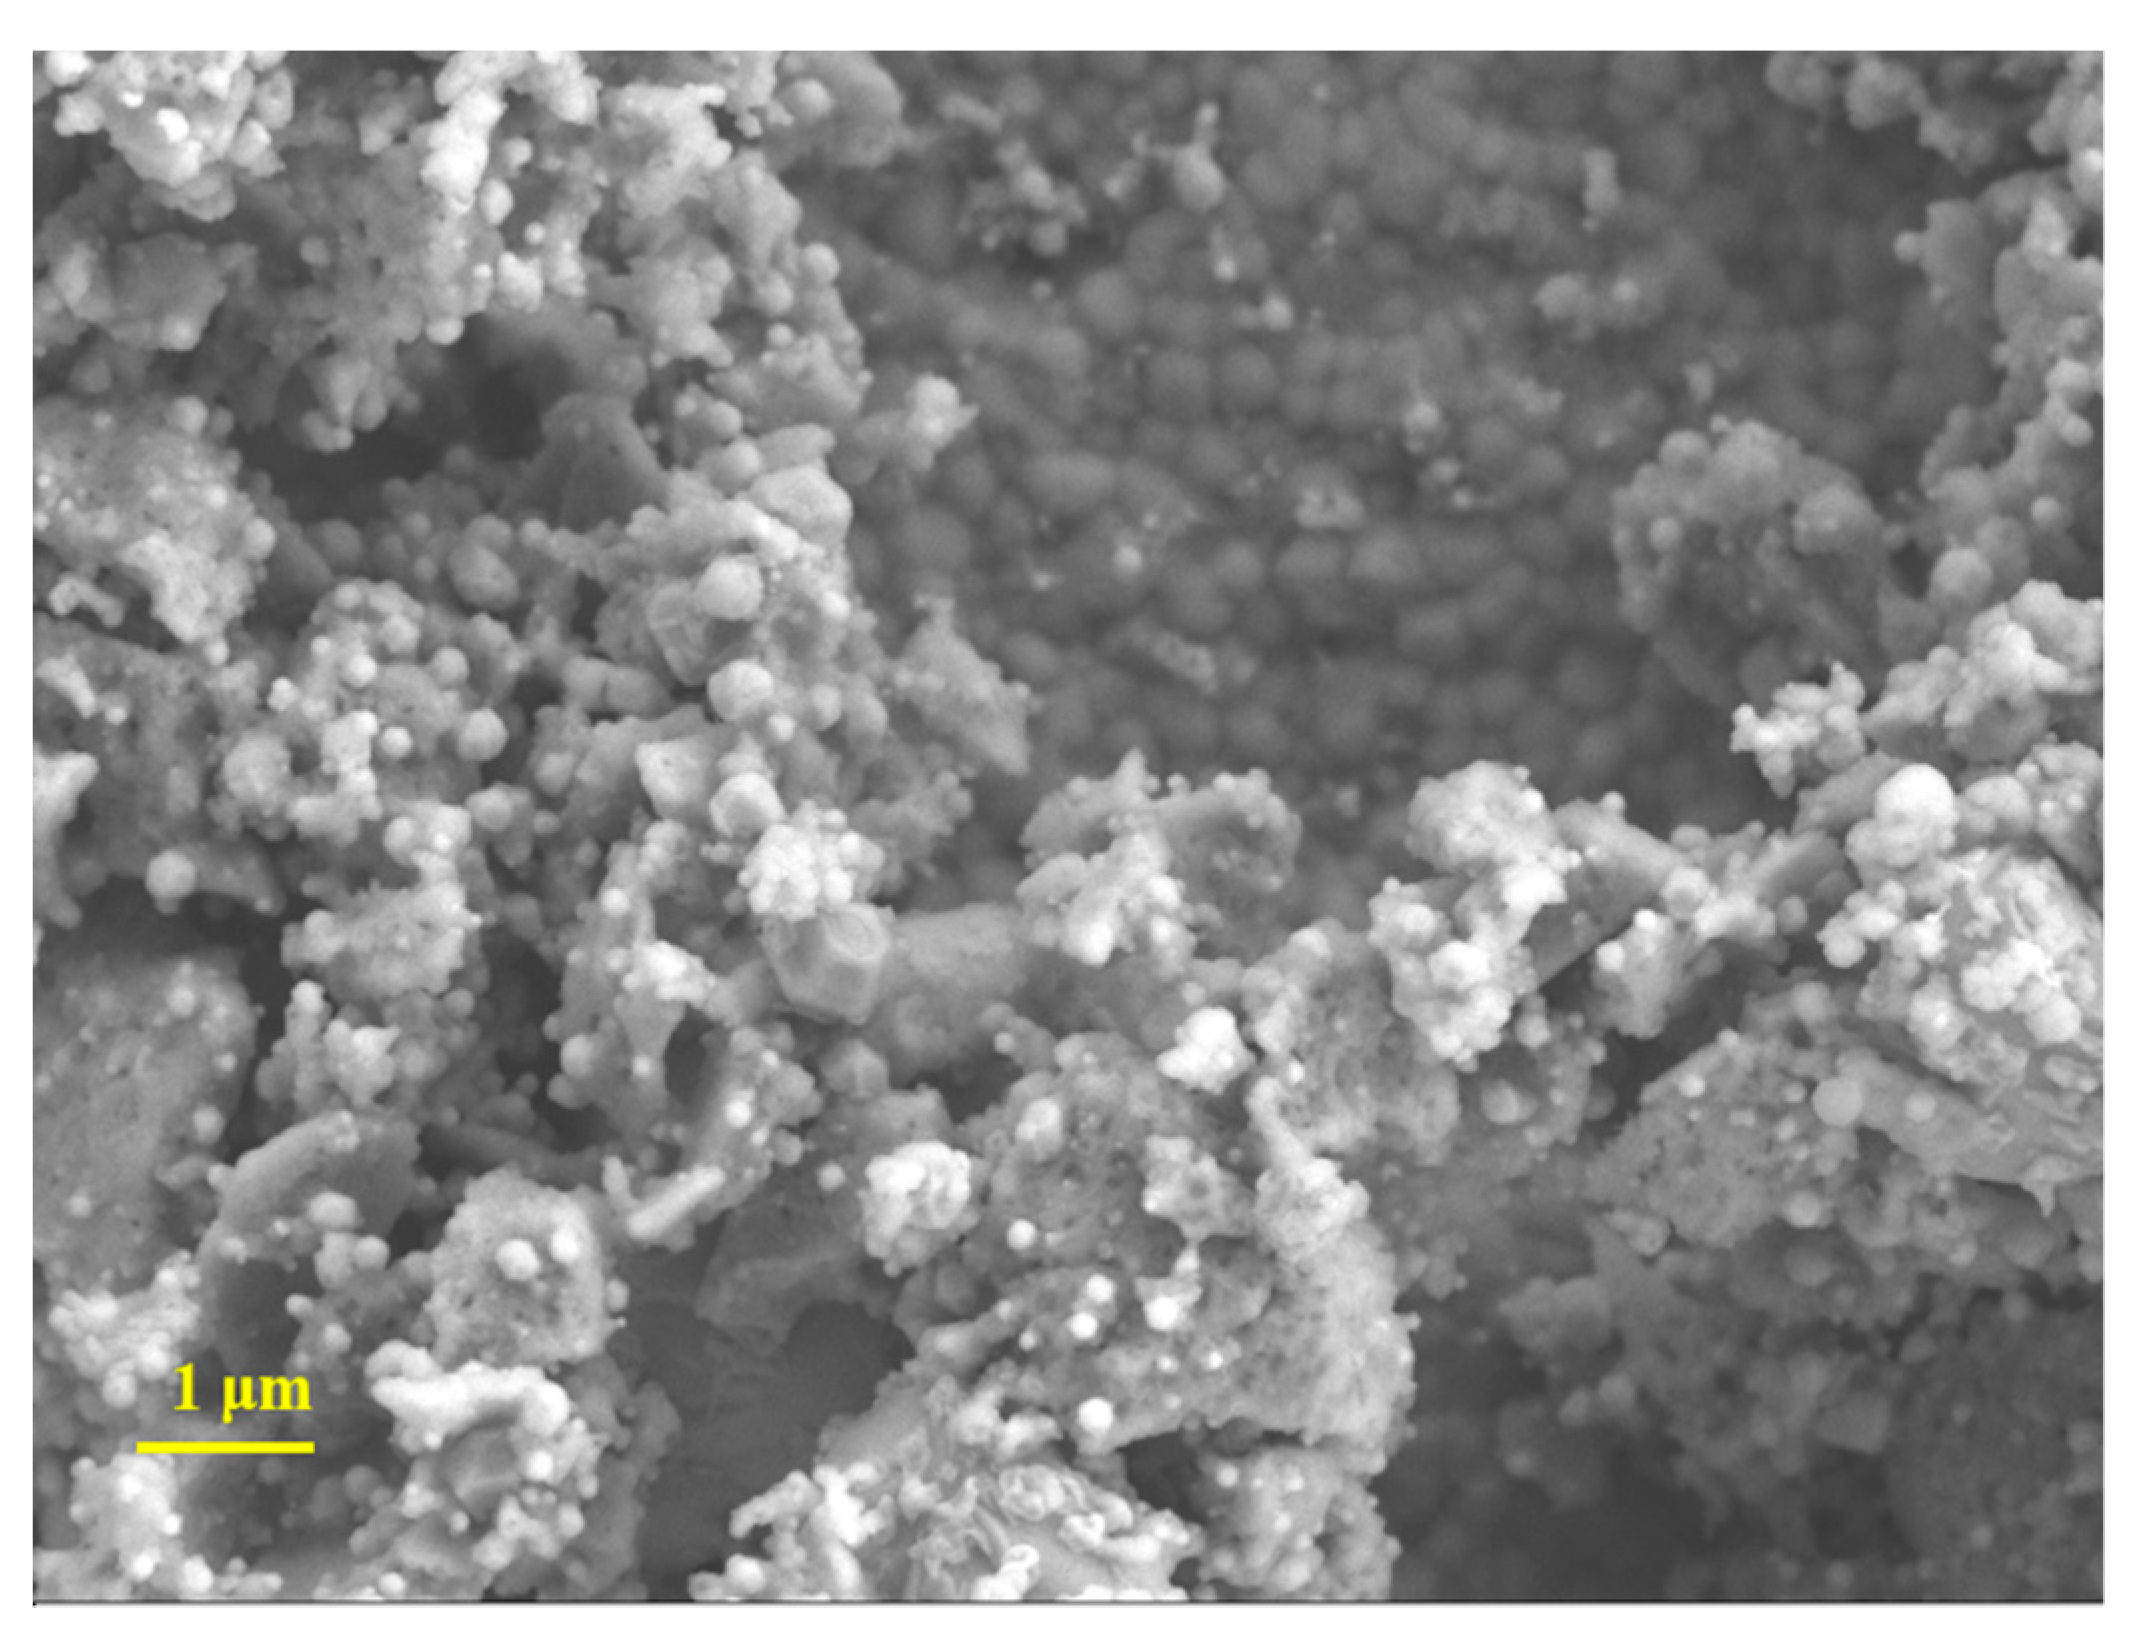
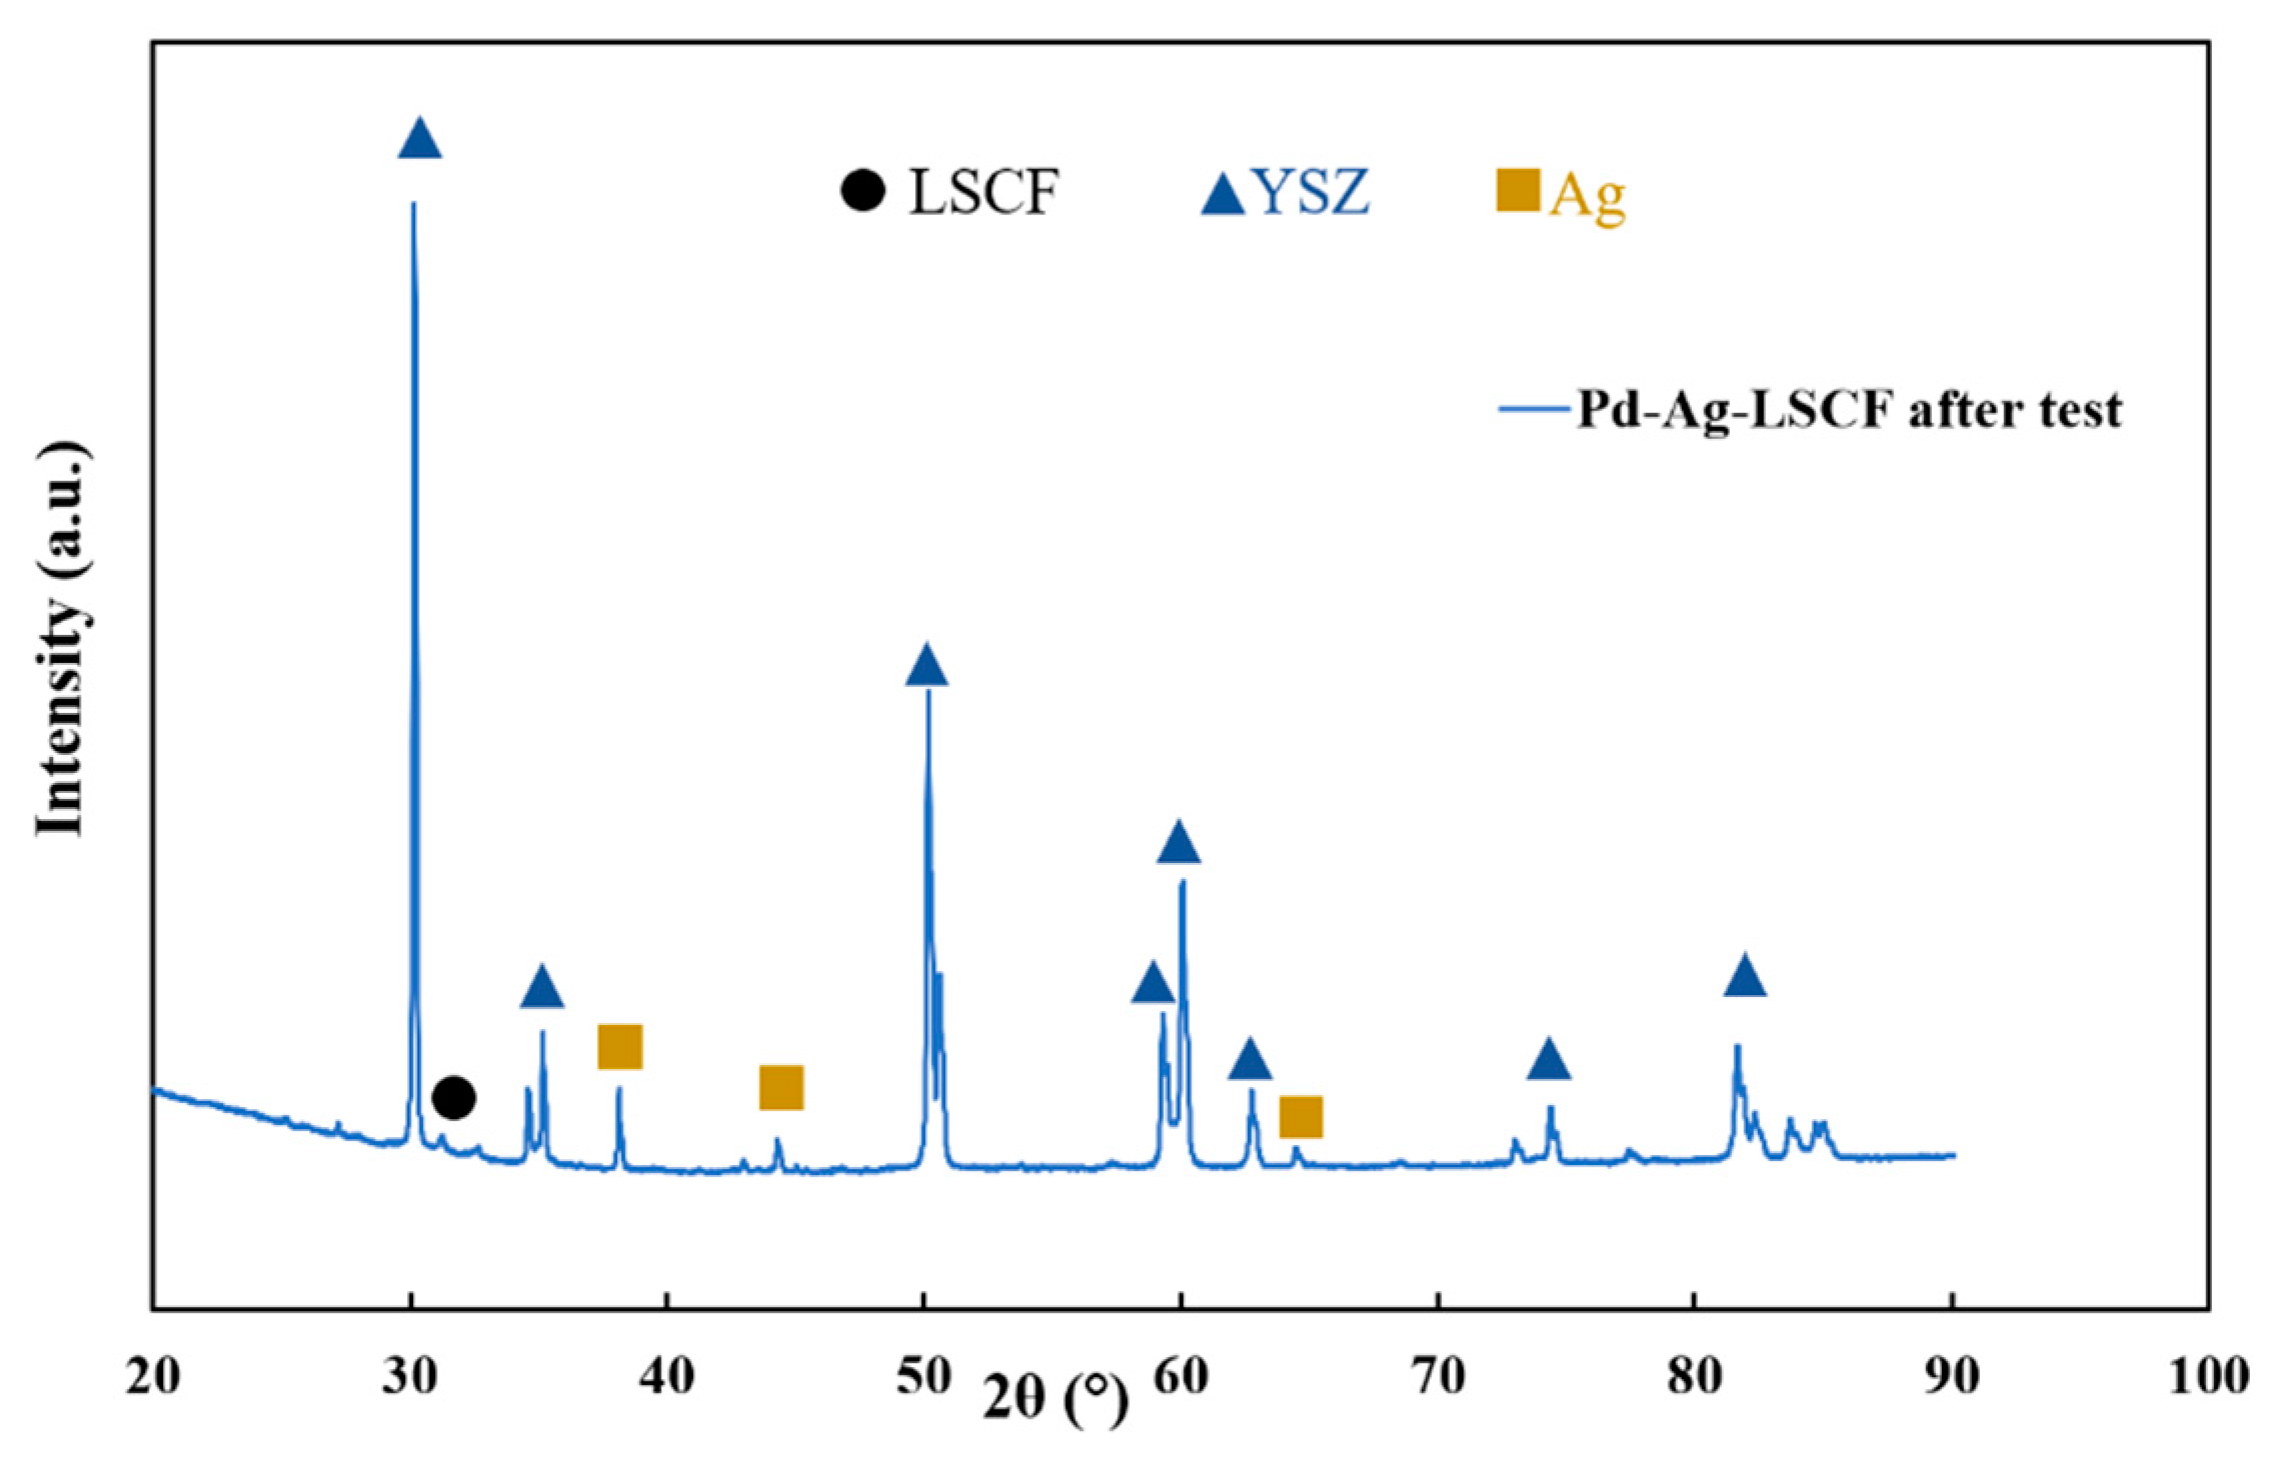
3.1. Materials Characterisation

Figure 3 shows an SEM image of the surface of the as-prepared Pd infiltrated Ag-LSCF anode on the cell, and the EDS mapping is shown in Figure 4. The image and EDS map show uniformly distributed spherical Pd particles with considerable variation in particle size between about 25 nm and 100 nm. Figure 5 shows an X-ray diffractogram of the as-prepared Pd infiltrated Ag-LSCF anode, which is dominated by peaks from the YSZ substrate, Ag and LSCF. No Pd peaks were observed, possibly due to uniform dispersion of Pd particles and resolution limitation of lab XRD. SEM images of the as-prepared Ag-LSCF before and after testing (Figure S1) are provided in the supplementary information, which are consistent with the previously reported results [16]. Figure S2 also shows the SEM images and EDS maps of after test Ag-LSCF and Pd decorated Ag-LSCF anodes.

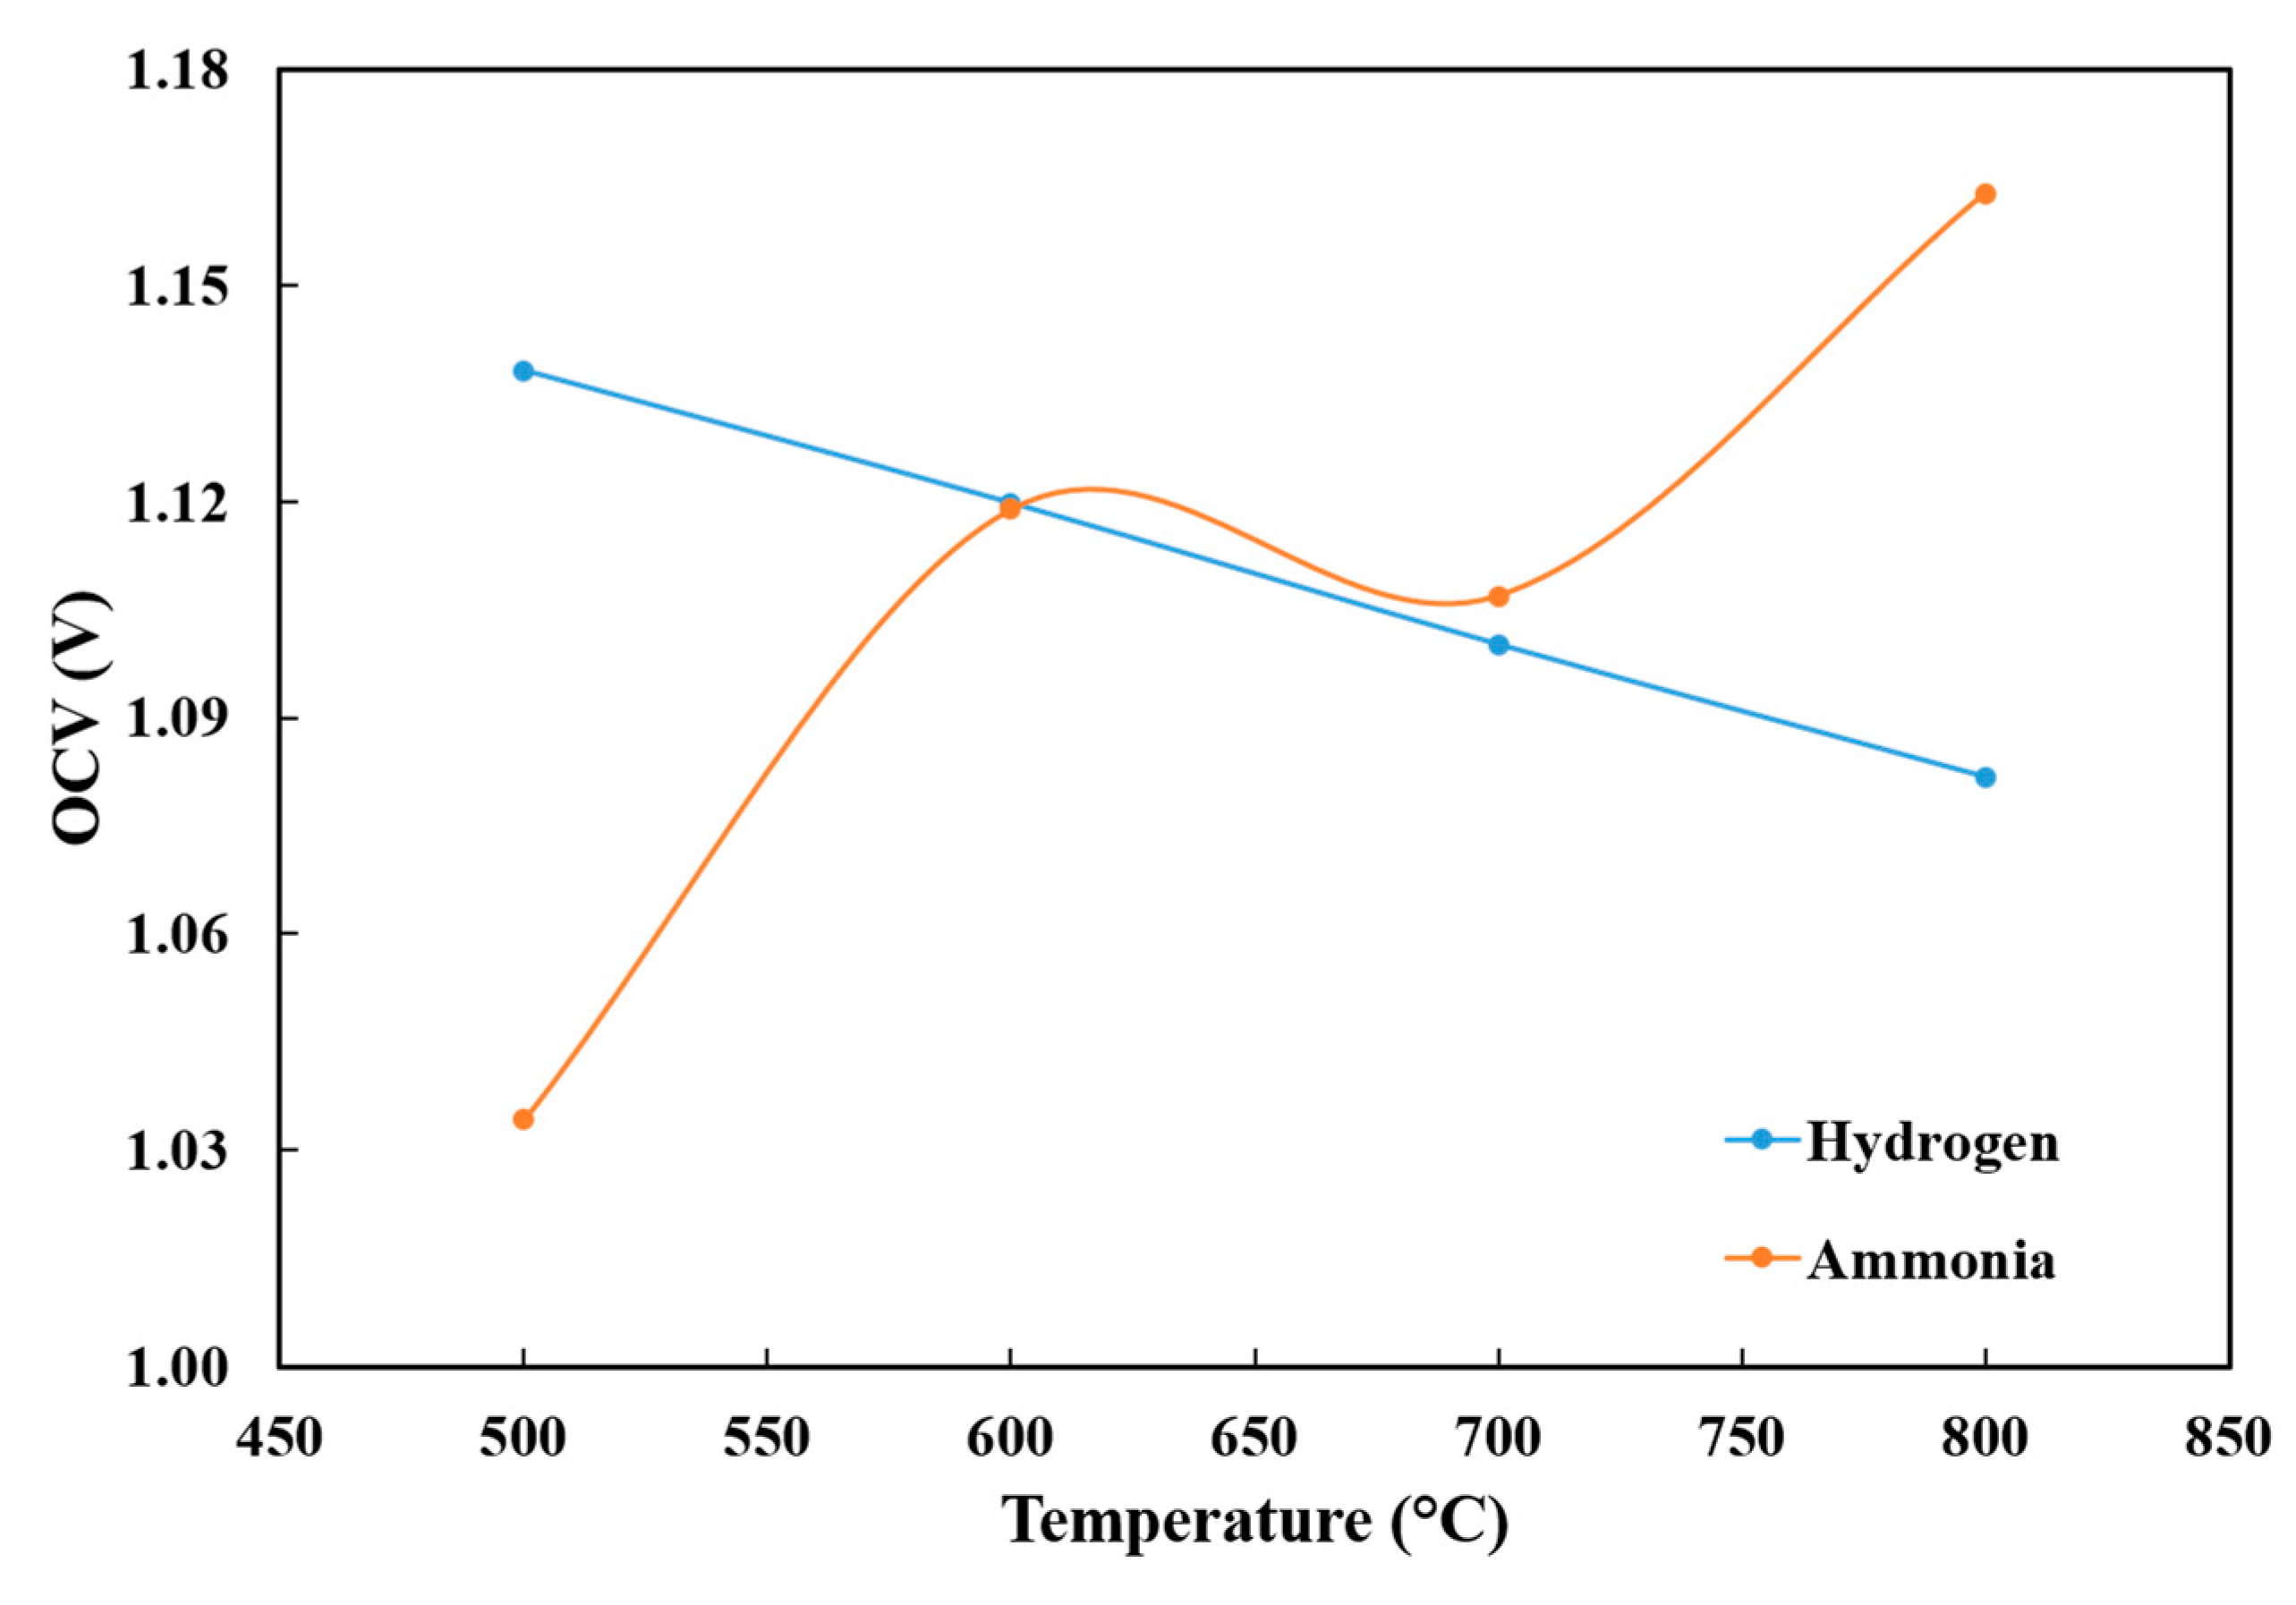
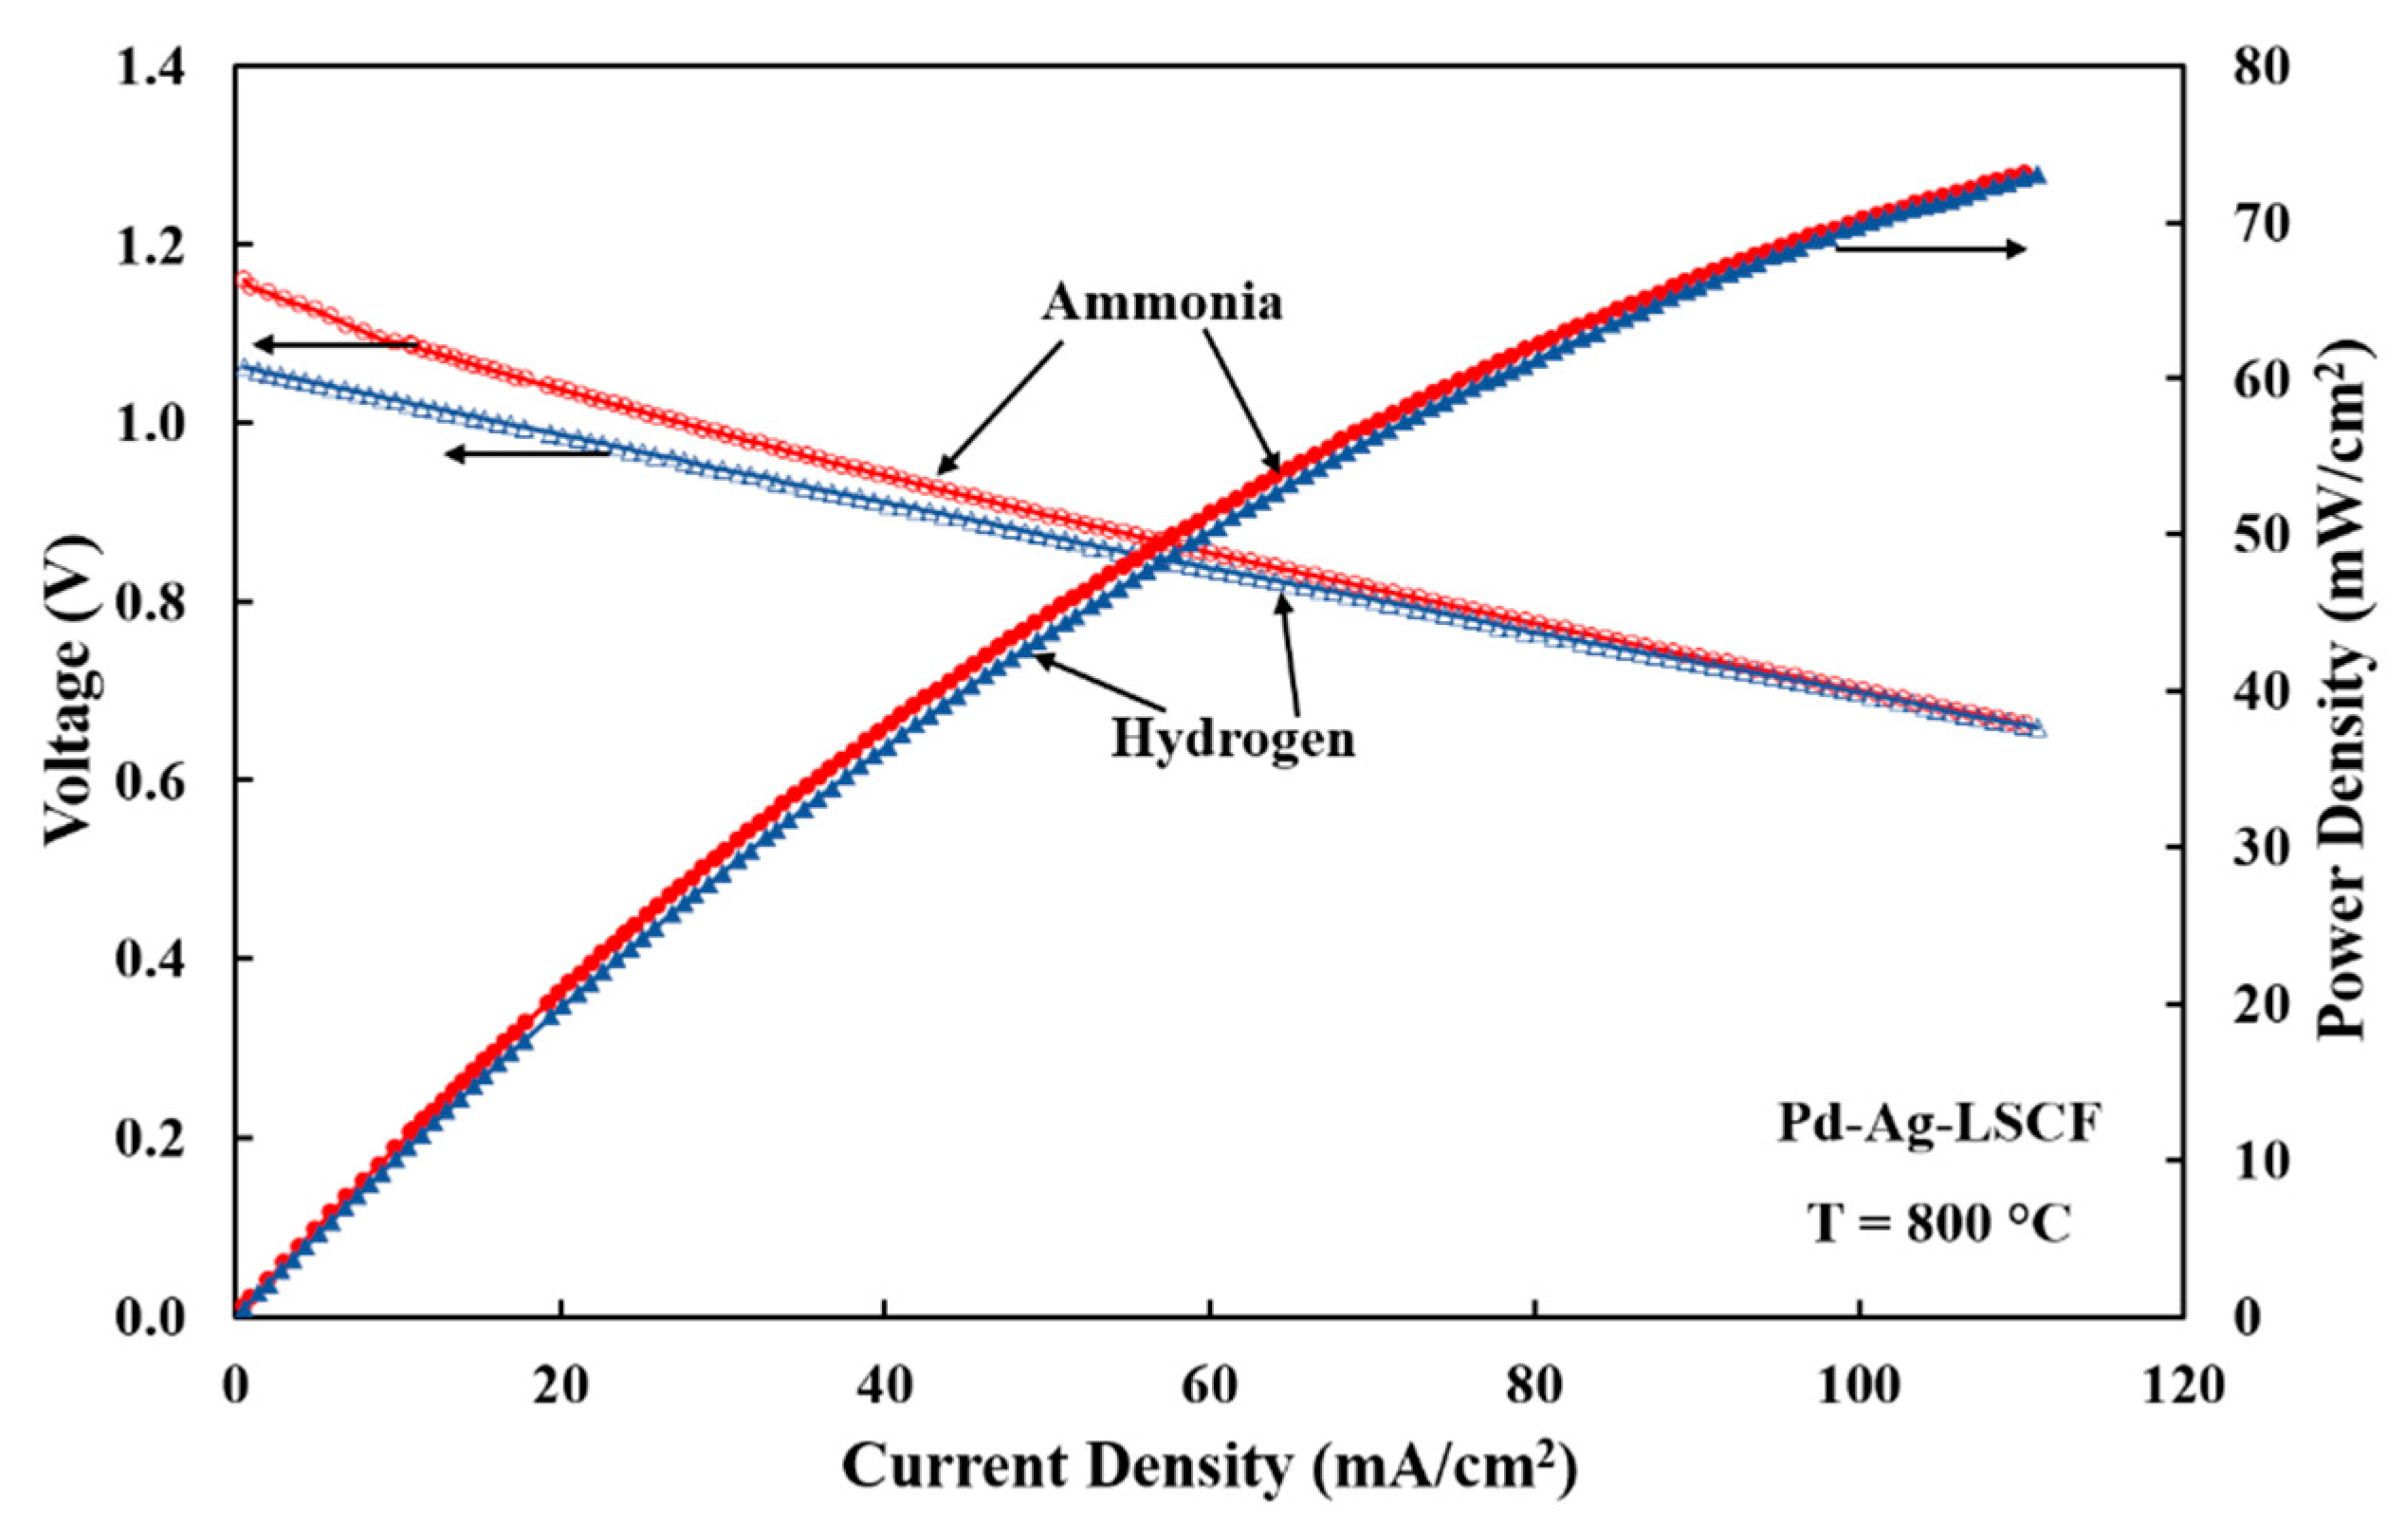
3.2. Temperature Effects on OCV and Performance

Figure 6 shows the OCV of SOFC with a Pd-Ag-LSCF anode with hydrogen and ammonia fuels as a function of temperature. The OCV decreased linearly with the temperature for hydrogen fuel, whereas it showed an overall increase in OCV for ammonia fuel, except for a slight drop when the temperature was increased from 600 °C to 700 °C. Ammonia can react in SOFCs either by producing hydrogen as a result of in situ cracking in the anode chamber or near the electrode surface (Reaction R-1) or, in principle, by direct electrochemical oxidation (Reaction R-2). A mixed reaction mechanism with a contribution from both Reactions R1 and R2 is also possible [18].
2NH3 → N2 + 3H2
2NH3 + 5O2− → 2NO + 3H2O + 10 e
The experimentally observed trends in OCV follow the trend of cell electromotive force (EMF) values (Table 1) for the hydrogen electro-oxidation and more interestingly for direct electrochemical oxidation of ammonia [18]. This trend hints at the possibility of direct electrochemical oxidation or prominence of direct electro-oxidation of ammonia to generate electrical energy along with the hydrogen cracking reaction. Similar observations have been reported by Akimoto et al. [18]. Although the OCV of a cell is related to the reaction mechanism, it is acknowledged that further studies are required to elucidate reaction mechanism considering sensitivity of OCV to experimental conditions and sealing. It is plausible that power generation in ammonia SOFCs at lower temperatures proceeds via mixed reaction mechanism with a combination of direct electrochemical oxidation and oxidation of hydrogen generated by ammonia dissociation. This is particularly interesting as the maximum thermodynamic efficiencies for direct electrochemical oxidation of ammonia (R2) are almost 20% and 25% higher than the oxidation of hydrogen produced in situ by cracking (R1) at 700 °C and 800 °C, respectively (Table S1) [19].

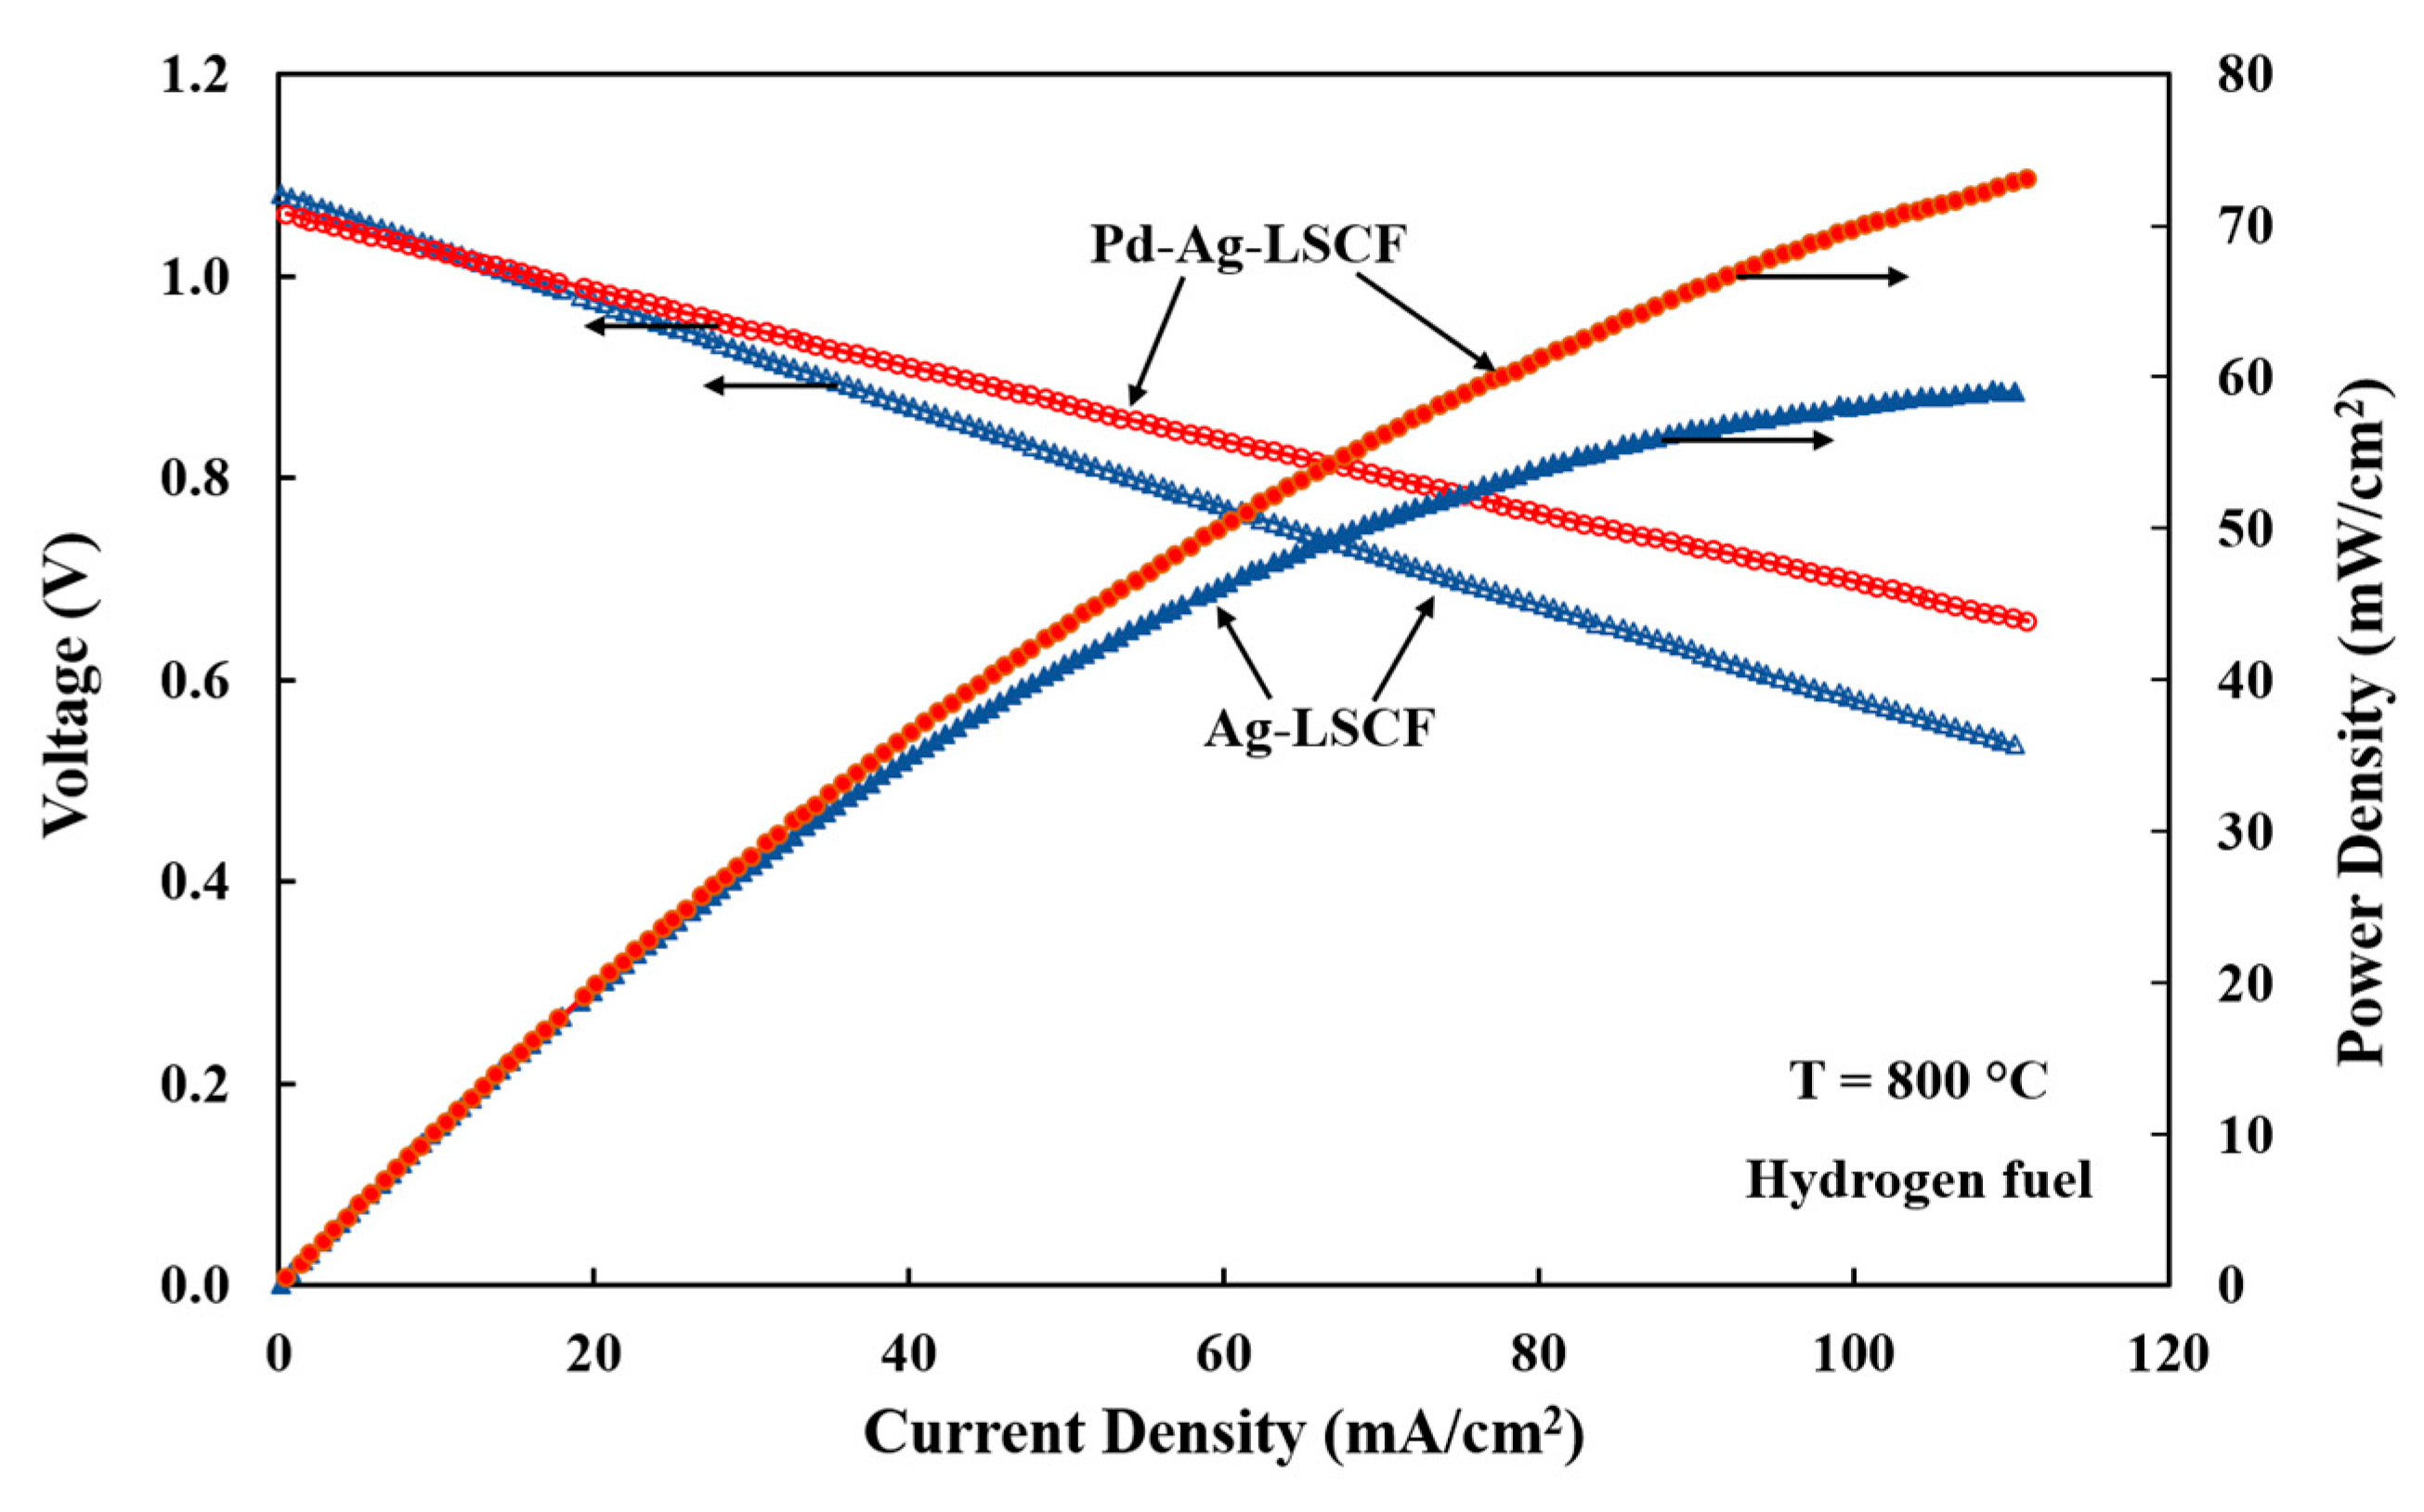
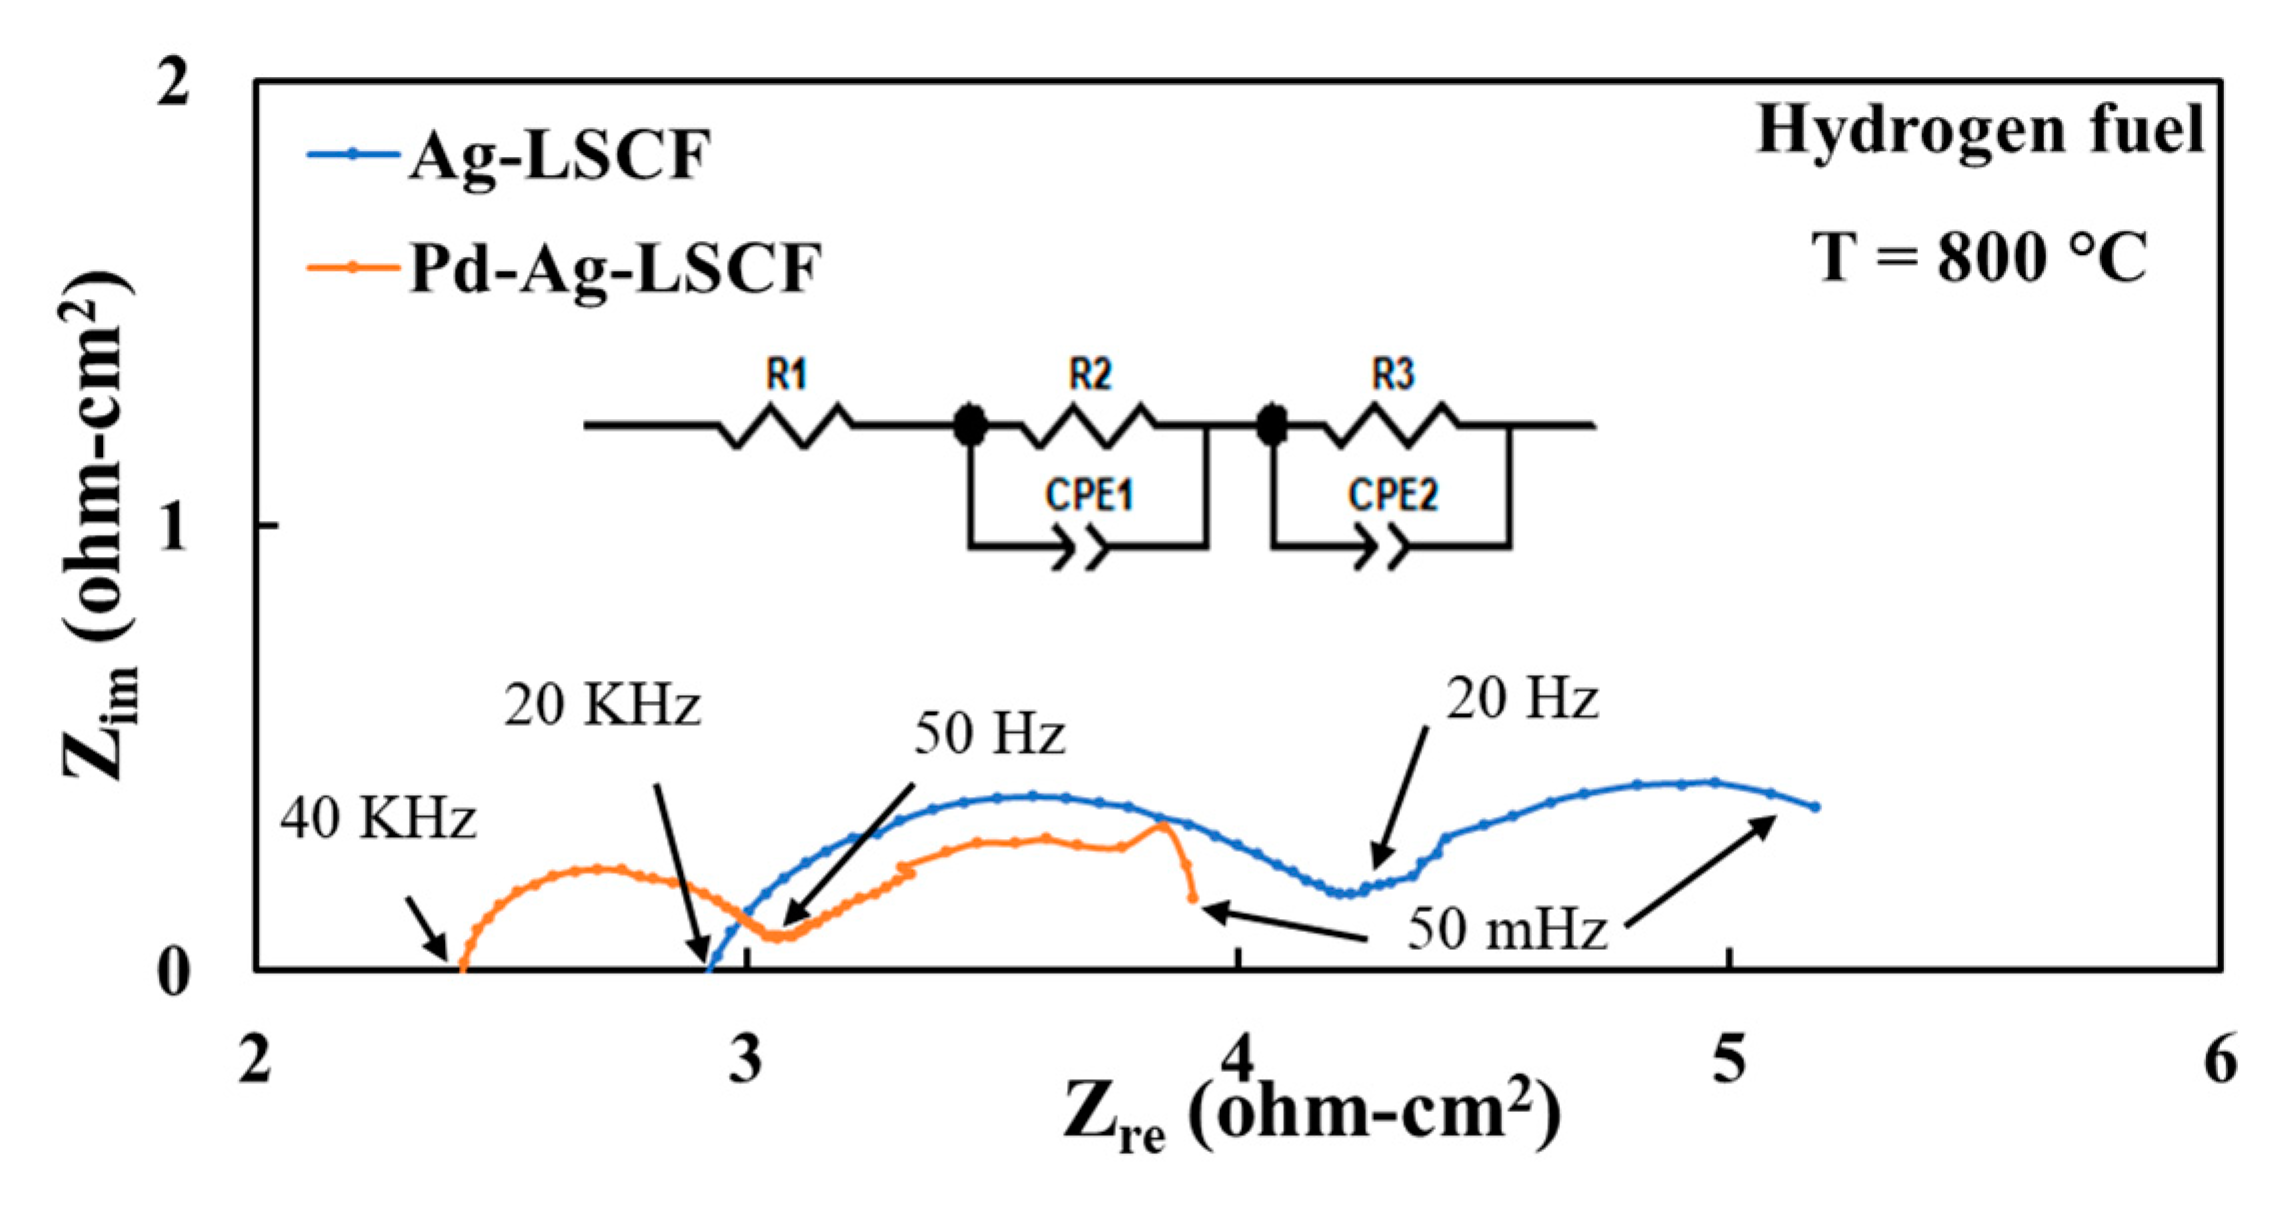
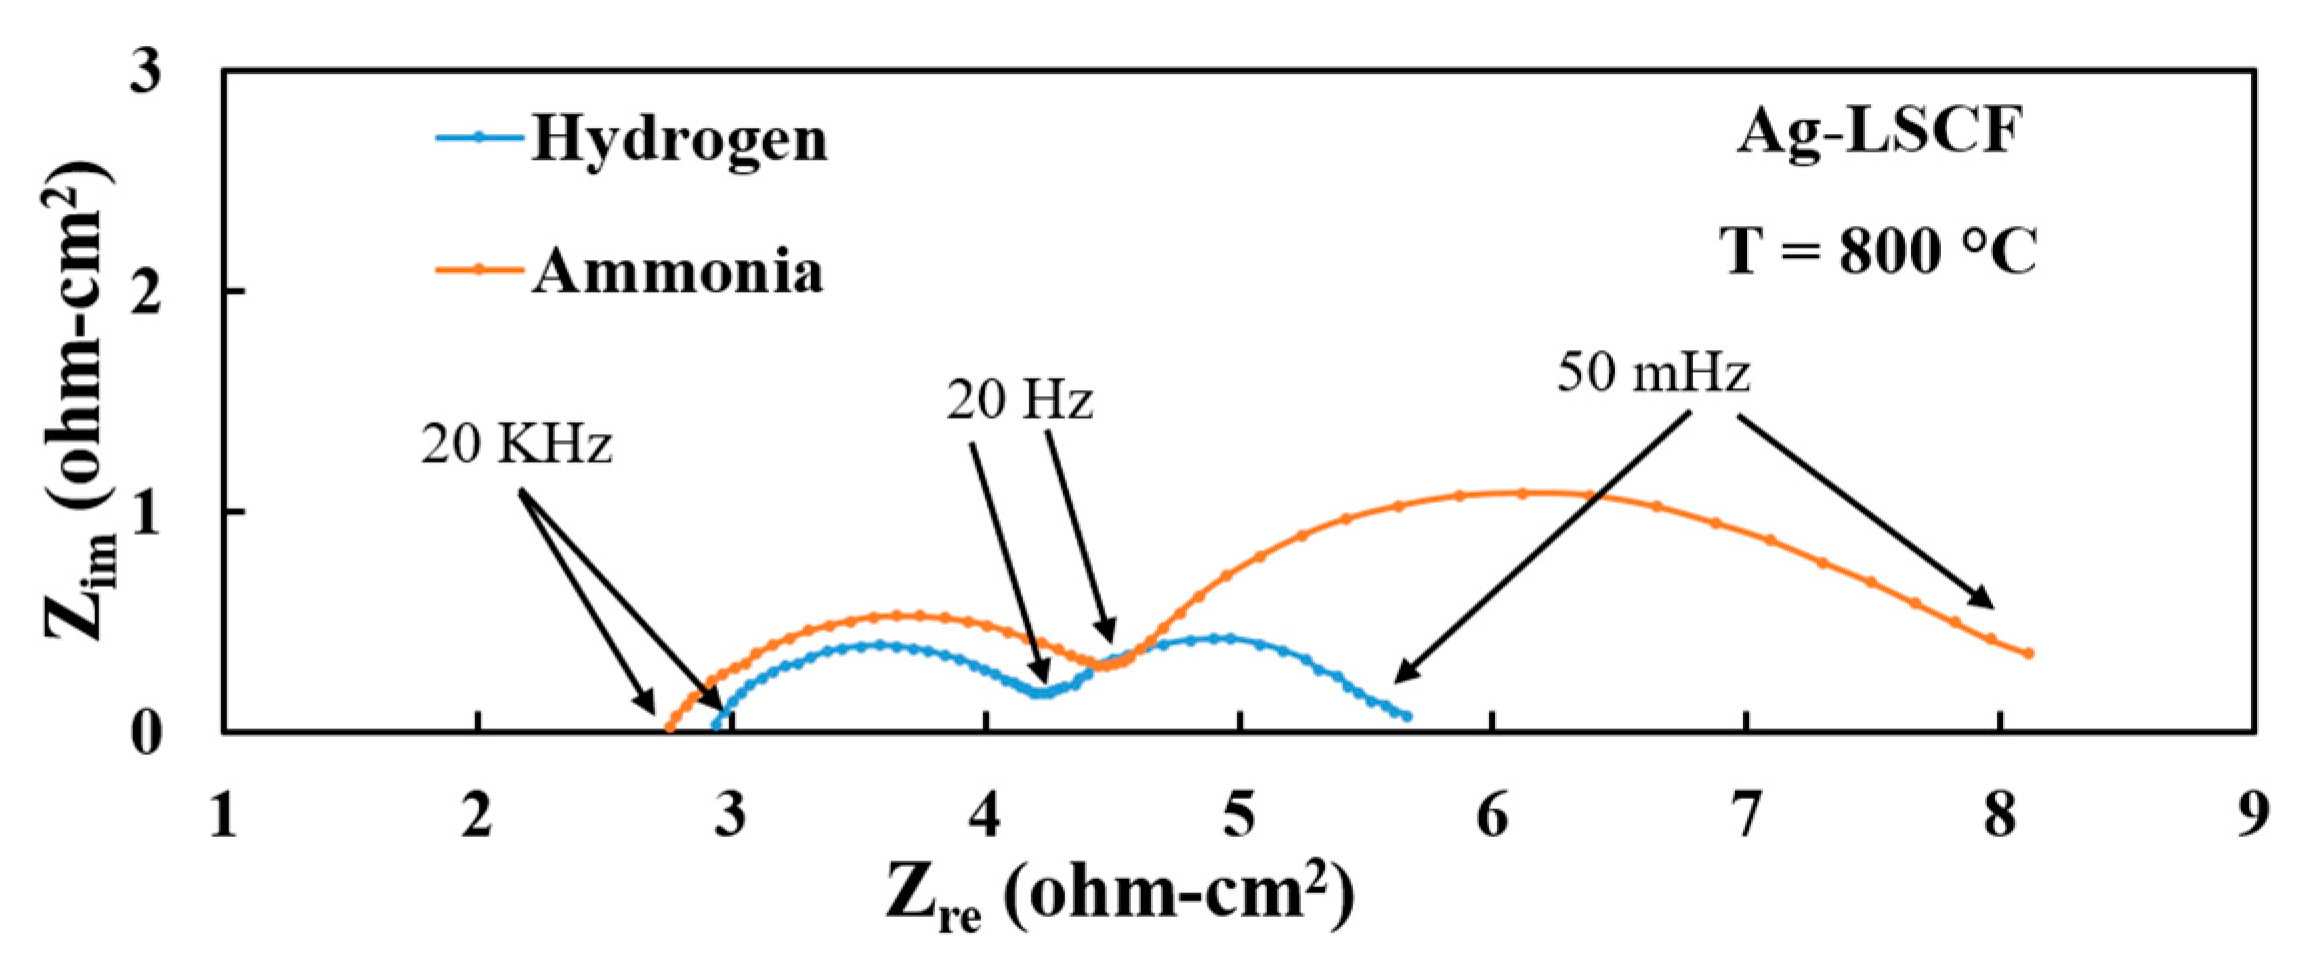
3.3. Electrode Performances with Hydrogen Fuel

Figure 7 compares the current density-voltage-power density (I-V-P) curves for both Ag-LSCF and Pd-Ag-LSCF anodes with dry hydrogen fuel. It was observed that the maximum power density was improved by almost 20%, to 73 mW/cm2 from 59 mW/cm2, with Pd infiltration. The comparison of EIS spectra (Figure 8) reveals differences in both ohmic as well as polarisation resistances of the cell, with both being higher for the Ag-LSCF cell without Pd infiltration. For both electrodes, the EIS seems to consist of at least two distinguishable arcs, labelled as high frequency (HF) and low frequency (LF). These two arcs encompass the polarisation resistance from both the anode and cathode.
The contribution of the LSCF cathode to the EIS of the cell must be negligible, as demonstrated in our previous study [20]. Thus, the two arcs in both the Ag-LSCF and Pd-Ag-LSCF electrodes can be attributed to anode processes including diffusion, charge transfer, gas adsorption/desorption and hydrogen splitting on the MIEC electrode surface, as well as the electrolyte/electrode interface. The fitting of the EIS spectra to simple resistor capacitor or resistor-constant phase element circuits led to significant errors with and without additional diffusion elements, such as Warburg impedance, perhaps due to the relatively large area of the cell and inherent noise level in the data. It is acknowledged that although the spectra are divided into two discernible arcs, the shape and magnitude of the arcs could be associated with more than two electrode processes, which could be engulfed into these arcs but are not resolved in the current work. We used a simple resistor-constant phase element for each arc using the instant fit option in Z-view without resolving the arc any further.
The difference in ohmic resistance for both electrodes is surprising, as the addition of palladium in small amounts is unlikely to affect it. It should be noted that, for both cells, the electrolyte disk was fabricated from the same batch. Thus, differences could be attributed to the variations in cell fabrication arising due to manual brush coating of the electrodes. Such a difference in ohmic resistance (0.5 Ω-cm2) could be significant at higher current densities typically observed with electrode-supported cells; however, at low current densities, for the 3YSZ electrolyte-supported cells this difference is expected to have an insignificant effect on the power density. On the other hand, the difference in polarisation resistance is more conspicuous, with polarisation resistance reduced to almost half with the addition of palladium. Both low-frequency and high-frequency arcs seem to be reduced in magnitude. This can be attributed to the so-called hydrogen spill-over effect over the electrode-supported Pd particles, as elucidated in previous research studies [21].

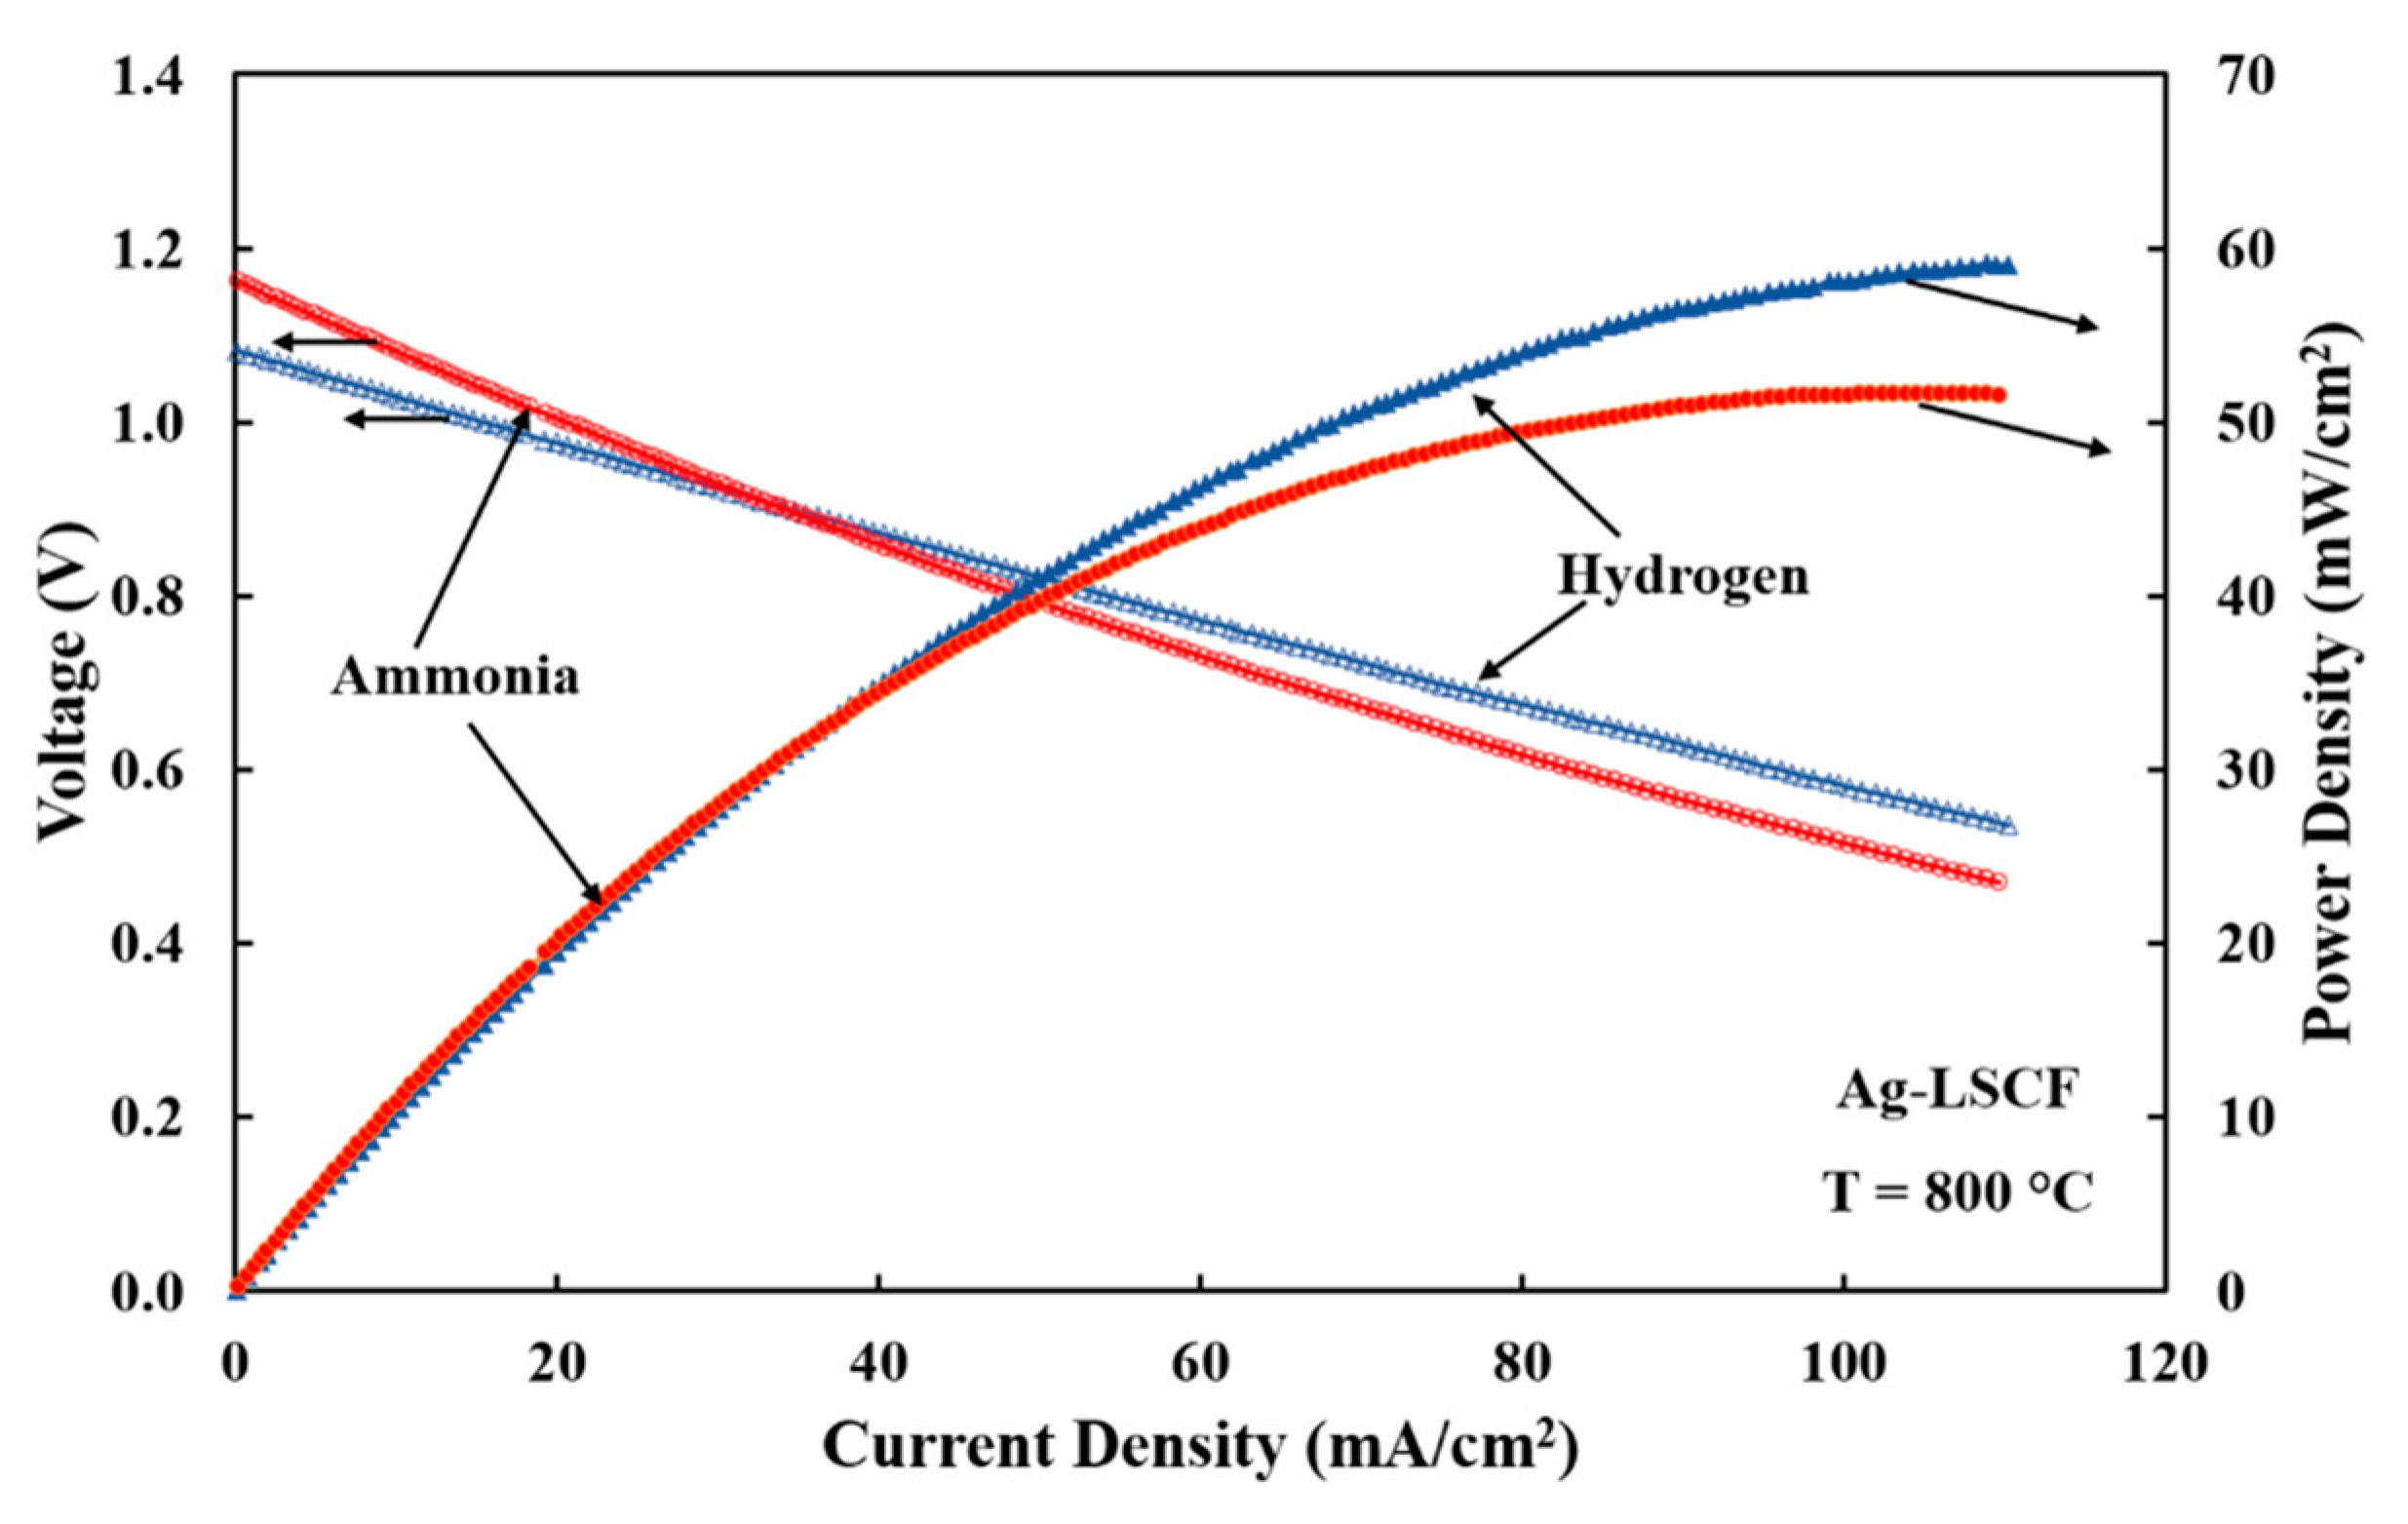
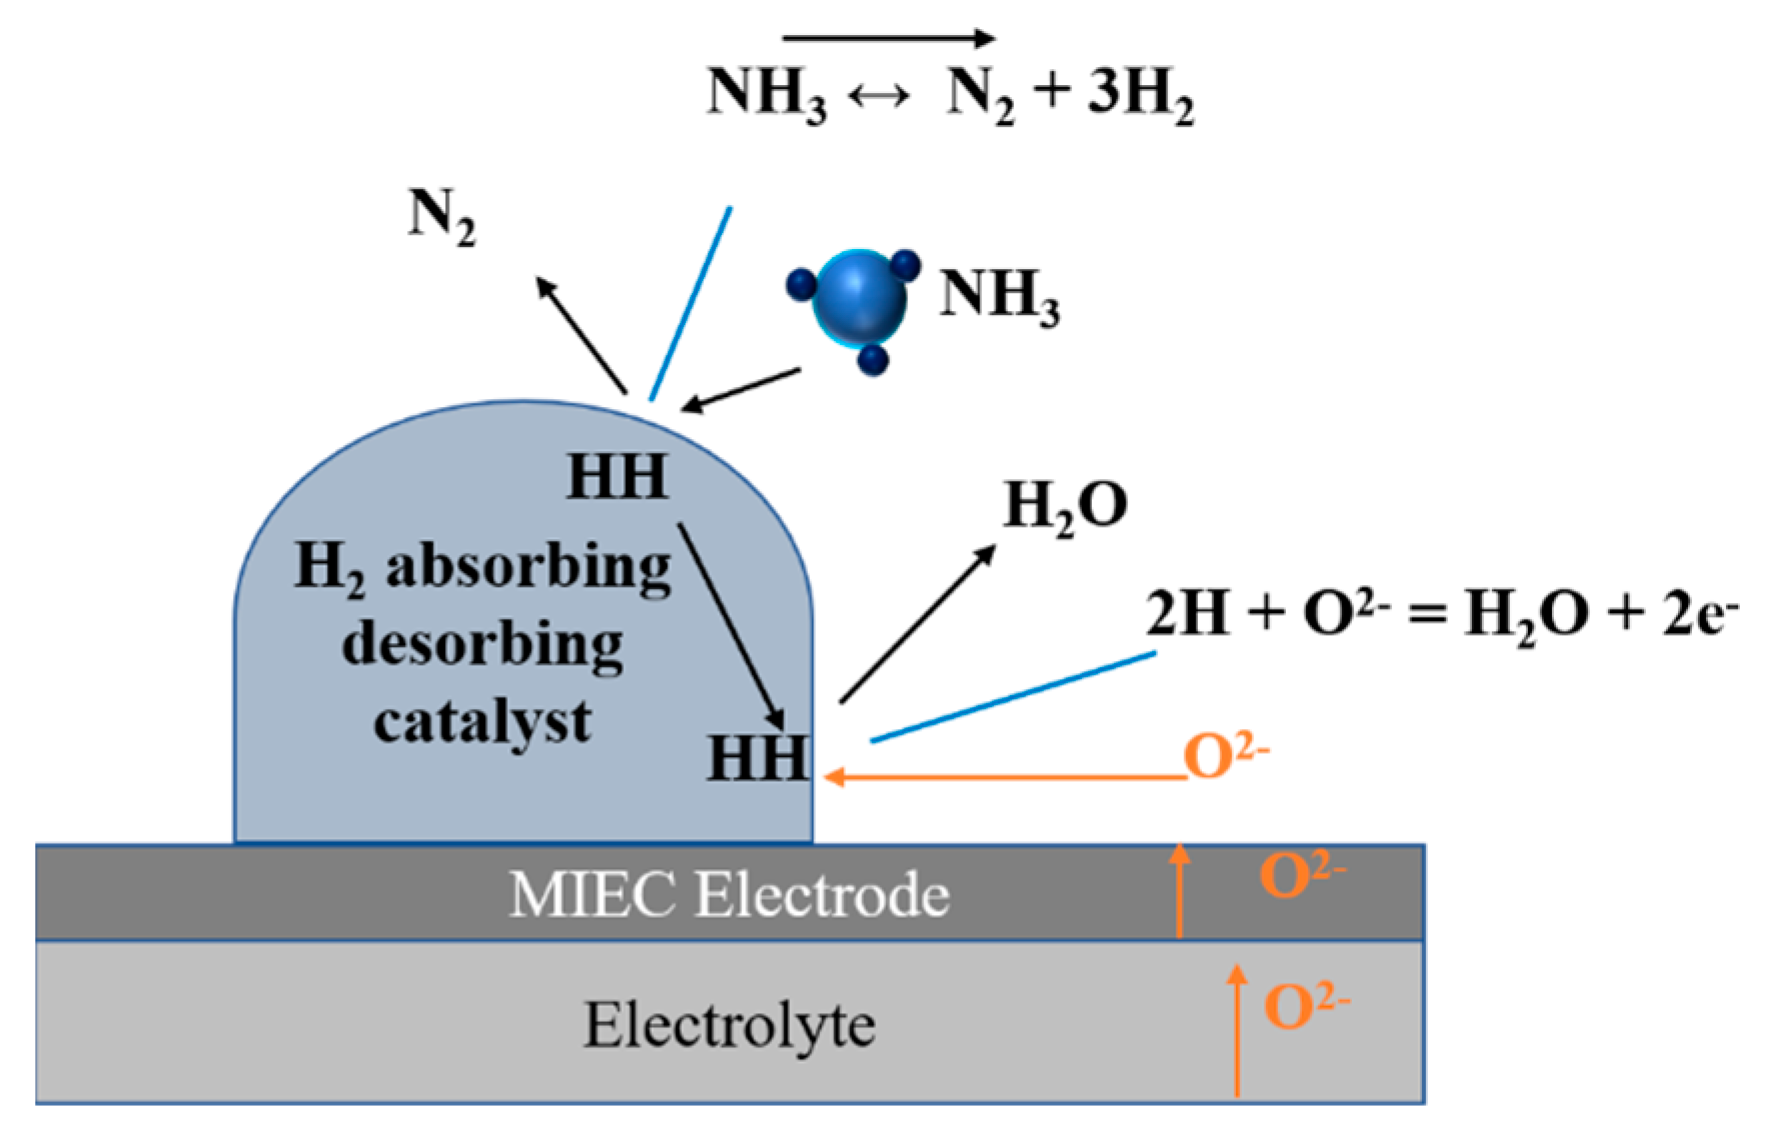
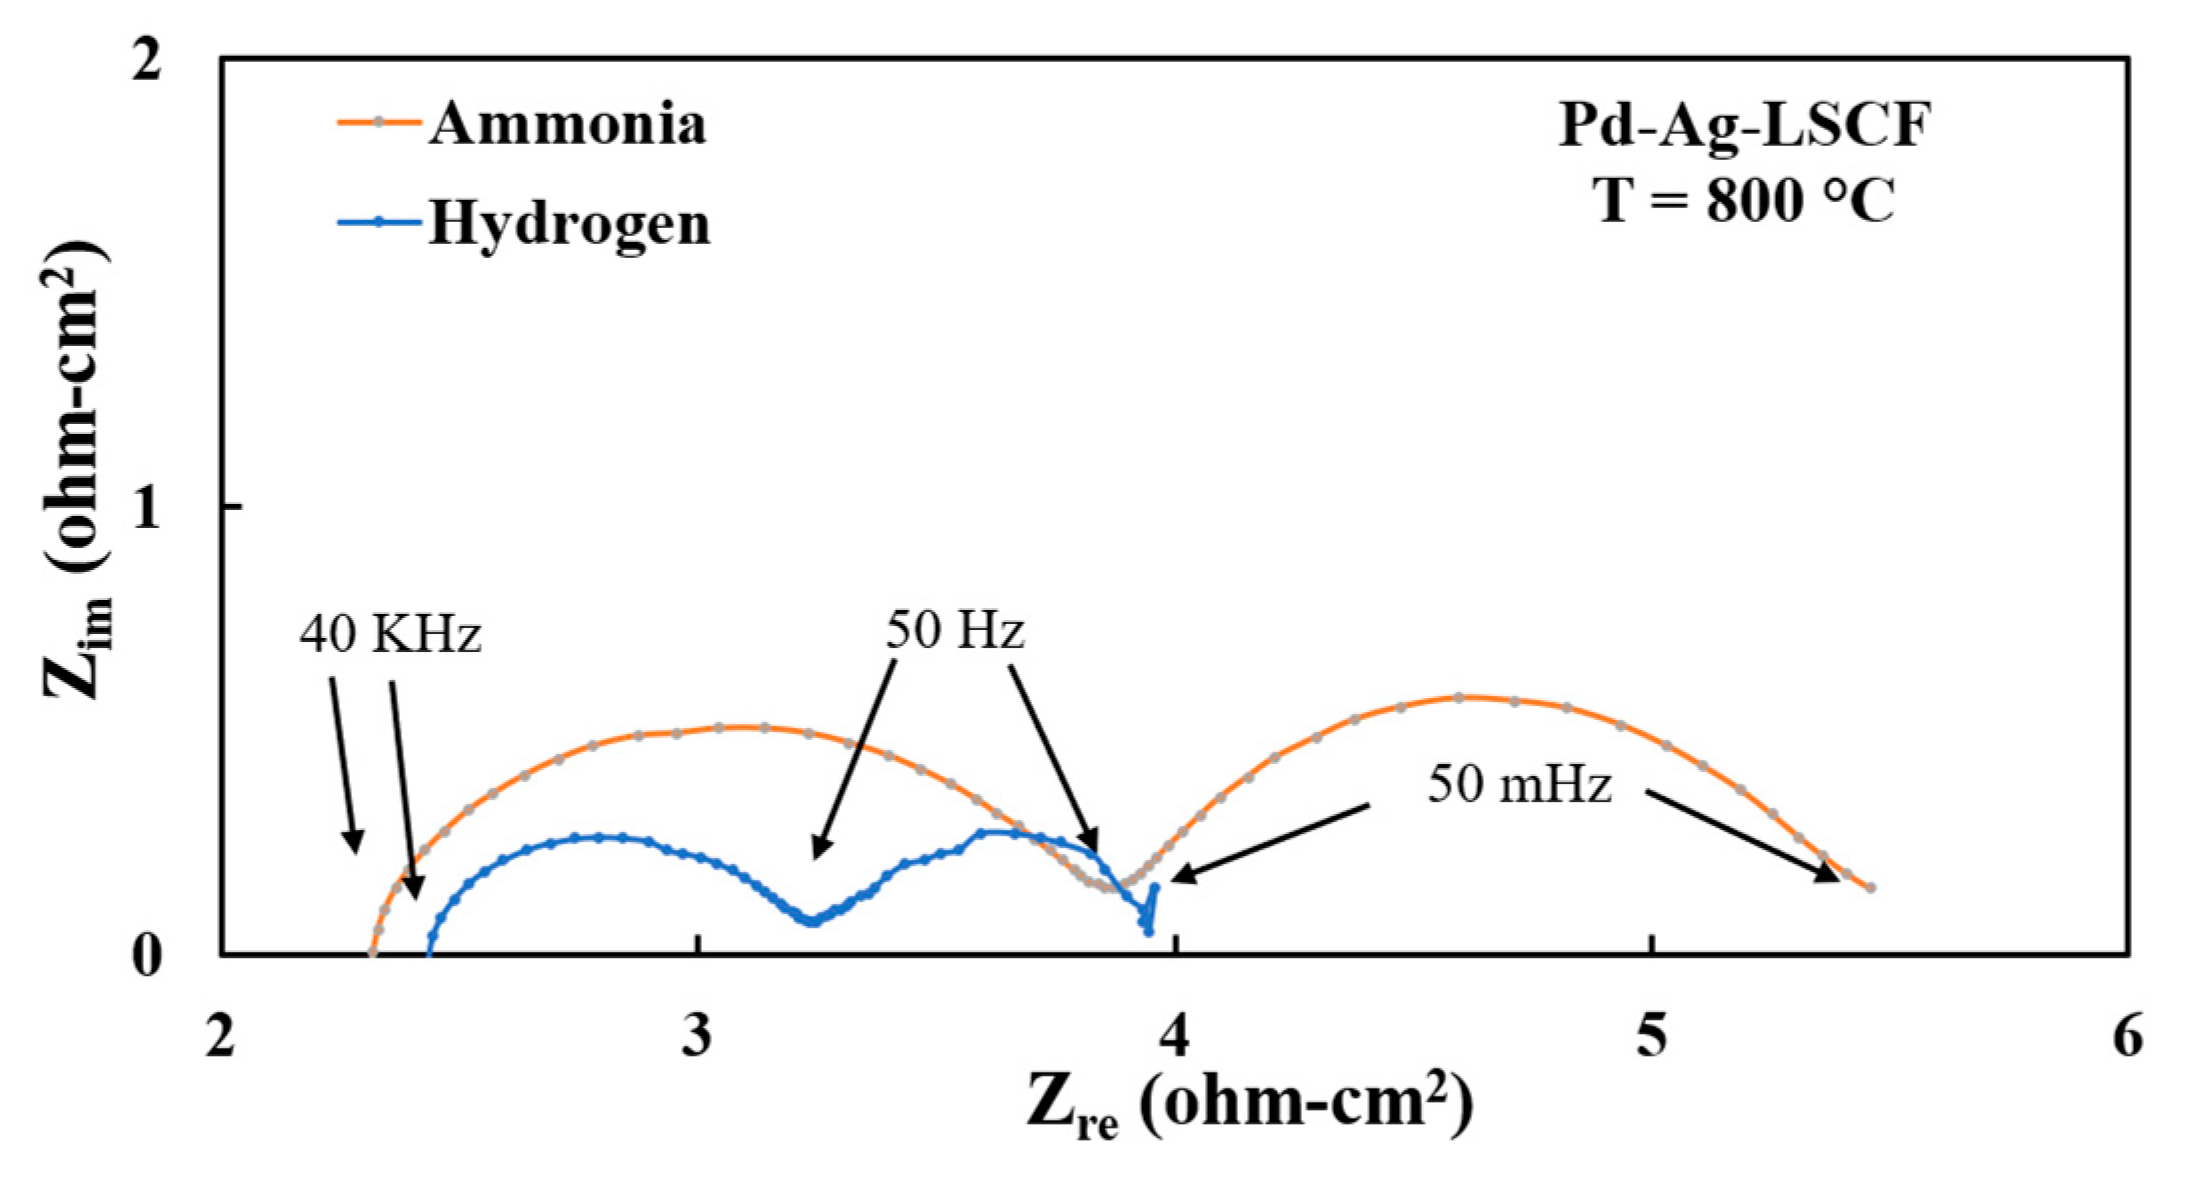
3.4. Electrode Performances with Ammonia Fuel

Figure 9 shows the I-V-P curve for the cell with the Ag-LSCF electrode when anode gas is switched from hydrogen to ammonia. The data for hydrogen are also replotted for direct comparison. The OCV with ammonia fuel was about 1.2 V, while for hydrogen it was 1.06 V. The maximum power density achieved with ammonia was about 51 mW/cm2, which is lower by 15% than that achieved with hydrogen fuel. The polarisation curves for both fuels appear to be dominated by resistive losses, which is typical of an electrolyte-supported cell, in particular for those with a 3YSZ electrolyte. I-V curves do not show any limiting current behaviour at 800 °C.
Figure 10 shows the EIS plots for the Ag-LSCF anode with hydrogen and ammonia fuels. The polarisation resistance associated with both HF and LF arcs increased when switching the anode gas from hydrogen to ammonia. This further supports the observation that both arcs in the EIS spectra appear to be dominated by anodic processes, with only a small contribution from the cathode or air electrode. However, in comparison to HF arcs, the increase in the resistance associated with LF arcs appears to be significant. LF arc increased from 1.4 ohms-cm2 for hydrogen fuel to almost 4 ohms-cm2 for ammonia. The reaction mechanism is complicated, and it is difficult to ascribe the arcs precisely to particular anodic processes. Usually, the low-frequency arcs are associated with kinetically slower processes such as adsorption of bigger molecules or diffusion related processes. Thus, these two factors can contribute to the observed increase in the magnitude of the LF arc; however, the fact that no limiting current behaviour was observed in the I-V curve and the absence of Warburg type diffusion behaviour in EIS hints to the possibility of a slower process related to adsorption of bigger molecules.
In the current experiment, the flow rate of ammonia was 50 mL per minute, which assumes that complete cracking can produce 75 mL per minute of hydrogen. Using Faraday’s Law, a current density of up to 1 A/cm2 can be produced with this amount of hydrogen. However, the dilution effect of nitrogen may reduce the availability of the electrochemically active sites for hydrogen adsorption and subsequent oxidation reactions.
Considering the operating temperature in this work is well above the thermodynamic cracking temperature for ammonia (430 °C, 1 atm) [22], the possibility of direct electrochemical oxidation of ammonia seems counterintuitive. However, it should be noted that the degree of cracking is also dependent on reactor design and residence time of ammonia inside the reactor. Analysis of exhaust gas from an ammonia-fed SOFC can be difficult due to the presence of the steam, and a more elaborate setup will be required for gas analysis. In this instance, we analysed the product gas of the system using a pH strip indicator to test the presence of ammonia in the exhaust, and the ammonia presence in the exhaust stream was confirmed. Based upon our empirical evidence there is a large quantity of ammonia in the exit gas, suggesting that ammonia decomposition is incomplete in the current system.
Thus, an observed increase in the LF arc could be due to slower adsorption of ammonia on the electrode (rather than nitrogen) and lower electrochemical activity of the electrode for ammonia oxidation in comparison to a facile hydrogen oxidation reaction [23]. More studies providing a detailed analysis of the exit gas and with reference to the electrode over the range of temperatures will be required to analyse the exact mechanism of the reactions with ammonia fuel.
In the case of the Pd-Ag-LSCF anode, the power densities with both fuels are similar (Figure 11). The peak power density with ammonia fuel was about 73 mW/cm2 and higher by 43% in comparison with Ag-LSCF without Pd. Again, the mechanism of this enhancement is not clear, but the observation is empirical in nature. It is possible that Pd acts as a catalyst for ammonia cracking or that it leads to a faster direct electrochemical oxidation of ammonia or a combination of both these phenomena. Pd is well-known for its ability to dissolve hydrogen. In this work, it is likely that Pd removes hydrogen from ammonia by the dissolution of hydrogen into the Pd particles. Once saturated with hydrogen, the atomic hydrogen emancipated from Pd might react directly with oxygen ions readily available on the surface of the mixed ionic electronic conductor LSCF. The higher solubility and mobility of hydrogen in Pd over Ag [24] makes more adsorbed hydrogen available for electrochemical reaction at the TPB with LSCF. The performance enhancement with a Pd decorated anode catalyst can be explained by this additional supply of hydrogen from the Pd and shifting of the ammonia decomposition reaction towards the right. The proposed mechanism and reaction pathway are depicted in Figure 12. The EIS for both fuels are shown in Figure 13 under OCV conditions. The EIS shows a significant difference in the polarisation resistances, with the magnitudes of both HF and LF arcs being significantly lower for hydrogen fuel. However, actual power densities with both fuels are similar. If the total resistance obtained from the EIS for hydrogen fuel is calculated using the area-specific cell resistance and used to calculate the power density at a particular current, the data match reasonably well with the data from the I-V curve. Remarkably, in the case of ammonia, it does not match with respective I-V data. This observation indicates that, under loading conditions, the polarisation resistance associated with electrode processes with ammonia fuel may have reduced more significantly when compared with the case of pure hydrogen fuel. This could be due to a significant reduction in the energy barrier due to continual removal of atomic hydrogen from the saturated Pd catalyst by the oxidation reaction, with oxygen ions being present only under loading conditions. A detailed study will be required to elucidate the mechanism and reaction pathway. Nevertheless, the findings from this work clearly show the need for more studies on ammonia SOFCs rather than assuming cracking of ammonia at the anode. This is particularly true for non-nickel electrodes such as the one used in this work. Although the polarisation resistance increased in the case of ammonia as the fuel, the performance of the cell was similar, suggesting that the direct electro-oxidation reaction of ammonia is also a possibility. It is also possible that the consumption of ammonia in the anode is via a combined mechanism of hydrogen and ammonia electro-oxidation. The results for both the anodes are summarised in Table 2. Power densities of 63 mW/cm2 and 121 mW/cm2 have been reported at 600 °C for hydrogen and ammonia fuels with electrolyte-supported cells [25]. It has also been observed that differences in the cell performance with hydrogen and ammonia fuels decreases as the temperature increases and rate of ammonia decomposition increases. Hashinokuchi et al. [25] reported 258 mw/cm2 and 323 mW/cm2 with ammonia and hydrogen fuels, respectively, at 700 °C. Here, for the first time, to the best of our knowledge, we report the performance of a YSZ electrolyte-supported SOFC with a Ni free perovskite electrode for ammonia fuel.

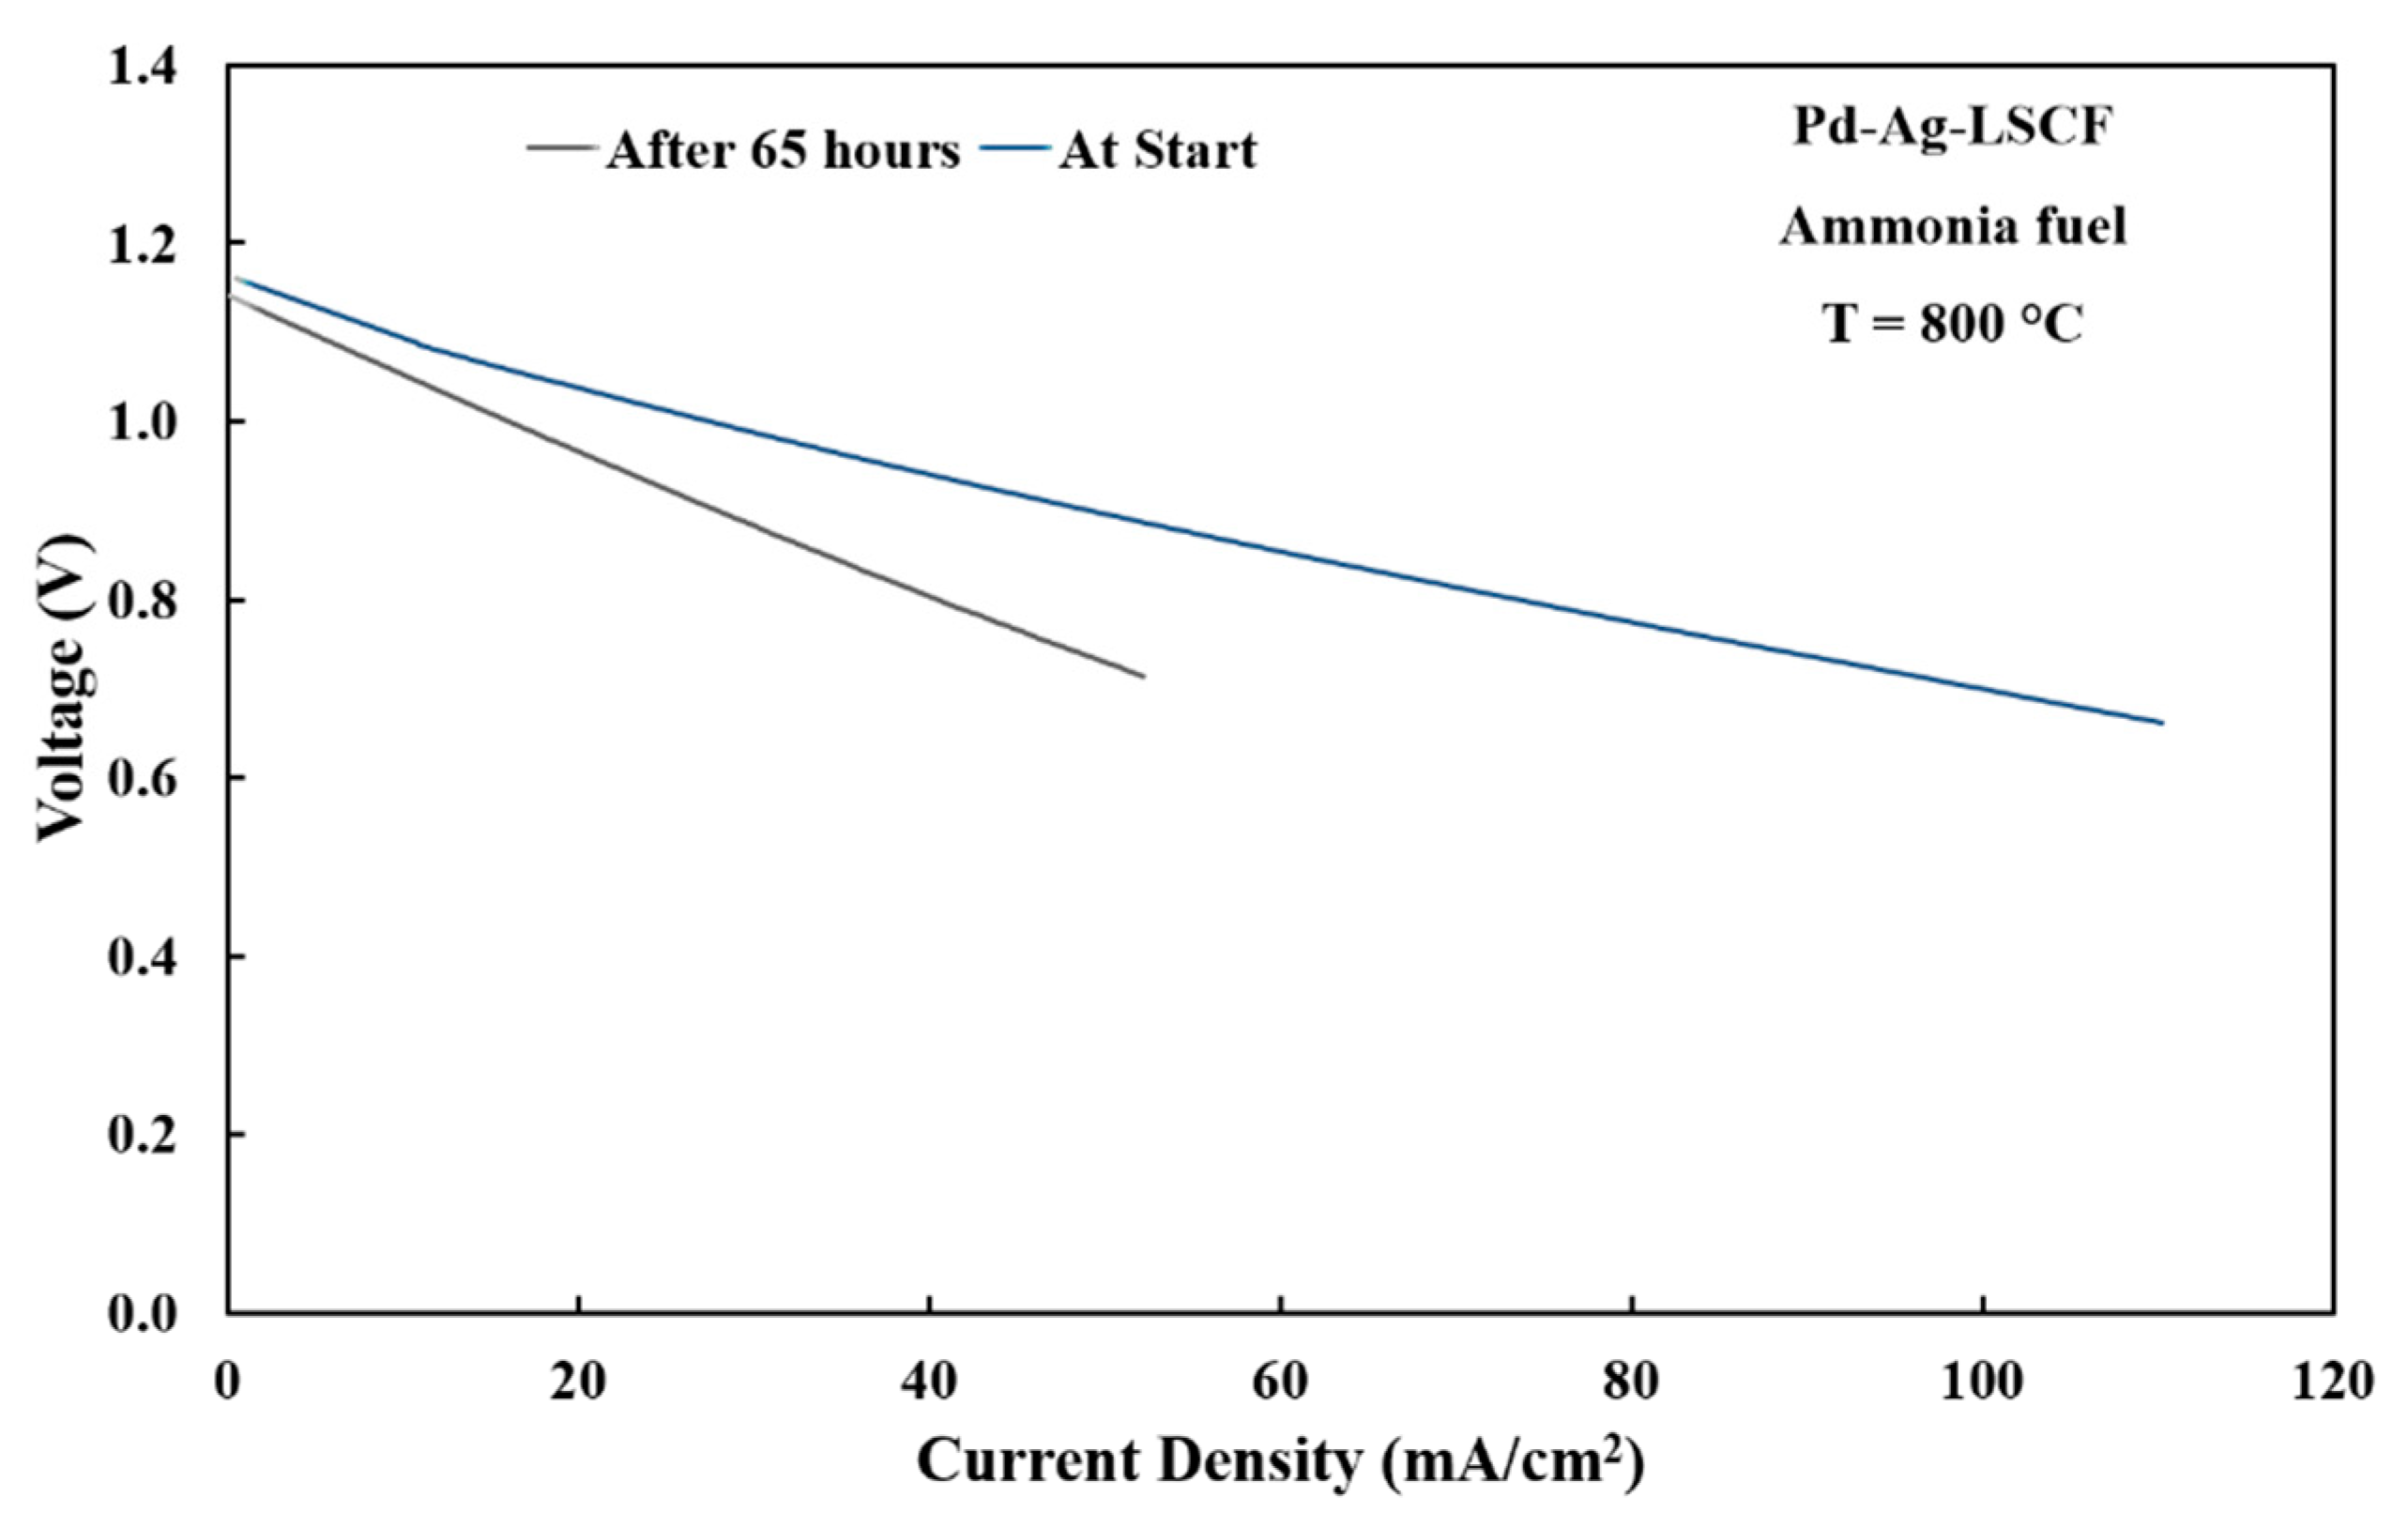
3.5. Short-Term Stability Testing of Anode Materials

After the initial investigation of both Pd-Ag-LSCF and Ag-LSCF electrodes, the cells were subjected to short-term tests with constant loading at 0.7 V for 65 h in Chronoamperometry mode. Figure 14 and Figure 15 show I-V curves of the cells before and after short-term tests, respectively, for the Ag-LSCF and Pd-Ag-LSCF electrodes. For the Pd-Ag-LSCF cell, the peak power density decreased from about 73 mW/cm2 to 37 mW/cm2 at the end of the experiment. For the cell without a Pd catalyst, the power density dropped from about 51 mW/cm2 to 33 mW/cm2. Thus, the percentage reduction for the Pd-Ag-LSCF cell was about 50%, while for Ag-LSCF it was 35%. The higher degradation rate of the Pd impregnated anode is probably due to agglomeration of Pd particles in addition to phase changes with LSCF anode in reducing atmospheres. Figure 16 shows an SEM image of the anode after short-term testing that indicates coarsening of Pd particles. Figure 17 shows the X-ray diffractogram after use. Table 3 compares the lattice parameter and phase assemblage for the fabricated electrodes before and after testing. It appears that the LSCF electrode did not completely disintegrate into separate oxides but rather the phase assemblage changed to a mixture of tetragonal and hexagonal phases. The cell performance with the Pd decorated Ag-LSCF anode material is promising; however, issues related to coarsening need to be addressed.

4. Conclusions

Planar cells with the composite electrodes Ag-LSCF and Pd-Ag-LSCF were evaluated for direct ammonia fuel cell application. The electrochemical performances of the cells with these anodes were compared for hydrogen and ammonia fuels. The trends observed with open-circuit voltages hint at the possibility of direct electrochemical oxidation at lower test temperatures. The cell performance for the Ag-LSCF electrode with ammonia fuel was found to be around 15% lower than that with hydrogen fuel. Addition of Pd particles to the anode led to an almost identical performance with ammonia and hydrogen fuels, perhaps due to hydrogen dissolution ability of Pd in combination with the hydrogen spill-over effect. A short-term stability test indicated coarsening of Pd particles, leading to a decline in the performance of the anode with additional Pd particle in combination with the phase changes associated with the LSCF anode. This study indicated the alteration in anodic reaction mechanism pathways in presence of hydrogen-absorbing materials such as palladium for direct ammonia solid oxide fuel cells, leading to enhancement of the power output of the cell. The observations in this study further confirm the need for further investigations on the electro-oxidation of ammonia in SOFCs rather than assuming a complete catalytic cracking of ammonia fuel.

Supplementary Materials

The following supplementary materials are available online at https://0-www-mdpi-com.brum.beds.ac.uk/article/10.3390/solids2020012/s1, Figure S1: SEM image of Ag-LSCF anode surface as prepared (a) and after cell operation (b). Figure S2: SE image and EDS maps of Ag-LSCF anode after test (a), SEM image and EDS maps for Pd decorated Ag-LSCF anode after test (b). Table S1: Percentage difference in maximum thermodynamic efficiency of cell with two different ammonia utilisation pathways.

Author Contributions

S.S.R. performed the experiments, data collection and writing of the article. A.P.K. provided valuable guidance and discussions for the outline and writing of this article. S.G. also provided valuable insights for the experimental work. D.F. helped in setting up the experimental equipment, performing experiments and writing of the article. A.S. helped in performing the XRD of anode materials and analysing the XRD data. All authors have read and agreed to the published version of the manuscript.

Funding

The authors gratefully acknowledge the funding support from the CSIRO Hydrogen Future Science Platform (FSP) and CSIRO Research Office.

Institutional Review Board Statement

Not applicable.

Informed Consent Statement

Not applicable.

Data Availability Statement

Data are contained within the article and supplementary materials.

Acknowledgments

We are thankful to Gary Paul and Mark Greaves for providing support in the experimental work and material characterisations, and Saheli Biswas and Gurpreet Kaur for internal review of the manuscript.

Conflicts of Interest

The authors declare that they have no known competing financial interests or personal relationships that could have influenced the work reported in this paper.

References

  1. Glenk, G.; Reichelstein, S. Economics of converting renewable power to hydrogen. Nat. Energy 2019, 4, 216–222. [Google Scholar] [CrossRef]
  2. He, T.; Pachfule, P.; Wu, H.; Xu, Q.; Chen, P. Hydrogen carriers. Nat. Rev. Mater. 2016, 1, 16059. [Google Scholar] [CrossRef]
  3. Giddey, S.; Badwal, S.P.S.; Munnings, C.; Dolan, M. Ammonia as a Renewable Energy Transportation Media. ACS Sustain. Chem. Eng. 2017, 5, 10231–10239. [Google Scholar] [CrossRef]
  4. Ma, Q.; Peng, R.; Tian, L.; Meng, G. Direct utilization of ammonia in intermediate-temperature solid oxide fuel cells. Electrochem. Commun. 2006, 8, 1791–1795. [Google Scholar] [CrossRef]
  5. Dekker, N.J.J.; Rietveld, G. Highly Efficient Conversion of Ammonia in Electricity by Solid Oxide Fuel Cells. J. Fuel Cell Sci. Technol. 2006, 3, 499–502. [Google Scholar] [CrossRef]
  6. Staniforth, J.; Ormerod, R.M. Clean destruction of waste ammonia with consummate production of electrical power within a solid oxide fuel cell system. Green Chem. 2003, 5, 606–609. [Google Scholar] [CrossRef]
  7. Ma, Q.; Ma, J.; Zhou, S.; Yan, R.; Gao, J.; Meng, G. A high-performance ammonia-fueled SOFC based on a YSZ thin-film electrolyte. J. Power Sour. 2007, 164, 86–89. [Google Scholar] [CrossRef]
  8. Liu, L.; Sun, K.; Wu, X.; Li, X.; Zhang, M.; Zhang, N.; Zhou, X. Improved performance of ammonia-fueled solid oxide fuel cell with SSZ thin film electrolyte and Ni-SSZ anode functional layer. Int. J. Hydr. Energy 2012, 37, 10857–10865. [Google Scholar] [CrossRef]
  9. Yang, J.; Molouk, A.F.S.; Okanishi, T.; Muroyama, H.; Matsui, T.; Eguchi, K. A Stability Study of Ni/Yttria-Stabilized Zirconia Anode for Direct Ammonia Solid Oxide Fuel Cells. ACS Appl. Mater. Interf. 2015, 7, 28701–28707. [Google Scholar] [CrossRef]
  10. Lan, R.; Tao, S. Ammonia as a Suitable Fuel for Fuel Cells. Front. Energy Res. 2014, 2, 35. [Google Scholar] [CrossRef] [Green Version]
  11. Kulkarni, A.; Ciacchi, F.T.; Giddey, S.; Munnings, C.; Badwal, S.P.S.; Kimpton, J.A.; Fini, D. Mixed ionic electronic conducting perovskite anode for direct carbon fuel cells. Int. J. Hydr. Energy 2012, 37, 19092–19102. [Google Scholar] [CrossRef]
  12. Kulkarni, A.P.; Giddey, S.; Badwal, S.P.S. Efficient conversion of CO2 in solid oxide electrolytic cells with Pd doped perovskite cathode on ceria nanofilm interlayer. J. CO2 Util. 2017, 17, 180–187. [Google Scholar] [CrossRef]
  13. Fisher, J.C.; Chuang, S.S.C. Investigating the CH4 reaction pathway on a novel LSCF anode catalyst in the SOFC. Catal. Commun. 2009, 10, 772–776. [Google Scholar] [CrossRef]
  14. Lai, B.-K.; Kerman, K.; Ramanathan, S. Nanostructured La0.6Sr0.4Co0.8Fe0.2O3/Y0.08Zr0.92O1.96/La0.6Sr0.4Co0.8Fe0.2O3 (LSCF/YSZ/LSCF) symmetric thin film solid oxide fuel cells. J. Power Source 2011, 196, 1826–1832. [Google Scholar] [CrossRef]
  15. Kulkarni, A.; Giddey, S.; Badwal, S.P.S. Yttria-doped ceria anode for carbon-fueled solid oxide fuel cell. J. Solid State Electrochem. 2015, 19, 325–335. [Google Scholar] [CrossRef]
  16. Giddey, S.; Kulkarni, A.; Munnings, C.; Badwal, S.P.S. Composite anodes for improved performance of a direct carbon fuel cell. J. Power Sour. 2015, 284, 122–129. [Google Scholar] [CrossRef]
  17. Kaur, G.; Kulkarni, A.P.; Giddey, S.; Badwal, S.P.S. Ceramic composite cathodes for CO2 conversion to CO in solid oxide electrolysis cells. Appl. Energy 2018, 221, 131–138. [Google Scholar] [CrossRef]
  18. Akimoto, W.; Saito, M.; Inaba, M.; Yoshida, H.; Inagaki, T. The Mechanism of Ammonia Oxidation at Ni-Fe-SDC Anode in Ammonia-Fueled SOFCs. ECS Trans. 2013, 57, 1639–1645. [Google Scholar] [CrossRef]
  19. Winkler, W.; Nehter, P. Thermodynamics of Fuel Cells. In Modeling Solid Oxide Fuel Cells: Methods, Procedures and Techniques; Bove, R., Ubertini, S., Eds.; Springer: Dordrecht, The Netherlands, 2008; pp. 13–50. [Google Scholar]
  20. Clarke, R.E.; Kulkarni, A.; Giddey, S.; Badwal, S.P.S. Evaluation of solid electrolyte cells with a versatile electrochemical technique. Ionics 2013, 19, 265–275. [Google Scholar] [CrossRef]
  21. Babaei, A.; Jiang, S.P. Analysis of fuel oxidation reaction steps in Ni/GDC anode electrode of solid oxide fuel cells by using palladium nanoparticles. In Proceedings of the Southeast Asian International Advances in Micro/Nano-technology, Bangkok, Thailand, 19 May 2010. [Google Scholar]
  22. Kalinci, Y.; Dincer, I. Analysis and performance assessment of NH3 and H2 fed SOFC with proton-conducting electrolyte. Int. J. Hydr. Energy 2018, 43, 5795–5807. [Google Scholar] [CrossRef]
  23. Akimoto, W.; Fujimoto, T.; Saito, M.; Inaba, M.; Yoshida, H.; Inagaki, T. Ni–Fe/Sm-doped CeO2 anode for ammonia-fueled solid oxide fuel cells. Solid State Ionics 2014, 256, 1–4. [Google Scholar] [CrossRef]
  24. Lewis, F.A. Solubility of hydrogen in metals. Pure Appl. Chem. 1990, 62, 2091–2096. [Google Scholar] [CrossRef] [Green Version]
  25. Hashinokuchi, M.; Zhang, M.; Doi, T.; Inaba, M. Enhancement of anode activity and stability by Cr addition at Ni/Sm-doped CeO2 cermet anodes in NH3-fueled solid oxide fuel cells. Solid State Ionics 2018, 319, 180–185. [Google Scholar] [CrossRef]
Figure 1. Electrolyte-supported cell and coated anode with an active area of 10.17 cm2.
Solids 02 00012 g001
Figure 2. Schematic diagram of Fiaxell fuel-cell setup and assembly.
Solids 02 00012 g002
Figure 3. SEM image of Pd infiltrated Ag-LSCF anode surface before testing.
Solids 02 00012 g003
Figure 4. EDS map of Pd, Ag, Fe distribution and SEM image of Pd infiltrated Ag-LSCF anode surface before testing.
Solids 02 00012 g004
Figure 5. X-ray diffractograms collected from the Pd infiltrated Ag-LSCF anode surface before testing (LSCF PDF 04-019-6360, YSZ PDF 04-016-2113 and, Ag PDF 00-004-0783).
Solids 02 00012 g005
Figure 6. Experimental OCV of Ag-LSCF//YSZ//GDC/LSCF cell with dry hydrogen and ammonia fuels as a function of temperature.
Solids 02 00012 g006
Figure 7. Voltage-current-power density characteristics with hydrogen as a fuel for Ag-LSCF//YSZ//GDC/LSCF cell and Pd-Ag-LSCF//YSZ//GDC/LSCF cell (hydrogen = 75 mL/min, air = 75 mL/min) at 800 °C.
Solids 02 00012 g007
Figure 8. Electrochemical impedance spectra for Ag-LSCF//YSZ//GDC/LSCF cell and Pd-Ag-LSCF//YSZ//GDC/LSCF cell with hydrogen fuel (hydrogen = 75 mL/min, air = 75 mL/min) at 800 °C.
Solids 02 00012 g008
Figure 9. Voltage-current-power density characteristics of Ag-LSCF//YSZ//GDC/LSCF cell with hydrogen (hydrogen = 75 mL/min, air = 75 mL/min) and ammonia fuels (ammonia = 50 mL/min, air = 75 mL/min) at 800 °C.
Solids 02 00012 g009
Figure 10. Electrochemical impedance spectra for Ag-LSCF//YSZ//GDC/LSCF ESC with hydrogen (hydrogen = 75 mL/min, air = 75 mL/min) and ammonia fuels (ammonia = 50 mL/min, air = 75 mL/min) at 800 °C.
Solids 02 00012 g010
Figure 11. V-I-P for Pd-Ag-LSCF//YSZ//GDC/LSCF cell with hydrogen (hydrogen = 75 mL/min, air = 75 mL/min) and ammonia fuels (ammonia = 50 mL/min, air = 75 mL/min) °C.
Solids 02 00012 g011
Figure 12. Schematic of the proposed anode reaction mechanism showing the hydrogen absorption and shift of ammonia cracking reaction towards the right.
Solids 02 00012 g012
Figure 13. EIS for Pd-Ag-LSCF//YSZ//GDC/LSCF cell with hydrogen (hydrogen = 75 mL/min, air = 75 mL/min) and ammonia fuels (ammonia = 50 mL/min, air = 75 mL/min).
Solids 02 00012 g013
Figure 14. Voltage-current density characteristics of Ag-LSCF//YSZ//GDC/LSCF cell before and after 70 h of operation with ammonia fuel (ammonia = 50 mL/min, air = 75 mL/min) at 800 °C.
Solids 02 00012 g014
Figure 15. Voltage–current density characteristics of Pd-Ag-LSCF//YSZ//GDC/LSCF cell before and after 65 h of operation with ammonia fuel (ammonia = 50 mL/min, air = 75 mL/min) at 800 °C.
Solids 02 00012 g015
Figure 16. SEM image of Pd infiltrated Ag-LSCF anode surface after testing.
Solids 02 00012 g016
Figure 17. X-ray diffractograms collected from the Pd infiltrated Ag-LSCF anode surface after testing (LSCF PDF 04-019-6360, YSZ PDF 04-016-2113 and, Ag PDF 00-004-0783).
Solids 02 00012 g017
Table 1. Cell EMF for hydrogen and ammonia fuels.
Temperature (°C)Hydrogen FuelAmmonia Fuel
ΔG (KJ/mol)E° (V)ΔG (KJ/mol)E° (V)
500−204.931.06−342.941.18
600−199.541.03−346.141.20
700−194.061.00−349.861.21
800−188.520.98−353.261.22
Table 2. Results summarised for Ag-LSCF and Pd-Ag-LSCF anodes.
ElectrodeFuelRLF(Ω-cm2)RHF(Ω-cm2)RE(Ω-cm2)Peak Power Density(mW/cm2)
Ag-LSCFHydrogen5.664.252.9359
Ammonia8.114.542.7651
Pd-Ag-LSCFHydrogen4.033.102.4273
Ammonia5.463.972.3273
Table 3. Phase parameters and phases found in Pd-Ag-LSCF anode before and after test.
ElectrodePhasea-Parameter (Å)c-Parameter (Å)wt%
Pd-Ag-LSCF anode before testSilver--50 ± 1
Hexagonal LSCF5.48 ± 0.00113.502 ± 0.00350 ± 1
Pd-Ag-LSCF anode after testSilver--45 ± 6
Hexagonal LSCF5.511 ± 0.0213.65 ± 0.0815 ± 8
Tetragonal LSCF3.875 ± 0.00212.72 ± 0.0140 ± 6
Publisher’s Note: MDPI stays neutral with regard to jurisdictional claims in published maps and institutional affiliations.

