Single-Subject Analyses Reveal Altered Performance and Muscle Activation during Vertical Jumping


Abstract
:1. Introduction
2. Experimental Section
2.1. Subjects
2.2. Procedures
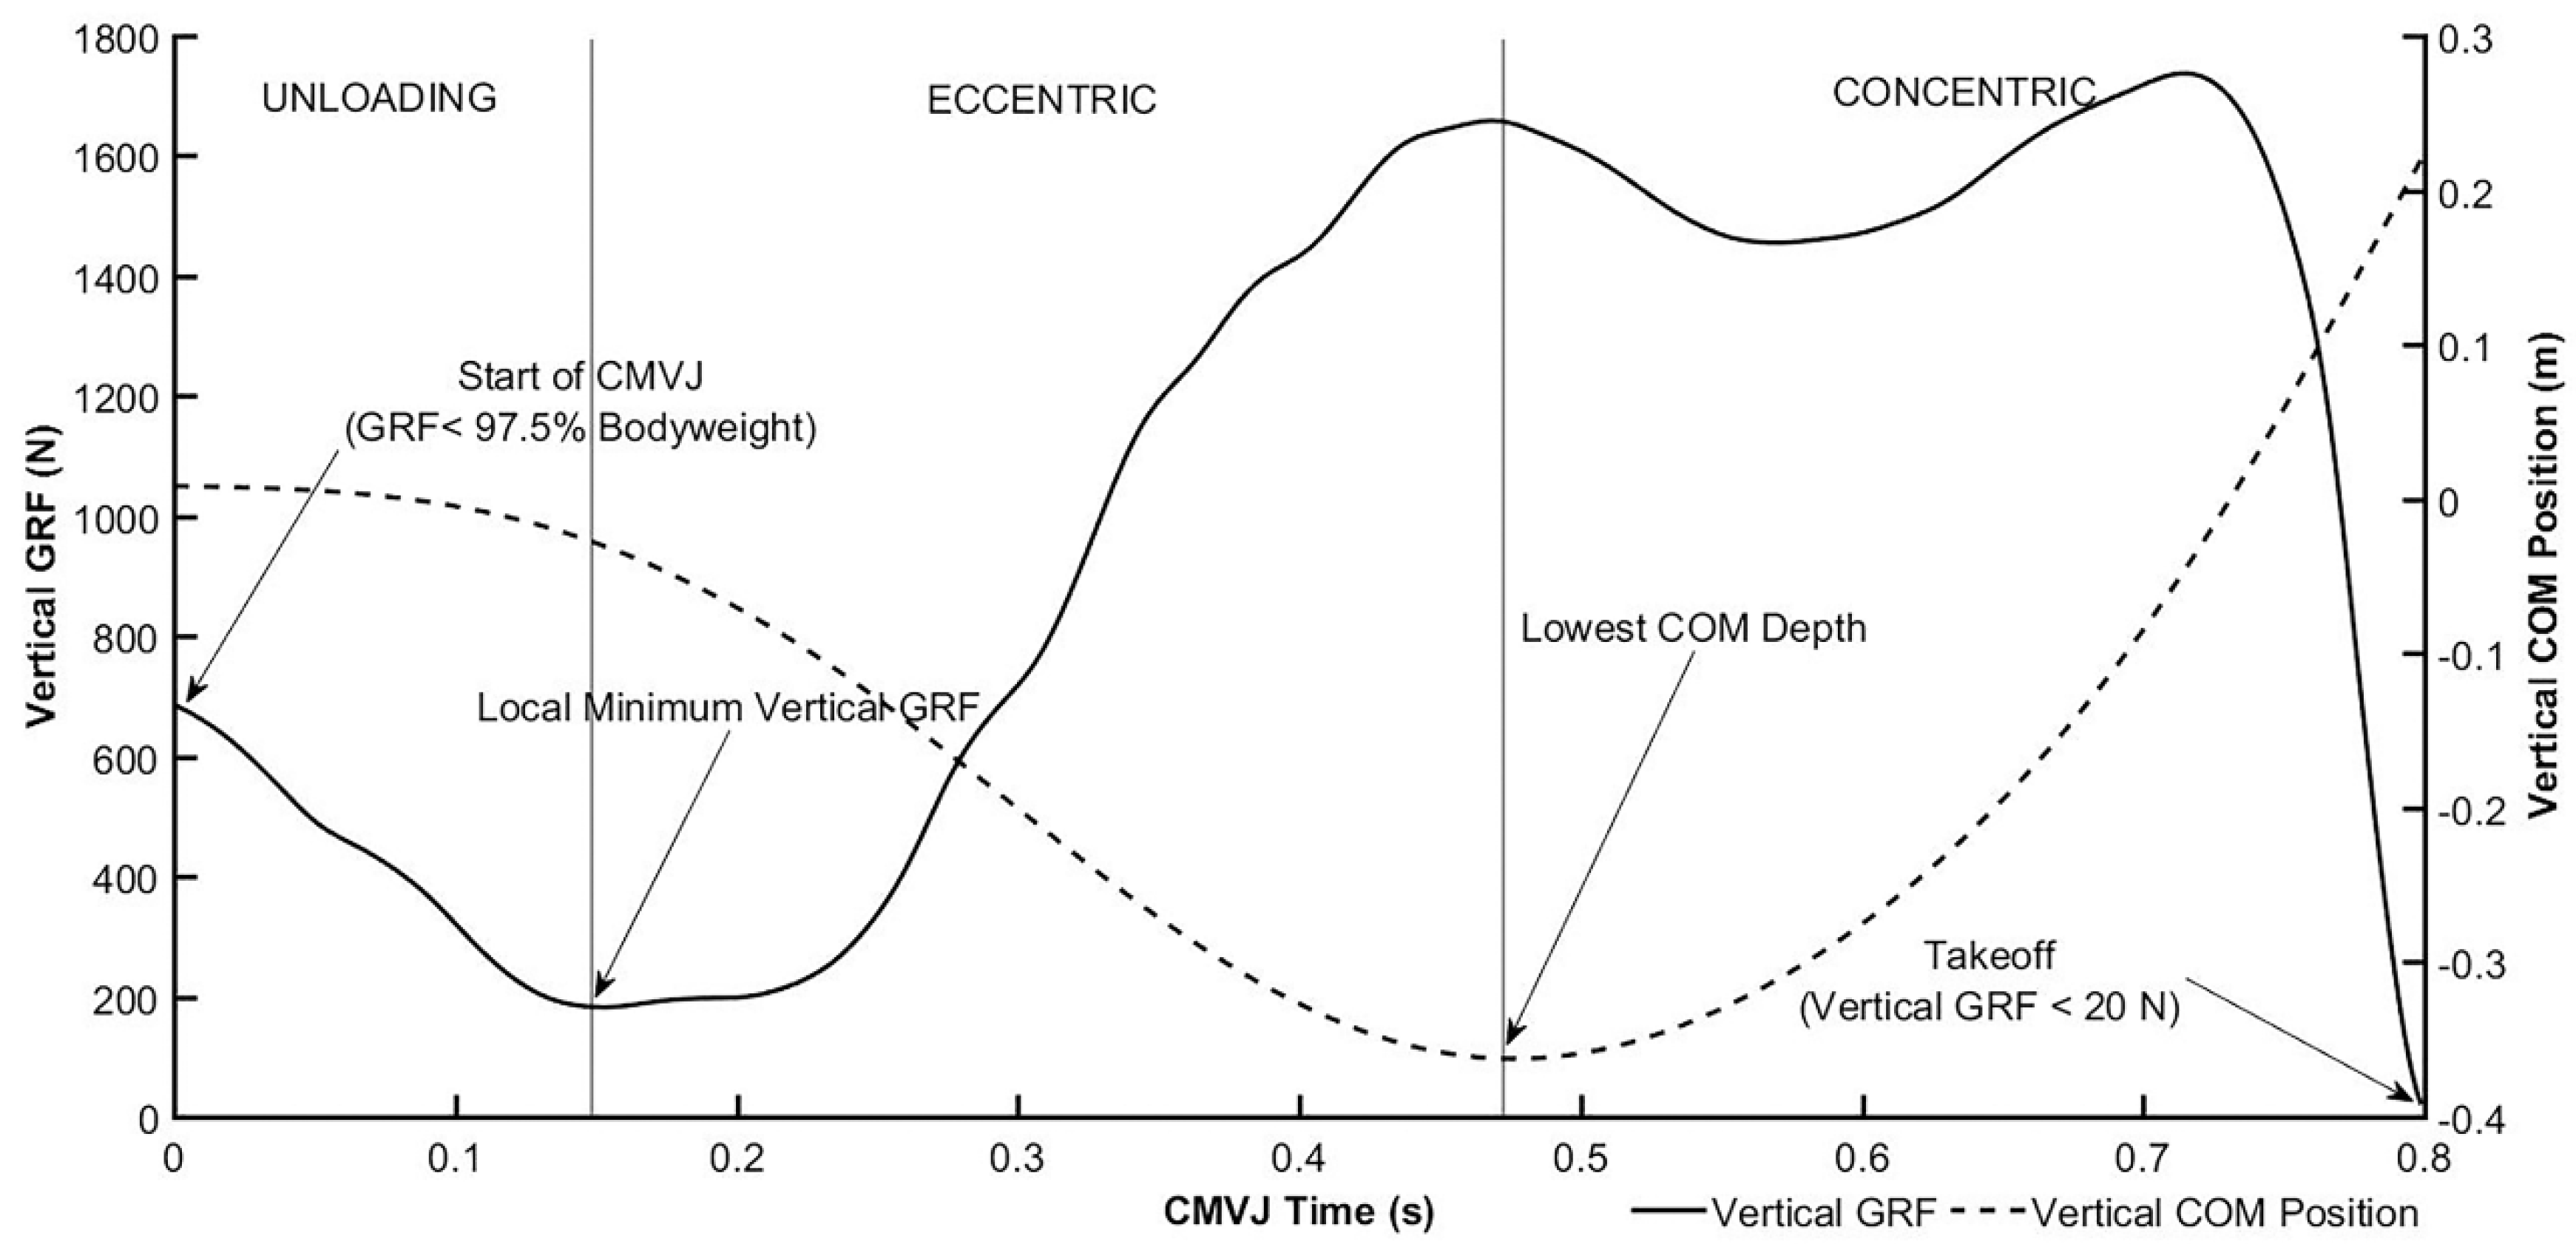
2.3. Data Processing
2.4. Statistical Analysis
3. Results
4. Discussion
5. Conclusions
Author Contributions
Funding
Institutional Review Board Statement
Informed Consent Statement
Data Availability Statement
Conflicts of Interest
Appendix A

| Participant | CMVJ Displacement | Net Impulse | ||||||||||
|---|---|---|---|---|---|---|---|---|---|---|---|---|
| Barefoot | Conventional | Minimal | Barefoot | Conventional | Minimal | |||||||
| Mean | SD | Mean | SD | Mean | SD | Mean | SD | Mean | SD | Mean | SD | |
| 1 | 0.41 | 0.02 | 0.41 | 0.02 | 0.40 | 0.02 | 242.07 | 4.68 | 246.50 | 5.28 | 240.60 | 6.13 |
| 2 | 0.39 | <0.01 | 0.39 | <0.01 | 0.43 B | 0.03 | 201.83 | 0.47 | 204.35 B | 0.14 | 211.27 B,C | 5.23 |
| 3 | 0.37 | 0.04 | 0.36 | <0.01 | 0.37 | 0.03 | 247.61 | 13.54 | 245.16 | 0.62 | 247.61 | 8.49 |
| 4 | 0.37 | 0.08 | 0.33 | 0.12 | 0.42 | 0.12 | 229.39 | 19.35 | 218.36 | 38.41 | 241.76 | 28.97 |
| 5 | 0.34 | 0.00 | 0.33 | 0.01 | 0.35 | 0.02 | 197.64 | 0.59 | 196.03 | 2.73 | 199.80 | 4.18 |
| 6 | 0.54 M,C | 0.02 | 0.48 | 0.01 | 0.50 C | 0.01 | 244.99 M,C | 4.52 | 235.58 | 1.82 | 237.77 | 0.61 |
| 7 | 0.49 M,C | 0.01 | 0.45 | 0.01 | 0.42 | 0.03 | 224.33 M,C | 3.27 | 218.36 | 3.33 | 211.09 | 6.65 |
| 8 | 0.27 | 0.01 | 0.27 | 0.02 | 0.25 | 0.02 | 212.54 | 6.15 | 214.42 | 7.38 | 207.19 | 6.80 |
| 9 | 0.58 | 0.01 | 0.60 B | 0.01 | 0.59 | 0.01 | 270.10 | 3.35 | 275.31 B,M | 1.00 | 271.36 | 1.70 |
| 10 | 0.79 M,C | 0.14 | 0.57 | 0.06 | 0.60 | 0.01 | 308.15 M,C | 21.00 | 273.75 | 12.77 | 280.56 | 0.96 |
| 11 | 0.33 | 0.05 | 0.34 | 0.01 | 0.35 | 0.02 | 252.59 | 17.57 | 256.34 | 3.29 | 260.67 | 6.02 |
| 12 | 0.55 | 0.02 | 0.79 B,M | 0.14 | 0.56 | 0.04 | 241.54 | 4.17 | 308.15 B,M | 21.00 | 245.70 | 6.50 |
| 13 | 0.46 | 0.10 | 0.46 | 0.06 | 0.42 | 0.05 | 281.92 | 22.25 | 283.42 | 11.75 | 274.10 | 9.71 |
| 14 | 0.37 | 0.02 | 0.36 | 0.01 | 0.35 | 0.05 | 222.61 | 4.47 | 222.06 | 2.75 | 219.77 | 11.23 |
| 15 | 0.39 | 0.02 | 0.37 | 0.02 | 0.40 C | 0.01 | 219.61 | 4.61 | 215.22 | 4.36 | 222.97 C | 3.11 |
| Group | 0.44 | 0.13 | 0.43 | 0.13 | 0.43 | 0.10 | 239.79 | 30.04 | 240.87 | 32.72 | 238.15 | 25.80 |
| Participant | Unloading Time | Eccentric Time | Concentric Time | Jump Time | ||||||||||||||||||||
|---|---|---|---|---|---|---|---|---|---|---|---|---|---|---|---|---|---|---|---|---|---|---|---|---|
| Barefoot | Conventional | Minimal | Barefoot | Conventional | Minimal | Barefoot | Conventional | Minimal | Barefoot | Conventional | Minimal | |||||||||||||
| Mean | SD | Mean | SD | Mean | SD | Mean | SD | Mean | SD | Mean | SD | Mean | SD | Mean | SD | Mean | SD | Mean | SD | Mean | SD | Mean | SD | |
| 1 | 0.25 | 0.1 | 0.26 | 0.05 | 0.27 | 0.05 | 0.29 | 0.11 | 0.27 | 0.02 | 0.22 | 0.06 | 0.21 | 0.00 | 0.23 B | 0.01 | 0.23 B | 0.01 | 0.75 | 0.03 | 0.75 | 0.04 | 0.73 | 0.08 |
| 2 | 0.26 | 0.15 | 0.17 | 0.01 | 0.15 | 0.03 | 0.49 | 0.14 | 0.44 | 0.02 | 0.45 | 0.08 | 0.32 | 0.03 | 0.33 | 0.02 | 0.31 | 0.01 | 1.07 M,C | 0.02 | 0.94 | 0.04 | 0.90 | 0.04 |
| 3 | 0.71 M,C | 0.05 | 0.28 | 0.24 | 0.22 | 0.03 | 0.10 | 0.00 | 0.30 | 0.18 | 0.41 B | 0.12 | 0.18 | 0.01 | 0.21 | 0.05 | 0.34 | 0.14 | 1.00 C | 0.06 | 0.79 | 0.06 | 0.97 C | 0.07 |
| 4 | 0.45 | 0.37 | 0.55 M | 0.25 | 0.06 | 0.10 | 0.30 | 0.14 | 0.26 | 0.05 | 0.17 | 0.30 | 0.29 | 0.07 | 0.27 | 0.03 | 0.67 | 0.36 | 1.04 | 0.29 | 1.09 | 0.27 | 0.90 | 0.03 |
| 5 | 0.20 | 0.02 | 0.20 | 0.04 | 0.18 | 0.02 | 0.24 | 0.04 | 0.27 | 0.04 | 0.25 | 0.02 | 0.28 | 0.01 | 0.27 | 0.00 | 0.29 C | 0.00 | 0.72 | 0.02 | 0.74 | 0.05 | 0.72 | 0.02 |
| 6 | 0.27 | 0.09 | 0.25 | 0.09 | 0.31 | 0.15 | 0.28 | 0.02 | 0.29 M | 0.02 | 0.25 | 0.02 | 0.26 M | 0.00 | 0.26 M | 0.02 | 0.23 | 0.01 | 0.81 | 0.08 | 0.79 | 0.06 | 0.79 | 0.15 |
| 7 | 0.17 | 0.04 | 0.15 | 0.02 | 0.14 | 0.03 | 0.35 | 0.05 | 0.36 | 0.05 | 0.41 | 0.07 | 0.29 | 0.02 | 0.30 | 0.04 | 0.31 | 0.03 | 0.81 | 0.04 | 0.81 | 0.10 | 0.85 | 0.07 |
| 8 | 0.15 | 0.03 | 0.13 | 0.03 | 0.15 | 0.05 | 0.29 | 0.03 | 0.27 | 0.02 | 0.29 | 0.04 | 0.30 M | 0.01 | 0.29 | 0.02 | 0.28 | 0.01 | 0.74 | 0.05 | 0.68 | 0.02 | 0.72 | 0.06 |
| 9 | 0.16 | 0.07 | 0.20 | 0.01 | 0.15 | 0.06 | 0.44 | 0.07 | 0.40 | 0.01 | 0.55 C | 0.09 | 0.27 | 0.01 | 0.27 | 0.01 | 0.26 | 0.01 | 0.87 | 0.04 | 0.86 | 0.01 | 0.96 B,C | 0.04 |
| 10 | 0.12 | 0.21 | 0.93 | 0.70 | 0.46 B | 0.10 | 0.11 | 0.18 | 0.37 B | 0.03 | 0.33 B | 0.02 | 1.01 | 0.72 | 0.31 M | 0.01 | 0.28 | 0.01 | 1.24 | 0.41 | 1.61 | 0.67 | 1.06 | 0.11 |
| 11 | 0.20 | 0.13 | 0.28 M | 0.03 | 0.13 | 0.01 | 0.49 | 0.14 | 0.35 | 0.03 | 0.54 C | 0.03 | 0.32 | 0.03 | 0.33 | 0.00 | 0.33 | 0.01 | 1.01 | 0.06 | 0.96 | 0.02 | 1.00 | 0.03 |
| 12 | 0.26 | 0.14 | 0.12 | 0.21 | 0.19 | 0.02 | 0.31 | 0.01 | 0.11 | 0.18 | 0.33 C | 0.02 | 0.32 | 0.01 | 1.01 | 0.72 | 0.30 | 0.02 | 0.89 | 0.13 | 1.24 | 0.41 | 0.82 | 0.03 |
| 13 | 0.18 | 0.05 | 0.12 | 0.02 | 0.13 | 0.01 | 0.27 | 0.04 | 0.27 | 0.02 | 0.28 | 0.03 | 0.30 | 0.04 | 0.30 | 0.04 | 0.29 | 0.03 | 0.75 M | 0.03 | 0.70 | 0.04 | 0.70 | 0.00 |
| 14 | 0.13 | 0.04 | 0.11 | 0.00 | 0.16 C | 0.03 | 0.40 | 0.20 | 0.31 | 0.01 | 0.43 | 0.18 | 0.28 | 0.01 | 0.29 | 0.00 | 0.28 | 0.03 | 0.81 | 0.24 | 0.72 | 0.00 | 0.88 | 0.16 |
| 15 | 0.29 | 0.01 | 0.32 | 0.06 | 0.25 | 0.05 | 0.51 | 0.02 | 0.51 | 0.02 | 0.48 | 0.05 | 0.29 | 0.02 | 0.31 | 0.03 | 0.32 | 0.04 | 1.09 | 0.03 | 1.13 | 0.05 | 1.05 | 0.13 |
| Group | 0.25 | 0.15 | 0.27 | 0.22 | 0.20 | 0.10 | 0.32 | 0.13 | 0.32 | 0.09 | 0.36 | 0.12 | 0.33 | 0.19 | 0.33 | 0.19 | 0.31 | 0.10 | 0.91 | 0.16 | 0.92 | 0.25 | 0.87 | 0.12 |
| Participant | Biceps Femoris (BF) | Semitendinosus (SEM) | Vastus Lateralis (VL) | Vastus Medialis (VM) | ||||||||||||||||||||
| Barefoot | Conventional | Minimal | Barefoot | Conventional | Minimal | Barefoot | Conventional | Minimal | Barefoot | Conventional | Minimal | |||||||||||||
| Mean | SD | Mean | SD | Mean | SD | Mean | SD | Mean | SD | Mean | SD | Mean | SD | Mean | SD | Mean | SD | Mean | SD | Mean | SD | Mean | SD | |
| 1 | 1.5 | 0.7 | 1.2 | 0.7 | 1.3 | 0.3 | 1.9 | 1.4 | 2.0 | 0.4 | 2.7 | 1.4 | 1.6 | 0.3 | 1.4 | 0.2 | 1.8 | 0.5 | 1.0 | 0.5 | 1.1 | 0.7 | 1.9 | 1.0 |
| 2 | 11.3 M,C | 0.1 | 10.1 | 0.4 | 3.2 | 1.4 | 0.9 | 0.5 | 1.2 | 0.1 | 0.9 | 0.2 | 0.8 | 0.7 | 1.3 | 0.1 | 0.8 | 0.5 | 2.2 | 1.3 | 1.3 | 0.0 | 1.9 | 0.1 |
| 3 | 7.3 | 4.6 | 4.3 | 2.4 | 3.2 | 1.7 | 2.0 M | 0.4 | 1.6 M | 0.5 | 0.9 | 0.2 | 2.6 M,C | 0.8 | 0.8 | 0.6 | 1.5 | 0.3 | 3.0 B,M | 0.4 | 0.7 M | 0.3 | 2.0 | 0.3 |
| 4 | 11.3 M,C | 2.6 | 5.9 | 3.8 | 3.6 | 0.3 | 1.1 | 0.7 | 2.0 B,M | 0.3 | 0.5 | 0.5 | 2.4 | 0.8 | 2.3 | 0.7 | 2.0 | 0.0 | 1.4 M | 0.7 | 1.4 M | 0.1 | 0.5 | 0.1 |
| 5 | 5.7 C | 2.3 | 1.8 | 1.0 | 3.5 | 2.8 | 2.5 M | 0.3 | 3.3 | 1.8 | 1.9 | 0.2 | 1.2 | 0.2 | 1.7 | 0.6 | 0.9 | 0.3 | 1.9 | 0.2 | 2.8 | 1.0 | 2.3 | 0.6 |
| 6 | 3.0 | 1.4 | 6.2 | 4.9 | 3.2 | 2.0 | 2.8 | 0.5 | 3.2 | 0.3 | 2.3 | 0.7 | 2.5 | 0.7 | 1.8 | 1.0 | 1.4 | 0.9 | 0.9 | 0.0 | 1.1 | 1.1 | 1.0 | 0.5 |
| 7 | 3.4 | 2.3 | 2.9 | 1.7 | 3.2 | 0.8 | 1.4 | 0.3 | 1.1 | 0.3 | 1.0 | 0.3 | 1.9 | 0.2 | 2.2 | 0.3 | 2.3 B | 0.2 | 3.1 | 1.0 | 2.9 | 0.9 | 3.2 | 0.2 |
| 8 | 4.3 | 1.5 | 5.2 | 0.8 | 4.7 | 0.8 | 2.5 | 1.4 | 3.1 | 0.4 | 2.5 | 0.9 | 1.4 | 0.4 | 1.0 | 0.2 | 1.1 | 0.3 | 2.1 M,C | 0.6 | 1.1 | 0.3 | 1.1 | 0.4 |
| 9 | 2.6 | 0.9 | 4.9 B | 1.3 | 4.4 | 3.6 | 1.1 | 0.1 | 1.0 | 0.3 | 0.8 | 0.6 | 1.0 | 0.2 | 1.3 | 0.2 | 1.0 | 0.3 | 1.7 C | 0.4 | 1.1 | 0.0 | 1.6 C | 0.4 |
| 10 | 2.4 C | 1.2 | 0.1 | 0.1 | 1.2 C | 0.2 | 1.0 | 0.4 | 1.1 | 0.3 | 1.0 | 0.2 | 1.5 | 1.1 | 1.3 | 0.6 | 1.5 | 0.3 | 0.5 | 0.2 | 0.7 | 0.4 | 0.6 | 0.1 |
| 11 | 2.6 | 0.9 | 3.1 | 0.4 | 3.1 | 0.4 | 1.8 | 0.8 | 1.5 M | 0.1 | 1.0 | 0.4 | 1.8 | 0.3 | 1.5 | 0.1 | 1.4 | 0.3 | 1.2 | 0.3 | 1.5 | 0.6 | 0.8 | 0.2 |
| 12 | 0.3 | 0.3 | 2.4 B,M | 1.2 | 0.2 | 0.1 | 0.5 | 0.3 | 1.0 | 0.4 | 0.9 | 0.4 | 1.1 | 0.7 | 1.5 | 1.1 | 0.6 | 0.2 | 1.1 M,C | 0.2 | 0.5 | 0.2 | 0.6 | 0.1 |
| 13 | 0.5 | 0.0 | 0.4 | 0.2 | 0.5 | 0.2 | 0.8 | 0.1 | 0.7 | 0.2 | 0.7 | 0.3 | 0.8 | 0.3 | 0.5 | 0.2 | 0.5 | 0.1 | 0.9 | 0.2 | 0.8 | 0.1 | 0.8 | 0.1 |
| 14 | 1.1 | 0.5 | 2.4 | 2.0 | 0.8 | 0.4 | 2.7 | 0.7 | 5.2 B | 1.4 | 4.7 | 3.7 | 1.8 M | 0.4 | 3.1 B,M | 0.4 | 1.2 | 0.2 | 1.7 | 0.8 | 3.3 B,M | 0.6 | 2.0 | 1.0 |
| 15 | 0.6 | 0.1 | 0.6 | 0.0 | 0.6 | 0.0 | 0.9 | 0.6 | 0.5 | 0.2 | 0.6 | 0.3 | 2.4 M | 0.1 | 1.8 | 0.7 | 1.6 | 0.4 | 0.5 | 0.1 | 0.5 | 0.2 | 0.5 | 0.3 |
| Group | 3.9 | 3.6 | 3.4 | 2.7 | 2.4 | 1.5 | 1.6 | 0.8 | 1.9 | 1.3 | 1.5 | 1.1 | 1.6 | 0.6 | 1.6 | 0.7 | 1.3 | 0.5 | 1.6 | 0.8 | 1.4 | 0.9 | 1.4 | 0.8 |
| Participant | Medial Gastrocnemius (MG) | Soleus (SOL) | Peroneus Longus (PL) | Tibialis Anterior (TA) | ||||||||||||||||||||
| Barefoot | Conventional | Minimal | Barefoot | Conventional | Minimal | Barefoot | Conventional | Minimal | Barefoot | Conventional | Minimal | |||||||||||||
| Mean | SD | Mean | SD | Mean | SD | Mean | SD | Mean | SD | Mean | SD | Mean | SD | Mean | SD | Mean | SD | Mean | SD | Mean | SD | Mean | SD | |
| 1 | 0.7 | 0.3 | 0.8 | 0.2 | 1.2 | 0.4 | 1.3 | 0.7 | 1.8 | 0.8 | 2.5 | 1.2 | 1.7 | 0.2 | 1.7 | 0.5 | 2.4 | 0.9 | 7.4 | 4.5 | 7.2 | 2.2 | 9.7 | 6.2 |
| 2 | 0.4 | 0.2 | 1.0 | 0.6 | 0.9 B | 0.2 | 0.5 | 0.0 | 0.6 B | 0.0 | 0.6 B | 0.1 | 1.4 | 0.5 | 1.6 | 0.5 | 1.7 | 0.3 | 4.4 | 1.3 | 3.5 | 1.9 | 5.4 | 1.4 |
| 3 | 2.5 M | 1.3 | 1.0 | 1.0 | 0.2 | 0.0 | 2.0 M | 0.4 | 2.2 M | 0.8 | 0.8 | 0.6 | 8.7 M,C | 1.5 | 8.0 | 1.8 | 3.1 | 2.1 | 11.3 | 1.4 | 10.8 | 2.0 | 12.4 | 2.5 |
| 4 | 0.3 | 0.0 | 0.3 | 0.0 | 0.3 | 0.0 | 0.7 | 0.4 | 0.7 M | 0.1 | 0.5 | 0.1 | 1.7 | 1.9 | 2.3 M | 1.3 | 0.5 | 0.6 | 2.2 | 1.8 | 3.5 M | 1.2 | 0.6 | 0.7 |
| 5 | 2.6 C | 1.0 | 1.0 | 0.4 | 1.5 | 0.3 | 3.0 | 1.1 | 2.8 | 1.0 | 1.9 | 0.8 | 11.9 | 3.6 | 16.9 | 4.5 | 12.5 | 2.8 | 8.7 | 3.0 | 17.0 B | 5.9 | 12.4 | 2.9 |
| 6 | 0.6 | 0.1 | 1.1 | 0.6 | 1.1 | 1.0 | 0.6 | 0.3 | 0.8 | 0.4 | 0.7 | 0.1 | 1.3 | 0.5 | 1.5 | 0.5 | 1.2 | 0.7 | 6.3 | 2.1 | 6.2 | 3.3 | 5.7 | 1.9 |
| 7 | 0.7 | 0.4 | 0.7 | 0.3 | 1.0 | 0.4 | 1.5 C | 0.4 | 1.3 | 0.6 | 2.0 C | 0.1 | 1.3 | 0.3 | 1.4 | 0.4 | 1.5 | 0.2 | 3.7 | 0.3 | 4.9 | 2.9 | 2.4 | 2.3 |
| 8 | 0.9 | 0.3 | 1.4 | 0.3 | 1.7 B | 0.2 | 1.7 | 0.6 | 2.0 | 0.4 | 1.7 | 0.4 | 5.2 | 1.4 | 4.9 | 1.2 | 3.9 | 0.5 | 8.3 | 2.9 | 10.2 M | 1.7 | 6.7 | 1.8 |
| 9 | 0.1 | 0.0 | 0.2 | 0.0 | 0.2 B | 0.1 | 0.4 | 0.1 | 0.3 | 0.0 | 0.4 | 0.1 | 1.1 | 0.6 | 1.6 | 1.1 | 0.6 | 0.3 | 1.7 | 0.8 | 2.8 M | 0.7 | 1.5 | 0.5 |
| 10 | 1.4 | 2.0 | 2.0 | 0.5 | 2.9 | 1.8 | 1.2 | 1.6 | 3.0 | 1.6 | 1.5 | 0.4 | 1.1 | 0.8 | 2.7 | 2.9 | 1.1 | 0.3 | 1.9 | 1.5 | 2.4 | 1.6 | 1.3 | 1.0 |
| 11 | 0.3 | 0.1 | 0.3 | 0.1 | 0.3 | 0.1 | 1.4 | 0.1 | 2.0 B | 0.4 | 1.6 | 0.3 | 0.9 | 0.1 | 1.0 | 0.2 | 0.8 | 0.2 | 3.2 | 3.0 | 2.3 | 0.2 | 2.3 | 1.1 |
| 12 | 0.2 | 0.0 | 1.4 | 2.0 | 0.3 | 0.2 | 0.6 | 0.3 | 1.2 | 1.6 | 0.5 | 0.3 | 1.6 | 0.2 | 1.1 | 0.8 | 1.5 | 1.2 | 1.7 | 0.9 | 1.9 | 1.5 | 2.1 | 2.3 |
| 13 | 0.2 | 0.1 | 0.2 | 0.1 | 0.3 | 0.1 | 3.9 | 1.3 | 5.2 | 1.1 | 6.6 B | 1.8 | 3.0 | 0.4 | 2.9 | 0.6 | 3.1 | 0.4 | 13.7 | 4.8 | 13.0 | 3.9 | 13.9 | 3.0 |
| 14 | 0.5 | 0.1 | 0.4 | 0.1 | 0.5 | 0.2 | 1.1 B | 0.1 | 0.8 | 0.2 | 0.9 | 0.3 | 7.0 | 5.0 | 7.8 | 1.7 | 4.3 | 1.9 | 7.9 | 6.5 | 9.2 | 2.7 | 4.6 | 3.4 |
| 15 | 0.2 | 0.1 | 0.8 | 0.6 | 0.5 | 0.3 | 0.5 | 0.1 | 0.4 | 0.3 | 0.4 | 0.2 | 0.9 | 0.3 | 1.1 M | 0.3 | 0.6 | 0.4 | 3.9 | 2.5 | 1.7 | 0.5 | 1.9 | 1.5 |
| Group | 0.8 | 0.8 | 0.8 | 0.5 | 0.9 | 0.7 | 1.3 | 1.0 | 1.7 | 1.3 | 1.5 | 1.6 | 3.2 | 3.4 | 3.8 | 4.3 | 2.6 | 3.0 | 5.8 | 3.7 | 6.5 | 4.7 | 5.5 | 4.5 |
| Participant | Biceps Femoris (BF) | Semitendinosus (SEM) | Vastus Lateralis (VL) | Vastus Medialis (VM) | ||||||||||||||||||||
| Barefoot | Conventional | Minimal | Barefoot | Conventional | Minimal | Barefoot | Conventional | Minimal | Barefoot | Conventional | Minimal | |||||||||||||
| Mean | SD | Mean | SD | Mean | SD | Mean | SD | Mean | SD | Mean | SD | Mean | SD | Mean | SD | Mean | SD | Mean | SD | Mean | SD | Mean | SD | |
| 1 | 2.1 | 1.1 | 1.4 | 1.0 | 1.7 | 0.6 | 12.4 | 4.9 | 14.9 | 1.3 | 15.9 | 2.4 | 8.7 | 1.0 | 10.0 | 1.4 | 9.2 | 2.0 | 13.5 | 3.4 | 10.6 | 1.7 | 14.9 C | 2.3 |
| 2 | 12.5 M | 1.8 | 11.1 | 1.1 | 4.4 | 1.8 | 5.0 | 1.3 | 5.5 | 0.9 | 6.9 | 1.8 | 1.1 | 0.9 | 2.4 B,M | 0.4 | 1.8 | 0.8 | 8.2 M,C | 3.9 | 6.7 | 1.0 | 6.8 | 0.0 |
| 3 | 9.7 | 5.7 | 5.0 | 2.4 | 3.4 | 1.7 | 14.0 M,C | 1.3 | 4.8 | 2.1 | 3.4 | 2.6 | 11.5 M | 1.9 | 7.2 | 4.9 | 4.0 | 0.9 | 10.8 | 3.3 | 3.9 | 1.0 | 3.9 | 1.0 |
| 4 | 12.4 M,C | 3.2 | 5.8 | 4.1 | 5.1 | 0.0 | 4.4 | 0.7 | 10.0 B,M | 0.9 | 6.0 B | 0.0 | 6.5 | 0.7 | 7.1 | 2.3 | 8.9 B | 0.0 | 8.3 | 3.1 | 9.9 M | 1.2 | 6.3 | 0.0 |
| 5 | 8.9 | 4.7 | 3.4 | 1.4 | 4.8 | 3.9 | 15.4 | 2.0 | 10.9 | 3.3 | 13.3 | 2.9 | 14.8 M,C | 3.4 | 9.0 | 3.1 | 9.3 | 3.0 | 17.1 C | 1.4 | 12.2 | 0.9 | 16.5 C | 1.1 |
| 6 | 5.7 | 1.2 | 9.3 | 4.5 | 6.1 | 4.4 | 10.1 | 4.2 | 8.1 | 2.6 | 7.1 | 1.5 | 13.8 | 2.6 | 11.1 | 1.4 | 12.4 | 3.2 | 11.1 | 2.0 | 14.5 | 3.1 | 16.4 | 4.5 |
| 7 | 3.8 | 2.4 | 3.5 | 2.5 | 3.2 | 0.9 | 7.9 M | 1.4 | 6.8 | 1.3 | 5.5 | 1.6 | 8.4 | 2.6 | 8.9 | 1.4 | 9.1 | 1.8 | 10.6 | 4.4 | 8.7 | 3.9 | 8.1 | 0.6 |
| 8 | 5.3 | 2.2 | 7.3 | 2.1 | 6.0 | 0.8 | 9.2 M | 2.1 | 10.4 M | 3.4 | 3.1 | 0.3 | 9.6 | 2.3 | 9.5 | 1.8 | 9.1 | 3.9 | 10.3 | 3.3 | 12.4 | 5.2 | 7.2 | 1.7 |
| 9 | 2.9 | 0.9 | 6.0 B | 1.2 | 4.6 | 3.5 | 6.5 | 1.2 | 7.8 M | 1.3 | 4.5 | 1.6 | 6.3 | 1.5 | 8.5 B,M | 0.6 | 6.2 | 1.0 | 7.7 | 2.9 | 7.7 | 1.9 | 6.9 | 1.0 |
| 10 | 3.3 M,C | 0.0 | 0.3 | 0.2 | 1.5 C | 0.2 | 11.7 | 0.0 | 11.8 | 2.8 | 10.9 | 1.9 | 8.9 | 0.0 | 7.5 | 1.8 | 10.6 | 2.4 | 9.3 | 0.0 | 8.9 | 3.3 | 7.6 | 1.7 |
| 11 | 2.8 | 1.0 | 3.5 | 0.6 | 3.5 | 0.7 | 11.8 | 5.9 | 11.0 M | 1.7 | 7.6 | 1.3 | 8.1 | 2.3 | 7.6 | 0.4 | 6.4 | 2.4 | 7.9 | 3.2 | 10.0 M | 1.1 | 5.9 | 0.9 |
| 12 | 2.1 | 0.4 | 3.3 B,M | 0.0 | 2.8 B | 0.3 | 5.1 | 0.2 | 11.7 B,M | 0.0 | 5.8 | 1.6 | 6.9 | 1.5 | 8.9 B | 0.0 | 6.9 | 2.1 | 11.7 M | 2.5 | 9.3 M | 0.0 | 7.3 | 0.4 |
| 13 | 2.8 | 1.3 | 2.5 | 1.1 | 4.1 | 1.3 | 4.4 | 2.0 | 5.3 | 1.2 | 6.7 | 0.6 | 3.8 | 0.6 | 4.4 | 1.8 | 4.6 B | 0.1 | 4.5 | 1.6 | 5.9 | 3.9 | 6.2 | 0.5 |
| 14 | 7.2 | 4.0 | 5.6 | 2.0 | 4.2 | 1.1 | 5.8 | 1.6 | 5.2 | 1.1 | 6.0 | 0.6 | 10.7 | 4.4 | 13.1 M | 1.9 | 7.7 | 2.1 | 9.7 | 4.5 | 10.5 | 2.8 | 9.3 | 3.1 |
| 15 | 2.6 | 0.7 | 2.3 | 0.3 | 2.4 | 0.5 | 5.3 | 1.8 | 3.9 | 1.7 | 4.8 | 1.1 | 10.9 M,C | 0.9 | 8.1 | 1.5 | 6.9 | 1.8 | 8.3 M,C | 0.8 | 7.0 | 0.8 | 7.1 | 0.1 |
| Group | 5.6 | 3.7 | 4.7 | 2.9 | 3.8 | 1.4 | 8.6 | 3.7 | 8.5 | 3.2 | 7.2 | 3.6 | 8.7 | 3.5 | 8.2 | 2.5 | 7.6 | 2.7 | 9.9 | 2.9 | 9.2 | 2.7 | 8.7 | 3.9 |
| Participant | Medial Gastrocnemius (MG) | Soleus (SOL) | Peroneus Longus (PL) | Tibialis Anterior (TA) | ||||||||||||||||||||
| Barefoot | Conventional | Minimal | Barefoot | Conventional | Minimal | Barefoot | Conventional | Minimal | Barefoot | Conventional | Minimal | |||||||||||||
| Mean | SD | Mean | SD | Mean | SD | Mean | SD | Mean | SD | Mean | SD | Mean | SD | Mean | SD | Mean | SD | Mean | SD | Mean | SD | Mean | SD | |
| 1 | 7.3 | 2.9 | 6.7 | 1.5 | 10.0 | 4.8 | 8.9 | 5.2 | 11.4 | 3.8 | 9.6 | 5.8 | 12.3 M,C | 5.1 | 11.5 M | 2.6 | 9.0 | 5.3 | 6.8 | 3.5 | 9.1 | 1.8 | 11.2 | 2.6 |
| 2 | 2.0 | 0.5 | 2.2 | 0.8 | 2.7 | 0.2 | 1.8 | 1.3 | 1.5 | 0.1 | 3.4 | 0.1 | 2.4 | 0.6 | 3.3 | 0.2 | 3.8 | 0.3 | 10.0 | 1.8 | 8.2 | 0.9 | 10.3 | 0.2 |
| 3 | 24.1 M,C | 5.9 | 9.1 | 7.5 | 2.5 | 3.1 | 16.4 | 2.8 | 10.1 | 9.7 | 3.2 | 2.4 | 9.0 M | 5.3 | 6.1 M | 2.2 | 2.6 | 0.8 | 2.5 | 1.1 | 7.6 | 5.2 | 9.8 B | 2.7 |
| 4 | 8.4 | 4.1 | 9.7 M | 1.6 | 7.9 | 0.0 | 7.6 | 4.5 | 9.4 M | 0.3 | 6.0 | 0.0 | 10.3 M | 1.4 | 12.9 B,M | 0.9 | 6.9 | 0.0 | 12.1 M | 3.0 | 10.5 M | 0.1 | 8.3 | 0.0 |
| 5 | 3.4 C | 0.4 | 2.3 | 0.6 | 2.7 | 0.7 | 6.6 | 0.7 | 5.8 | 1.0 | 6.2 | 2.3 | 11.0 | 2.6 | 13.9 | 4.1 | 13.0 | 1.1 | 6.4 | 1.6 | 11.7 B | 2.3 | 11.0 B | 1.1 |
| 6 | 8.0 | 1.3 | 5.9 | 3.5 | 8.0 | 0.8 | 8.0 M | 2.0 | 5.7 | 1.5 | 11.7 C | 1.7 | 5.3 | 1.3 | 6.7 | 2.1 | 9.5 B | 2.2 | 10.6 M | 1.0 | 9.0 | 3.4 | 7.0 | 1.5 |
| 7 | 4.3 | 2.4 | 4.3 | 1.5 | 3.0 | 0.6 | 5.9 M | 0.9 | 6.4 | 3.0 | 4.2 | 0.9 | 5.2 | 1.7 | 6.0 | 1.6 | 4.4 | 1.2 | 14.4 M | 3.6 | 10.5 | 1.9 | 7.8 | 2.0 |
| 8 | 4.0 | 1.3 | 4.8 | 1.3 | 3.7 | 0.4 | 6.5 | 1.5 | 9.7 | 4.1 | 7.5 | 2.1 | 12.5 | 1.2 | 12.3 | 0.8 | 10.9 | 2.6 | 10.7 | 2.8 | 13.3 M | 1.9 | 10.4 | 1.3 |
| 9 | 2.7 | 0.4 | 2.0 | 0.5 | 2.3 | 0.8 | 3.3 | 0.6 | 1.9 B | 0.5 | 2.5 | 0.8 | 3.1 | 0.7 | 4.2 | 1.6 | 3.1 | 0.5 | 5.6 | 2.0 | 8.3 B | 0.9 | 8.0 | 2.4 |
| 10 | 4.4 | 0.0 | 4.2 | 0.6 | 3.7 | 2.6 | 3.8 | 0.0 | 6.7 | 3.0 | 6.5 B | 1.8 | 5.8 | 0.0 | 7.1 | 2.8 | 7.2 | 2.3 | 11.7 C | 0.0 | 10.0 | 0.1 | 9.6 | 2.4 |
| 11 | 1.5 | 1.1 | 0.9 | 0.3 | 0.9 | 0.2 | 3.4 | 0.2 | 4.0 | 0.9 | 4.1 B | 0.5 | 3.7 | 1.4 | 3.4 | 0.8 | 2.6 | 1.2 | 7.8 | 2.0 | 8.3 | 1.1 | 9.2 | 3.6 |
| 12 | 2.1 | 0.5 | 4.4 B,M | 0.0 | 2.8 | 0.4 | 5.9 | 2.1 | 3.8 | 0.0 | 6.2 C | 1.4 | 6.8 C | 0.7 | 5.8 | 0.0 | 11.3 B,C | 1.1 | 5.8 | 3.3 | 11.7 B | 0.0 | 10.8 | 3.9 |
| 13 | 1.9 | 1.6 | 0.9 | 1.1 | 1.7 | 1.6 | 4.0 | 0.3 | 4.5 | 1.1 | 5.2 | 0.9 | 4.1 | 1.5 | 4.4 | 0.6 | 3.9 | 1.5 | 11.3 | 1.9 | 12.0 | 1.0 | 13.2 | 1.3 |
| 14 | 8.1 | 3.9 | 5.6 | 2.4 | 6.8 | 0.2 | 8.8 | 3.4 | 6.3 | 2.0 | 8.8 | 1.6 | 10.6 | 1.3 | 12.8 B | 1.1 | 10.6 | 1.8 | 13.1 | 5.7 | 11.5 | 2.8 | 10.9 | 2.4 |
| 15 | 1.1 | 0.4 | 0.7 | 0.2 | 0.6 | 0.4 | 4.0 M | 0.6 | 3.4 | 1.3 | 3.3 | 2.5 | 6.2 | 1.9 | 7.8 | 1.8 | 5.3 | 1.4 | 8.8 | 2.8 | 9.5 | 1.4 | 10.2 | 1.3 |
| Group | 5.6 | 5.7 | 4.2 | 2.8 | 3.9 | 2.8 | 6.3 | 3.5 | 6.0 | 3.0 | 5.9 | 2.6 | 7.2 | 3.4 | 7.9 | 3.8 | 6.9 | 3.5 | 9.2 | 3.3 | 10.1 | 1.7 | 9.8 | 1.6 |
| Participant | Biceps Femoris (BF) | Semitendinosus (SEM) | Vastus Lateralis (VL) | Vastus Medialis (VM) | ||||||||||||||||||||
| Barefoot | Conventional | Minimal | Barefoot | Conventional | Minimal | Barefoot | Conventional | Minimal | Barefoot | Conventional | Minimal | |||||||||||||
| Mean | SD | Mean | SD | Mean | SD | Mean | SD | Mean | SD | Mean | SD | Mean | SD | Mean | SD | Mean | SD | Mean | SD | Mean | SD | Mean | SD | |
| 1 | 3.4 | 0.2 | 3.6 | 1.7 | 3.7 | 1.4 | 11.1 | 3.8 | 14.1 | 2.1 | 18.1 B | 4.6 | 18.4 | 4.6 | 21.6 M | 1.4 | 13.4 | 3.4 | 16.3 | 2.8 | 19.4 | 3.7 | 17.0 | 4.8 |
| 2 | 16.0 M | 2.6 | 14.1 M | 1.9 | 5.0 | 2.2 | 10.4 | 0.1 | 15.9 B | 0.8 | 16.4 B,C | 3.0 | 2.2 | 1.7 | 3.8 | 0.6 | 2.6 | 1.6 | 19.3 | 2.6 | 16.1 | 4.3 | 17.1 | 0.9 |
| 3 | 15.1 M,C | 2.3 | 7.7 | 2.7 | 5.0 | 1.5 | 8.7 C | 0.1 | 6.1 | 1.2 | 10.0 C | 1.9 | 21.1 | 3.2 | 17.2 | 5.9 | 18.1 | 4.7 | 17.5 | 3.1 | 12.1 | 4.9 | 15.2 | 5.4 |
| 4 | 14.0 M,C | 3.3 | 6.8 | 4.3 | 8.2 | 2.0 | 7.0 | 2.2 | 11.1 B,M | 0.5 | 7.5 | 0.4 | 19.5 | 1.3 | 20.3 | 2.2 | 15.6 | 10.7 | 18.4 | 4.9 | 18.5 M | 0.0 | 10.5 | 6.6 |
| 5 | 8.4 C | 4.0 | 2.8 | 0.9 | 4.6 | 3.2 | 12.2 | 1.3 | 10.2 | 2.5 | 11.2 | 3.6 | 15.2 C | 0.7 | 12.1 | 1.4 | 12.6 | 2.3 | 15.3 | 2.1 | 14.1 | 1.5 | 16.3 C | 0.8 |
| 6 | 5.4 | 2.2 | 9.3 | 7.6 | 4.2 | 2.0 | 10.9 | 1.0 | 14.1 | 3.9 | 11.2 | 2.7 | 18.3 | 2.9 | 17.6 | 4.5 | 17.5 | 2.6 | 15.3 | 0.6 | 20.5 | 3.0 | 18.9 | 7.8 |
| 7 | 5.0 | 2.5 | 4.2 | 3.0 | 3.9 | 0.8 | 13.6 | 2.9 | 14.0 | 1.0 | 11.7 | 5.0 | 16.9 | 4.0 | 15.6 | 1.3 | 18.3 | 3.4 | 15.7 | 5.6 | 14.9 | 4.5 | 14.8 | 1.2 |
| 8 | 5.1 | 2.0 | 7.1 | 1.6 | 5.4 | 0.7 | 14.4 M | 3.1 | 12.6 M | 0.6 | 6.0 | 1.1 | 19.9 | 0.7 | 20.3 | 0.6 | 19.1 | 4.6 | 18.8 M | 2.0 | 21.9 M | 6.0 | 14.6 | 1.9 |
| 9 | 3.5 | 1.0 | 7.1 B | 1.9 | 5.9 | 4.4 | 12.0 | 3.1 | 11.7 | 2.1 | 9.6 | 2.1 | 14.9 | 3.0 | 17.5 | 0.3 | 16.4 | 3.1 | 15.4 | 4.1 | 13.5 | 2.1 | 14.7 | 2.0 |
| 10 | 3.7 M,C | 0.9 | 1.1 | 0.7 | 1.9 | 0.3 | 12.6 | 7.6 | 19.8 | 3.3 | 21.7 | 2.6 | 12.1 | 7.5 | 16.7 | 3.2 | 18.1 | 0.7 | 8.7 | 4.9 | 16.6 B | 4.3 | 14.2 | 1.6 |
| 11 | 2.9 | 1.0 | 3.6 | 0.8 | 4.3 B | 0.7 | 21.4 | 2.6 | 18.6 | 1.6 | 20.3 | 2.1 | 20.0 | 2.1 | 20.5 | 1.9 | 20.0 | 5.4 | 19.4 | 0.5 | 20.1 | 2.4 | 18.8 | 1.0 |
| 12 | 4.9 | 1.7 | 3.7 | 0.9 | 4.6 | 0.8 | 4.8 | 0.8 | 12.6 | 7.6 | 6.1 | 1.6 | 14.0 | 4.1 | 12.1 | 7.5 | 12.3 | 4.1 | 17.7 C | 5.3 | 8.7 | 4.9 | 14.1 | 1.3 |
| 13 | 10.8 M,C | 1.8 | 6.3 | 0.1 | 6.8 | 1.3 | 10.8 | 2.0 | 8.8 | 0.9 | 9.6 | 1.9 | 15.4 | 0.1 | 15.2 | 2.0 | 15.4 | 5.0 | 19.7 | 4.2 | 17.1 | 7.1 | 17.4 | 3.6 |
| 14 | 11.4 | 2.1 | 13.7 | 6.0 | 10.2 | 3.7 | 7.2 | 1.8 | 8.3 | 1.9 | 10.1 | 2.5 | 17.1 | 3.6 | 21.6 M | 2.2 | 15.3 | 2.0 | 13.7 | 1.4 | 19.1 B | 3.3 | 19.1 B | 2.8 |
| 15 | 9.5 | 0.8 | 9.6 | 2.1 | 10.2 | 1.2 | 3.6 | 1.5 | 4.3 | 1.5 | 5.0 | 0.9 | 22.4 M | 2.5 | 16.6 | 4.3 | 15.9 | 2.7 | 16.2 | 2.5 | 16.2 | 3.6 | 15.9 | 0.5 |
| Group | 7.9 | 4.6 | 6.7 | 3.8 | 5.6 | 2.4 | 10.7 | 4.3 | 12.1 | 4.3 | 11.6 | 5.2 | 16.5 | 4.9 | 16.6 | 4.7 | 15.4 | 4.2 | 16.5 | 2.8 | 16.6 | 3.5 | 15.9 | 2.3 |
| Participant | Medial Gastrocnemius (MG) | Soleus (SOL) | Peroneus Longus (PL) | Tibialis Anterior (TA) | ||||||||||||||||||||
| Barefoot | Conventional | Minimal | Barefoot | Conventional | Minimal | Barefoot | Conventional | Minimal | Barefoot | Conventional | Minimal | |||||||||||||
| Mean | SD | Mean | SD | Mean | SD | Mean | SD | Mean | SD | Mean | SD | Mean | SD | Mean | SD | Mean | SD | Mean | SD | Mean | SD | Mean | SD | |
| 1 | 13.3 | 2.8 | 16.7 | 1.0 | 19.9 B,C | 1.9 | 14.2 | 3.6 | 15.0 | 3.6 | 14.9 | 4.9 | 16.1 | 0.5 | 18.9 | 4.4 | 17.9 | 4.2 | 1.8 | 0.3 | 1.9 | 0.2 | 3.0 B,C | 0.2 |
| 2 | 15.9 M | 1.6 | 16.3 M | 0.0 | 9.4 | 0.1 | 17.1 C | 0.8 | 14.0 | 0.4 | 19.1 B,C | 0.4 | 15.8 | 0.1 | 18.8 B,M | 1.9 | 17.7 | 3.0 | 9.0 | 2.7 | 7.3 | 0.9 | 9.0 | 0.8 |
| 3 | 16.8 C | 3.2 | 12.0 | 2.5 | 13.9 | 1.8 | 16.8 | 2.6 | 17.0 | 4.8 | 14.3 | 10.2 | 20.1 M | 2.4 | 15.6 M | 4.0 | 7.5 | 3.8 | 1.4 | 0.3 | 1.3 | 0.2 | 2.7 | 1.7 |
| 4 | 15.8 | 1.4 | 13.3 | 2.7 | 9.8 | 5.9 | 14.5 M | 1.7 | 15.9 M | 0.0 | 8.7 | 2.0 | 20.3 M | 0.9 | 17.7 M | 3.2 | 11.9 | 3.9 | 6.6 M | 1.0 | 5.7 M | 1.0 | 4.5 | 0.5 |
| 5 | 12.9 | 3.6 | 14.3 | 3.5 | 14.2 | 1.4 | 10.1 | 4.2 | 10.8 | 2.0 | 12.0 | 5.5 | 13.9 | 1.5 | 11.9 | 1.9 | 14.8 | 1.7 | 5.2 | 0.7 | 5.9 | 1.2 | 6.8 B | 1.1 |
| 6 | 14.9 | 1.5 | 15.6 | 1.3 | 12.8 | 2.9 | 17.2 | 1.0 | 15.2 | 3.7 | 19.7 | 2.3 | 17.4 | 1.6 | 17.6 | 1.9 | 18.6 | 3.9 | 4.6 | 2.4 | 3.4 | 2.4 | 4.8 | 1.4 |
| 7 | 16.6 | 7.1 | 13.6 | 2.4 | 16.5 | 1.9 | 16.8 | 2.4 | 15.8 | 3.0 | 16.1 | 1.6 | 17.6 | 2.4 | 16.7 | 1.1 | 16.1 | 4.6 | 4.7 | 0.1 | 5.9 | 1.5 | 4.6 | 1.3 |
| 8 | 14.5 | 0.7 | 19.0 | 4.1 | 14.9 | 1.3 | 15.3 | 1.2 | 17.7 | 1.9 | 14.6 | 1.9 | 17.9 M | 2.5 | 14.7 | 3.9 | 14.2 | 1.3 | 5.3 | 2.3 | 5.4 | 0.8 | 5.1 | 1.0 |
| 9 | 14.7 | 4.6 | 18.8 | 2.6 | 16.0 | 4.5 | 17.4 | 3.4 | 18.0 | 2.1 | 20.1 | 2.1 | 15.9 | 1.6 | 19.3 M | 3.1 | 14.3 | 1.6 | 6.8 | 0.9 | 7.2 | 1.5 | 7.5 | 2.6 |
| 10 | 9.1 | 5.5 | 15.3 | 2.7 | 14.7 | 4.5 | 9.5 | 5.2 | 17.9 B,M | 0.9 | 14.6 | 0.6 | 9.1 | 5.9 | 16.0 | 3.4 | 16.7 | 2.8 | 3.5 | 1.3 | 3.2 | 1.7 | 2.1 | 0.6 |
| 11 | 15.7 | 2.4 | 15.0 | 2.1 | 17.9 | 1.3 | 16.1 | 0.5 | 18.7 B | 1.8 | 20.0 B | 0.4 | 19.7 | 1.8 | 18.2 | 1.8 | 18.5 | 5.1 | 2.6 | 0.9 | 2.9 | 1.0 | 3.3 | 0.3 |
| 12 | 14.2 | 4.0 | 9.1 | 5.5 | 15.8 | 5.3 | 17.0 | 5.1 | 9.5 | 5.2 | 16.4 C | 1.2 | 10.7 | 2.4 | 9.1 | 5.9 | 13.5 | 0.8 | 3.4 | 1.6 | 3.5 | 1.3 | 4.6 | 0.3 |
| 13 | 15.3 C | 1.7 | 11.0 | 1.9 | 13.6 | 2.9 | 15.9 | 1.0 | 18.0 | 4.5 | 22.9 B | 0.5 | 15.0 | 1.7 | 15.5 | 0.5 | 16.0 | 4.0 | 4.0 | 2.1 | 5.5 | 1.3 | 4.0 | 1.4 |
| 14 | 13.4 | 1.4 | 17.4 | 3.5 | 15.5 B | 0.8 | 13.0 | 1.5 | 15.0 | 3.6 | 15.8 | 2.6 | 4.9 | 1.3 | 5.8 | 0.9 | 6.1 | 2.1 | 4.4 | 1.0 | 4.8 | 1.3 | 3.7 | 0.3 |
| 15 | 13.1 M | 1.6 | 10.4 | 2.5 | 9.5 | 0.4 | 13.9 | 3.2 | 10.3 | 5.2 | 13.9 | 2.8 | 18.9 | 1.0 | 17.9 | 1.5 | 16.3 | 4.6 | 4.3 | 1.8 | 5.4 | 1.4 | 3.9 | 2.2 |
| Group | 14.4 | 1.9 | 14.5 | 3.0 | 14.3 | 3.0 | 15.0 | 2.5 | 15.3 | 3.0 | 16.2 | 3.6 | 15.6 | 4.4 | 15.6 | 3.9 | 14.7 | 3.7 | 4.5 | 2.0 | 4.6 | 1.8 | 4.6 | 1.9 |
References
- Rixe, J.A.; Gallo, R.A.; Silvis, M.L. The Barefoot Debate: Can Minimalist Shoes Reduce Running-Related Injuries? Curr. Sports Med. Rep. 2012, 11, 160–165. [Google Scholar] [CrossRef]
- Rothschild, C. Running Barefoot or in Minimalist Shoes: Evidence or Conjecture? Strength Cond. J. 2012, 34, 8–17. [Google Scholar] [CrossRef]
- Bowles, C.; Ambegaonkar, J.P.; Cortes, N.; Caswell, S.; Mokha, M. Footwear for Distance Runners: The Minimalism Trend. Int. J. Athl. Ther. Train. 2012, 17, 14–18. [Google Scholar] [CrossRef]
- Braunstein, B.; Arampatzis, A.; Eysel, P.; Brüggemann, G.-P. Footwear affects the gearing at the ankle and knee joints during running. J. Biomech. 2010, 43, 2120–2125. [Google Scholar] [CrossRef] [PubMed]
- Paquette, M.R.; Zhang, S.; Baumgartner, L.D. Acute effects of barefoot, minimal shoes, and running shoes on lower limb mechanics in rear and forefoot strike runners. Footwear Sci. 2013, 5, 9–18. [Google Scholar] [CrossRef]
- McCallion, C.; Donne, B.; Fleming, N.; Blanksby, B. Acute Differences in Foot Strike and Spatiotemporal Variables for Shod, Barefoot or Minimalist Male Runners. J. Sports Sci. Med. 2014, 13, 280. [Google Scholar]
- Sinclair, J. Effects of barefoot and barefoot inspired footwear on knee and ankle loading during running. Clin. Biomech. 2014, 29, 395–399. [Google Scholar] [CrossRef]
- Squadrone, R.; Gallozzi, C. Biomechanical and physiological comparison of barefoot and two shod conditions in experienced barefoot runners. J. Sports Med. Phys. Fit. 2009, 49, 6–13. [Google Scholar]
- LaPorta, J.W.; Brown, L.E.; Coburn, J.W.; Galpin, A.J.; Tufano, J.J.; Cazas, V.L.; Tan, J.G. Effects of different footwear on vertical jump and landing parameters. J. Strength Cond. Res. 2013, 27, 733–737. [Google Scholar] [CrossRef]
- Zech, A.; Argubi-Wollesen, A.; Rahlf, A.-L. Minimalist, standard and no footwear on static and dynamic postural stability following jump landing. Eur. J. Sport Sci. 2015, 15, 279–285. [Google Scholar] [CrossRef]
- Sinclair, J.; Hobbs, S.J.; Selfe, J. The influence of minimalist footwear on knee and ankle load during depth jumping. Res. Sports Med. 2015, 23, 289–301. [Google Scholar] [CrossRef] [Green Version]
- Shultz, S.J.; Schmitz, R.J.; Tritsch, A.J.; Montgomery, M.M. Methodological considerations of task and shoe wear on joint energetics during landing. J. Electromyogr. Kinesiol. 2012, 22, 124–130. [Google Scholar] [CrossRef] [PubMed] [Green Version]
- Hall, J.P.L.; Barton, C.J.; Jones, P.R.; Morrissey, D. The Biomechanical Differences Between Barefoot and Shod Distance Running: A Systematic Review and Preliminary Meta-Analysis. Sports Med. 2013, 43, 1335–1353. [Google Scholar] [CrossRef] [PubMed]
- Kerrigan, D.C.; Franz, J.R.; Keenan, G.S.; Dicharry, J.; Della Croce, U.; Wilder, R.P. The effect of running shoes on lower extremity joint torques. PM R J. Inj. Funct. Rehabil. 2009, 1, 1058–1063. [Google Scholar] [CrossRef] [PubMed]
- Bonacci, J.; Vicenzino, B.; Spratford, W.; Collins, P. Take your shoes off to reduce patellofemoral joint stress during running. Br. J. Sports Med. 2014, 48, 425–428. [Google Scholar] [CrossRef]
- Mcgee, K.J.; Burkett, L.N. The National Football League combine: A reliable predictor of draft status? J. Strength Cond. Res. 2003, 17, 6–11. [Google Scholar] [CrossRef]
- Harry, J.R.; Paquette, M.R.; Caia, J.; Townsend, R.J.; Weiss, L.W.; Schilling, B.K. Effects of footwear condition on maximal jumping performance. J. Strength Cond. Res. 2015, 29, 1657–1665. [Google Scholar] [CrossRef]
- Smith, R.E.; Paquette, M.R.; Harry, J.R.; Powell, D.; Weiss, L.W. Footwear and sex differences in performance and joint kinetics during maximal vertical jumping. J. Strength Cond. Res. 2020, 34, 1634–1642. [Google Scholar] [CrossRef]
- Chowning, L.D.; Krzyszkowski, J.; Harry, J.R. Maximalist shoes do not alter performance or joint mechanical output during the countermovement jump. J. Sports Sci. 2020, in press. [Google Scholar] [CrossRef]
- Esculier, J.-F.; Dubois, B.; Dionne, C.E.; Leblond, J.; Roy, J.-S. A consensus definition and rating scale for minimalist shoes. J. Foot Ankle Res. 2015, 8, 42. [Google Scholar] [CrossRef] [Green Version]
- Lake, J.; McMahon, J. Within-subject consistency of unimodal and bimodal force application during the countermovement jump. Sports 2018, 6, 143. [Google Scholar] [CrossRef] [PubMed] [Green Version]
- Bates, B.T. Scientific basis of human movement. J. Phys. Educ. Recreat. 1977, 48, 70. [Google Scholar] [CrossRef]
- Higgins, S. Movement as an emergent form: Its structural limits. Hum. Mov. Sci. 1985, 4, 119–148. [Google Scholar] [CrossRef]
- Bates, B.T.; Dufek, J.S.; James, C.R.; Harry, J.R.; Eggleston, J.D. The Influence of Experimental Design on the Detection of Performance Differences. Meas. Phys. Educ. Exerc. Sci. 2016, 20, 200–207. [Google Scholar] [CrossRef]
- Bates, B.T. Single-subject methodology: An alternative approach. Med. Sci. Sports Exerc. 1996, 28, 631–638. [Google Scholar] [PubMed]
- Bates, B.T.; James, C.R.; Dufek, J.S. Single subject analysis. In Innovative Analyses of Human Movement; Stergiou, N., Ed.; Human Kinetics: Champaign, IL, USA, 2004; pp. 3–28. [Google Scholar]
- Hermens, H.J.; Freriks, B.; Merletti, R.; Stegeman, D.; Blok, J.; Rau, G.; Disselhorst-Klug, C.; Hägg, G. SENIAM 8 European Recommendations for Surface ElectroMyoGraphy. Roessingh Res. Dev. 1999, 8, 13–54. [Google Scholar]
- Harry, J.R.; Blinch, J.; Barker, L.A.; Krzyszkowski, J.; Chowning, L. Low pass filter effects on metrics of countermovement vertical jump performance. J. Strength Cond. Res. 2020, in press. [Google Scholar] [CrossRef]
- Chappell, J.D.; Creighton, R.A.; Giuliani, C.; Yu, B.; Garrett, W.E. Kinematics and electromyography of landing preparation in vertical stop-jump: Risks for noncontact anterior cruciate ligament injury. Am. J. Sports Med. 2007, 35, 235–241. [Google Scholar] [CrossRef]
- Harry, J.R.; Barker, L.A.; Paquette, M.R. A Joint Power Approach to Identify Countermovement Jump Phases Using Force Platforms. Med. Sci. Sports Exerc. 2020, 52, 993–1000. [Google Scholar] [CrossRef]
- Dowling, J.J.; Vamos, L. Identification of kinetic and temporal factors related to vertical jump performance. J. Appl. Biomech. 1993, 9, 95–110. [Google Scholar] [CrossRef] [Green Version]
- Moir, G.L. Three different methods of calculating vertical jump height from force platform data in men and women. Meas. Phys. Educ. Exerc. Sci. 2008, 12, 207–218. [Google Scholar] [CrossRef]
- Harry, J.R.; Eggleston, J.D.; Lidstone, D.E.; Dufek, J.S. Weighted vest use to improve movement control during walking in children with autism. Transl. J. Am. Coll. Sports Med. 2019, 4, 64–73. [Google Scholar]
- Bates, B.T.; Dufek, J.S.; Davis, H.P. The effect of trial size on statistical power. Med. Sci. Sports Exerc. 1992, 24, 1059–1065. [Google Scholar] [CrossRef] [PubMed]
- Dufek, J.S.; Bates, B.T.; Stergiou, N.; James, C. Interactive effects between group and single-subject response patterns. Hum. Mov. Sci. 1995, 14, 301–323. [Google Scholar] [CrossRef]
- Harry, J.R.; Eggleston, J.D.; Dunnick, D.D.; Edwards, H.; Dufek, J.S. Effects of Task Difficulty on Kinematics and Task Performance during Walking Workstation Use. Transl. J. Am. Coll. Sports Med. 2018, 3, 74–84. [Google Scholar]
- Bates, B.T.; Osternig, L.R.; Mason, B.R. Variations of velocity within the support phase of running. Sci. Athl. 1979, 20, l985. [Google Scholar]
- Scholes, C.J.; McDonald, M.D.; Parker, A.W. Single-subject analysis reveals variation in knee mechanics during step landing. J. Biomech. 2012, 45, 2074–2078. [Google Scholar] [CrossRef]

Publisher’s Note: MDPI stays neutral with regard to jurisdictional claims in published maps and institutional affiliations. |
© 2020 by the authors. Licensee MDPI, Basel, Switzerland. This article is an open access article distributed under the terms and conditions of the Creative Commons Attribution (CC BY) license (http://creativecommons.org/licenses/by/4.0/).
Share and Cite
Harry, J.R.; Eggleston, J.D.; Dufek, J.S.; James, C.R. Single-Subject Analyses Reveal Altered Performance and Muscle Activation during Vertical Jumping. Biomechanics 2021, 1, 15-28. https://0-doi-org.brum.beds.ac.uk/10.3390/biomechanics1010002
Harry JR, Eggleston JD, Dufek JS, James CR. Single-Subject Analyses Reveal Altered Performance and Muscle Activation during Vertical Jumping. Biomechanics. 2021; 1(1):15-28. https://0-doi-org.brum.beds.ac.uk/10.3390/biomechanics1010002
Chicago/Turabian StyleHarry, John R., Jeffrey D. Eggleston, Janet S. Dufek, and C. Roger James. 2021. "Single-Subject Analyses Reveal Altered Performance and Muscle Activation during Vertical Jumping" Biomechanics 1, no. 1: 15-28. https://0-doi-org.brum.beds.ac.uk/10.3390/biomechanics1010002